
#pltr
pltr
89,104 views
1,109 Discussing
Hot
Latest

·
--
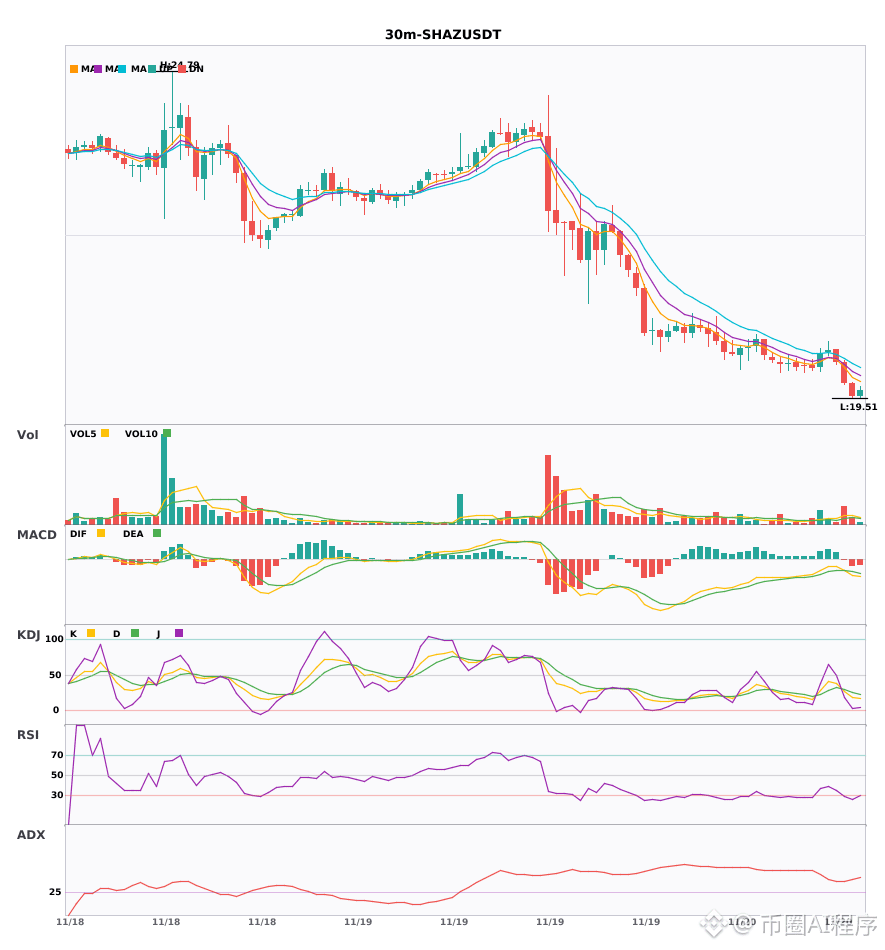
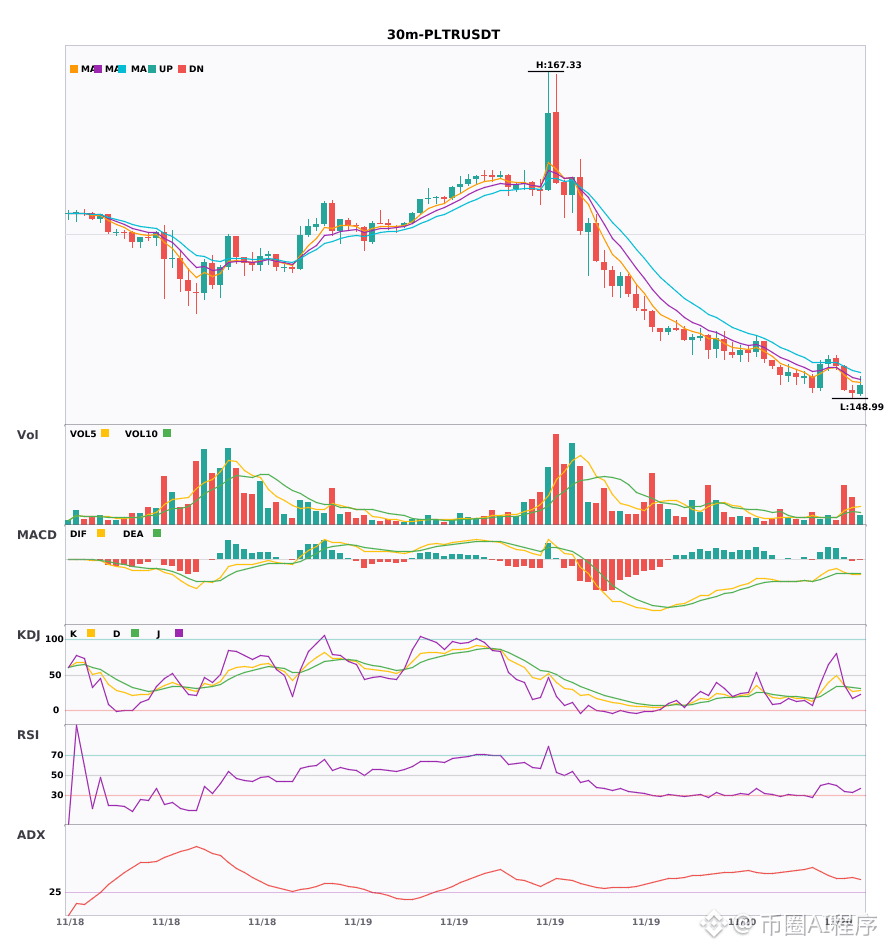
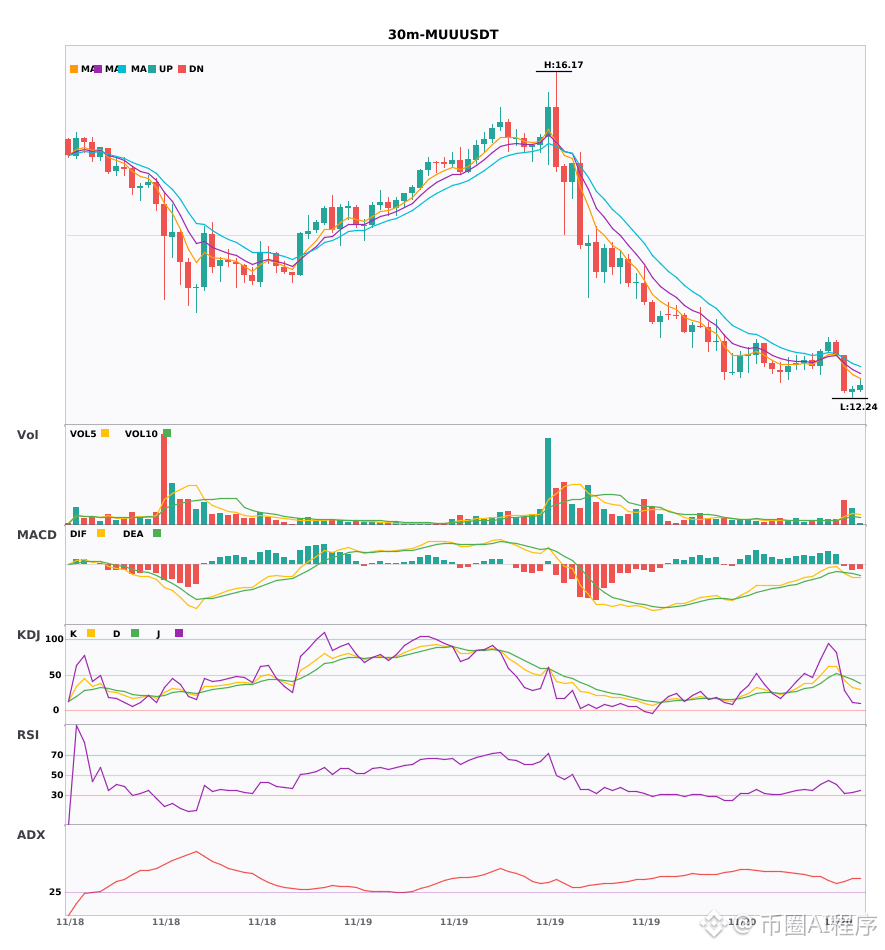
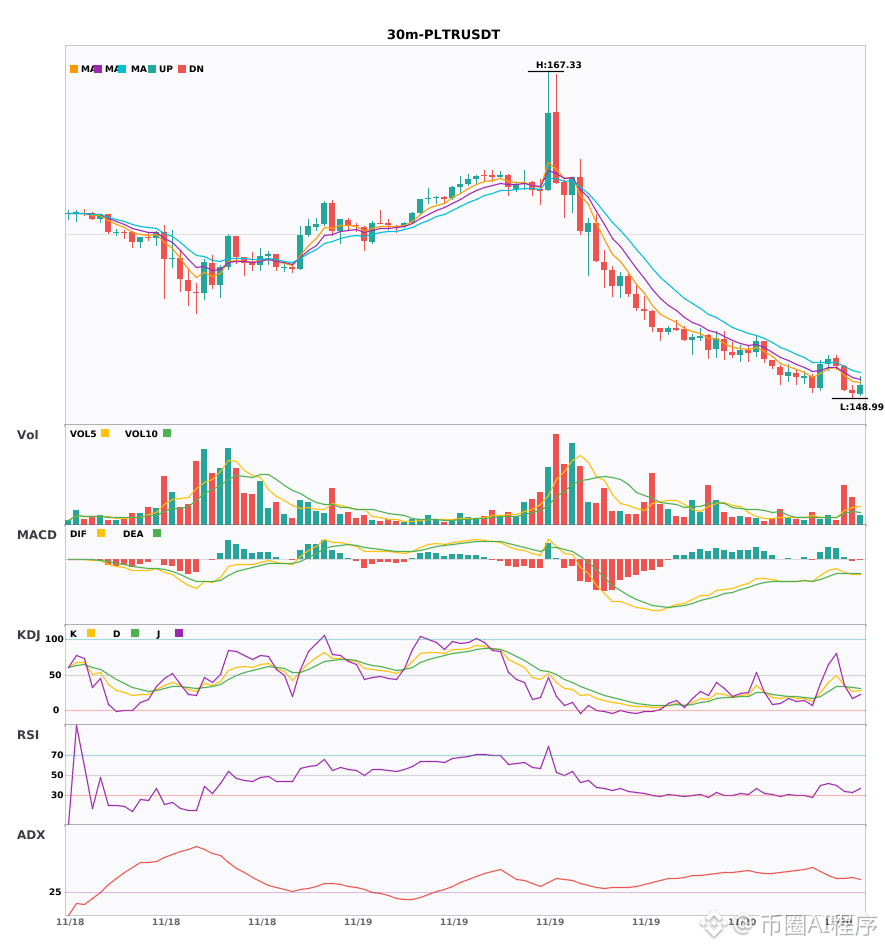
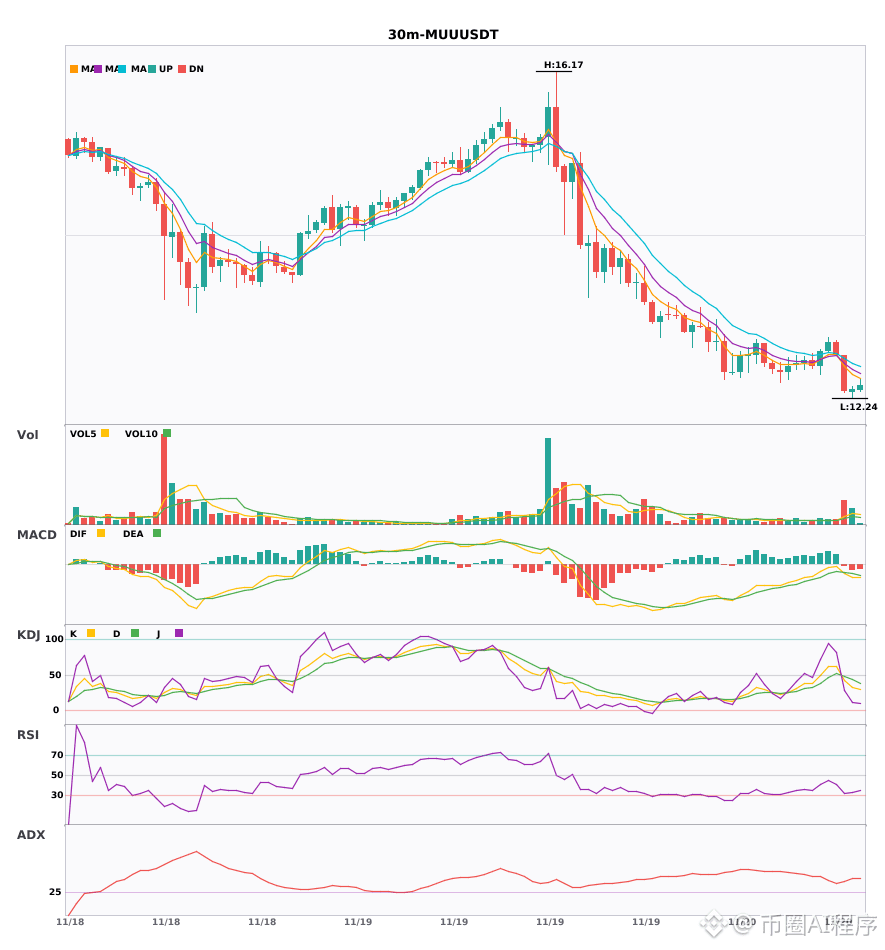
$SHAZ / $PLTR / $MUU 30-minute bearish signals emerge; the 4-hour bearish trend is confirmed 🔥
════════════════════
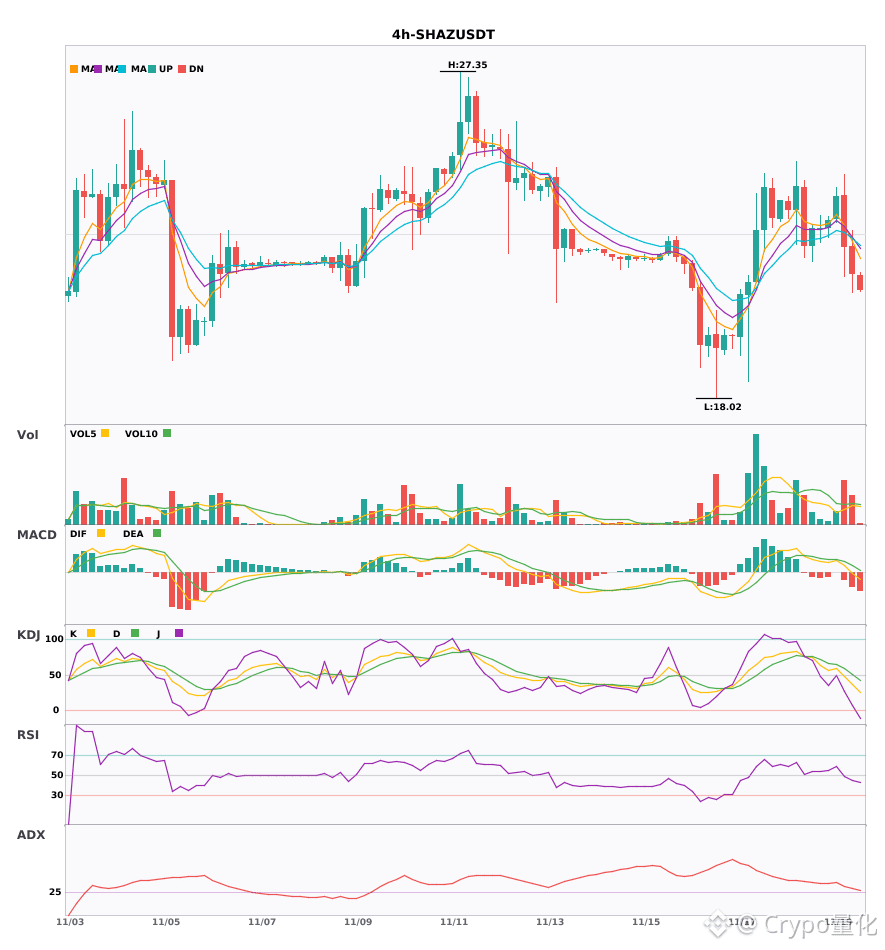
🟢 $SHAZ 30-minute bearish signal
⚠️Technical analysis: 4-hour bearish confluence confirmed. 30-minute entry: MACD bearish crossover below zero, with green histogram bars continuing to expand, indicating accelerating bearish momentum; moving averages are bearishly aligned and diverging downward; KDJ bearish crossover without being oversold; volume surges to 2.7 times the usual level. Multiple timeframes align bearish.
════════════════════
🟢 $PLTR 30-minute bearish signal
⚠️Technical analysis: 4-hour bearish confluence confirmed. 30-minute entry: MACD bearish crossover with green histogram bars; moving averages are bearishly aligned and diverging downward; KDJ bearish crossover without being oversold; volume increases 3.6 times.
════════════════════
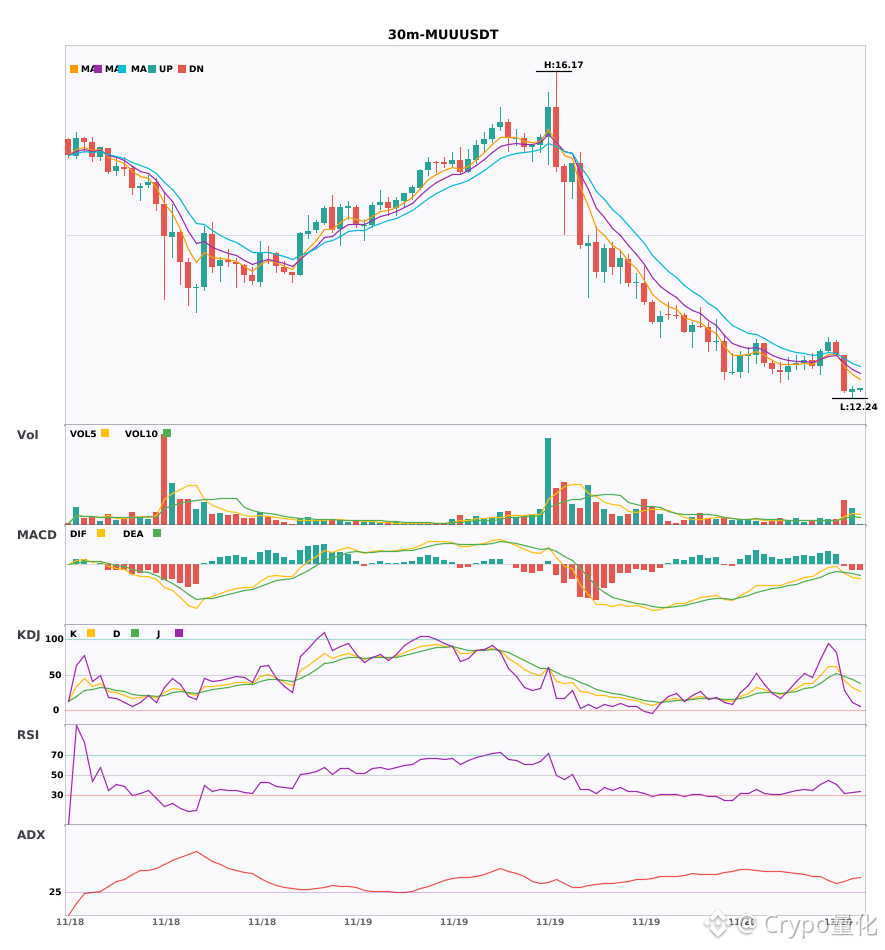
🟢 $MUU 30-minute bearish signal
⚠️Technical analysis: 4-hour bearish momentum + 30-minute entry align across multiple timeframes! Green histogram bars expand after the MACD bearish crossover; moving averages have just turned downward; KDJ bearish crossover without being oversold; volume surges to 3.6 times the usual level.
════════════════════
🔔 Follow for first-hand market updates 🔔
#多周期共振 #SHAZ #PLTR #MUU
📌 When trading, pay attention to whether the candlestick pattern confirms the signal
$SHAZ / $PLTR / $MUU 30-minute bearish signals emerge; the 4-hour bearish trend is confirmed 🔥
════════════════════
🟢 $SHAZ 30-minute bearish signal
⚠️Technical analysis: 4-hour bearish confluence confirmed. 30-minute entry: MACD bearish crossover below zero, with green histogram bars continuing to expand, indicating accelerating bearish momentum; moving averages are bearishly aligned and diverging downward; KDJ bearish crossover without being oversold; volume surges to 2.7 times the usual level. Multiple timeframes align bearish.
════════════════════
🟢 $PLTR 30-minute bearish signal
⚠️Technical analysis: 4-hour bearish confluence confirmed. 30-minute entry: MACD bearish crossover with green histogram bars; moving averages are bearishly aligned and diverging downward; KDJ bearish crossover without being oversold; volume increases 3.6 times.
════════════════════
🟢 $MUU 30-minute bearish signal
⚠️Technical analysis: 4-hour bearish momentum + 30-minute entry align across multiple timeframes! Green histogram bars expand after the MACD bearish crossover; moving averages have just turned downward; KDJ bearish crossover without being oversold; volume surges to 3.6 times the usual level.
════════════════════
🔔 Follow for first-hand market updates 🔔
#多周期共振 #SHAZ #PLTR #MUU
📌 When trading, pay attention to whether the candlestick pattern confirms the signal
════════════════════
🟢 $SHAZ 30-minute bearish signal
⚠️Technical analysis: 4-hour bearish confluence confirmed. 30-minute entry: MACD bearish crossover below zero, with green histogram bars continuing to expand, indicating accelerating bearish momentum; moving averages are bearishly aligned and diverging downward; KDJ bearish crossover without being oversold; volume surges to 2.7 times the usual level. Multiple timeframes align bearish.
════════════════════
🟢 $PLTR 30-minute bearish signal
⚠️Technical analysis: 4-hour bearish confluence confirmed. 30-minute entry: MACD bearish crossover with green histogram bars; moving averages are bearishly aligned and diverging downward; KDJ bearish crossover without being oversold; volume increases 3.6 times.
════════════════════
🟢 $MUU 30-minute bearish signal
⚠️Technical analysis: 4-hour bearish momentum + 30-minute entry align across multiple timeframes! Green histogram bars expand after the MACD bearish crossover; moving averages have just turned downward; KDJ bearish crossover without being oversold; volume surges to 3.6 times the usual level.
════════════════════
🔔 Follow for first-hand market updates 🔔
#多周期共振 #SHAZ #PLTR #MUU
📌 When trading, pay attention to whether the candlestick pattern confirms the signal
6
·
--
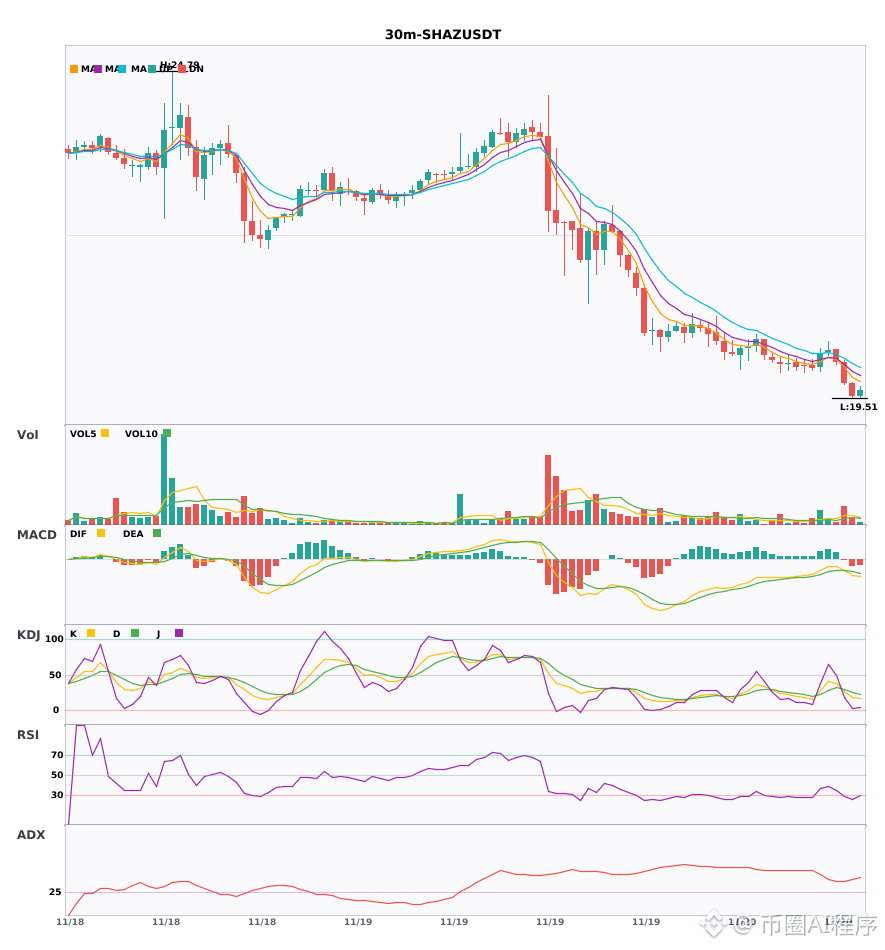
All 3 coins are bearish across multiple timeframes; the 30-minute and 4-hour charts confirm the downtrend 🔥
════════════════════
🟢 $SHAZ 30-minute bearish signal
⚠️ Technical analysis: 4-hour bearish confluence. 30-minute entry: MACD bearish crossover accelerating the downtrend, moving averages bearishly aligned and diverging, KDJ bearish crossover but not oversold, trading volume surging 2.7x. Short-term outlook is bearish.
════════════════════
🟢 $PLTR 30-minute bearish signal
⚠️ Technical analysis: 30-minute entry signal, confirmed by 4-hour bearish confluence. After the MACD bearish crossover, the green histogram bars continue to grow; moving averages are bearishly diverging downward; KDJ bearish crossover but not oversold; trading volume up 3.6x. Bearish with the trend.
════════════════════
🟢 $MUU 30-minute bearish signal
⚠️ Technical analysis: Confirmed 4-hour and 30-minute bearish confluence. Green histogram bars grow after the MACD bearish crossover; EMA5 crosses below EMA8, turning bearish; KDJ bearish crossover but not oversold; volume surges 3.6x. Bearish outlook.
════════════════════
🔔 Follow for first-hand market updates 🔔
#多周期共振 #SHAZ #PLTR #MUU
📌 When trading, pay attention to whether the candlestick pattern aligns
All 3 coins are bearish across multiple timeframes; the 30-minute and 4-hour charts confirm the downtrend 🔥
════════════════════
🟢 $SHAZ 30-minute bearish signal
⚠️ Technical analysis: 4-hour bearish confluence. 30-minute entry: MACD bearish crossover accelerating the downtrend, moving averages bearishly aligned and diverging, KDJ bearish crossover but not oversold, trading volume surging 2.7x. Short-term outlook is bearish.
════════════════════
🟢 $PLTR 30-minute bearish signal
⚠️ Technical analysis: 30-minute entry signal, confirmed by 4-hour bearish confluence. After the MACD bearish crossover, the green histogram bars continue to grow; moving averages are bearishly diverging downward; KDJ bearish crossover but not oversold; trading volume up 3.6x. Bearish with the trend.
════════════════════
🟢 $MUU 30-minute bearish signal
⚠️ Technical analysis: Confirmed 4-hour and 30-minute bearish confluence. Green histogram bars grow after the MACD bearish crossover; EMA5 crosses below EMA8, turning bearish; KDJ bearish crossover but not oversold; volume surges 3.6x. Bearish outlook.
════════════════════
🔔 Follow for first-hand market updates 🔔
#多周期共振 #SHAZ #PLTR #MUU
📌 When trading, pay attention to whether the candlestick pattern aligns
════════════════════
🟢 $SHAZ 30-minute bearish signal
⚠️ Technical analysis: 4-hour bearish confluence. 30-minute entry: MACD bearish crossover accelerating the downtrend, moving averages bearishly aligned and diverging, KDJ bearish crossover but not oversold, trading volume surging 2.7x. Short-term outlook is bearish.
════════════════════
🟢 $PLTR 30-minute bearish signal
⚠️ Technical analysis: 30-minute entry signal, confirmed by 4-hour bearish confluence. After the MACD bearish crossover, the green histogram bars continue to grow; moving averages are bearishly diverging downward; KDJ bearish crossover but not oversold; trading volume up 3.6x. Bearish with the trend.
════════════════════
🟢 $MUU 30-minute bearish signal
⚠️ Technical analysis: Confirmed 4-hour and 30-minute bearish confluence. Green histogram bars grow after the MACD bearish crossover; EMA5 crosses below EMA8, turning bearish; KDJ bearish crossover but not oversold; volume surges 3.6x. Bearish outlook.
════════════════════
🔔 Follow for first-hand market updates 🔔
#多周期共振 #SHAZ #PLTR #MUU
📌 When trading, pay attention to whether the candlestick pattern aligns
6

·
--
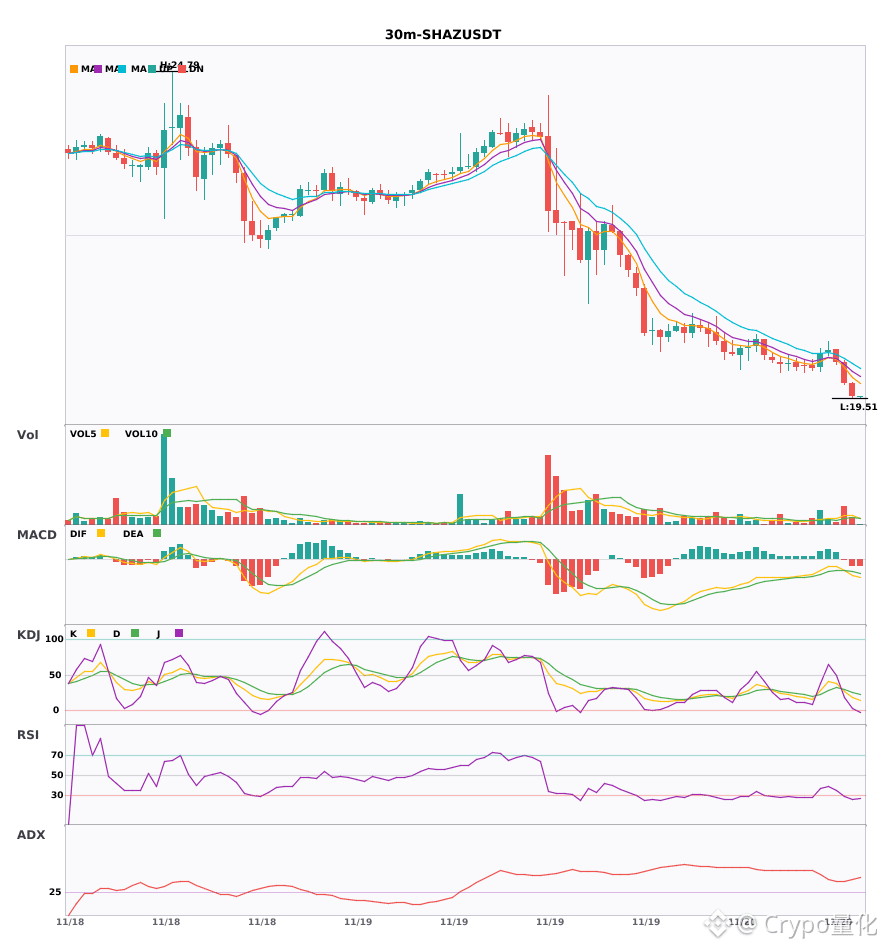
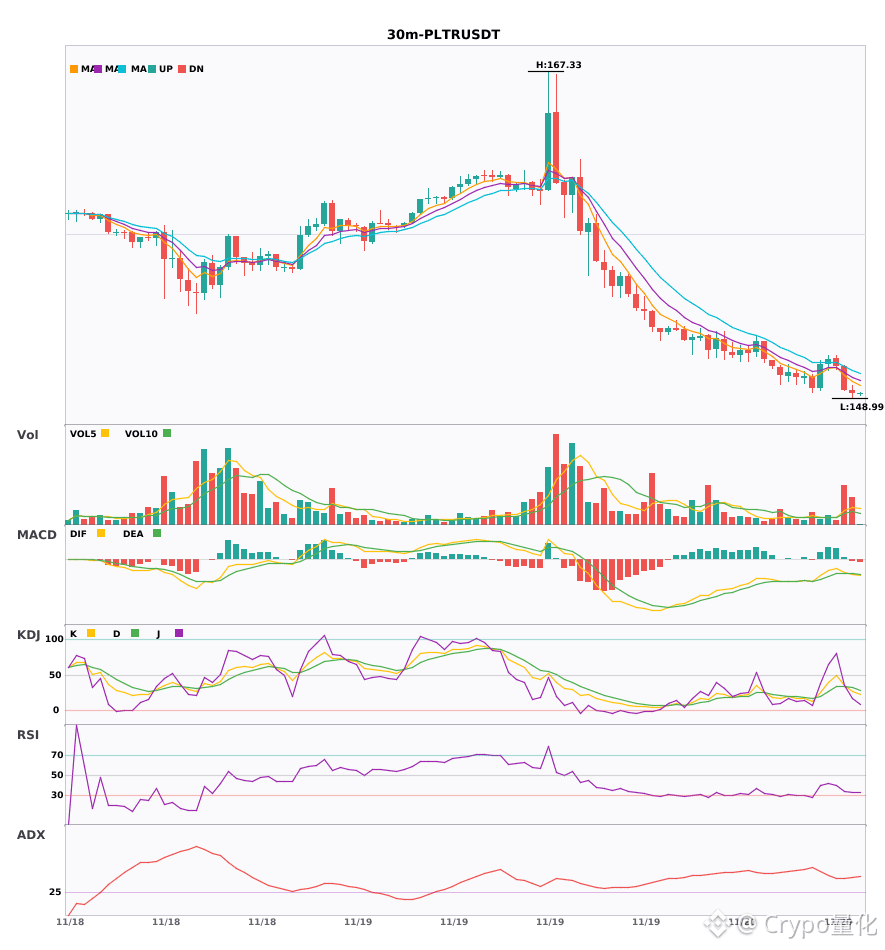
$SHAZ/$PLTR/$MUU 30 minutes turning bearish together, bears unite 🔥
════════════════════
🟢 $SHAZ 30-minute bearish signal
⚠️ Technicals: ADX 35 indicates a very strong trend; MACD below zero with a bearish crossover, accelerating downward; moving averages are bearishly aligned; KDJ bearish crossover signals a downtrend (K26/D30); volume is 2.7x higher.
════════════════════
🟢 $PLTR 30-minute bearish signal
⚠️ Technicals: ADX indicates a strong trend; MACD bearish crossover with expanding green bars; moving averages are bearishly aligned and diverging downward; KDJ bearish crossover and not oversold; volume surges to 3.6x, bearish short-term outlook.
════════════════════
🟢 $MUU 30-minute bearish signal
⚠️ Technicals: ADX is very high, indicating a clear trend. MACD bearish crossover accelerating downward; EMA5 crosses below EMA8, turning bearish; KDJ bearish crossover with K crossing below D, not oversold; volume surges to 3.6x, bearish near-term outlook.
════════════════════
🔔 Follow for the latest market-moving updates 🔔
#技术分析 #SHAZ #PLTR #MUU
📌 When trading, pay attention to whether the candlestick pattern confirms the setup
$SHAZ /$PLTR /$MUU 30 minutes turning bearish together, bears unite 🔥
════════════════════
🟢 $SHAZ 30-minute bearish signal
⚠️ Technicals: ADX 35 indicates a very strong trend; MACD below zero with a bearish crossover, accelerating downward; moving averages are bearishly aligned; KDJ bearish crossover signals a downtrend (K26/D30); volume is 2.7x higher.
════════════════════
🟢 $PLTR 30-minute bearish signal
⚠️ Technicals: ADX indicates a strong trend; MACD bearish crossover with expanding green bars; moving averages are bearishly aligned and diverging downward; KDJ bearish crossover and not oversold; volume surges to 3.6x, bearish short-term outlook.
════════════════════
🟢 $MUU 30-minute bearish signal
⚠️ Technicals: ADX is very high, indicating a clear trend. MACD bearish crossover accelerating downward; EMA5 crosses below EMA8, turning bearish; KDJ bearish crossover with K crossing below D, not oversold; volume surges to 3.6x, bearish near-term outlook.
════════════════════
🔔 Follow for the latest market-moving updates 🔔
#技术分析 #SHAZ #PLTR #MUU
📌 When trading, pay attention to whether the candlestick pattern confirms the setup
════════════════════
🟢 $SHAZ 30-minute bearish signal
⚠️ Technicals: ADX 35 indicates a very strong trend; MACD below zero with a bearish crossover, accelerating downward; moving averages are bearishly aligned; KDJ bearish crossover signals a downtrend (K26/D30); volume is 2.7x higher.
════════════════════
🟢 $PLTR 30-minute bearish signal
⚠️ Technicals: ADX indicates a strong trend; MACD bearish crossover with expanding green bars; moving averages are bearishly aligned and diverging downward; KDJ bearish crossover and not oversold; volume surges to 3.6x, bearish short-term outlook.
════════════════════
🟢 $MUU 30-minute bearish signal
⚠️ Technicals: ADX is very high, indicating a clear trend. MACD bearish crossover accelerating downward; EMA5 crosses below EMA8, turning bearish; KDJ bearish crossover with K crossing below D, not oversold; volume surges to 3.6x, bearish near-term outlook.
════════════════════
🔔 Follow for the latest market-moving updates 🔔
#技术分析 #SHAZ #PLTR #MUU
📌 When trading, pay attention to whether the candlestick pattern confirms the setup
2
·
--
$PLTR $MSFT $USAR 30-minute weakness, 4-hour bearish confluence 🔥
════════════════════
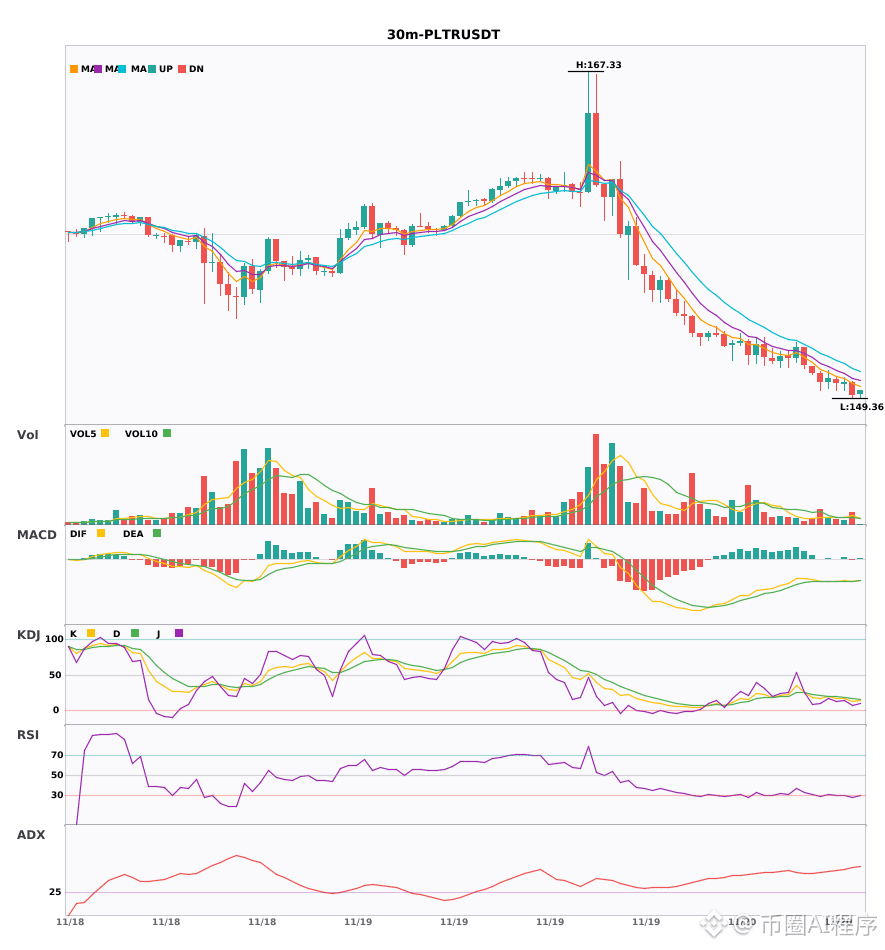
🟢 $PLTR 30-minute short signal
⚠️Technical analysis: After a 30-minute MACD death cross, volume expanded. Moving averages are bearishly aligned and trending downward. KDJ has entered oversold territory, so watch for a rebound; 4-hour bearish confluence is confirmed, favoring the trend.
════════════════════
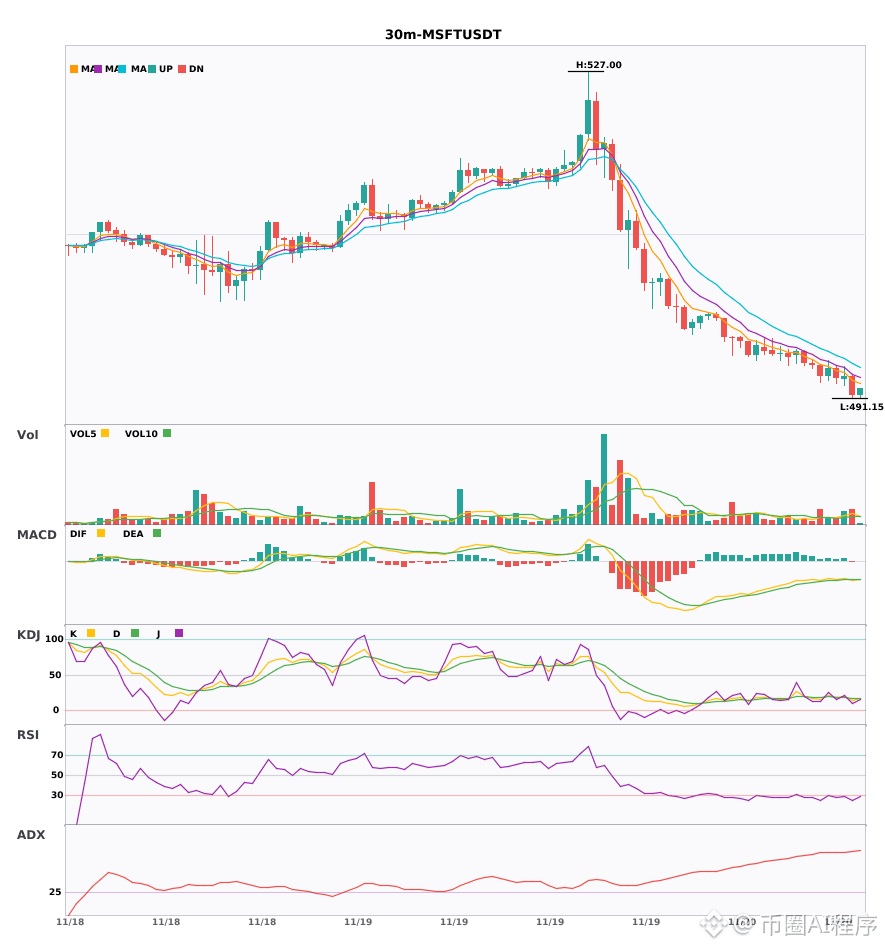
🟢 $MSFT 30-minute short signal
⚠️Technical analysis: 30-minute entry + 4-hour bearish confluence confirmed! The MACD death cross histogram bars are growing, moving averages are bearishly aligned, KDJ has formed a death cross but is not oversold, and volume has increased 1.8x. The short-term outlook remains bearish.
════════════════════
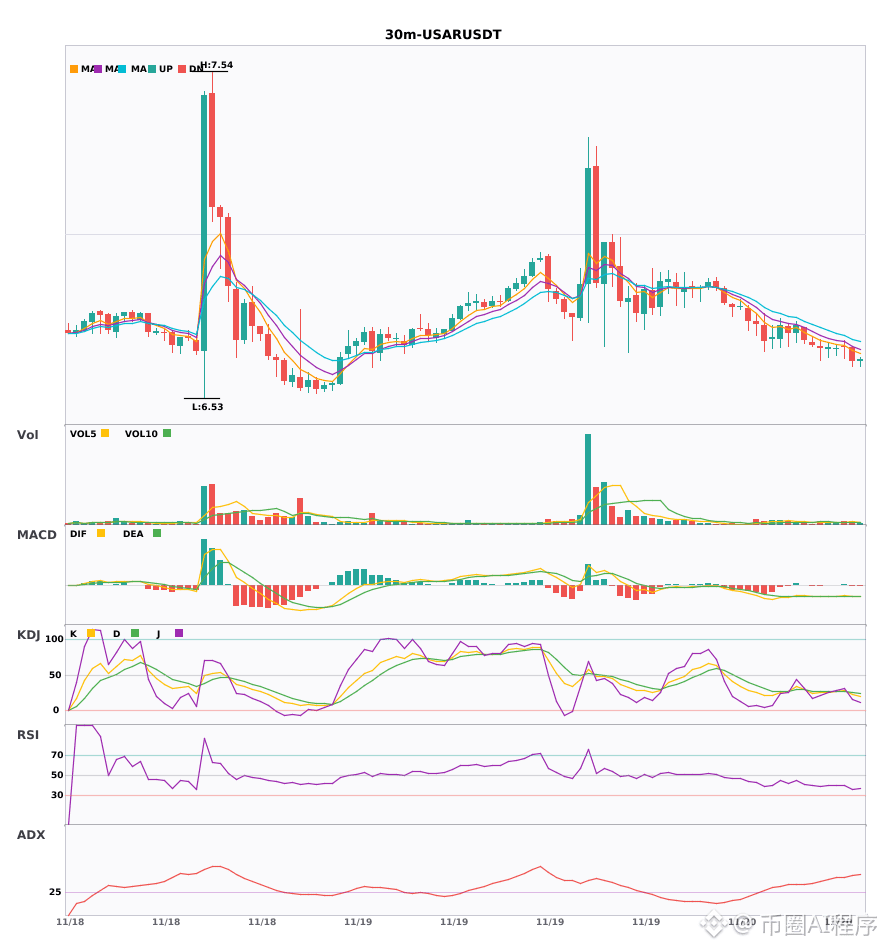
🟢 $USAR 30-minute short signal
⚠️Technical analysis: 4-hour bearish + 30-minute confluence for a short | MACD death cross histogram bars growing | Bearish divergence in moving averages | KDJ death cross, not oversold | Volume normal
════════════════════
🔔 Follow for first-hand market movement alerts 🔔
#多周期共振 #PLTR #MSFT #USAR
📌 When trading, pay attention to whether the candlestick pattern confirms the setup
$PLTR $MSFT $USAR 30-minute weakness, 4-hour bearish confluence 🔥
════════════════════
🟢 $PLTR 30-minute short signal
⚠️Technical analysis: After a 30-minute MACD death cross, volume expanded. Moving averages are bearishly aligned and trending downward. KDJ has entered oversold territory, so watch for a rebound; 4-hour bearish confluence is confirmed, favoring the trend.
════════════════════
🟢 $MSFT 30-minute short signal
⚠️Technical analysis: 30-minute entry + 4-hour bearish confluence confirmed! The MACD death cross histogram bars are growing, moving averages are bearishly aligned, KDJ has formed a death cross but is not oversold, and volume has increased 1.8x. The short-term outlook remains bearish.
════════════════════
🟢 $USAR 30-minute short signal
⚠️Technical analysis: 4-hour bearish + 30-minute confluence for a short | MACD death cross histogram bars growing | Bearish divergence in moving averages | KDJ death cross, not oversold | Volume normal
════════════════════
🔔 Follow for first-hand market movement alerts 🔔
#多周期共振 #PLTR #MSFT #USAR
📌 When trading, pay attention to whether the candlestick pattern confirms the setup
════════════════════
🟢 $PLTR 30-minute short signal
⚠️Technical analysis: After a 30-minute MACD death cross, volume expanded. Moving averages are bearishly aligned and trending downward. KDJ has entered oversold territory, so watch for a rebound; 4-hour bearish confluence is confirmed, favoring the trend.
════════════════════
🟢 $MSFT 30-minute short signal
⚠️Technical analysis: 30-minute entry + 4-hour bearish confluence confirmed! The MACD death cross histogram bars are growing, moving averages are bearishly aligned, KDJ has formed a death cross but is not oversold, and volume has increased 1.8x. The short-term outlook remains bearish.
════════════════════
🟢 $USAR 30-minute short signal
⚠️Technical analysis: 4-hour bearish + 30-minute confluence for a short | MACD death cross histogram bars growing | Bearish divergence in moving averages | KDJ death cross, not oversold | Volume normal
════════════════════
🔔 Follow for first-hand market movement alerts 🔔
#多周期共振 #PLTR #MSFT #USAR
📌 When trading, pay attention to whether the candlestick pattern confirms the setup
7
·
--
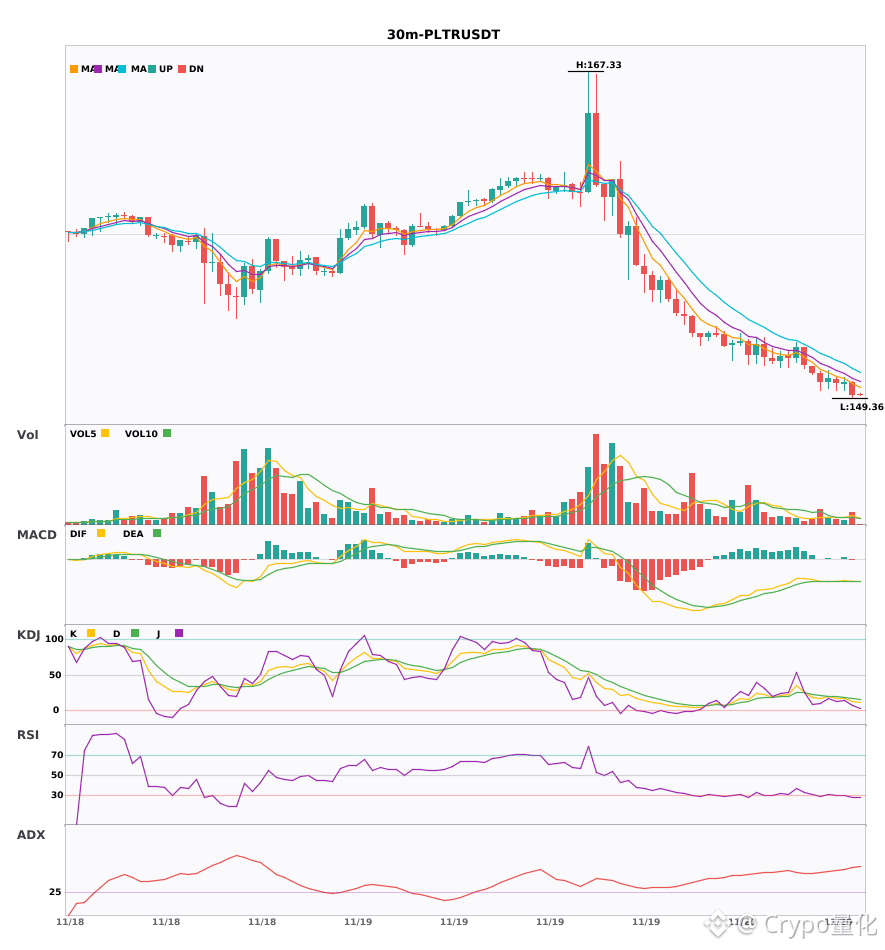
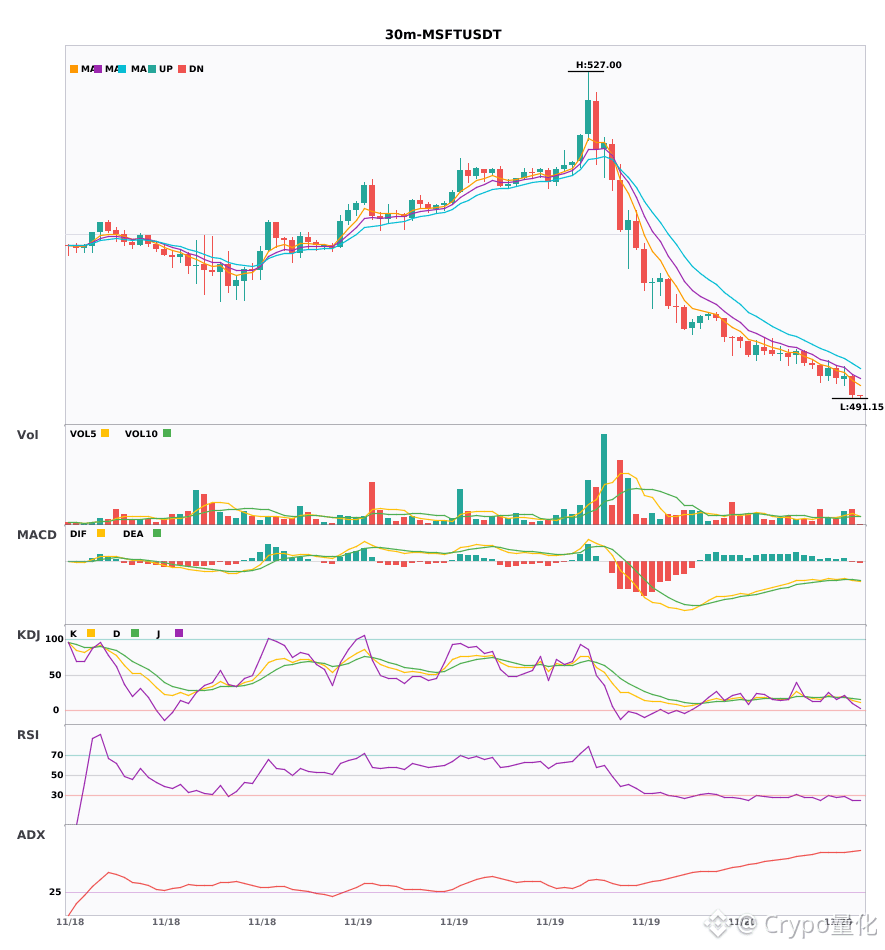
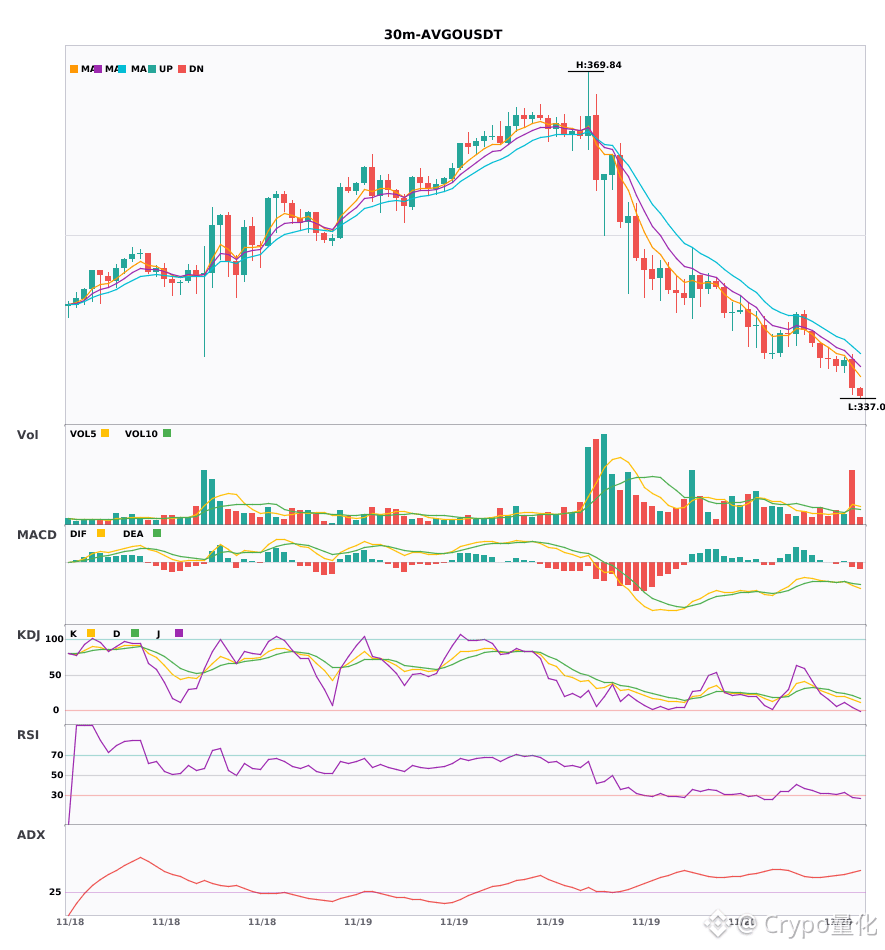
The 30-minute chart is about to drop: $PLTR $MSFT $AVGO short warning🔥
════════════════════
🟢 $PLTR 30-minute short signal
⚠️Technical analysis: ADX shows an extremely strong trend, but beware of an overbought pullback; MACD bearish crossover below zero, accelerating the decline; EMA bearish alignment; KDJ oversold (K13.5 D17), watch for a rebound; volume up 1.6x.
════════════════════
🟢 $MSFT 30-minute short signal
⚠️Technical analysis: ADX 73, extremely strong trend—beware of an overbought pullback; MACD bearish crossover below zero on rising volume, with selling pressure accelerating; moving averages aligned bearishly and pointing down; KDJ bearish crossover but already in oversold territory; volume up 1.8x.
════════════════════
🟢 $AVGO 30-minute short signal
⚠️Technical analysis: Exceptionally strong trend (47)—beware of an overheated pullback|MACD bearish crossover below zero, bearish momentum accelerating|Moving averages aligned bearishly|KDJ weak, K below D|Volume up 3.3x
════════════════════
🔔 Follow for first-hand market alerts 🔔
#技术分析 #PLTR #MSFT #AVGO
📌 When trading, check whether the candlestick pattern confirms the signal
The 30-minute chart is about to drop: $PLTR $MSFT $AVGO short warning🔥
════════════════════
🟢 $PLTR 30-minute short signal
⚠️Technical analysis: ADX shows an extremely strong trend, but beware of an overbought pullback; MACD bearish crossover below zero, accelerating the decline; EMA bearish alignment; KDJ oversold (K13.5 D17), watch for a rebound; volume up 1.6x.
════════════════════
🟢 $MSFT 30-minute short signal
⚠️Technical analysis: ADX 73, extremely strong trend—beware of an overbought pullback; MACD bearish crossover below zero on rising volume, with selling pressure accelerating; moving averages aligned bearishly and pointing down; KDJ bearish crossover but already in oversold territory; volume up 1.8x.
════════════════════
🟢 $AVGO 30-minute short signal
⚠️Technical analysis: Exceptionally strong trend (47)—beware of an overheated pullback|MACD bearish crossover below zero, bearish momentum accelerating|Moving averages aligned bearishly|KDJ weak, K below D|Volume up 3.3x
════════════════════
🔔 Follow for first-hand market alerts 🔔
#技术分析 #PLTR #MSFT #AVGO
📌 When trading, check whether the candlestick pattern confirms the signal
════════════════════
🟢 $PLTR 30-minute short signal
⚠️Technical analysis: ADX shows an extremely strong trend, but beware of an overbought pullback; MACD bearish crossover below zero, accelerating the decline; EMA bearish alignment; KDJ oversold (K13.5 D17), watch for a rebound; volume up 1.6x.
════════════════════
🟢 $MSFT 30-minute short signal
⚠️Technical analysis: ADX 73, extremely strong trend—beware of an overbought pullback; MACD bearish crossover below zero on rising volume, with selling pressure accelerating; moving averages aligned bearishly and pointing down; KDJ bearish crossover but already in oversold territory; volume up 1.8x.
════════════════════
🟢 $AVGO 30-minute short signal
⚠️Technical analysis: Exceptionally strong trend (47)—beware of an overheated pullback|MACD bearish crossover below zero, bearish momentum accelerating|Moving averages aligned bearishly|KDJ weak, K below D|Volume up 3.3x
════════════════════
🔔 Follow for first-hand market alerts 🔔
#技术分析 #PLTR #MSFT #AVGO
📌 When trading, check whether the candlestick pattern confirms the signal
5
·
--
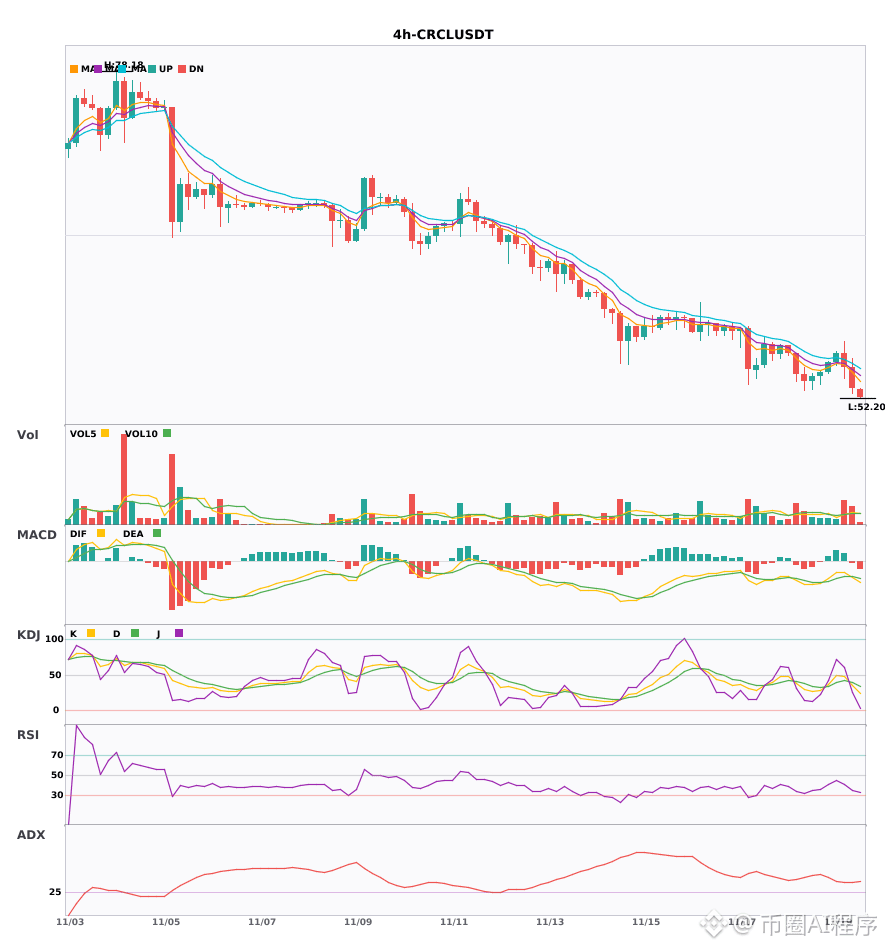
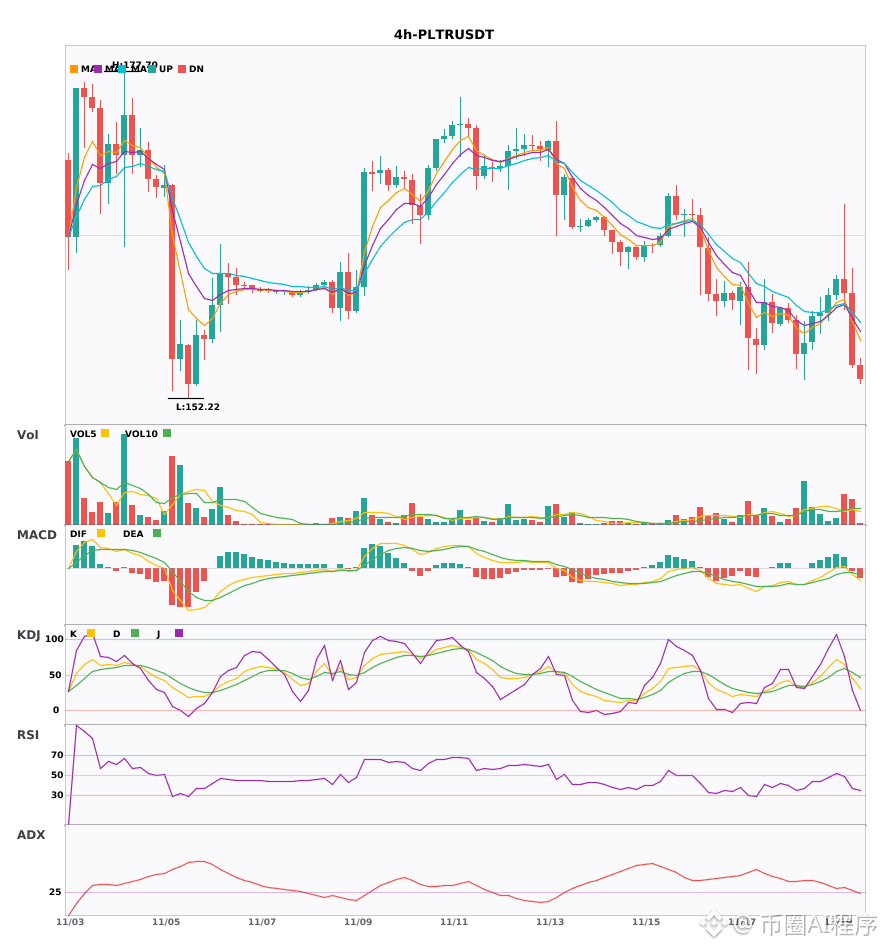
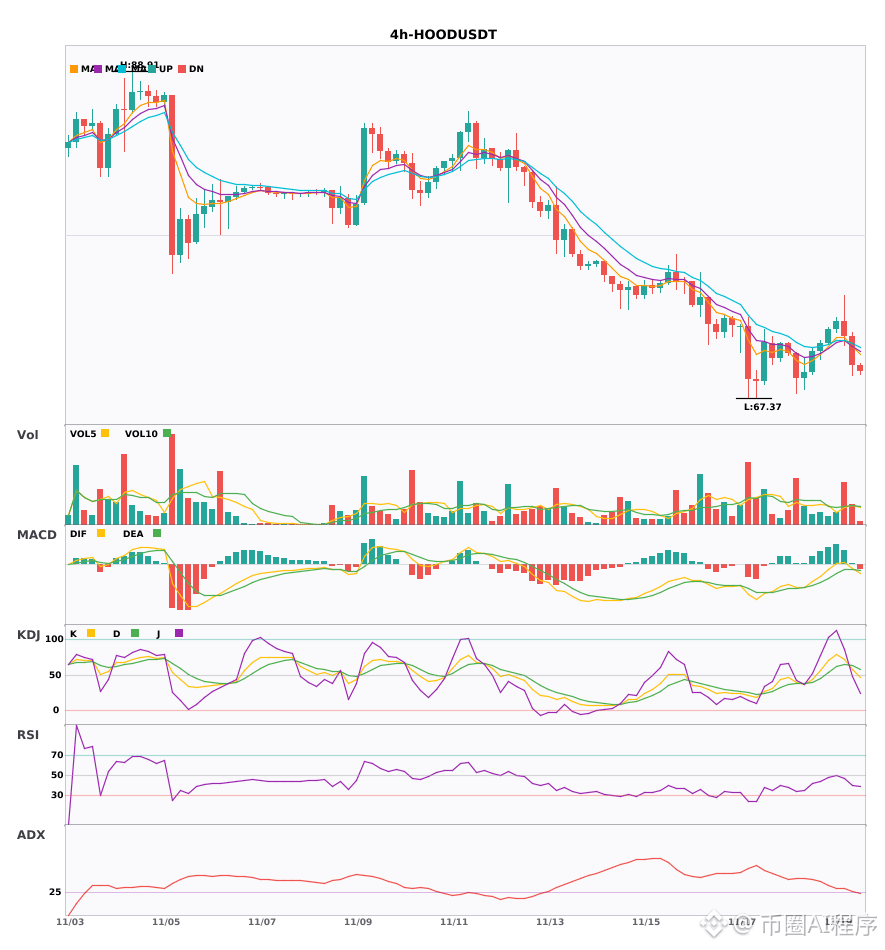
$CRCL $PLTR $HOOD 4 hours: both the daily and hourly charts are turning bearish; multiple timeframes confirm the downtrend 🔥
════════════════════
🟢 $CRCL 4-hour short signal
⚠️ Technical analysis: Bearish confirmation across timeframes on the daily chart. 4-hour entry: MACD bearish crossover below zero, accelerating downward; moving averages are bearishly aligned and diverging downward; KDJ bearish crossover, not yet oversold; volume up 2.4x — short signal.
════════════════════
🟢 $PLTR 4-hour short signal
⚠️ Technical analysis: Multiple timeframes align for a short! Daily bearish trend + 4-hour entry confirmed in the same direction; MACD bearish crossover with increased volume as price falls; moving averages bearishly aligned; KDJ bearish crossover, not oversold; volume up 2.1x.
════════════════════
🟢 $HOOD 4-hour short signal
⚠️ Technical analysis: Bearish confirmation across timeframes on the daily chart. 4-hour entry: MACD green bars expanding, DIF crosses below zero; EMA5 crosses below EMA8; KDJ bearish crossover, not oversold; volume up 2.3x — bearish outlook.
════════════════════
🔔 Follow to get real-time market updates 🔔
#多周期共振 #CRCL #PLTR #HOOD
📌 When trading, check whether the candlestick pattern confirms the setup.
$CRCL $PLTR $HOOD 4 hours: both the daily and hourly charts are turning bearish; multiple timeframes confirm the downtrend 🔥
════════════════════
🟢 $CRCL 4-hour short signal
⚠️ Technical analysis: Bearish confirmation across timeframes on the daily chart. 4-hour entry: MACD bearish crossover below zero, accelerating downward; moving averages are bearishly aligned and diverging downward; KDJ bearish crossover, not yet oversold; volume up 2.4x — short signal.
════════════════════
🟢 $PLTR 4-hour short signal
⚠️ Technical analysis: Multiple timeframes align for a short! Daily bearish trend + 4-hour entry confirmed in the same direction; MACD bearish crossover with increased volume as price falls; moving averages bearishly aligned; KDJ bearish crossover, not oversold; volume up 2.1x.
════════════════════
🟢 $HOOD 4-hour short signal
⚠️ Technical analysis: Bearish confirmation across timeframes on the daily chart. 4-hour entry: MACD green bars expanding, DIF crosses below zero; EMA5 crosses below EMA8; KDJ bearish crossover, not oversold; volume up 2.3x — bearish outlook.
════════════════════
🔔 Follow to get real-time market updates 🔔
#多周期共振 #CRCL #PLTR #HOOD
📌 When trading, check whether the candlestick pattern confirms the setup.
════════════════════
🟢 $CRCL 4-hour short signal
⚠️ Technical analysis: Bearish confirmation across timeframes on the daily chart. 4-hour entry: MACD bearish crossover below zero, accelerating downward; moving averages are bearishly aligned and diverging downward; KDJ bearish crossover, not yet oversold; volume up 2.4x — short signal.
════════════════════
🟢 $PLTR 4-hour short signal
⚠️ Technical analysis: Multiple timeframes align for a short! Daily bearish trend + 4-hour entry confirmed in the same direction; MACD bearish crossover with increased volume as price falls; moving averages bearishly aligned; KDJ bearish crossover, not oversold; volume up 2.1x.
════════════════════
🟢 $HOOD 4-hour short signal
⚠️ Technical analysis: Bearish confirmation across timeframes on the daily chart. 4-hour entry: MACD green bars expanding, DIF crosses below zero; EMA5 crosses below EMA8; KDJ bearish crossover, not oversold; volume up 2.3x — bearish outlook.
════════════════════
🔔 Follow to get real-time market updates 🔔
#多周期共振 #CRCL #PLTR #HOOD
📌 When trading, check whether the candlestick pattern confirms the setup.
11
·
--
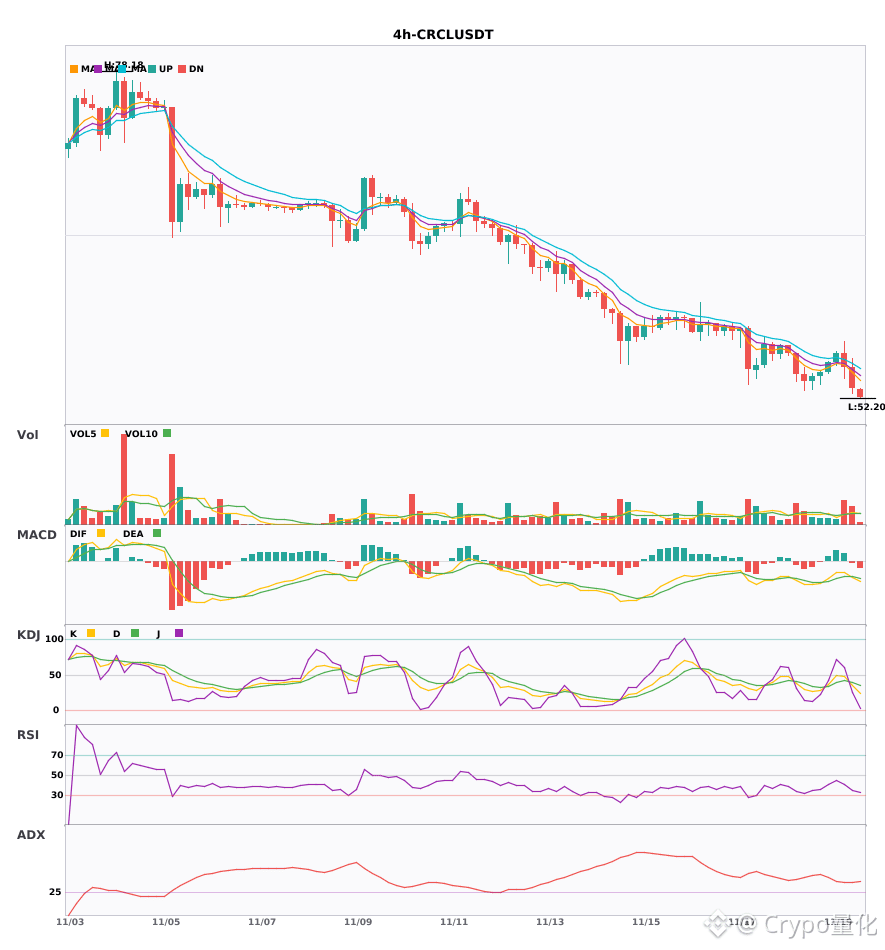
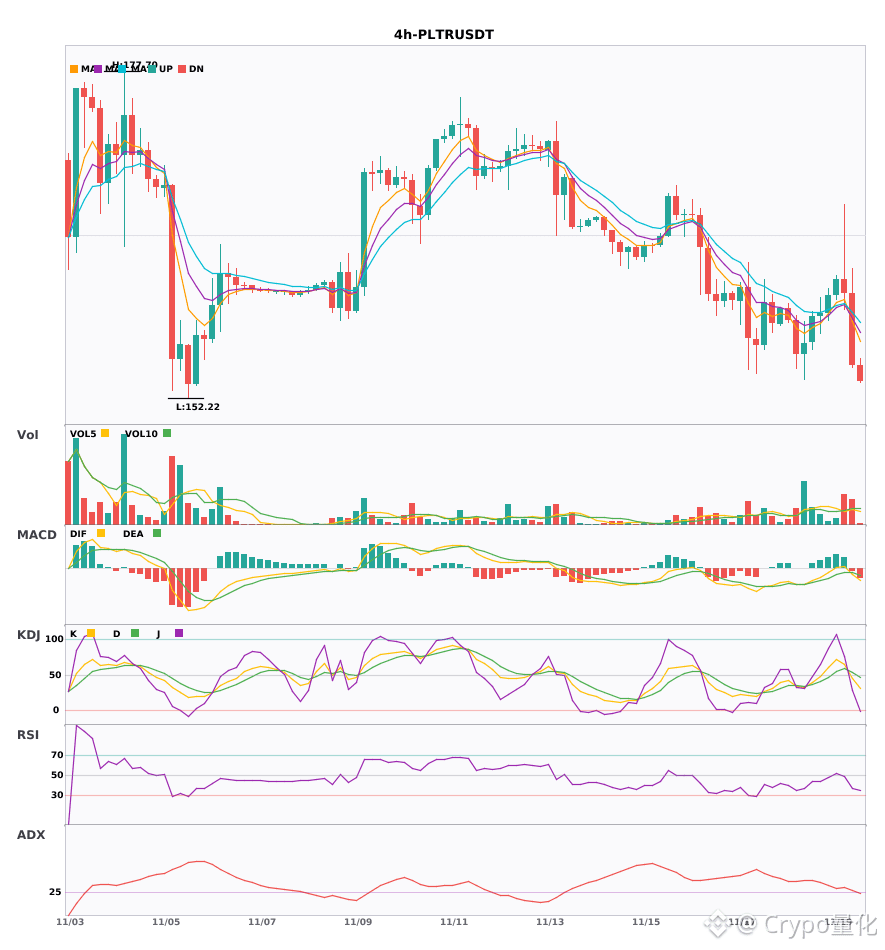
$CRCL $PLTR $SHAZ 4-hour bearish; short-term under pressure 🔥
════════════════════
🟢 $CRCL 4-hour bearish signal
⚠️ Technicals: ADX 34, clear trend | MACD bearish crossover, falling sharply | Moving averages in bearish alignment | KDJ bearish crossover, not oversold (K35/D39.8) | Volume up 2.4x
════════════════════
🟢 $PLTR 4-hour bearish signal
⚠️ Technicals: Trend is just starting; can follow | MACD bearish crossover, expanding green bars | Moving averages turning bearish | KDJ bearish crossover, bearish outlook (K45.6/D54.2) | Volume up 2.1x
════════════════════
🟢 $SHAZ 4-hour bearish signal
⚠️ Technicals: ADX 31, trending market; MACD's DIF has fallen below the zero line, turning bearish; EMA5 has crossed below EMA8, indicating a short-term downtrend; volume up 2.2x.
════════════════════
🔔 Follow for first-hand market alerts 🔔
#技术分析 #CRCL #PLTR #SHAZ
📌 When trading, pay attention to whether the candlestick pattern confirms the setup
$CRCL $PLTR $SHAZ 4-hour bearish; short-term under pressure 🔥
════════════════════
🟢 $CRCL 4-hour bearish signal
⚠️ Technicals: ADX 34, clear trend | MACD bearish crossover, falling sharply | Moving averages in bearish alignment | KDJ bearish crossover, not oversold (K35/D39.8) | Volume up 2.4x
════════════════════
🟢 $PLTR 4-hour bearish signal
⚠️ Technicals: Trend is just starting; can follow | MACD bearish crossover, expanding green bars | Moving averages turning bearish | KDJ bearish crossover, bearish outlook (K45.6/D54.2) | Volume up 2.1x
════════════════════
🟢 $SHAZ 4-hour bearish signal
⚠️ Technicals: ADX 31, trending market; MACD's DIF has fallen below the zero line, turning bearish; EMA5 has crossed below EMA8, indicating a short-term downtrend; volume up 2.2x.
════════════════════
🔔 Follow for first-hand market alerts 🔔
#技术分析 #CRCL #PLTR #SHAZ
📌 When trading, pay attention to whether the candlestick pattern confirms the setup
════════════════════
🟢 $CRCL 4-hour bearish signal
⚠️ Technicals: ADX 34, clear trend | MACD bearish crossover, falling sharply | Moving averages in bearish alignment | KDJ bearish crossover, not oversold (K35/D39.8) | Volume up 2.4x
════════════════════
🟢 $PLTR 4-hour bearish signal
⚠️ Technicals: Trend is just starting; can follow | MACD bearish crossover, expanding green bars | Moving averages turning bearish | KDJ bearish crossover, bearish outlook (K45.6/D54.2) | Volume up 2.1x
════════════════════
🟢 $SHAZ 4-hour bearish signal
⚠️ Technicals: ADX 31, trending market; MACD's DIF has fallen below the zero line, turning bearish; EMA5 has crossed below EMA8, indicating a short-term downtrend; volume up 2.2x.
════════════════════
🔔 Follow for first-hand market alerts 🔔
#技术分析 #CRCL #PLTR #SHAZ
📌 When trading, pay attention to whether the candlestick pattern confirms the setup
8

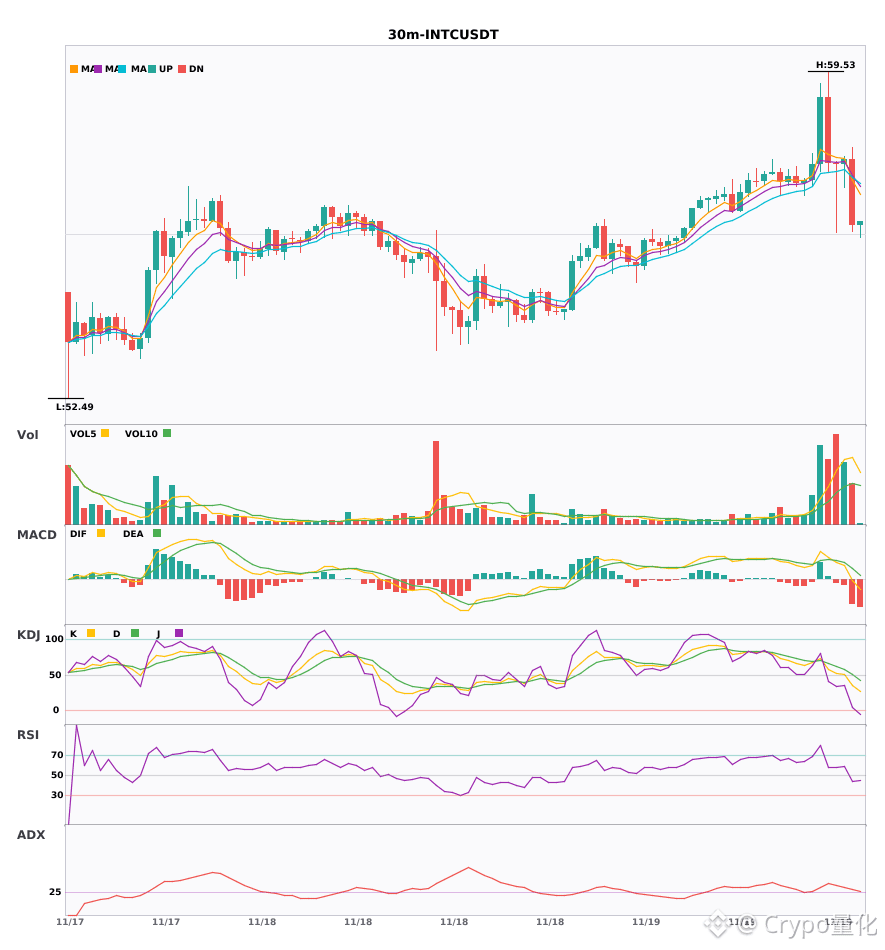
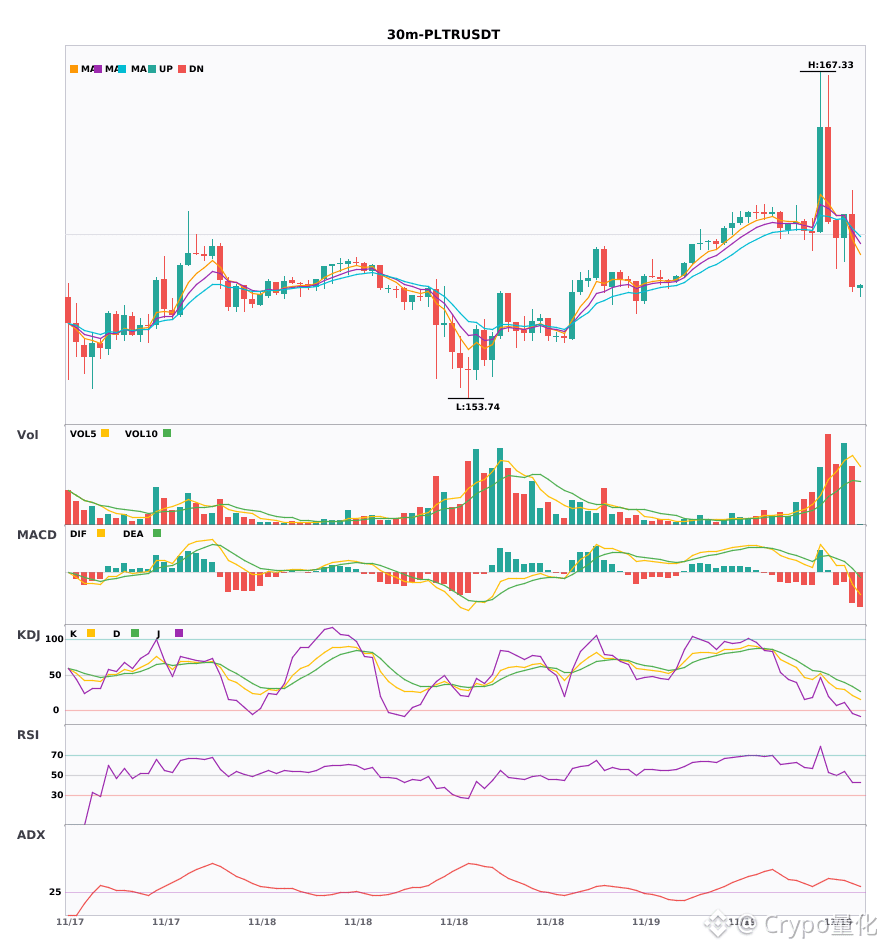
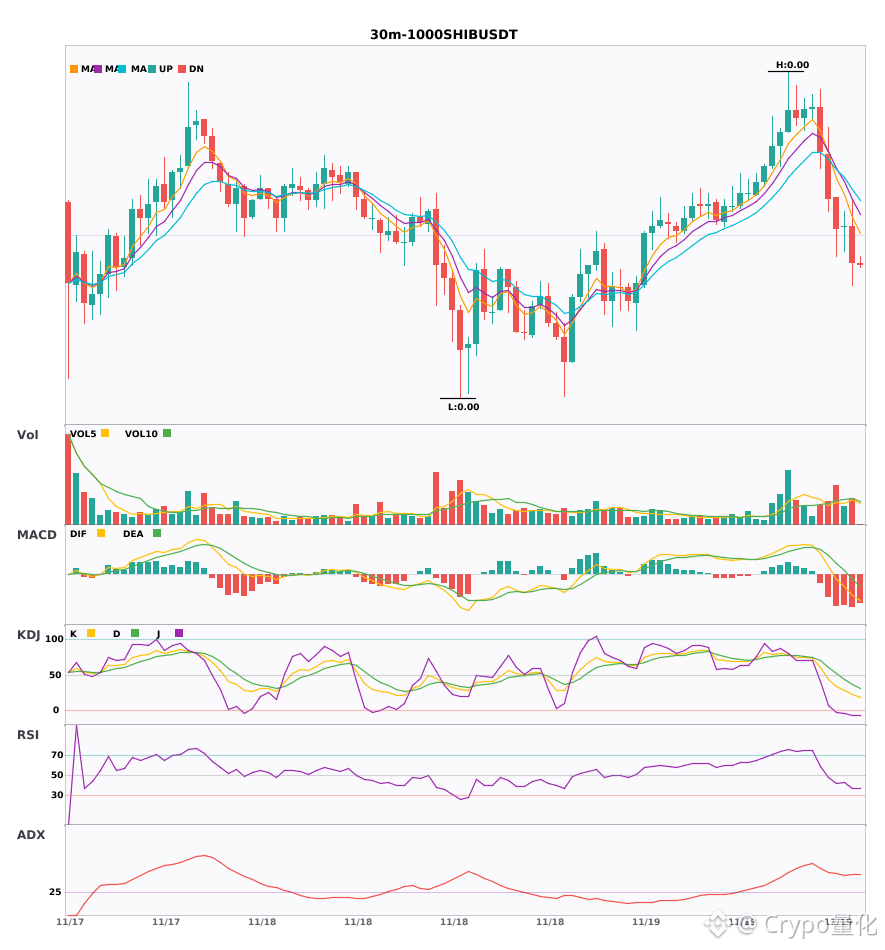
$INTC/$PLTR/$1000SHIB 30m converging bearish signals
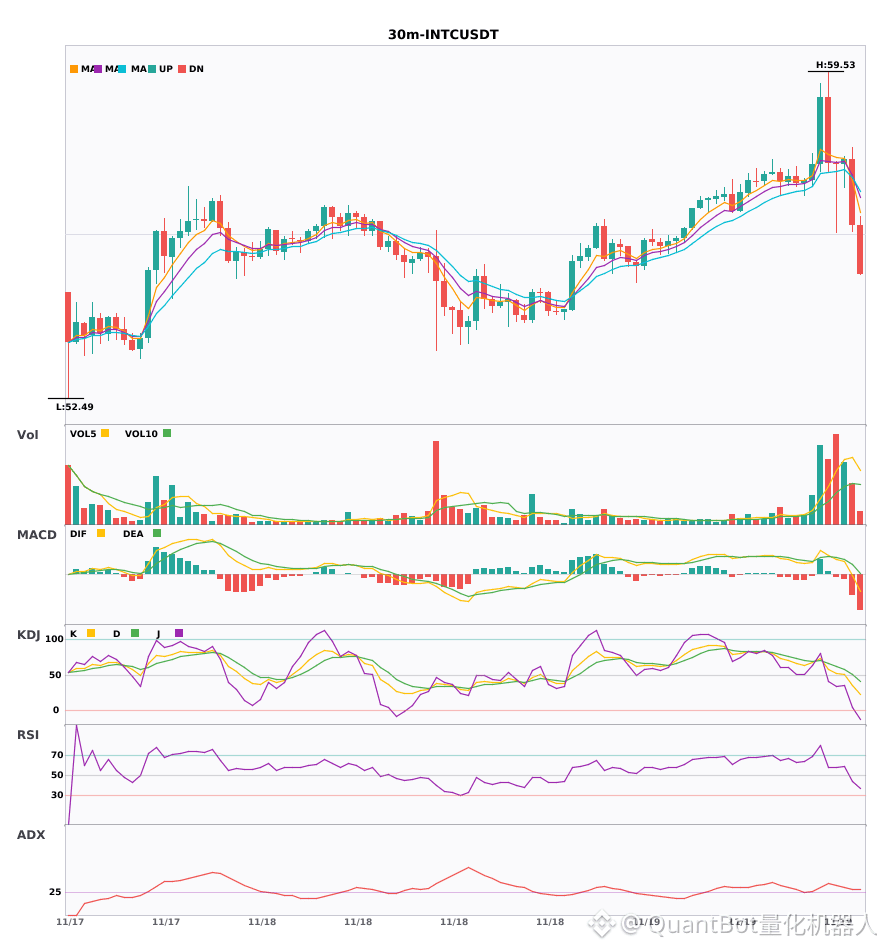
📉 $INTC | 30-minute bearish signal
━━━━━━━━━━━━━━━━━━
Technical analysis: ADX(28) indicates a developing trend with potential trading opportunities; MACD DIF has crossed below the zero line, indicating weakening momentum; EMA5 has fallen below EMA8, suggesting a short-term bearish outlook; volume is up approximately 1.6x.
Price change: -2.4600%
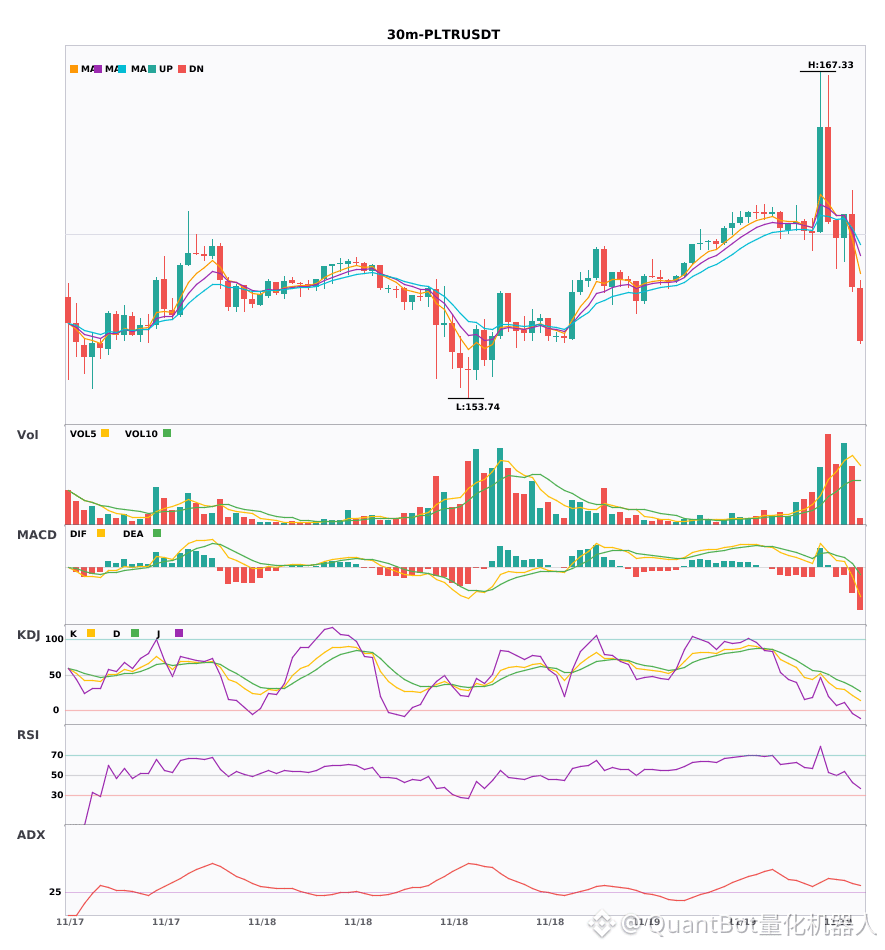
📉 $PLTR | 30-minute bearish signal
━━━━━━━━━━━━━━━━━━
Technical analysis: ADX(35), a pronounced trend | MACD DIF crosses below the zero line, turning bearish | EMA5 crosses below EMA8, short-term bearish | KDJ weak in oversold territory (K20.9 D33.2) | Trading volume doubles
Price change: -1.8800%
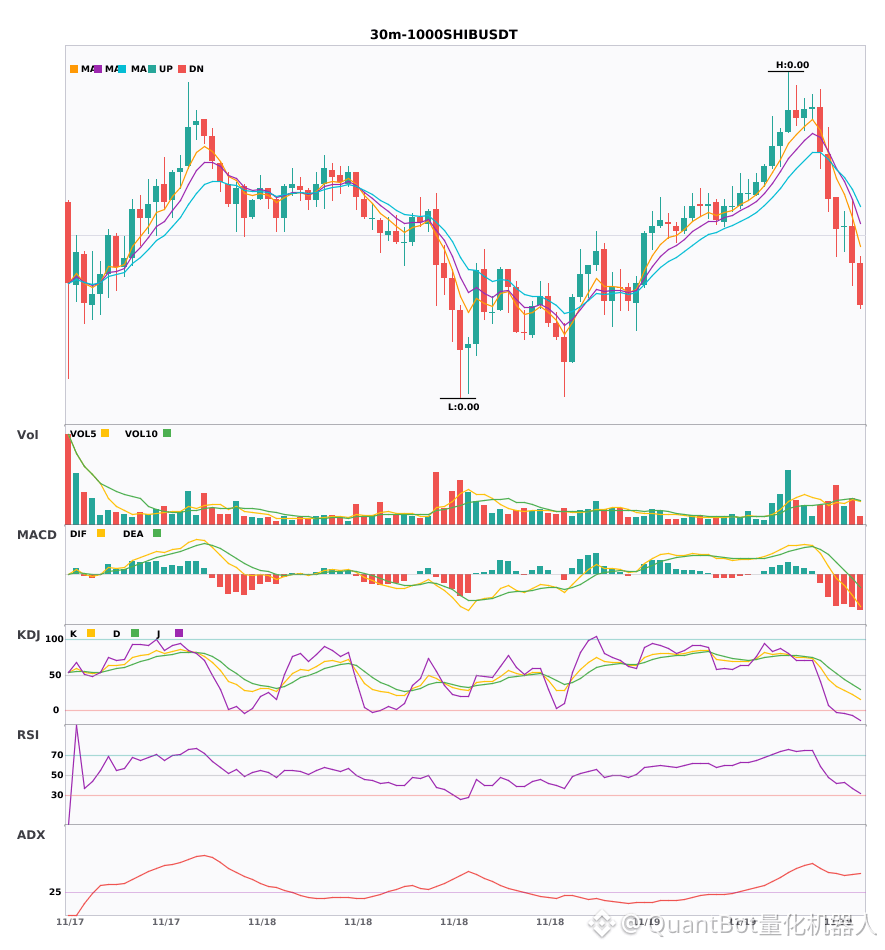
📉 $1000SHIB | 30-minute bearish signal
━━━━━━━━━━━━━━━━━━
Technical analysis: ADX(48) indicates a strong trend; beware of overheating; MACD is bearish, with weakening momentum; EMA5/8/13 are bearishly aligned; KDJ is weak (K28.0 D44.0); volume is up 1.6x.
Price change: 0.0500%
━━━━━━━━━━━━━━━━━━
#技术分析 #INTC #PLTR #1000SHIB
📌 The above content is for reference only and does not constitute investment advice
$INTC /$PLTR /$1000SHIB 30m converging bearish signals
📉 $INTC | 30-minute bearish signal
━━━━━━━━━━━━━━━━━━
Technical analysis: ADX(28) indicates a developing trend with potential trading opportunities; MACD DIF has crossed below the zero line, indicating weakening momentum; EMA5 has fallen below EMA8, suggesting a short-term bearish outlook; volume is up approximately 1.6x.
Price change: -2.4600%
📉 $PLTR | 30-minute bearish signal
━━━━━━━━━━━━━━━━━━
Technical analysis: ADX(35), a pronounced trend | MACD DIF crosses below the zero line, turning bearish | EMA5 crosses below EMA8, short-term bearish | KDJ weak in oversold territory (K20.9 D33.2) | Trading volume doubles
Price change: -1.8800%
📉 $1000SHIB | 30-minute bearish signal
━━━━━━━━━━━━━━━━━━
Technical analysis: ADX(48) indicates a strong trend; beware of overheating; MACD is bearish, with weakening momentum; EMA5/8/13 are bearishly aligned; KDJ is weak (K28.0 D44.0); volume is up 1.6x.
Price change: 0.0500%
━━━━━━━━━━━━━━━━━━
#技术分析 #INTC #PLTR #1000SHIB
📌 The above content is for reference only and does not constitute investment advice
📉 $INTC | 30-minute bearish signal
━━━━━━━━━━━━━━━━━━
Technical analysis: ADX(28) indicates a developing trend with potential trading opportunities; MACD DIF has crossed below the zero line, indicating weakening momentum; EMA5 has fallen below EMA8, suggesting a short-term bearish outlook; volume is up approximately 1.6x.
Price change: -2.4600%
📉 $PLTR | 30-minute bearish signal
━━━━━━━━━━━━━━━━━━
Technical analysis: ADX(35), a pronounced trend | MACD DIF crosses below the zero line, turning bearish | EMA5 crosses below EMA8, short-term bearish | KDJ weak in oversold territory (K20.9 D33.2) | Trading volume doubles
Price change: -1.8800%
📉 $1000SHIB | 30-minute bearish signal
━━━━━━━━━━━━━━━━━━
Technical analysis: ADX(48) indicates a strong trend; beware of overheating; MACD is bearish, with weakening momentum; EMA5/8/13 are bearishly aligned; KDJ is weak (K28.0 D44.0); volume is up 1.6x.
Price change: 0.0500%
━━━━━━━━━━━━━━━━━━
#技术分析 #INTC #PLTR #1000SHIB
📌 The above content is for reference only and does not constitute investment advice
1
·
--
$INTC/$PLTR/$1000SHIB are all weakening on the 30-minute chart—be careful 🔥
════════════════════
🟢 $INTC 30-minute bearish signal
⚠️ Technicals: The ADX trend is just taking shape and worth watching. MACD has crossed below the zero line, turning bearish. Short-term moving averages have also crossed downward. Volume is up 1.6x.
════════════════════
🟢 $PLTR 30-minute bearish signal
⚠️ Technicals: ADX at 35 signals a clear trend. The MACD histogram is expanding in the negative direction, and the moving averages are bearishly aligned and pointing down. KDJ is weak (K20.9, D33.2), with volume doubling.
════════════════════
🟢 $1000SHIB 30-minute bearish signal
⚠️ Technicals: ADX is as high as 48, indicating a very strong trend, but watch out for an overheated pullback. MACD's bearish momentum is weakening, and the moving averages have just formed a bearish alignment. KDJ is weak; K has yet to cross above D, so bears have the upper hand. Volume is up 1.6x.
════════════════════
🔔 Follow for first-hand market updates 🔔
#技术分析 #INTC #PLTR #1000SHIB
📌 When trading, watch whether the candlestick pattern confirms the signal
$INTC /$PLTR /$1000SHIB are all weakening on the 30-minute chart—be careful 🔥
════════════════════
🟢 $INTC 30-minute bearish signal
⚠️ Technicals: The ADX trend is just taking shape and worth watching. MACD has crossed below the zero line, turning bearish. Short-term moving averages have also crossed downward. Volume is up 1.6x.
════════════════════
🟢 $PLTR 30-minute bearish signal
⚠️ Technicals: ADX at 35 signals a clear trend. The MACD histogram is expanding in the negative direction, and the moving averages are bearishly aligned and pointing down. KDJ is weak (K20.9, D33.2), with volume doubling.
════════════════════
🟢 $1000SHIB 30-minute bearish signal
⚠️ Technicals: ADX is as high as 48, indicating a very strong trend, but watch out for an overheated pullback. MACD's bearish momentum is weakening, and the moving averages have just formed a bearish alignment. KDJ is weak; K has yet to cross above D, so bears have the upper hand. Volume is up 1.6x.
════════════════════
🔔 Follow for first-hand market updates 🔔
#技术分析 #INTC #PLTR #1000SHIB
📌 When trading, watch whether the candlestick pattern confirms the signal
════════════════════
🟢 $INTC 30-minute bearish signal
⚠️ Technicals: The ADX trend is just taking shape and worth watching. MACD has crossed below the zero line, turning bearish. Short-term moving averages have also crossed downward. Volume is up 1.6x.
════════════════════
🟢 $PLTR 30-minute bearish signal
⚠️ Technicals: ADX at 35 signals a clear trend. The MACD histogram is expanding in the negative direction, and the moving averages are bearishly aligned and pointing down. KDJ is weak (K20.9, D33.2), with volume doubling.
════════════════════
🟢 $1000SHIB 30-minute bearish signal
⚠️ Technicals: ADX is as high as 48, indicating a very strong trend, but watch out for an overheated pullback. MACD's bearish momentum is weakening, and the moving averages have just formed a bearish alignment. KDJ is weak; K has yet to cross above D, so bears have the upper hand. Volume is up 1.6x.
════════════════════
🔔 Follow for first-hand market updates 🔔
#技术分析 #INTC #PLTR #1000SHIB
📌 When trading, watch whether the candlestick pattern confirms the signal
11

·
--
🦈 LEGENDARY MACRO MONEY IS ROTATING HEAVY INTO $PLTR WITH A FRESH 13M BLOCK! 💥
When elite macro titans like Druckenmiller step in with an 80,100 share footprint, institutional order flow shifts instantly. Smart money leaves subtle tracks on the tape long before retail catches the wave. 📊
This fresh thirteen million capital deployment signals high-conviction positioning in enterprise AI infrastructure. Tracking where legendary capital flows gives you a front-row seat to the next major market expansion. 🔍
💬 Are you adjusting your portfolio weights to mirror elite institutional accumulation right here? 👇
⚠️ Not financial advice. Always manage your risk. 🛡️
🏷️ #PLTR #SmartMoney #InstitutionalFlow #Macro #Equities
🔥 💎
🦈 LEGENDARY MACRO MONEY IS ROTATING HEAVY INTO $PLTR WITH A FRESH 13M BLOCK! 💥
When elite macro titans like Druckenmiller step in with an 80,100 share footprint, institutional order flow shifts instantly. Smart money leaves subtle tracks on the tape long before retail catches the wave. 📊
This fresh thirteen million capital deployment signals high-conviction positioning in enterprise AI infrastructure. Tracking where legendary capital flows gives you a front-row seat to the next major market expansion. 🔍
💬 Are you adjusting your portfolio weights to mirror elite institutional accumulation right here? 👇
⚠️ Not financial advice. Always manage your risk. 🛡️
🏷️ #PLTR #SmartMoney #InstitutionalFlow #Macro #Equities
🔥 💎
When elite macro titans like Druckenmiller step in with an 80,100 share footprint, institutional order flow shifts instantly. Smart money leaves subtle tracks on the tape long before retail catches the wave. 📊
This fresh thirteen million capital deployment signals high-conviction positioning in enterprise AI infrastructure. Tracking where legendary capital flows gives you a front-row seat to the next major market expansion. 🔍
💬 Are you adjusting your portfolio weights to mirror elite institutional accumulation right here? 👇
⚠️ Not financial advice. Always manage your risk. 🛡️
🏷️ #PLTR #SmartMoney #InstitutionalFlow #Macro #Equities
🔥 💎


5
·
--
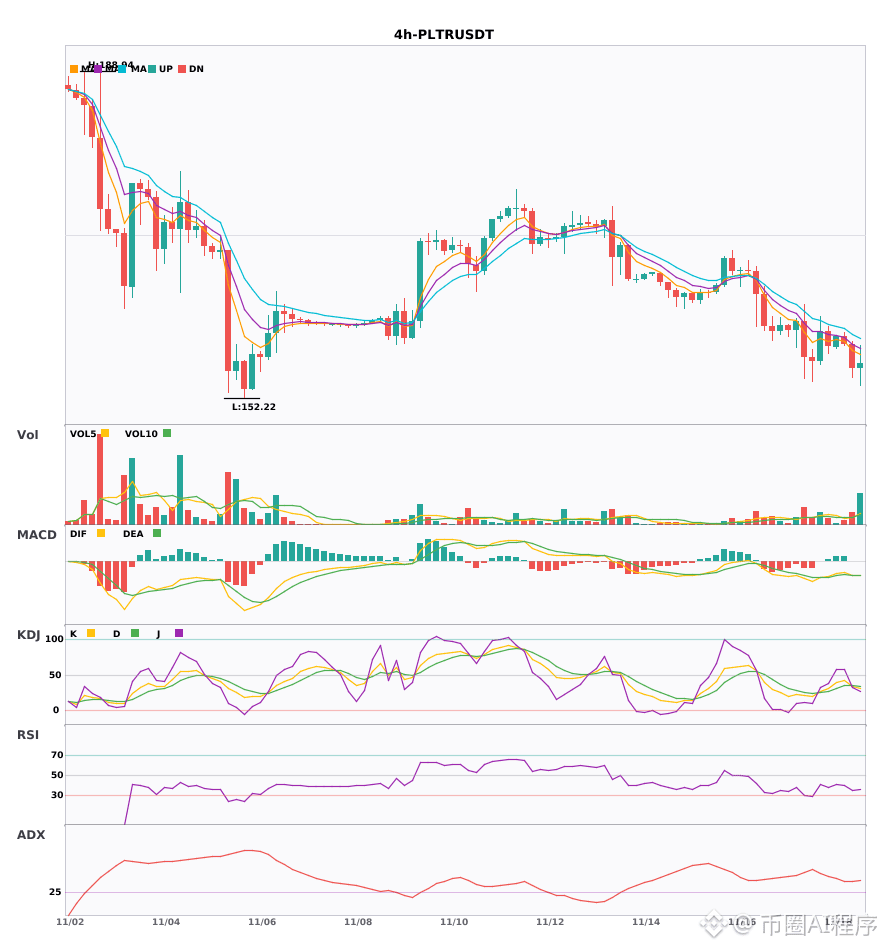
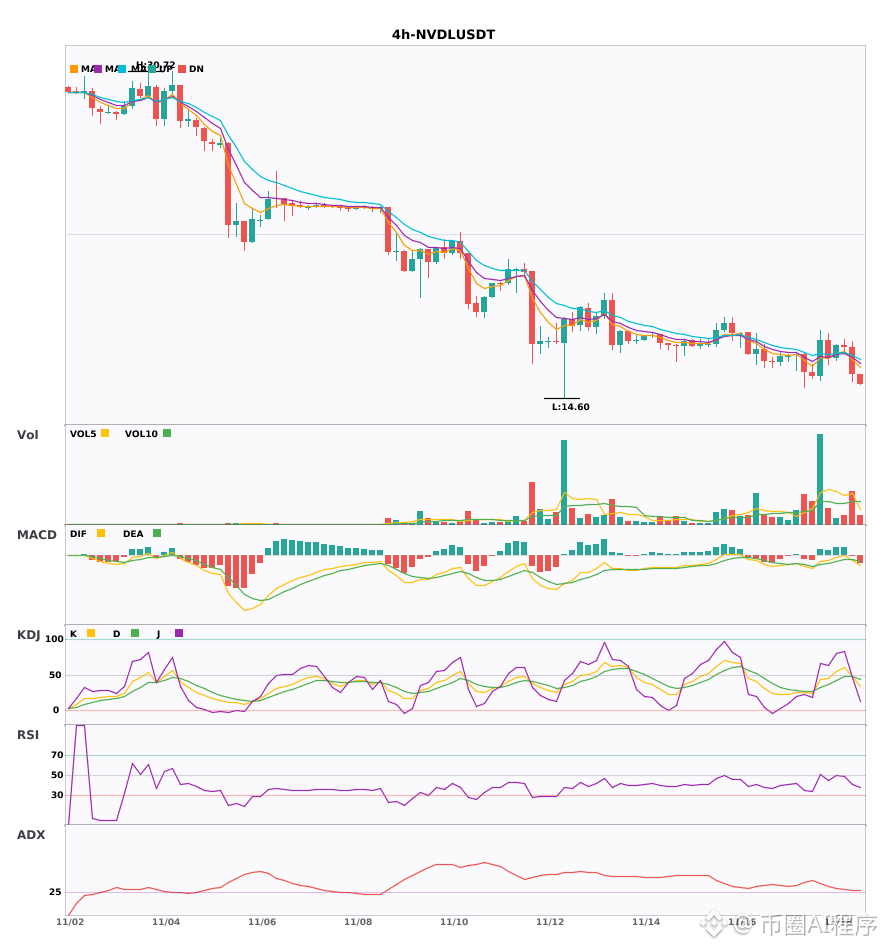
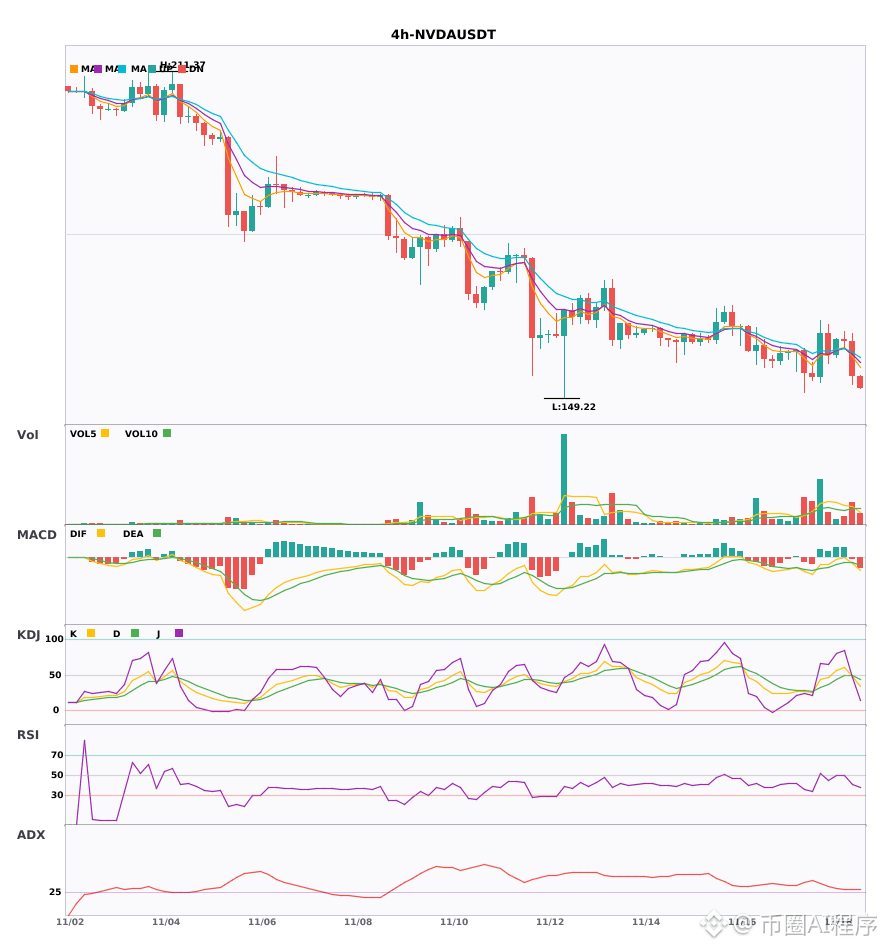
$PLTR/$NVDL/$NVDA 4-hour short signal emerged; daily bearish trend confirmed 🔥
════════════════════
🟢 $PLTR 4-hour bearish signal
⚠️Technical analysis: The 4-hour MACD has formed a death cross below zero with rising volume and is moving downward. The moving averages are bearishly aligned and diverging downward. The KDJ has formed a death cross but is not yet oversold. Combined with confirmation from the daily bearish trend, the short-term outlook is bearish.
════════════════════
🟢 $NVDL 4-hour bearish signal
⚠️Technical analysis: 4-hour bearish signal, confirmed by the daily bearish trend! The MACD death cross comes with rising volume; the moving averages are bearishly aligned and diverging downward. The KDJ has formed a death cross but is not oversold, and trading volume is increasing moderately. Short-term short position.
════════════════════
🟢 $NVDA 4-hour bearish signal
⚠️Technical analysis: 4-hour entry + confirmation from the daily bearish trend! The MACD death cross is accelerating bearish momentum, the moving averages are bearishly aligned, and the KDJ has formed a death cross but is not oversold. Volume is normal.
════════════════════
🔔 Follow for first-hand market alerts 🔔
#多周期共振 #PLTR #NVDL #NVDA
📌 When trading, pay attention to whether the candlestick pattern aligns
$PLTR /$NVDL /$NVDA 4-hour short signal emerged; daily bearish trend confirmed 🔥
════════════════════
🟢 $PLTR 4-hour bearish signal
⚠️Technical analysis: The 4-hour MACD has formed a death cross below zero with rising volume and is moving downward. The moving averages are bearishly aligned and diverging downward. The KDJ has formed a death cross but is not yet oversold. Combined with confirmation from the daily bearish trend, the short-term outlook is bearish.
════════════════════
🟢 $NVDL 4-hour bearish signal
⚠️Technical analysis: 4-hour bearish signal, confirmed by the daily bearish trend! The MACD death cross comes with rising volume; the moving averages are bearishly aligned and diverging downward. The KDJ has formed a death cross but is not oversold, and trading volume is increasing moderately. Short-term short position.
════════════════════
🟢 $NVDA 4-hour bearish signal
⚠️Technical analysis: 4-hour entry + confirmation from the daily bearish trend! The MACD death cross is accelerating bearish momentum, the moving averages are bearishly aligned, and the KDJ has formed a death cross but is not oversold. Volume is normal.
════════════════════
🔔 Follow for first-hand market alerts 🔔
#多周期共振 #PLTR #NVDL #NVDA
📌 When trading, pay attention to whether the candlestick pattern aligns
════════════════════
🟢 $PLTR 4-hour bearish signal
⚠️Technical analysis: The 4-hour MACD has formed a death cross below zero with rising volume and is moving downward. The moving averages are bearishly aligned and diverging downward. The KDJ has formed a death cross but is not yet oversold. Combined with confirmation from the daily bearish trend, the short-term outlook is bearish.
════════════════════
🟢 $NVDL 4-hour bearish signal
⚠️Technical analysis: 4-hour bearish signal, confirmed by the daily bearish trend! The MACD death cross comes with rising volume; the moving averages are bearishly aligned and diverging downward. The KDJ has formed a death cross but is not oversold, and trading volume is increasing moderately. Short-term short position.
════════════════════
🟢 $NVDA 4-hour bearish signal
⚠️Technical analysis: 4-hour entry + confirmation from the daily bearish trend! The MACD death cross is accelerating bearish momentum, the moving averages are bearishly aligned, and the KDJ has formed a death cross but is not oversold. Volume is normal.
════════════════════
🔔 Follow for first-hand market alerts 🔔
#多周期共振 #PLTR #NVDL #NVDA
📌 When trading, pay attention to whether the candlestick pattern aligns
5
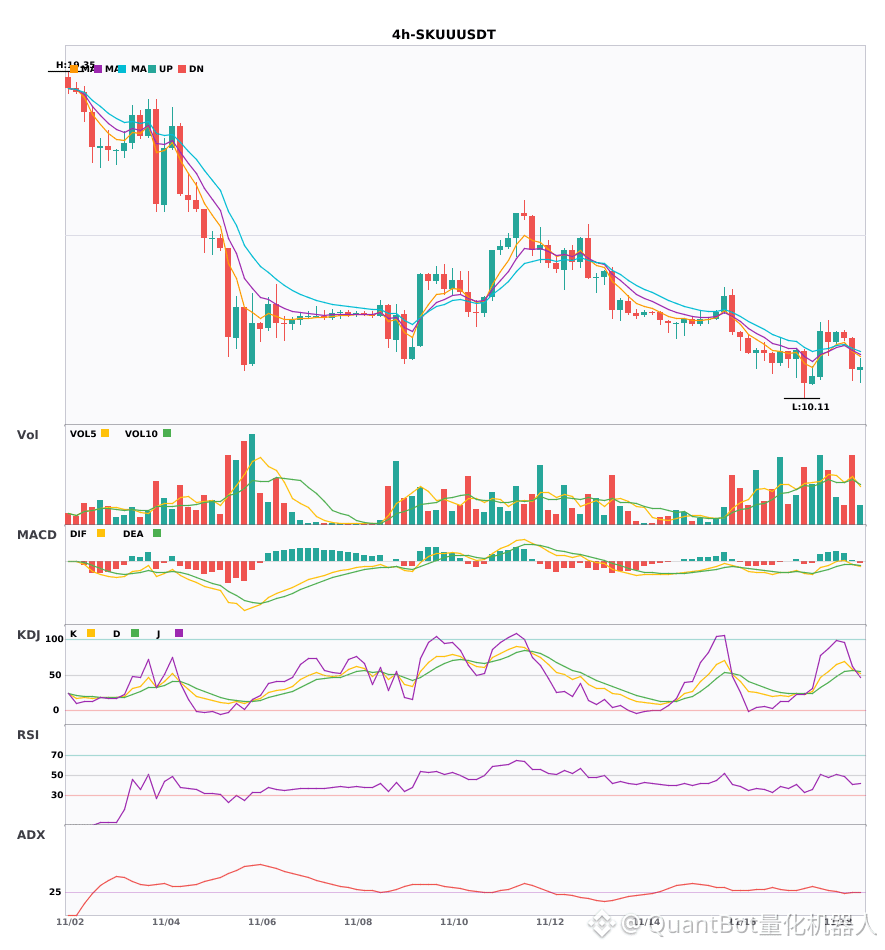
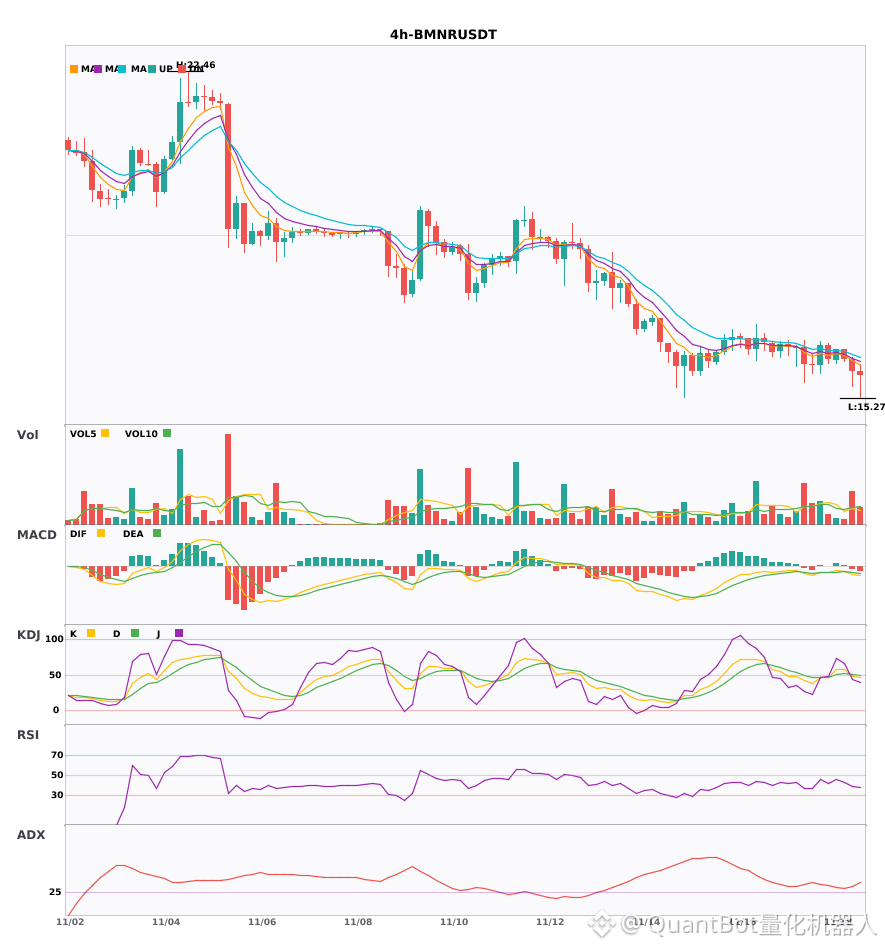
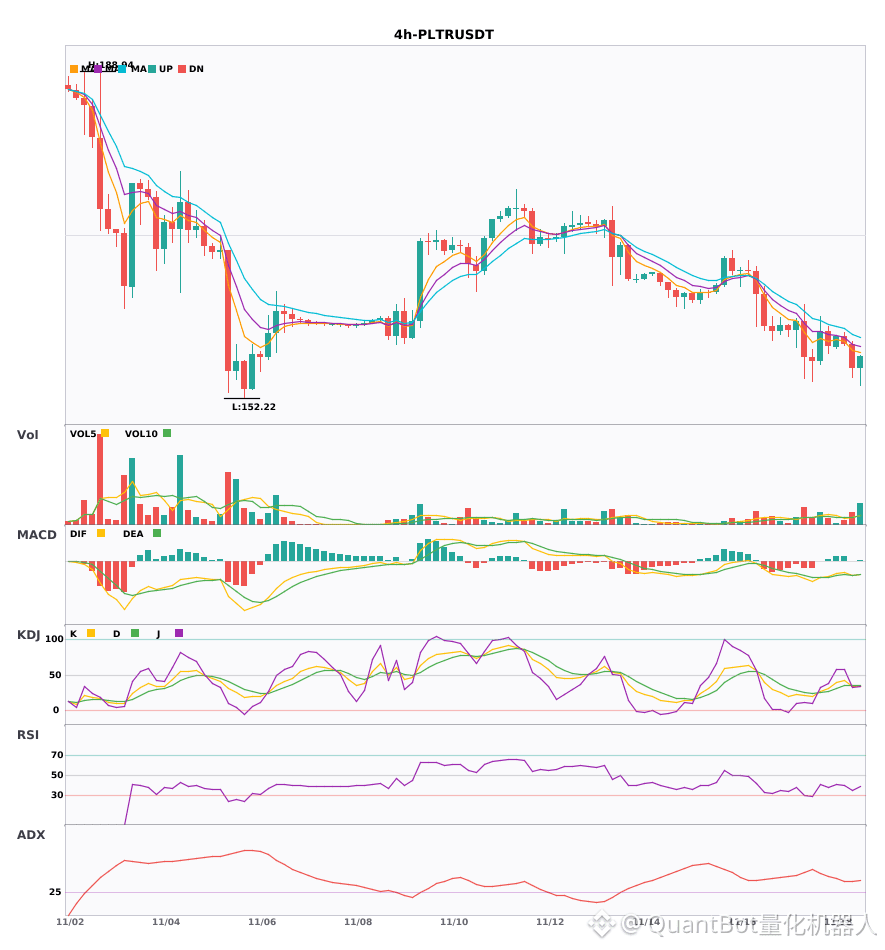
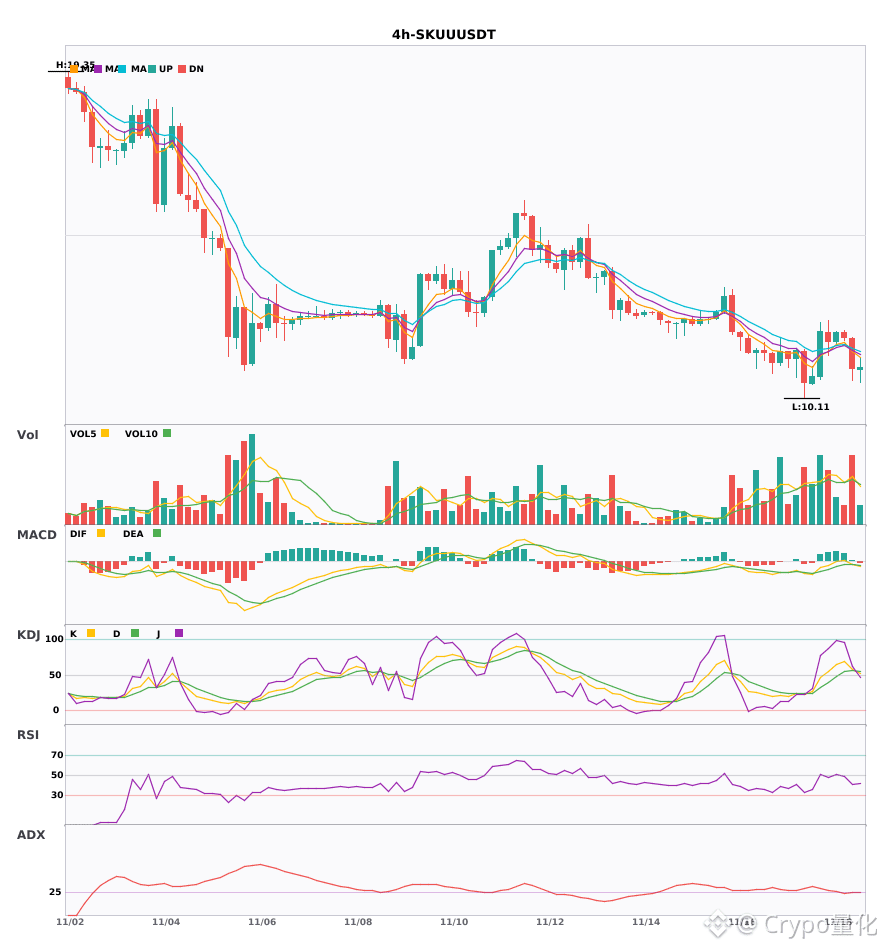
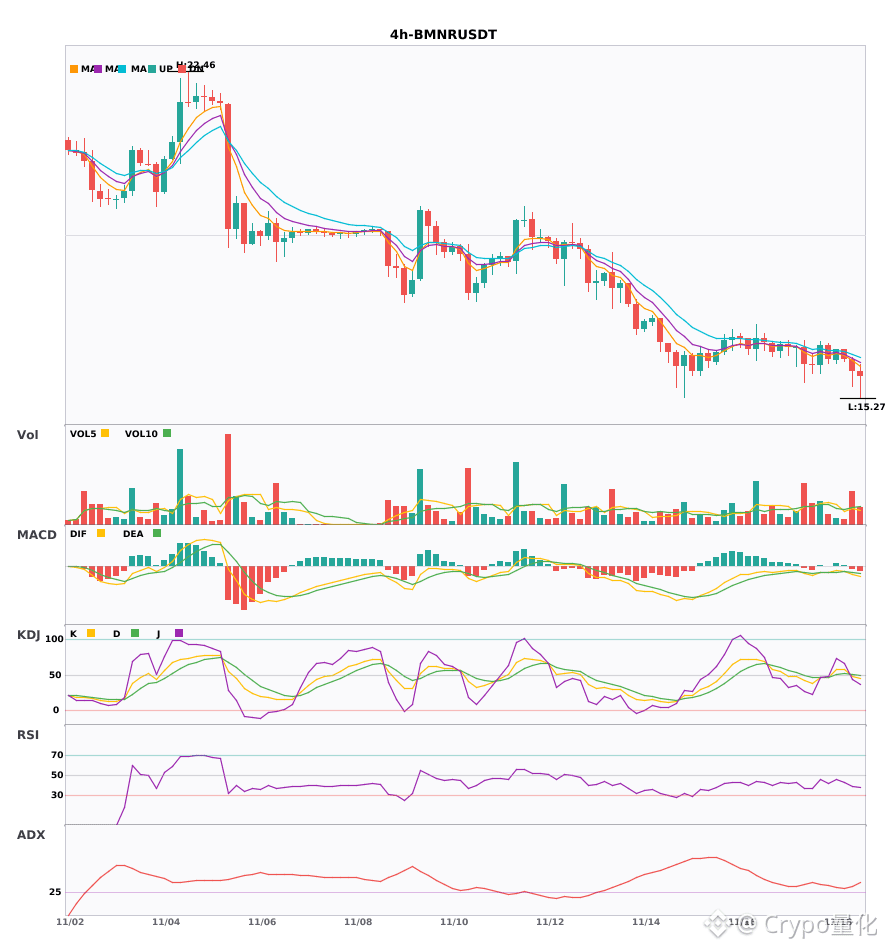
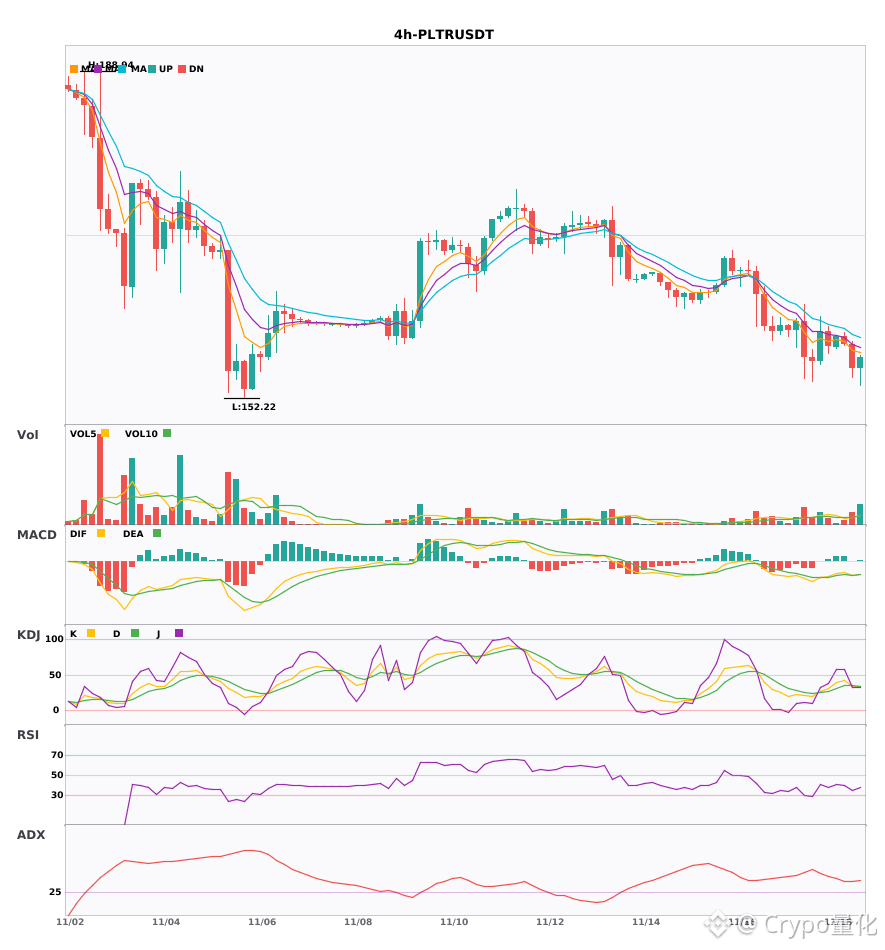
$SKUU/$BMNR/$PLTR 4H Bearish convergence, short signal
📉 $SKUU | 4-hour short signal
━━━━━━━━━━━━━━━━━━
Technical analysis: ADX(26) indicates an emerging trend; potential entry. MACD DIF has fallen below the zero line, turning bearish. EMA5 crossed below EMA8, indicating short-term weakness. KDJ is strong, with buyers in control (K58.1 D56.1). Volume increased 1.5x.
Price change: -7.3700%
📉 $BMNR | 4-hour short signal
━━━━━━━━━━━━━━━━━━
Technical analysis: ADX30 indicates an established trend; potential entry. MACD bearish crossover below zero. EMA5<8<13 in bearish alignment. KDJ bearish crossover. Volume increased 1.9x, favoring bears.
Price change: -1.6700%
📉 $PLTR | 4-hour short signal
━━━━━━━━━━━━━━━━━━
Technical analysis: ADX(37) indicates a strong trend. MACD bearish crossover below zero, with weakening momentum. EMAs in bearish alignment. KDJ bearish crossover (K34.2/D34.7), suggesting short-term weakness. Volume increased 1.6x.
Price change: -1.6900%
━━━━━━━━━━━━━━━━━━
#技术分析 #SKUU #BMNR #PLTR
📌 The above content is for reference only and does not constitute investment advice
$SKUU /$BMNR /$PLTR 4H Bearish convergence, short signal
📉 $SKUU | 4-hour short signal
━━━━━━━━━━━━━━━━━━
Technical analysis: ADX(26) indicates an emerging trend; potential entry. MACD DIF has fallen below the zero line, turning bearish. EMA5 crossed below EMA8, indicating short-term weakness. KDJ is strong, with buyers in control (K58.1 D56.1). Volume increased 1.5x.
Price change: -7.3700%
📉 $BMNR | 4-hour short signal
━━━━━━━━━━━━━━━━━━
Technical analysis: ADX30 indicates an established trend; potential entry. MACD bearish crossover below zero. EMA5<8<13 in bearish alignment. KDJ bearish crossover. Volume increased 1.9x, favoring bears.
Price change: -1.6700%
📉 $PLTR | 4-hour short signal
━━━━━━━━━━━━━━━━━━
Technical analysis: ADX(37) indicates a strong trend. MACD bearish crossover below zero, with weakening momentum. EMAs in bearish alignment. KDJ bearish crossover (K34.2/D34.7), suggesting short-term weakness. Volume increased 1.6x.
Price change: -1.6900%
━━━━━━━━━━━━━━━━━━
#技术分析 #SKUU #BMNR #PLTR
📌 The above content is for reference only and does not constitute investment advice
📉 $SKUU | 4-hour short signal
━━━━━━━━━━━━━━━━━━
Technical analysis: ADX(26) indicates an emerging trend; potential entry. MACD DIF has fallen below the zero line, turning bearish. EMA5 crossed below EMA8, indicating short-term weakness. KDJ is strong, with buyers in control (K58.1 D56.1). Volume increased 1.5x.
Price change: -7.3700%
📉 $BMNR | 4-hour short signal
━━━━━━━━━━━━━━━━━━
Technical analysis: ADX30 indicates an established trend; potential entry. MACD bearish crossover below zero. EMA5<8<13 in bearish alignment. KDJ bearish crossover. Volume increased 1.9x, favoring bears.
Price change: -1.6700%
📉 $PLTR | 4-hour short signal
━━━━━━━━━━━━━━━━━━
Technical analysis: ADX(37) indicates a strong trend. MACD bearish crossover below zero, with weakening momentum. EMAs in bearish alignment. KDJ bearish crossover (K34.2/D34.7), suggesting short-term weakness. Volume increased 1.6x.
Price change: -1.6900%
━━━━━━━━━━━━━━━━━━
#技术分析 #SKUU #BMNR #PLTR
📌 The above content is for reference only and does not constitute investment advice
17
·
--
4-hour chart issues a bearish signal: $SKUU $BMNR $PLTR🔥
════════════════════
🟢 $SKUU 4-hour bearish signal
⚠️Technical analysis: The ADX trend is just getting started and can be followed; MACD has fallen below the zero line, turning bearish; EMA5 has crossed below EMA8, indicating bearish momentum; K has crossed above D on the KDJ, giving bulls the edge; volume is up 1.5x.
════════════════════
🟢 $BMNR 4-hour bearish signal
⚠️Technical analysis: The ADX trend is established and can be traded; the MACD death cross below zero is accelerating bearish momentum; the moving averages are diverging bearishly; the KDJ death cross signals short-term bearish momentum; volume is up 1.9x.
════════════════════
🟢 $PLTR 4-hour bearish signal
⚠️Technical analysis: ADX at 37 signals a clear trend; the MACD death cross below zero is accelerating bearish momentum; the moving averages are in a bearish alignment; the KDJ death cross has not reached oversold territory; trading volume is up 1.6x.
════════════════════
🔔 Follow for first-hand market updates 🔔
#技术分析 #SKUU #BMNR #PLTR
📌 When trading, pay attention to whether the candlestick pattern aligns.
4-hour chart issues a bearish signal: $SKUU $BMNR $PLTR 🔥
════════════════════
🟢 $SKUU 4-hour bearish signal
⚠️Technical analysis: The ADX trend is just getting started and can be followed; MACD has fallen below the zero line, turning bearish; EMA5 has crossed below EMA8, indicating bearish momentum; K has crossed above D on the KDJ, giving bulls the edge; volume is up 1.5x.
════════════════════
🟢 $BMNR 4-hour bearish signal
⚠️Technical analysis: The ADX trend is established and can be traded; the MACD death cross below zero is accelerating bearish momentum; the moving averages are diverging bearishly; the KDJ death cross signals short-term bearish momentum; volume is up 1.9x.
════════════════════
🟢 $PLTR 4-hour bearish signal
⚠️Technical analysis: ADX at 37 signals a clear trend; the MACD death cross below zero is accelerating bearish momentum; the moving averages are in a bearish alignment; the KDJ death cross has not reached oversold territory; trading volume is up 1.6x.
════════════════════
🔔 Follow for first-hand market updates 🔔
#技术分析 #SKUU #BMNR #PLTR
📌 When trading, pay attention to whether the candlestick pattern aligns.
════════════════════
🟢 $SKUU 4-hour bearish signal
⚠️Technical analysis: The ADX trend is just getting started and can be followed; MACD has fallen below the zero line, turning bearish; EMA5 has crossed below EMA8, indicating bearish momentum; K has crossed above D on the KDJ, giving bulls the edge; volume is up 1.5x.
════════════════════
🟢 $BMNR 4-hour bearish signal
⚠️Technical analysis: The ADX trend is established and can be traded; the MACD death cross below zero is accelerating bearish momentum; the moving averages are diverging bearishly; the KDJ death cross signals short-term bearish momentum; volume is up 1.9x.
════════════════════
🟢 $PLTR 4-hour bearish signal
⚠️Technical analysis: ADX at 37 signals a clear trend; the MACD death cross below zero is accelerating bearish momentum; the moving averages are in a bearish alignment; the KDJ death cross has not reached oversold territory; trading volume is up 1.6x.
════════════════════
🔔 Follow for first-hand market updates 🔔
#技术分析 #SKUU #BMNR #PLTR
📌 When trading, pay attention to whether the candlestick pattern aligns.
8
·
--
$PLTR Canada-US joint crackdown on authorized phishing scams 🔥
════════════════════
🔴 $PLTR Canada-US joint crackdown on authorized phishing scams — short-term bullish
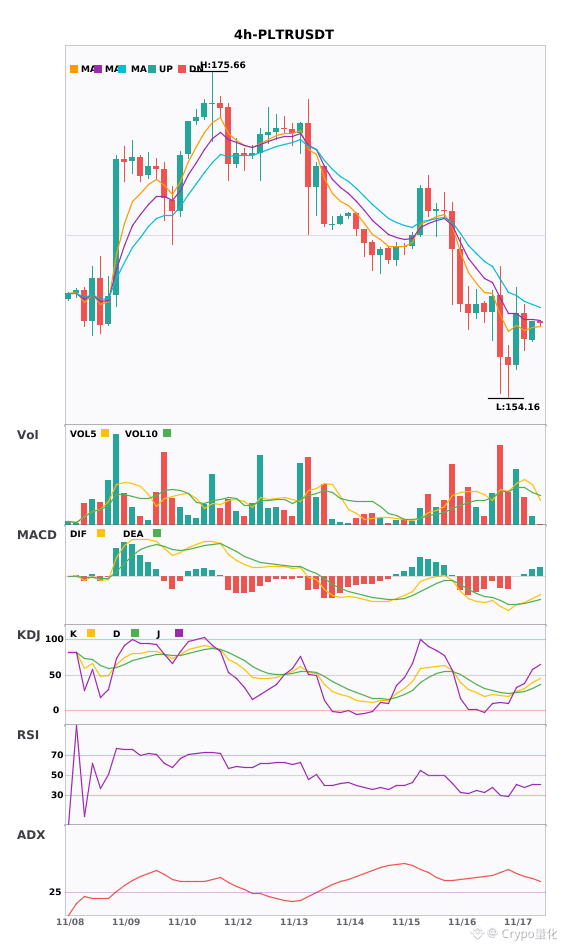
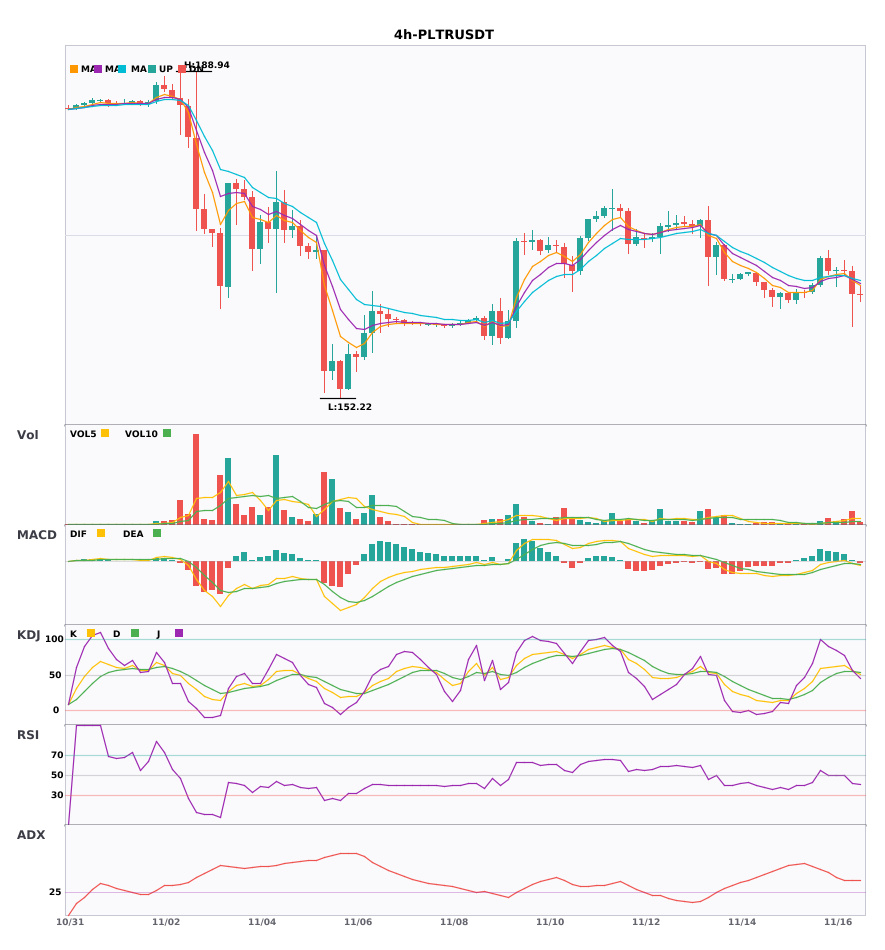
⚠️Technical analysis: PLTR is currently at 159.09, down slightly by 0.41% over the past 24 hours. Overall, it remains in a corrective phase with a bearish alignment on the daily chart. The daily ADX is as high as 35.7, indicating that the downtrend still has momentum. However, a bullish alignment has just formed on the 1-hour chart, showing signs of short-term stabilization. The 4-hour volume ratio is only 0.01, though, indicating extremely low trading volume, so the rebound lacks buying support. The key support below is 152.22; holding this level could lead to a bottom forming. The resistance above at 195.31 is far away, making a short-term breakout difficult. The price will most likely fluctuate and consolidate around the support level.
📢Market developments: The Canada-US joint crackdown on authorized phishing scams highlights the urgent government demand for cybersecurity and anti-fraud technologies. This benefits data intelligence and analytics platforms like Palantir, and market expectations for its public- and private-sector security contracts are rising, giving sentiment a positive tilt.
════════════════════
🔔 Follow for the latest market movements 🔔
#技术分析 #加美联合打击授权钓鱼诈骗 #PLTR
📌 When trading, pay attention to whether the candlestick pattern meets the criteria
$PLTR Canada-US joint crackdown on authorized phishing scams 🔥
════════════════════
🔴 $PLTR Canada-US joint crackdown on authorized phishing scams — short-term bullish
⚠️Technical analysis: PLTR is currently at 159.09, down slightly by 0.41% over the past 24 hours. Overall, it remains in a corrective phase with a bearish alignment on the daily chart. The daily ADX is as high as 35.7, indicating that the downtrend still has momentum. However, a bullish alignment has just formed on the 1-hour chart, showing signs of short-term stabilization. The 4-hour volume ratio is only 0.01, though, indicating extremely low trading volume, so the rebound lacks buying support. The key support below is 152.22; holding this level could lead to a bottom forming. The resistance above at 195.31 is far away, making a short-term breakout difficult. The price will most likely fluctuate and consolidate around the support level.
📢Market developments: The Canada-US joint crackdown on authorized phishing scams highlights the urgent government demand for cybersecurity and anti-fraud technologies. This benefits data intelligence and analytics platforms like Palantir, and market expectations for its public- and private-sector security contracts are rising, giving sentiment a positive tilt.
════════════════════
🔔 Follow for the latest market movements 🔔
#技术分析 #加美联合打击授权钓鱼诈骗 #PLTR
📌 When trading, pay attention to whether the candlestick pattern meets the criteria
════════════════════
🔴 $PLTR Canada-US joint crackdown on authorized phishing scams — short-term bullish
⚠️Technical analysis: PLTR is currently at 159.09, down slightly by 0.41% over the past 24 hours. Overall, it remains in a corrective phase with a bearish alignment on the daily chart. The daily ADX is as high as 35.7, indicating that the downtrend still has momentum. However, a bullish alignment has just formed on the 1-hour chart, showing signs of short-term stabilization. The 4-hour volume ratio is only 0.01, though, indicating extremely low trading volume, so the rebound lacks buying support. The key support below is 152.22; holding this level could lead to a bottom forming. The resistance above at 195.31 is far away, making a short-term breakout difficult. The price will most likely fluctuate and consolidate around the support level.
📢Market developments: The Canada-US joint crackdown on authorized phishing scams highlights the urgent government demand for cybersecurity and anti-fraud technologies. This benefits data intelligence and analytics platforms like Palantir, and market expectations for its public- and private-sector security contracts are rising, giving sentiment a positive tilt.
════════════════════
🔔 Follow for the latest market movements 🔔
#技术分析 #加美联合打击授权钓鱼诈骗 #PLTR
📌 When trading, pay attention to whether the candlestick pattern meets the criteria
2
55
·
--
$0G $PLTR $SNXX 30 minutes resonance turned upward, multiple bullish signals firing🔥
════════════════════
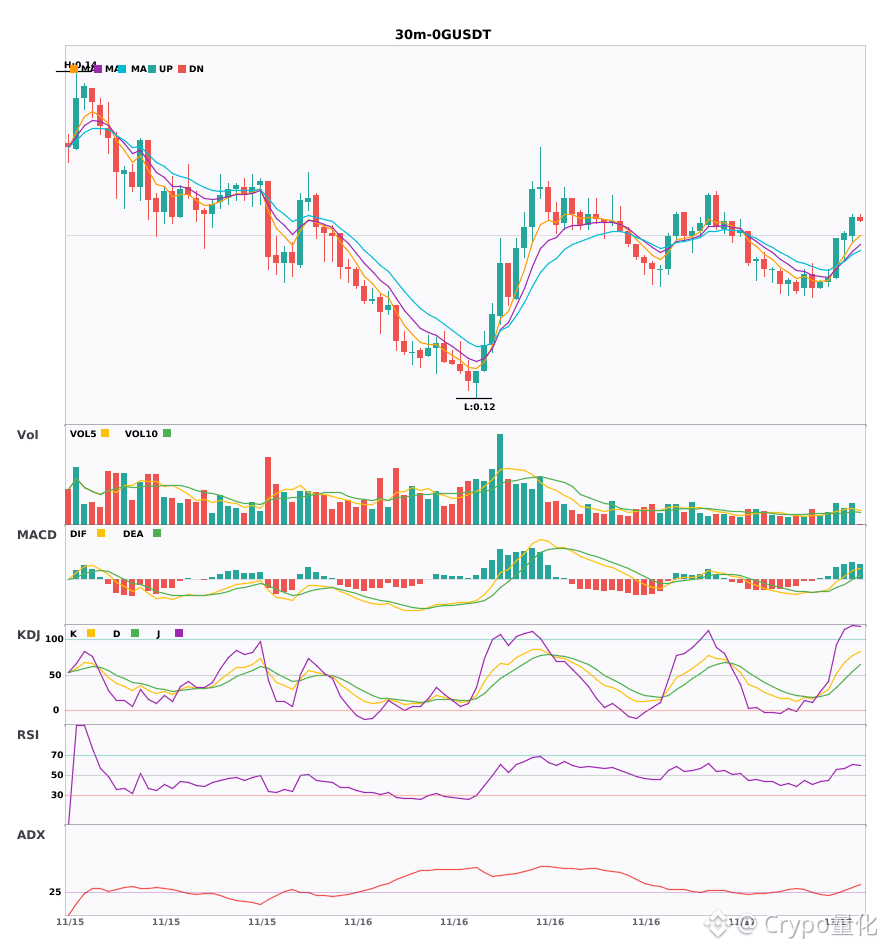
🔴 $0G 30-minute bullish signal
⚠️Technical analysis: ADX is strengthening and the trend is obvious, MACD has formed a golden cross and DIF has moved above the zero axis to turn bullish, moving averages are in a bullish alignment and diverging upward, trading volume has increased to nearly 2x, momentum is good.
════════════════════
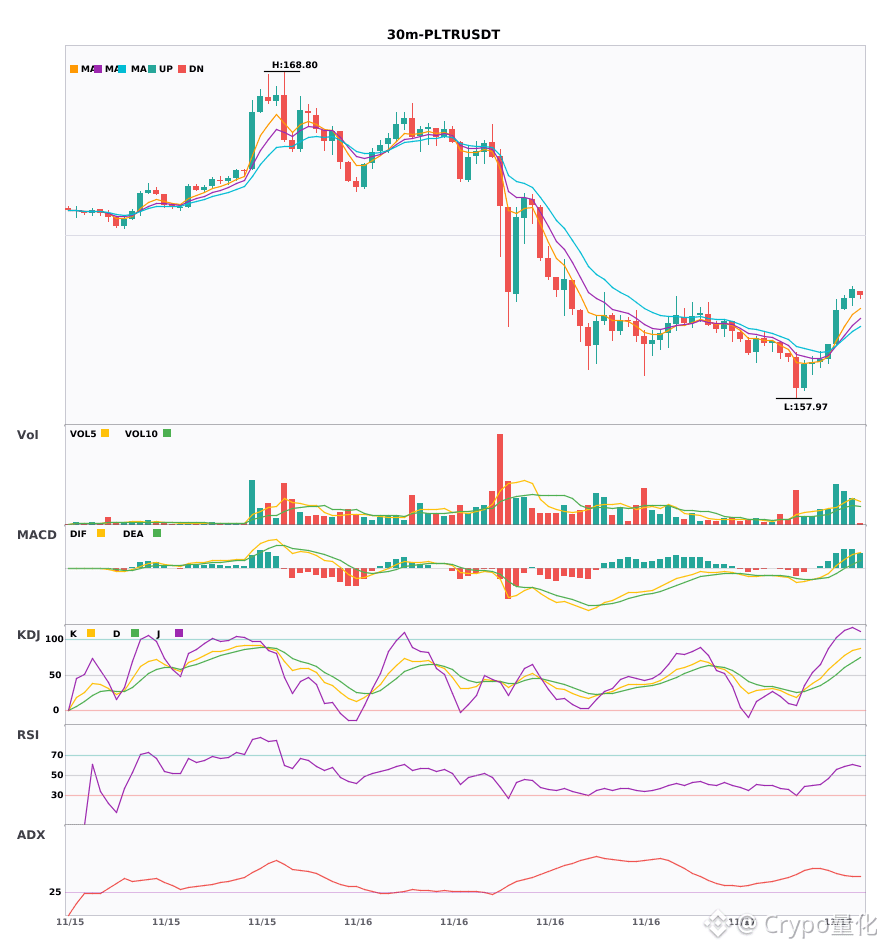
🔴 $PLTR 30-minute bullish signal
⚠️Technical analysis: ADX(46) trend is extremely strong, beware of overheating pullback | MACD golden cross with increased volume, red bars continue to expand | Moving averages are in a bullish alignment and diverging upward | KDJ K crosses above D and has not entered the overbought zone, bulls have the upper hand | Trading volume has surged to nearly 3x
════════════════════
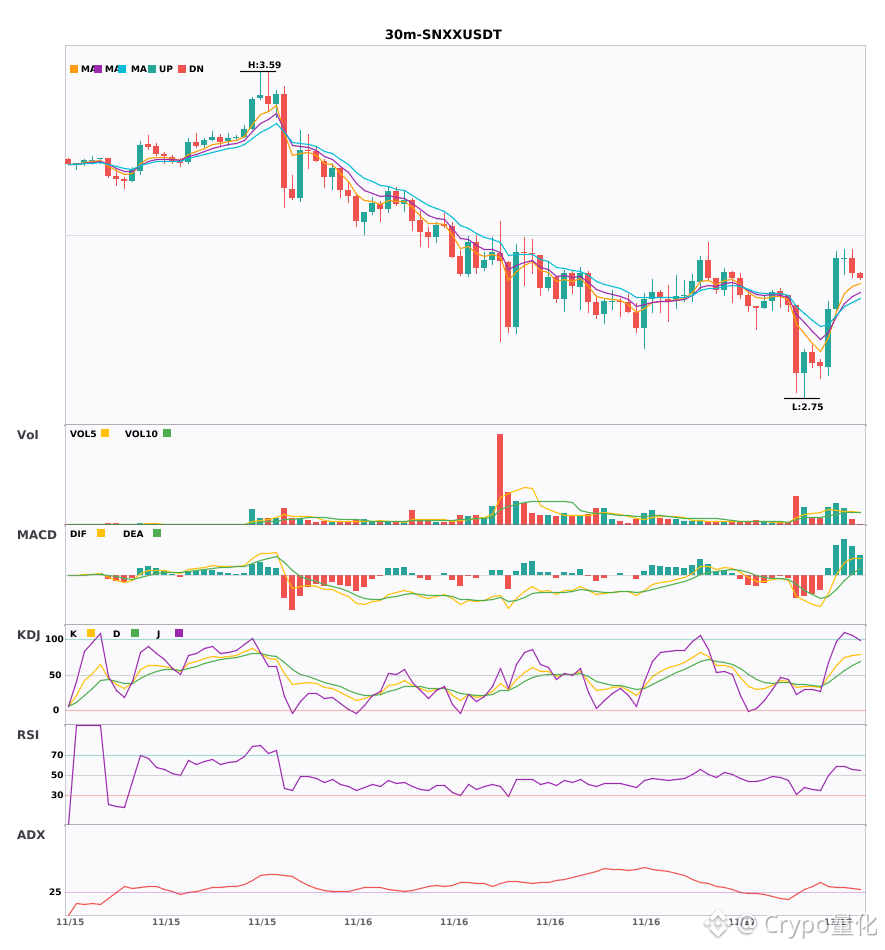
🔴 $SNXX 30-minute bullish signal
⚠️Technical analysis: ADX shows a clear trending market, MACD golden cross followed by continuously expanding red bars, moving averages have just formed a bullish alignment and are diverging upward, K crosses above D and has not entered the overbought zone, trading volume has increased 2x, bulls have the upper hand.
════════════════════
🔔 Follow to get the latest market moves first hand 🔔
#技术分析 #0G #PLTR #SNXX
📌 When trading, pay attention to whether the candlestick pattern matches
$0G $PLTR $SNXX 30 minutes resonance turned upward, multiple bullish signals firing🔥
════════════════════
🔴 $0G 30-minute bullish signal
⚠️Technical analysis: ADX is strengthening and the trend is obvious, MACD has formed a golden cross and DIF has moved above the zero axis to turn bullish, moving averages are in a bullish alignment and diverging upward, trading volume has increased to nearly 2x, momentum is good.
════════════════════
🔴 $PLTR 30-minute bullish signal
⚠️Technical analysis: ADX(46) trend is extremely strong, beware of overheating pullback | MACD golden cross with increased volume, red bars continue to expand | Moving averages are in a bullish alignment and diverging upward | KDJ K crosses above D and has not entered the overbought zone, bulls have the upper hand | Trading volume has surged to nearly 3x
════════════════════
🔴 $SNXX 30-minute bullish signal
⚠️Technical analysis: ADX shows a clear trending market, MACD golden cross followed by continuously expanding red bars, moving averages have just formed a bullish alignment and are diverging upward, K crosses above D and has not entered the overbought zone, trading volume has increased 2x, bulls have the upper hand.
════════════════════
🔔 Follow to get the latest market moves first hand 🔔
#技术分析 #0G #PLTR #SNXX
📌 When trading, pay attention to whether the candlestick pattern matches
════════════════════
🔴 $0G 30-minute bullish signal
⚠️Technical analysis: ADX is strengthening and the trend is obvious, MACD has formed a golden cross and DIF has moved above the zero axis to turn bullish, moving averages are in a bullish alignment and diverging upward, trading volume has increased to nearly 2x, momentum is good.
════════════════════
🔴 $PLTR 30-minute bullish signal
⚠️Technical analysis: ADX(46) trend is extremely strong, beware of overheating pullback | MACD golden cross with increased volume, red bars continue to expand | Moving averages are in a bullish alignment and diverging upward | KDJ K crosses above D and has not entered the overbought zone, bulls have the upper hand | Trading volume has surged to nearly 3x
════════════════════
🔴 $SNXX 30-minute bullish signal
⚠️Technical analysis: ADX shows a clear trending market, MACD golden cross followed by continuously expanding red bars, moving averages have just formed a bullish alignment and are diverging upward, K crosses above D and has not entered the overbought zone, trading volume has increased 2x, bulls have the upper hand.
════════════════════
🔔 Follow to get the latest market moves first hand 🔔
#技术分析 #0G #PLTR #SNXX
📌 When trading, pay attention to whether the candlestick pattern matches
17
·
--
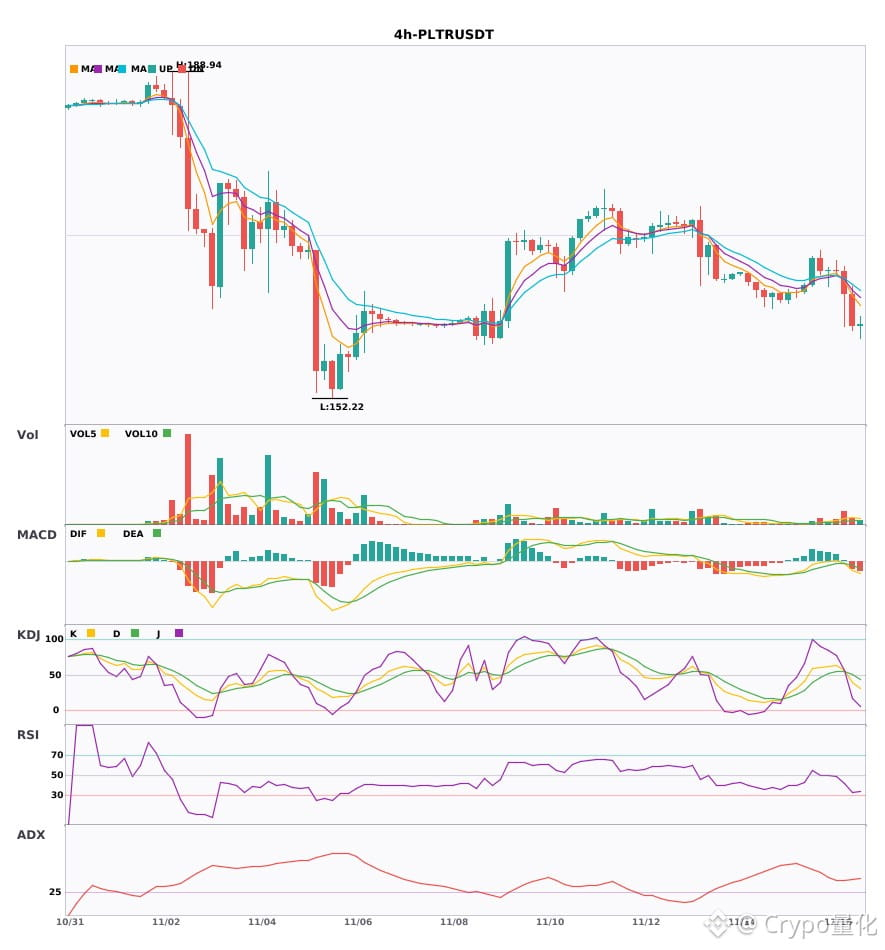
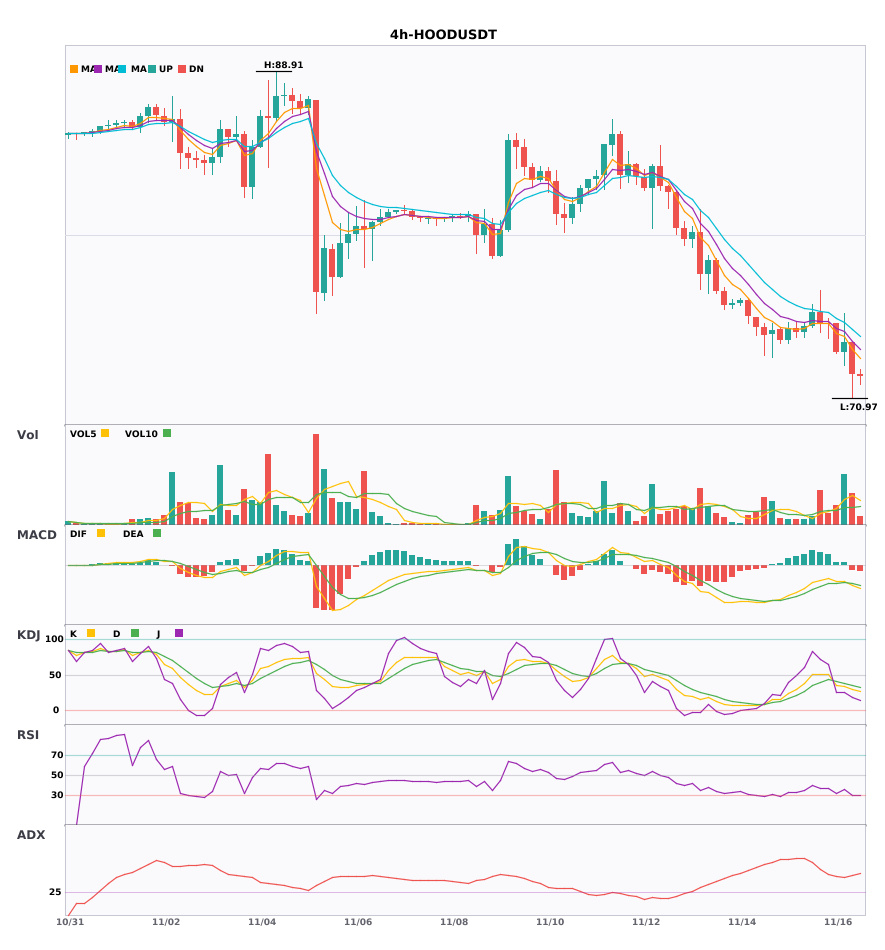
$PLTR $HOOD 4 hours bearish, under short-term pressure—don't rush to get in 🔥
════════════════════
🟢 $PLTR 4-hour bearish signal
⚠️Technical analysis: ADX (42) shows a clear trend; MACD has a bearish cross below zero, with bears gaining strength; moving averages are in bearish alignment; KDJ has a bearish cross, with K crossing below D and not yet oversold; volume is up 3.5x, a bearish sign
════════════════════
🟢 $HOOD 4-hour bearish signal
⚠️Technical analysis: ADX has surged to 43, indicating a very strong trend; MACD has a bearish cross below zero, accelerating bearish momentum; moving averages are trending downward in bearish alignment; KDJ is weak, with bears in control; volume has exploded to 2.9x, with heavy selling pressure.
════════════════════
🔔 Follow for first-hand market updates 🔔
#技术分析 #PLTR #HOOD
📌 When trading, pay attention to whether the candlestick pattern confirms the setup
$PLTR $HOOD 4 hours bearish, under short-term pressure—don't rush to get in 🔥
════════════════════
🟢 $PLTR 4-hour bearish signal
⚠️Technical analysis: ADX (42) shows a clear trend; MACD has a bearish cross below zero, with bears gaining strength; moving averages are in bearish alignment; KDJ has a bearish cross, with K crossing below D and not yet oversold; volume is up 3.5x, a bearish sign
════════════════════
🟢 $HOOD 4-hour bearish signal
⚠️Technical analysis: ADX has surged to 43, indicating a very strong trend; MACD has a bearish cross below zero, accelerating bearish momentum; moving averages are trending downward in bearish alignment; KDJ is weak, with bears in control; volume has exploded to 2.9x, with heavy selling pressure.
════════════════════
🔔 Follow for first-hand market updates 🔔
#技术分析 #PLTR #HOOD
📌 When trading, pay attention to whether the candlestick pattern confirms the setup
════════════════════
🟢 $PLTR 4-hour bearish signal
⚠️Technical analysis: ADX (42) shows a clear trend; MACD has a bearish cross below zero, with bears gaining strength; moving averages are in bearish alignment; KDJ has a bearish cross, with K crossing below D and not yet oversold; volume is up 3.5x, a bearish sign
════════════════════
🟢 $HOOD 4-hour bearish signal
⚠️Technical analysis: ADX has surged to 43, indicating a very strong trend; MACD has a bearish cross below zero, accelerating bearish momentum; moving averages are trending downward in bearish alignment; KDJ is weak, with bears in control; volume has exploded to 2.9x, with heavy selling pressure.
════════════════════
🔔 Follow for first-hand market updates 🔔
#技术分析 #PLTR #HOOD
📌 When trading, pay attention to whether the candlestick pattern confirms the setup
2
·
--
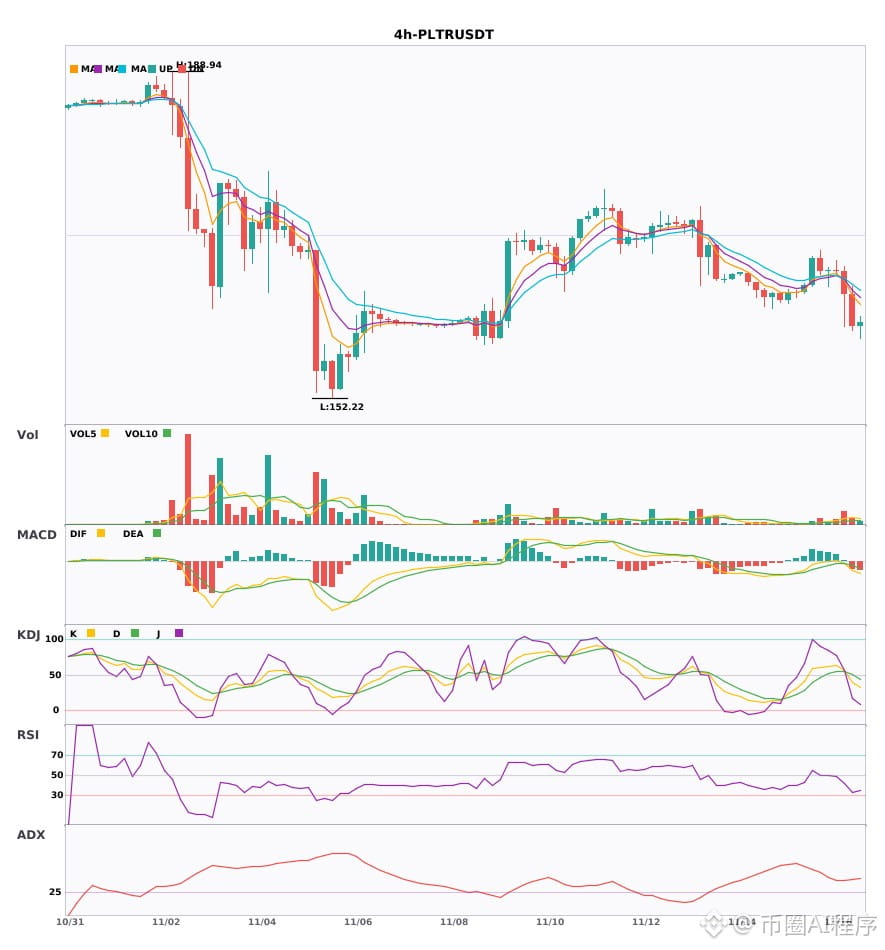
$PLTR 4-hour multi-timeframe outlook is bearish; the daily downtrend has just been confirmed 🔥
════════════════════
🟢 $PLTR 4-hour bearish signal
⚠️ Technicals: Bearish entry signal on the 4-hour chart, confirmed by bearish confluence on the daily chart. MACD has formed a bearish crossover below zero, with expanding green bars; moving averages are bearishly aligned and spreading downward; KDJ has formed a bearish crossover but is not yet oversold; volume has surged to 3.5 times its usual level. Short-term outlook is bearish.
════════════════════
🔔 Follow for first-hand updates on market movements 🔔
#多周期共振 #PLTR
📌 When trading, watch whether the candlestick pattern matches
$PLTR 4-hour multi-timeframe outlook is bearish; the daily downtrend has just been confirmed 🔥
════════════════════
🟢 $PLTR 4-hour bearish signal
⚠️ Technicals: Bearish entry signal on the 4-hour chart, confirmed by bearish confluence on the daily chart. MACD has formed a bearish crossover below zero, with expanding green bars; moving averages are bearishly aligned and spreading downward; KDJ has formed a bearish crossover but is not yet oversold; volume has surged to 3.5 times its usual level. Short-term outlook is bearish.
════════════════════
🔔 Follow for first-hand updates on market movements 🔔
#多周期共振 #PLTR
📌 When trading, watch whether the candlestick pattern matches
════════════════════
🟢 $PLTR 4-hour bearish signal
⚠️ Technicals: Bearish entry signal on the 4-hour chart, confirmed by bearish confluence on the daily chart. MACD has formed a bearish crossover below zero, with expanding green bars; moving averages are bearishly aligned and spreading downward; KDJ has formed a bearish crossover but is not yet oversold; volume has surged to 3.5 times its usual level. Short-term outlook is bearish.
════════════════════
🔔 Follow for first-hand updates on market movements 🔔
#多周期共振 #PLTR
📌 When trading, watch whether the candlestick pattern matches
2
·
--
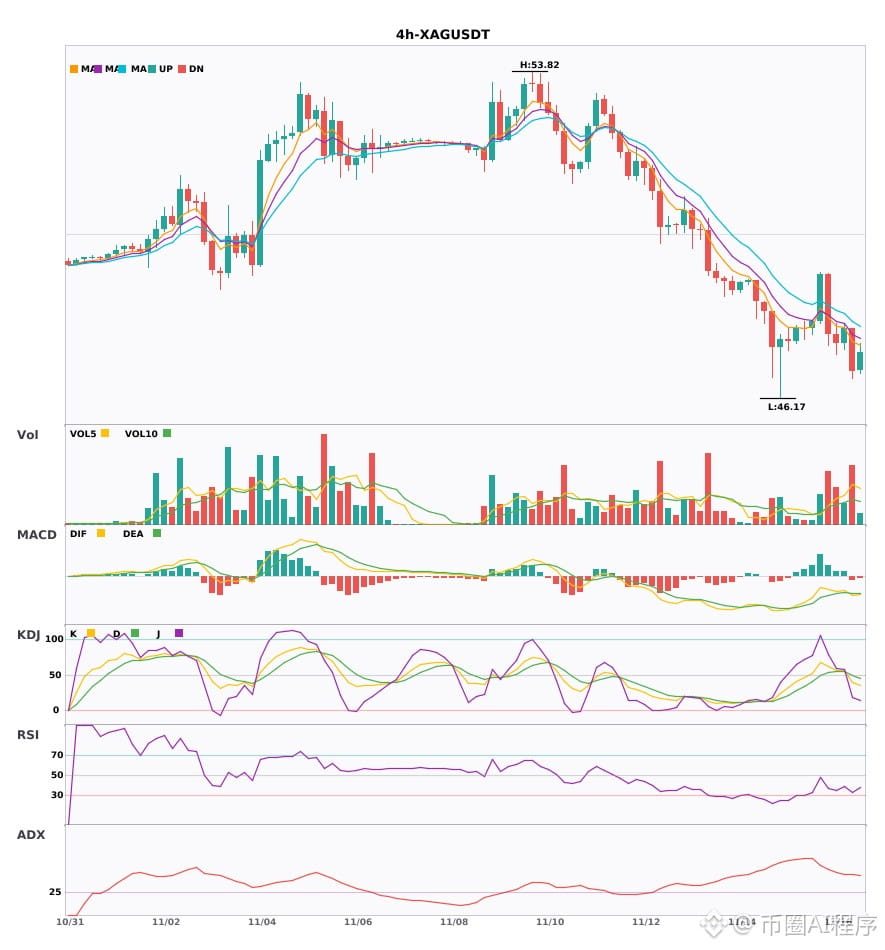
$XAG $ASTS $PLTR 4-hour and daily-chart confluence weakening—don't rush to buy the dip 🔥
════════════════════
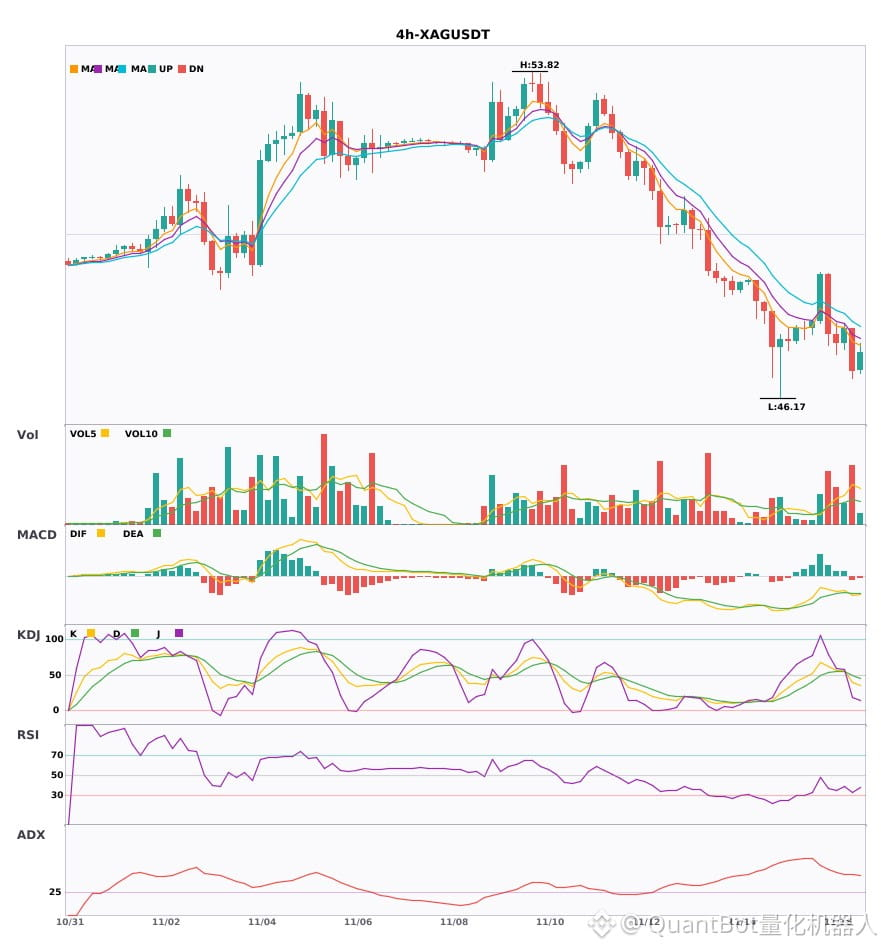
🟢 $XAG 4-hour bearish signal
⚠️ Technical analysis: Daily bearish trend + 4-hour entry; multi-timeframe confluence! MACD bearish crossover accelerating, moving averages in bearish alignment and trending down, KDJ bearish crossover (K39.6/D49.9), trading volume up 2.3x
════════════════════
🟢 $ASTS 4-hour bearish signal
⚠️ Technical analysis: 4-hour and daily bearish confluence confirmed! MACD bearish crossover below zero with expanding green bars, moving averages in a diverging bearish alignment, KDJ weak as K crosses below D, volume up 2.5x.
════════════════════
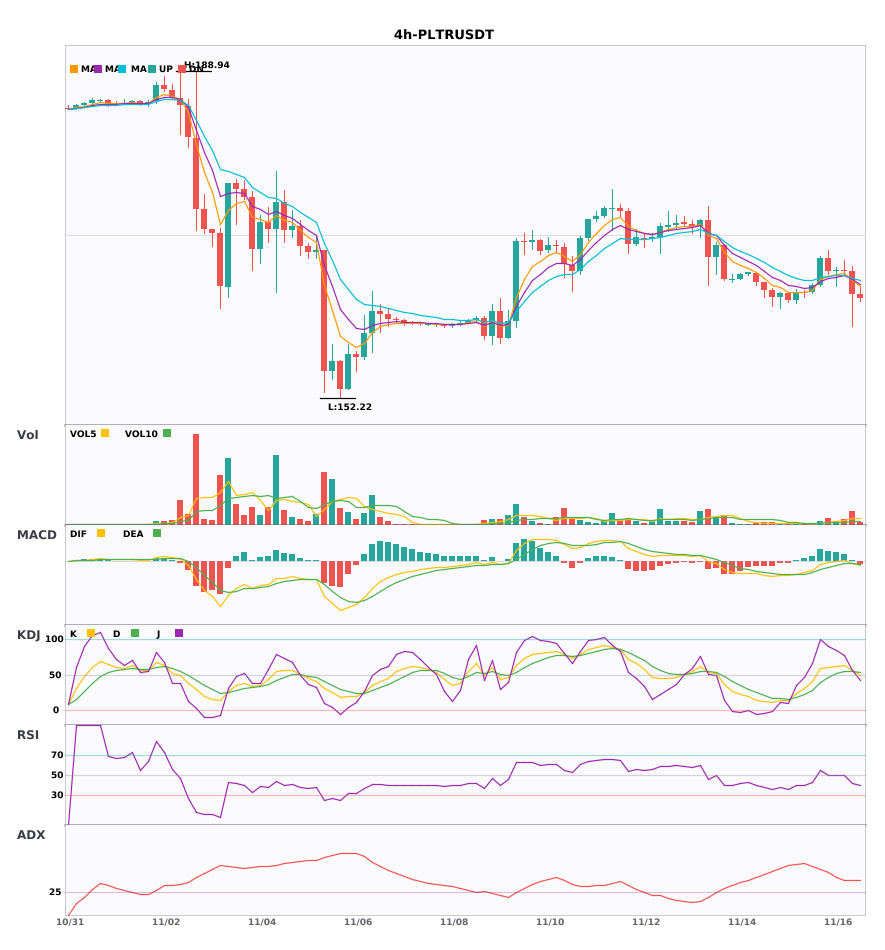
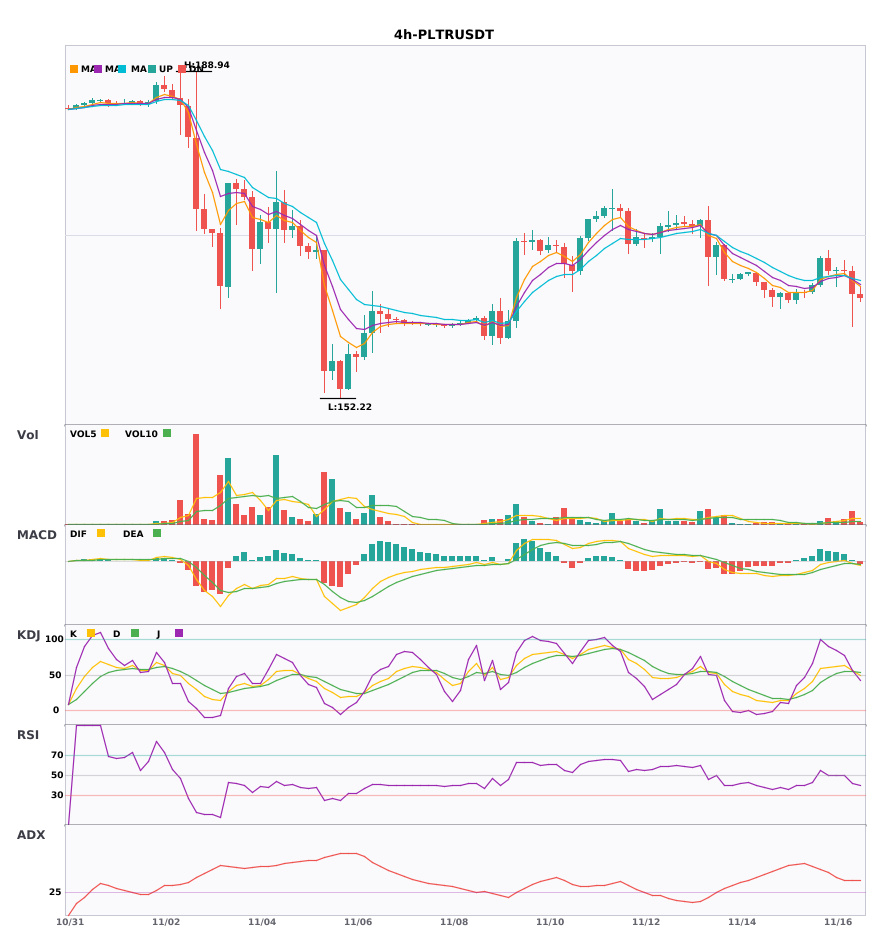
🟢 $PLTR 4-hour bearish signal
⚠️ Technical analysis: 4-hour and daily bearish confluence confirmed! MACD crosses below the zero line and turns bearish, EMA5 crosses below EMA8, KDJ bearish crossover, volume up 3.5x—favoring the prevailing downtrend.
════════════════════
🔔 Follow for first-hand market alerts 🔔
#多周期共振 #XAG #ASTS #PLTR
📌 When trading, check whether the candlestick patterns align
$XAG $ASTS $PLTR 4-hour and daily-chart confluence weakening—don't rush to buy the dip 🔥
════════════════════
🟢 $XAG 4-hour bearish signal
⚠️ Technical analysis: Daily bearish trend + 4-hour entry; multi-timeframe confluence! MACD bearish crossover accelerating, moving averages in bearish alignment and trending down, KDJ bearish crossover (K39.6/D49.9), trading volume up 2.3x
════════════════════
🟢 $ASTS 4-hour bearish signal
⚠️ Technical analysis: 4-hour and daily bearish confluence confirmed! MACD bearish crossover below zero with expanding green bars, moving averages in a diverging bearish alignment, KDJ weak as K crosses below D, volume up 2.5x.
════════════════════
🟢 $PLTR 4-hour bearish signal
⚠️ Technical analysis: 4-hour and daily bearish confluence confirmed! MACD crosses below the zero line and turns bearish, EMA5 crosses below EMA8, KDJ bearish crossover, volume up 3.5x—favoring the prevailing downtrend.
════════════════════
🔔 Follow for first-hand market alerts 🔔
#多周期共振 #XAG #ASTS #PLTR
📌 When trading, check whether the candlestick patterns align
════════════════════
🟢 $XAG 4-hour bearish signal
⚠️ Technical analysis: Daily bearish trend + 4-hour entry; multi-timeframe confluence! MACD bearish crossover accelerating, moving averages in bearish alignment and trending down, KDJ bearish crossover (K39.6/D49.9), trading volume up 2.3x
════════════════════
🟢 $ASTS 4-hour bearish signal
⚠️ Technical analysis: 4-hour and daily bearish confluence confirmed! MACD bearish crossover below zero with expanding green bars, moving averages in a diverging bearish alignment, KDJ weak as K crosses below D, volume up 2.5x.
════════════════════
🟢 $PLTR 4-hour bearish signal
⚠️ Technical analysis: 4-hour and daily bearish confluence confirmed! MACD crosses below the zero line and turns bearish, EMA5 crosses below EMA8, KDJ bearish crossover, volume up 3.5x—favoring the prevailing downtrend.
════════════════════
🔔 Follow for first-hand market alerts 🔔
#多周期共振 #XAG #ASTS #PLTR
📌 When trading, check whether the candlestick patterns align
2
$XAG $ASTS $PLTR 4H Bearish signal confluence confirmed
📉 $XAG | 4-hour bearish signal
━━━━━━━━━━━━━━━━━━
Technical analysis: ADX(43) indicates a clear trend; MACD bearish crossover below zero, bearish momentum accelerating; EMA5<EMA8<EMA13 bearish alignment; KDJ bearish crossover (K39.6/D49.9), short-term outlook is bearish; trading volume up 2.3x.
Price change: -2.0700%
📉 $ASTS | 4-hour bearish signal
━━━━━━━━━━━━━━━━━━
Technical analysis: ADX(36) indicates a clear trend; MACD bearish crossover below zero, bearish momentum accelerating; EMA5<EMA8<EMA13 bearish alignment; KDJ weak (K31.3/D37.9); trading volume up 2.5x.
Price change: -3.0900%
📉 $PLTR | 4-hour bearish signal
━━━━━━━━━━━━━━━━━━
Technical analysis: ADX41 confirms a trending market; MACD DIF breaks below the zero line, turning bearish; EMA5/8 bearish crossover; KDJ strong (K56/D55.6); trading volume up 3.5x
Price change: -1.4900%
━━━━━━━━━━━━━━━━━━
#技术分析 #XAG #ASTS #PLTR
📌 The above is for reference only and does not constitute investment advice
$XAG $ASTS $PLTR 4H Bearish signal confluence confirmed
📉 $XAG | 4-hour bearish signal
━━━━━━━━━━━━━━━━━━
Technical analysis: ADX(43) indicates a clear trend; MACD bearish crossover below zero, bearish momentum accelerating; EMA5<EMA8<EMA13 bearish alignment; KDJ bearish crossover (K39.6/D49.9), short-term outlook is bearish; trading volume up 2.3x.
Price change: -2.0700%
📉 $ASTS | 4-hour bearish signal
━━━━━━━━━━━━━━━━━━
Technical analysis: ADX(36) indicates a clear trend; MACD bearish crossover below zero, bearish momentum accelerating; EMA5<EMA8<EMA13 bearish alignment; KDJ weak (K31.3/D37.9); trading volume up 2.5x.
Price change: -3.0900%
📉 $PLTR | 4-hour bearish signal
━━━━━━━━━━━━━━━━━━
Technical analysis: ADX41 confirms a trending market; MACD DIF breaks below the zero line, turning bearish; EMA5/8 bearish crossover; KDJ strong (K56/D55.6); trading volume up 3.5x
Price change: -1.4900%
━━━━━━━━━━━━━━━━━━
#技术分析 #XAG #ASTS #PLTR
📌 The above is for reference only and does not constitute investment advice
📉 $XAG | 4-hour bearish signal
━━━━━━━━━━━━━━━━━━
Technical analysis: ADX(43) indicates a clear trend; MACD bearish crossover below zero, bearish momentum accelerating; EMA5<EMA8<EMA13 bearish alignment; KDJ bearish crossover (K39.6/D49.9), short-term outlook is bearish; trading volume up 2.3x.
Price change: -2.0700%
📉 $ASTS | 4-hour bearish signal
━━━━━━━━━━━━━━━━━━
Technical analysis: ADX(36) indicates a clear trend; MACD bearish crossover below zero, bearish momentum accelerating; EMA5<EMA8<EMA13 bearish alignment; KDJ weak (K31.3/D37.9); trading volume up 2.5x.
Price change: -3.0900%
📉 $PLTR | 4-hour bearish signal
━━━━━━━━━━━━━━━━━━
Technical analysis: ADX41 confirms a trending market; MACD DIF breaks below the zero line, turning bearish; EMA5/8 bearish crossover; KDJ strong (K56/D55.6); trading volume up 3.5x
Price change: -1.4900%
━━━━━━━━━━━━━━━━━━
#技术分析 #XAG #ASTS #PLTR
📌 The above is for reference only and does not constitute investment advice
11
·
--
$XAG/$ASTS/$PLTR 4-hour trend starts weakening, under short-term pressure🔥
════════════════════
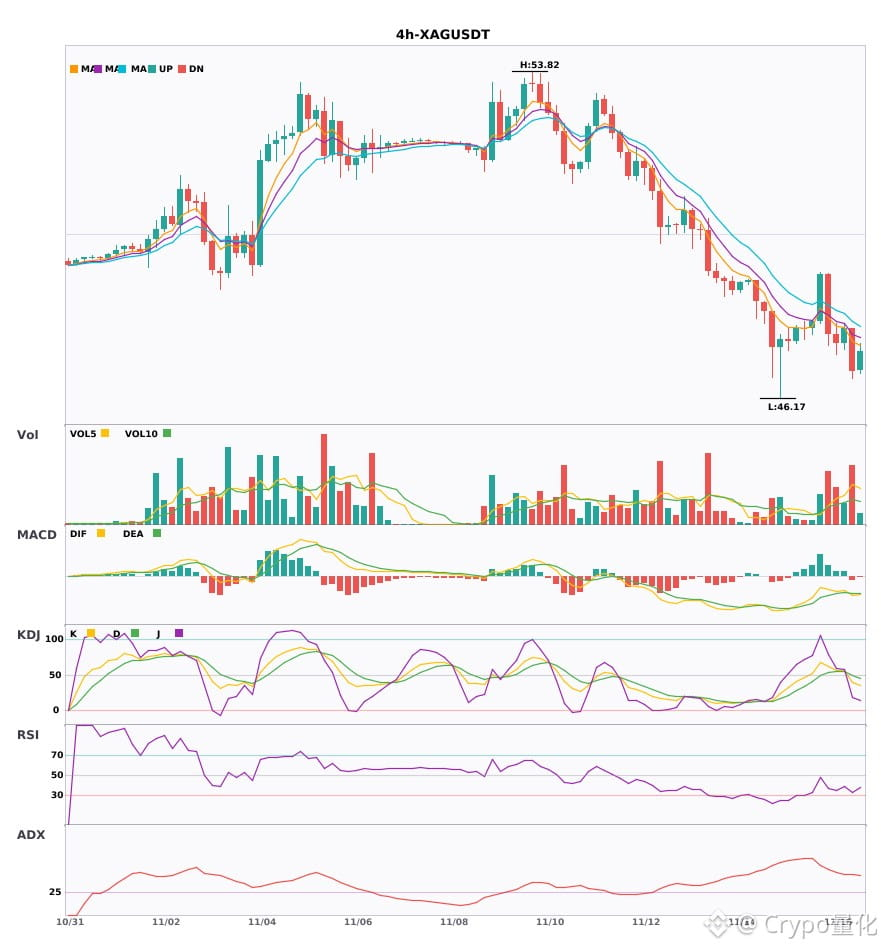
🟢 $XAG 4-hour bearish signal
⚠️Technical analysis: ADX (43) shows a clear trend; the MACD bearish death cross below zero is accelerating; moving averages are bearishly aligned and trending downward; KDJ has formed a death cross but is not yet oversold, suggesting a short-term bearish bias. Trading volume is up 2.3x.
════════════════════
🟢 $ASTS 4-hour bearish signal
⚠️Technical analysis: ADX shows a clear trend; the MACD bearish death cross below zero is accelerating; moving averages are diverging bearishly; KDJ is weak (K31.3 D37.9), with volume surging 2.5x.
════════════════════
🟢 $PLTR 4-hour bearish signal
⚠️Technical analysis: ADX (41) shows a very strong trend; the MACD green bars are growing; short-term moving averages have formed a bearish death cross, but K in KDJ has just crossed above D and is not overbought. Volume is up 3.5x.
════════════════════
🔔 Follow for first-hand market updates 🔔
#技术分析 #XAG #ASTS #PLTR
📌 When trading, pay attention to whether the candlestick pattern aligns with expectations.
$XAG /$ASTS /$PLTR 4-hour trend starts weakening, under short-term pressure🔥
════════════════════
🟢 $XAG 4-hour bearish signal
⚠️Technical analysis: ADX (43) shows a clear trend; the MACD bearish death cross below zero is accelerating; moving averages are bearishly aligned and trending downward; KDJ has formed a death cross but is not yet oversold, suggesting a short-term bearish bias. Trading volume is up 2.3x.
════════════════════
🟢 $ASTS 4-hour bearish signal
⚠️Technical analysis: ADX shows a clear trend; the MACD bearish death cross below zero is accelerating; moving averages are diverging bearishly; KDJ is weak (K31.3 D37.9), with volume surging 2.5x.
════════════════════
🟢 $PLTR 4-hour bearish signal
⚠️Technical analysis: ADX (41) shows a very strong trend; the MACD green bars are growing; short-term moving averages have formed a bearish death cross, but K in KDJ has just crossed above D and is not overbought. Volume is up 3.5x.
════════════════════
🔔 Follow for first-hand market updates 🔔
#技术分析 #XAG #ASTS #PLTR
📌 When trading, pay attention to whether the candlestick pattern aligns with expectations.
════════════════════
🟢 $XAG 4-hour bearish signal
⚠️Technical analysis: ADX (43) shows a clear trend; the MACD bearish death cross below zero is accelerating; moving averages are bearishly aligned and trending downward; KDJ has formed a death cross but is not yet oversold, suggesting a short-term bearish bias. Trading volume is up 2.3x.
════════════════════
🟢 $ASTS 4-hour bearish signal
⚠️Technical analysis: ADX shows a clear trend; the MACD bearish death cross below zero is accelerating; moving averages are diverging bearishly; KDJ is weak (K31.3 D37.9), with volume surging 2.5x.
════════════════════
🟢 $PLTR 4-hour bearish signal
⚠️Technical analysis: ADX (41) shows a very strong trend; the MACD green bars are growing; short-term moving averages have formed a bearish death cross, but K in KDJ has just crossed above D and is not overbought. Volume is up 3.5x.
════════════════════
🔔 Follow for first-hand market updates 🔔
#技术分析 #XAG #ASTS #PLTR
📌 When trading, pay attention to whether the candlestick pattern aligns with expectations.
2
Log in to explore more content
Join global crypto users on Binance Square
⚡️ Get latest and useful information about crypto.
💬 Trusted by the world’s largest crypto exchange.
👍 Discover real insights from verified creators.
Email / Phone number
Trending Topics
1
#CanBTCReboundAfterFallingBelow60K?
365,279 views
1,521 Discussing
2
#GlobalStocksFaceLongestLosingStreakSince2023
119,016 views
1,079 Discussing
3
#BlackRockIBITPostsRecord$541MSingleDayOutflow
613 views
16 Discussing
4
#AnthropicPlungesTowardIPOPriceonDay2
58,140 views
586 Discussing
5
#TwentyOneCapitalAdds172.25BTC
10,155 views
157 Discussing
6
#HKBillWouldExcludeTokenizedDepositsFromVirtualAssets
861 views
14 Discussing
7
#BNBDropsBelow540USDTWith8.46%DailyDecline
31,527 views
268 Discussing
8
#HKBillProposesHK$100KFineForUnauthorizedCryptoTitles
1,009 views
14 Discussing
9
#BitMineFaces$10.1BUnrealizedETHLoss
1,967 views
18 Discussing
10
#StrategyReports$35BNetReserves
1,834 views
18 Discussing