
#usar
usar
29,719 views
412 Discussing
Hot
Latest

·
--
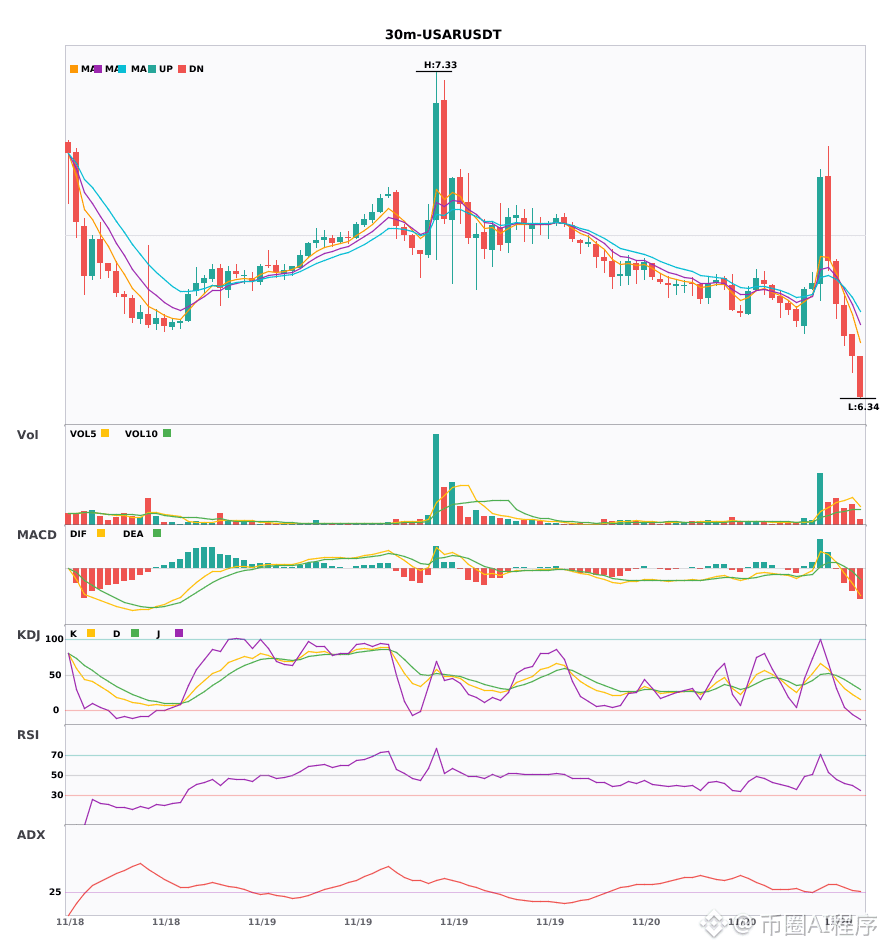
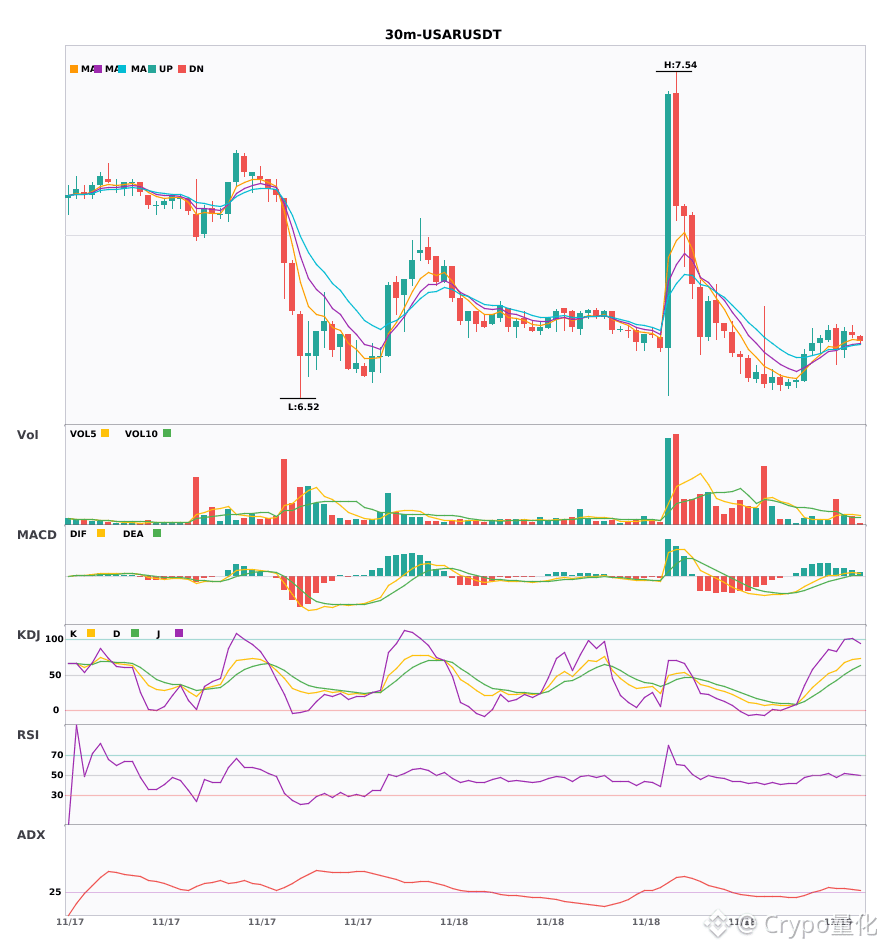
$USAR 30-minute and 4-hour charts are turning bearish in sync. Bearish warning—watch out for a sharp drop 🔥
════════════════════
🟢 $USAR 30-minute bearish signal
⚠️Technical analysis: 30-minute entry: DIF has crossed below zero, turning bearish; EMA5 has just crossed below EMA8; KDJ K has crossed below D but is not yet oversold; volume is 2.2x higher. 4-hour bearish confluence confirmed.
════════════════════
🔔 Follow for first-hand updates on market movements 🔔
#多周期共振 #USAR
📌 When trading, check whether the candlestick patterns align
$USAR 30-minute and 4-hour charts are turning bearish in sync. Bearish warning—watch out for a sharp drop 🔥
════════════════════
🟢 $USAR 30-minute bearish signal
⚠️Technical analysis: 30-minute entry: DIF has crossed below zero, turning bearish; EMA5 has just crossed below EMA8; KDJ K has crossed below D but is not yet oversold; volume is 2.2x higher. 4-hour bearish confluence confirmed.
════════════════════
🔔 Follow for first-hand updates on market movements 🔔
#多周期共振 #USAR
📌 When trading, check whether the candlestick patterns align
════════════════════
🟢 $USAR 30-minute bearish signal
⚠️Technical analysis: 30-minute entry: DIF has crossed below zero, turning bearish; EMA5 has just crossed below EMA8; KDJ K has crossed below D but is not yet oversold; volume is 2.2x higher. 4-hour bearish confluence confirmed.
════════════════════
🔔 Follow for first-hand updates on market movements 🔔
#多周期共振 #USAR
📌 When trading, check whether the candlestick patterns align
7

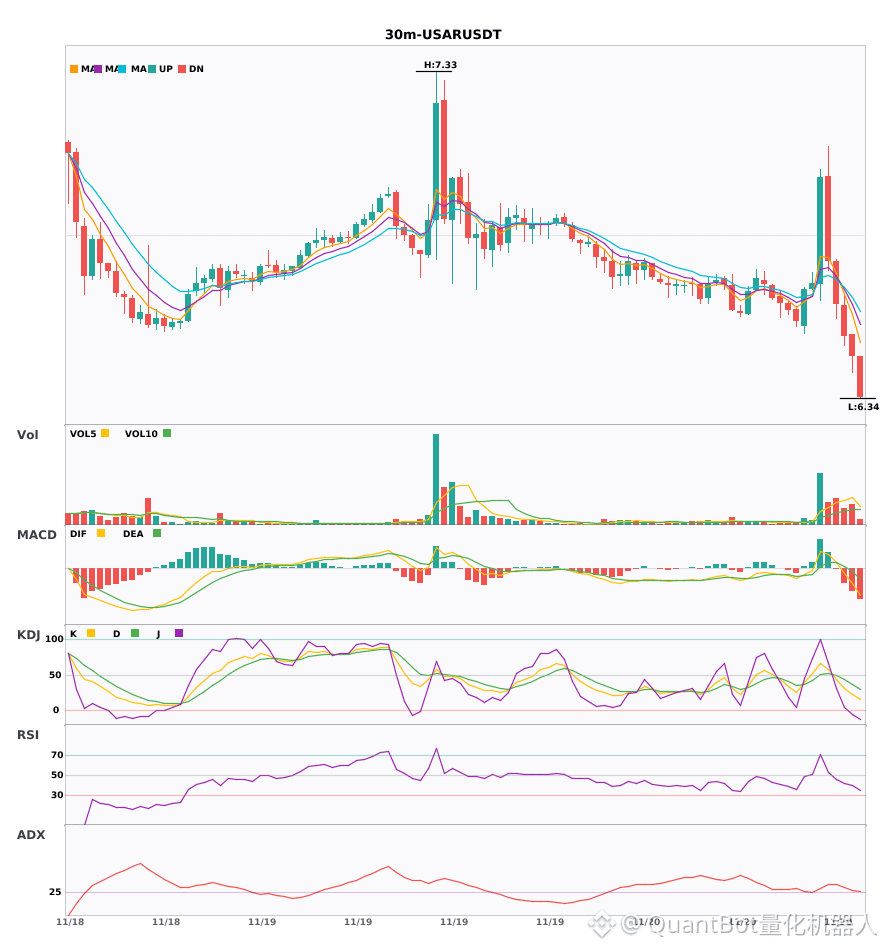
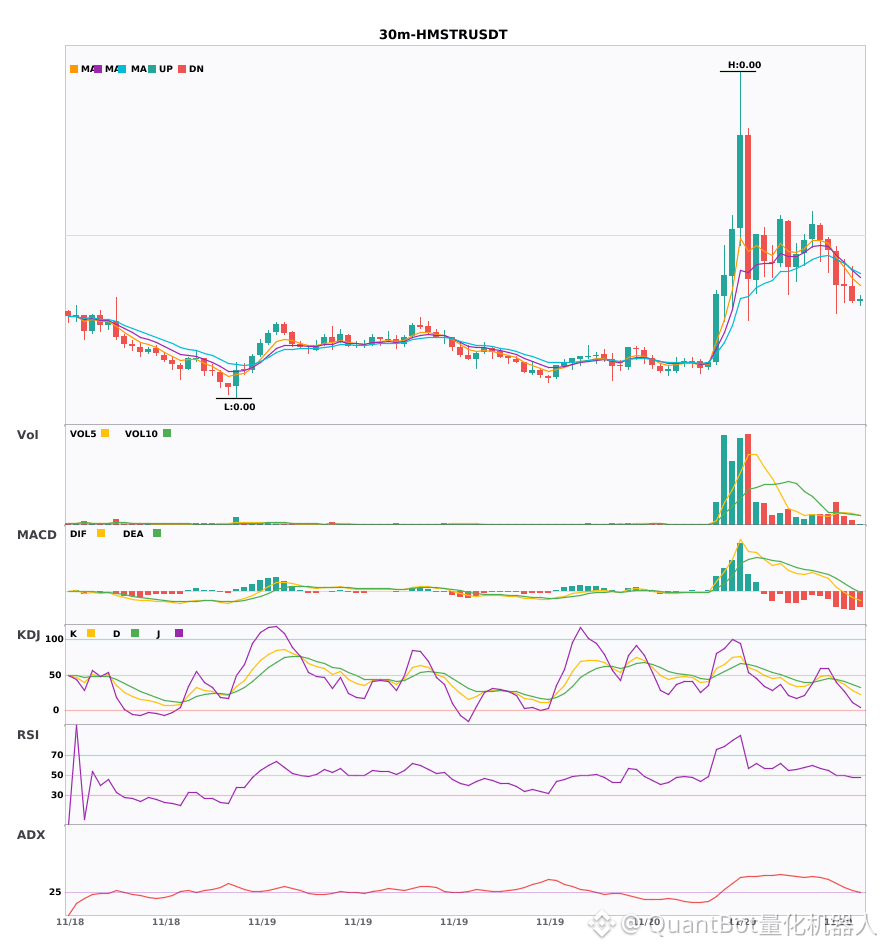
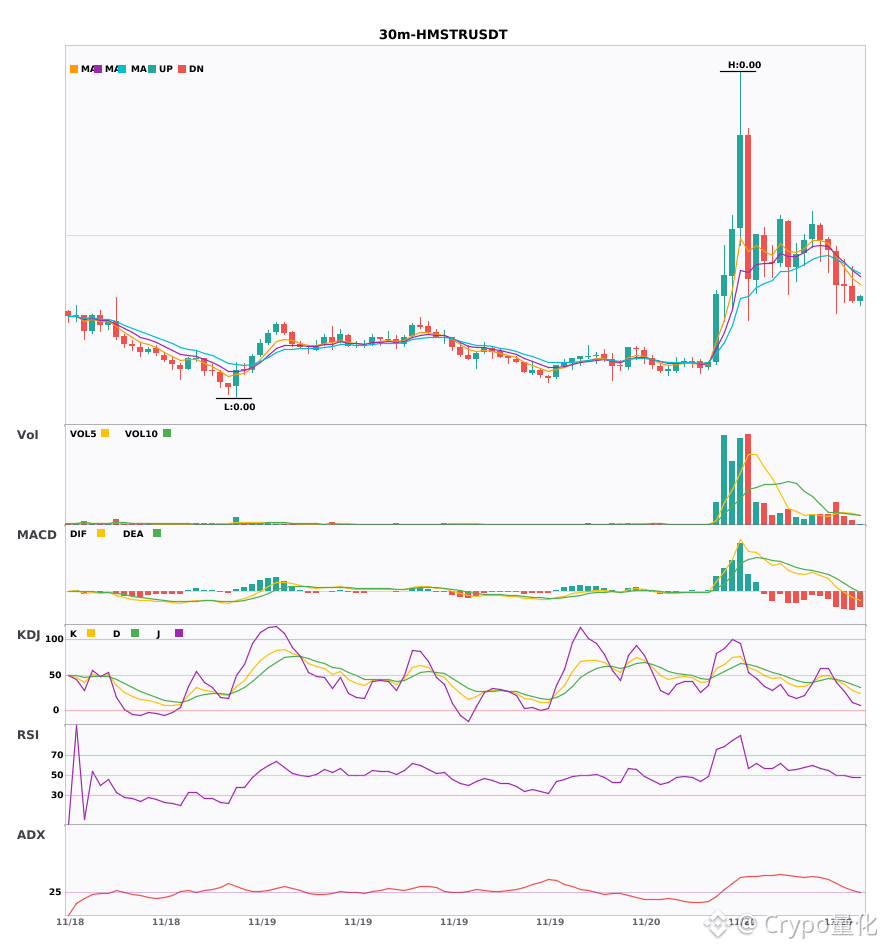
$USAR $HMSTR 30-minute synchronized bearish move, confirmed by two signals
📉 $USAR | 30-minute bearish signal
━━━━━━━━━━━━━━━━━━
Technical analysis: ADX (32) indicates a clear trend | DIF crossed below the zero line, turning bearish | EMA5 crossed below EMA8, signaling short-term weakness | KDJ in a weak range (K30.5/D43.3), with bears in control | Volume increased 2.2x
Price change: -1.4500%
📉 $HMSTR | 30-minute bearish signal
━━━━━━━━━━━━━━━━━━
Technical analysis: ADX (31) indicates a strong trend; MACD DIF crossed below the zero line, turning bearish; moving averages are converging, awaiting a breakout; KDJ indicates bearish dominance; volume increased 1.8x
Price change: -0.1400%
━━━━━━━━━━━━━━━━━━
#技术分析 #USAR #HMSTR
📌 The above content is for reference only and does not constitute investment advice
$USAR $HMSTR 30-minute synchronized bearish move, confirmed by two signals
📉 $USAR | 30-minute bearish signal
━━━━━━━━━━━━━━━━━━
Technical analysis: ADX (32) indicates a clear trend | DIF crossed below the zero line, turning bearish | EMA5 crossed below EMA8, signaling short-term weakness | KDJ in a weak range (K30.5/D43.3), with bears in control | Volume increased 2.2x
Price change: -1.4500%
📉 $HMSTR | 30-minute bearish signal
━━━━━━━━━━━━━━━━━━
Technical analysis: ADX (31) indicates a strong trend; MACD DIF crossed below the zero line, turning bearish; moving averages are converging, awaiting a breakout; KDJ indicates bearish dominance; volume increased 1.8x
Price change: -0.1400%
━━━━━━━━━━━━━━━━━━
#技术分析 #USAR #HMSTR
📌 The above content is for reference only and does not constitute investment advice
📉 $USAR | 30-minute bearish signal
━━━━━━━━━━━━━━━━━━
Technical analysis: ADX (32) indicates a clear trend | DIF crossed below the zero line, turning bearish | EMA5 crossed below EMA8, signaling short-term weakness | KDJ in a weak range (K30.5/D43.3), with bears in control | Volume increased 2.2x
Price change: -1.4500%
📉 $HMSTR | 30-minute bearish signal
━━━━━━━━━━━━━━━━━━
Technical analysis: ADX (31) indicates a strong trend; MACD DIF crossed below the zero line, turning bearish; moving averages are converging, awaiting a breakout; KDJ indicates bearish dominance; volume increased 1.8x
Price change: -0.1400%
━━━━━━━━━━━━━━━━━━
#技术分析 #USAR #HMSTR
📌 The above content is for reference only and does not constitute investment advice
31

·
--
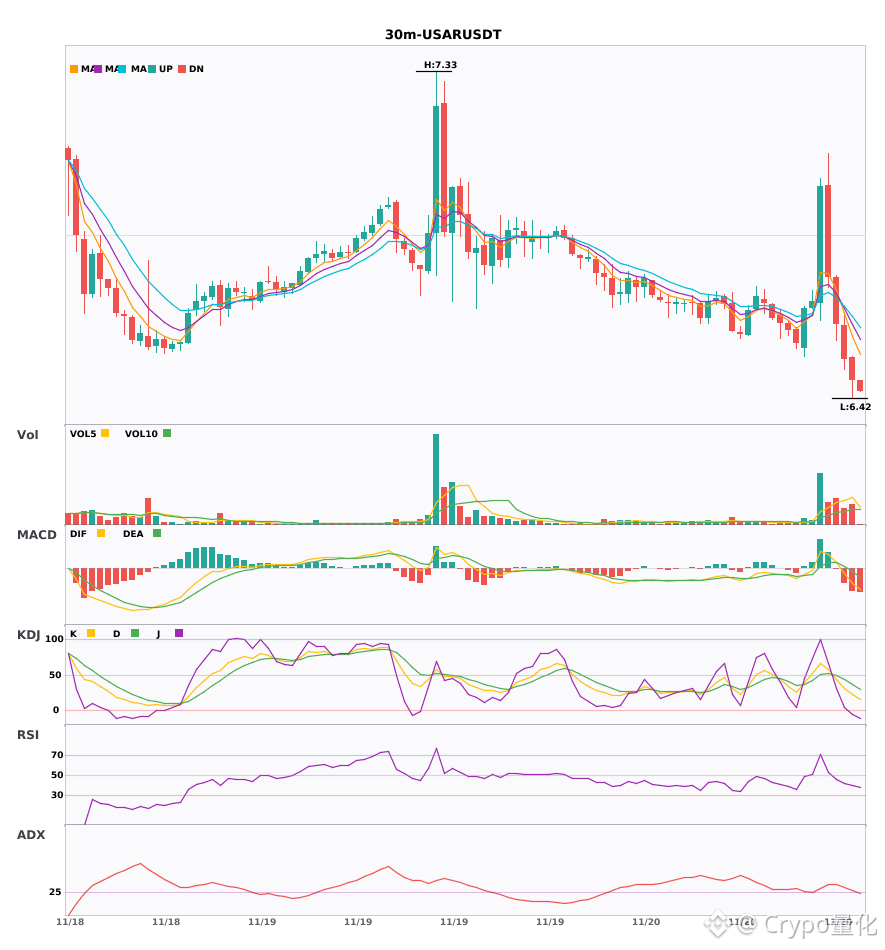
$USAR $HMSTR 30-minute indicators both weakened; short-term risk is here 🔥
════════════════════
🟢 $USAR 30-minute bearish signal
⚠️Technical analysis: ADX32, trend is quite clear | MACD bearish crossover, falling below the zero line and turning bearish | 5-day moving average crossed below the 8-day moving average, weakening in the short term | KDJ is weak, bears have the upper hand (K30.5 D43.3) | Trading volume increased 2.2-fold
════════════════════
🟢 $HMSTR 30-minute bearish signal
⚠️Technical analysis: ADX31, strong trend|MACD crossed below the zero line and turned bearish|Moving averages are converging; a market shift may be coming|KDJ favors the bears (K36.8 D41.4)|Volume increased 1.8-fold
════════════════════
🔔 Follow for the latest market updates 🔔
#技术分析 #USAR #HMSTR
📌 When trading, pay attention to whether the candlestick pattern confirms the setup
$USAR $HMSTR 30-minute indicators both weakened; short-term risk is here 🔥
════════════════════
🟢 $USAR 30-minute bearish signal
⚠️Technical analysis: ADX32, trend is quite clear | MACD bearish crossover, falling below the zero line and turning bearish | 5-day moving average crossed below the 8-day moving average, weakening in the short term | KDJ is weak, bears have the upper hand (K30.5 D43.3) | Trading volume increased 2.2-fold
════════════════════
🟢 $HMSTR 30-minute bearish signal
⚠️Technical analysis: ADX31, strong trend|MACD crossed below the zero line and turned bearish|Moving averages are converging; a market shift may be coming|KDJ favors the bears (K36.8 D41.4)|Volume increased 1.8-fold
════════════════════
🔔 Follow for the latest market updates 🔔
#技术分析 #USAR #HMSTR
📌 When trading, pay attention to whether the candlestick pattern confirms the setup
════════════════════
🟢 $USAR 30-minute bearish signal
⚠️Technical analysis: ADX32, trend is quite clear | MACD bearish crossover, falling below the zero line and turning bearish | 5-day moving average crossed below the 8-day moving average, weakening in the short term | KDJ is weak, bears have the upper hand (K30.5 D43.3) | Trading volume increased 2.2-fold
════════════════════
🟢 $HMSTR 30-minute bearish signal
⚠️Technical analysis: ADX31, strong trend|MACD crossed below the zero line and turned bearish|Moving averages are converging; a market shift may be coming|KDJ favors the bears (K36.8 D41.4)|Volume increased 1.8-fold
════════════════════
🔔 Follow for the latest market updates 🔔
#技术分析 #USAR #HMSTR
📌 When trading, pay attention to whether the candlestick pattern confirms the setup
20
·
--
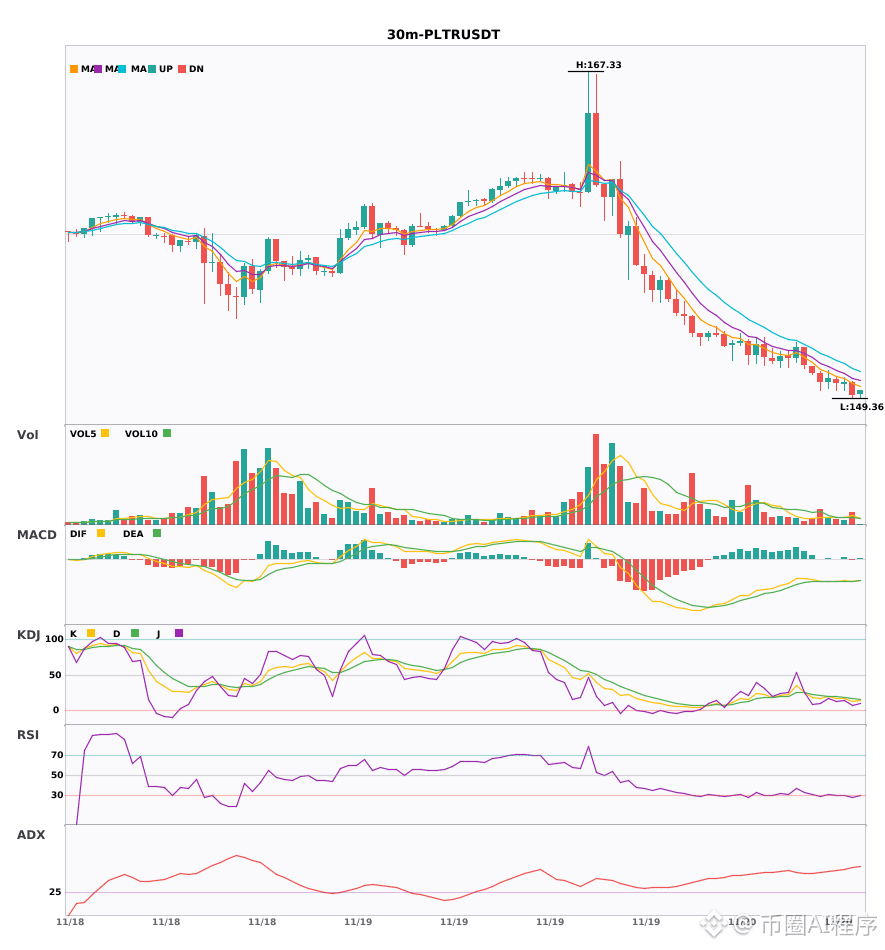
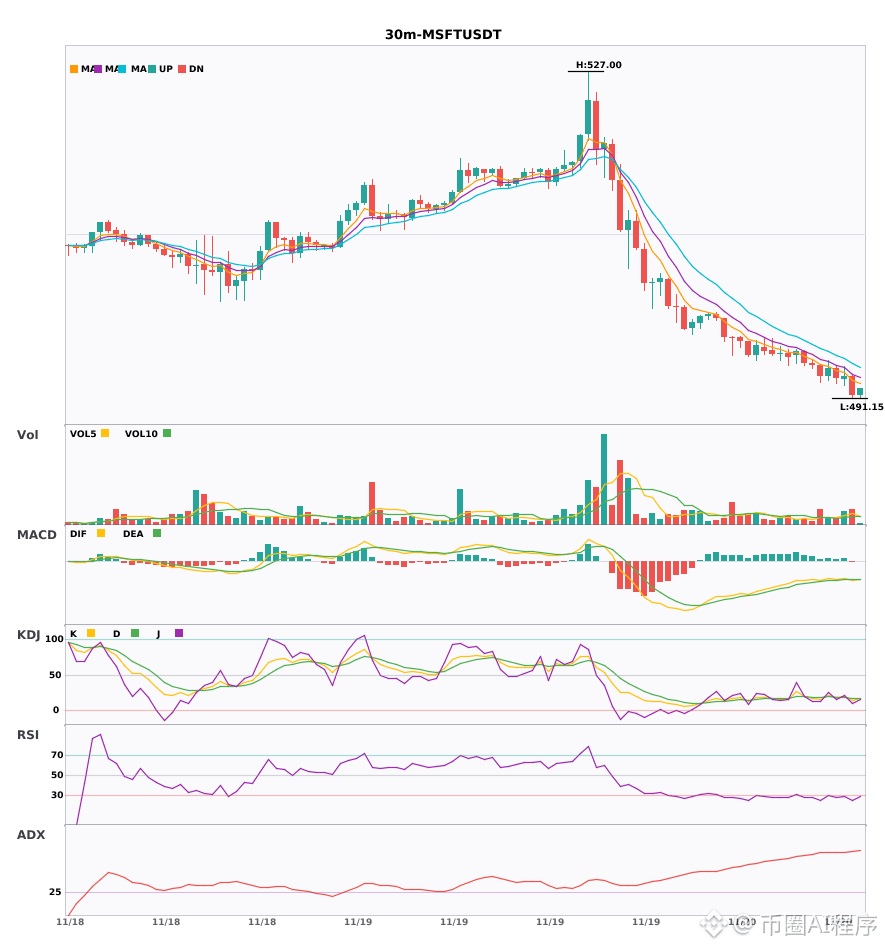
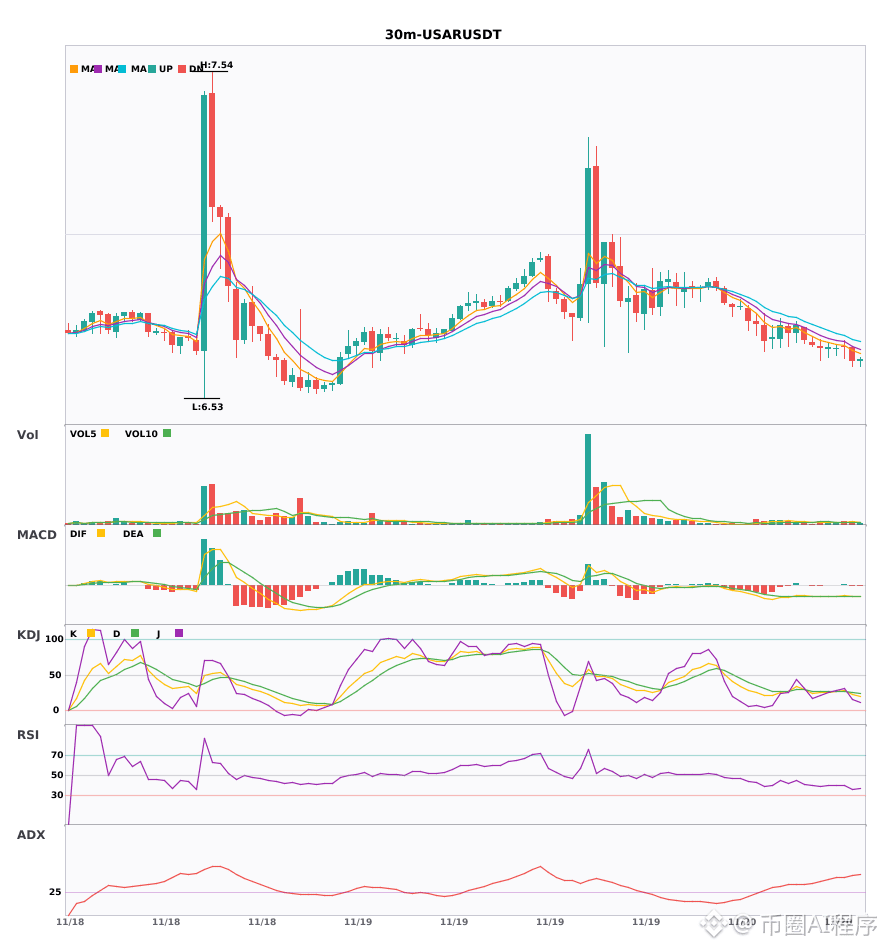
$PLTR $MSFT $USAR 30-minute weakness, 4-hour bearish confluence 🔥
════════════════════
🟢 $PLTR 30-minute short signal
⚠️Technical analysis: After a 30-minute MACD death cross, volume expanded. Moving averages are bearishly aligned and trending downward. KDJ has entered oversold territory, so watch for a rebound; 4-hour bearish confluence is confirmed, favoring the trend.
════════════════════
🟢 $MSFT 30-minute short signal
⚠️Technical analysis: 30-minute entry + 4-hour bearish confluence confirmed! The MACD death cross histogram bars are growing, moving averages are bearishly aligned, KDJ has formed a death cross but is not oversold, and volume has increased 1.8x. The short-term outlook remains bearish.
════════════════════
🟢 $USAR 30-minute short signal
⚠️Technical analysis: 4-hour bearish + 30-minute confluence for a short | MACD death cross histogram bars growing | Bearish divergence in moving averages | KDJ death cross, not oversold | Volume normal
════════════════════
🔔 Follow for first-hand market movement alerts 🔔
#多周期共振 #PLTR #MSFT #USAR
📌 When trading, pay attention to whether the candlestick pattern confirms the setup
$PLTR $MSFT $USAR 30-minute weakness, 4-hour bearish confluence 🔥
════════════════════
🟢 $PLTR 30-minute short signal
⚠️Technical analysis: After a 30-minute MACD death cross, volume expanded. Moving averages are bearishly aligned and trending downward. KDJ has entered oversold territory, so watch for a rebound; 4-hour bearish confluence is confirmed, favoring the trend.
════════════════════
🟢 $MSFT 30-minute short signal
⚠️Technical analysis: 30-minute entry + 4-hour bearish confluence confirmed! The MACD death cross histogram bars are growing, moving averages are bearishly aligned, KDJ has formed a death cross but is not oversold, and volume has increased 1.8x. The short-term outlook remains bearish.
════════════════════
🟢 $USAR 30-minute short signal
⚠️Technical analysis: 4-hour bearish + 30-minute confluence for a short | MACD death cross histogram bars growing | Bearish divergence in moving averages | KDJ death cross, not oversold | Volume normal
════════════════════
🔔 Follow for first-hand market movement alerts 🔔
#多周期共振 #PLTR #MSFT #USAR
📌 When trading, pay attention to whether the candlestick pattern confirms the setup
════════════════════
🟢 $PLTR 30-minute short signal
⚠️Technical analysis: After a 30-minute MACD death cross, volume expanded. Moving averages are bearishly aligned and trending downward. KDJ has entered oversold territory, so watch for a rebound; 4-hour bearish confluence is confirmed, favoring the trend.
════════════════════
🟢 $MSFT 30-minute short signal
⚠️Technical analysis: 30-minute entry + 4-hour bearish confluence confirmed! The MACD death cross histogram bars are growing, moving averages are bearishly aligned, KDJ has formed a death cross but is not oversold, and volume has increased 1.8x. The short-term outlook remains bearish.
════════════════════
🟢 $USAR 30-minute short signal
⚠️Technical analysis: 4-hour bearish + 30-minute confluence for a short | MACD death cross histogram bars growing | Bearish divergence in moving averages | KDJ death cross, not oversold | Volume normal
════════════════════
🔔 Follow for first-hand market movement alerts 🔔
#多周期共振 #PLTR #MSFT #USAR
📌 When trading, pay attention to whether the candlestick pattern confirms the setup
7
·
--
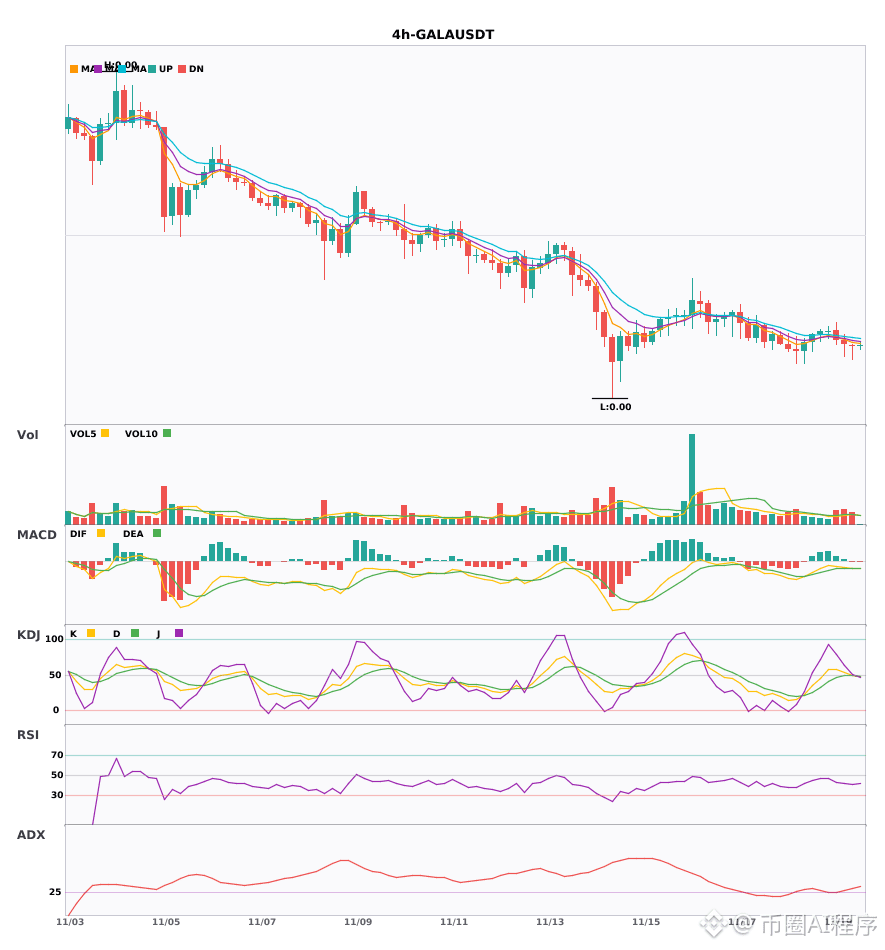
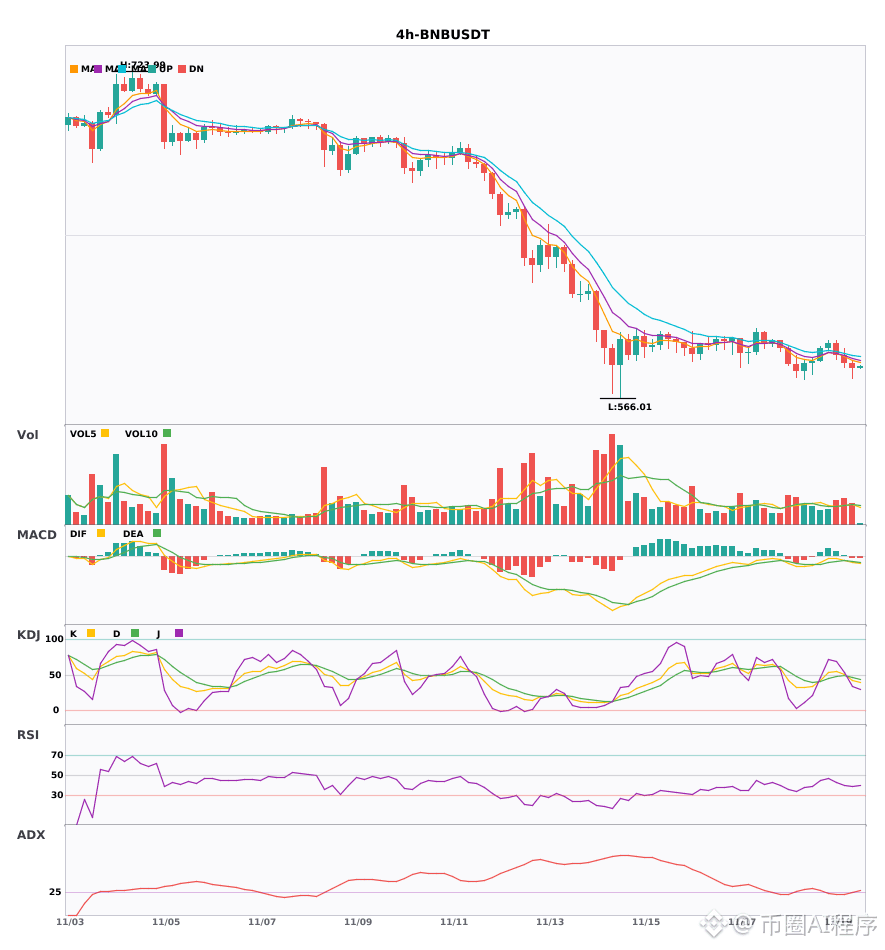
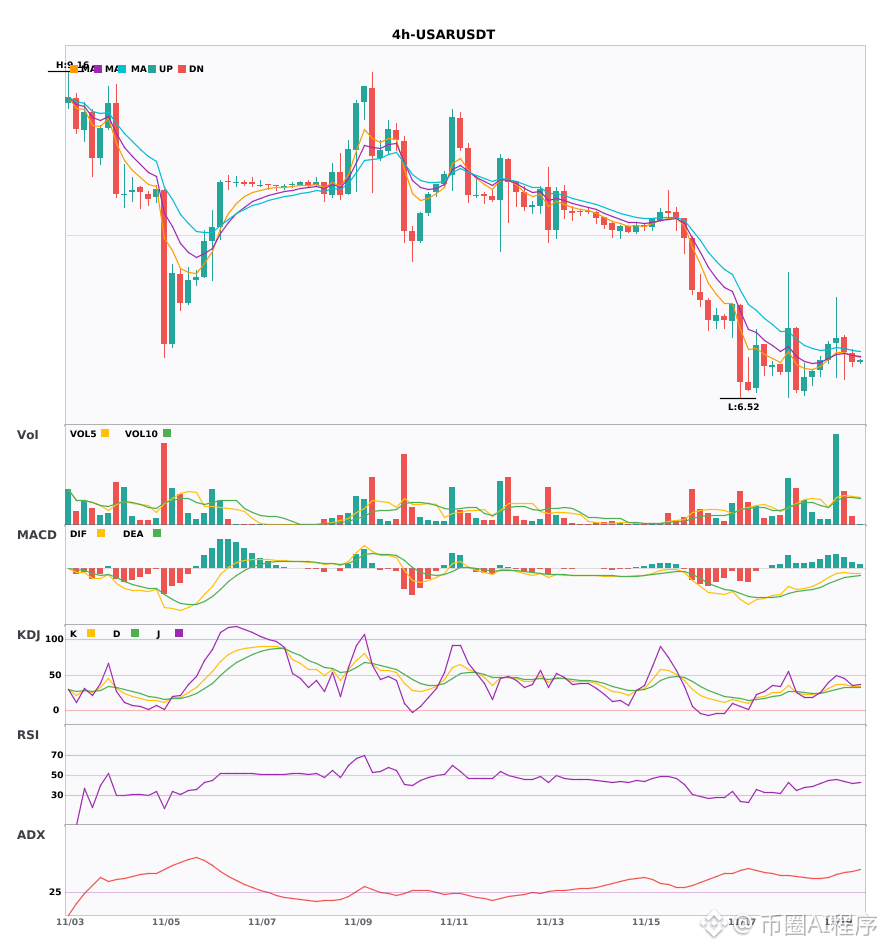
$GALA/$BNB/$USAR 4-hour and daily charts are turning bearish together. Don't catch a falling knife 🔥
════════════════════
🟢 $GALA 4-hour bearish signal
⚠️ Technical analysis: 4-hour entry signal + daily bearish confluence confirmed! MACD bearish crossover accelerating downward, moving averages in bearish alignment, KDJ weak, and volume up 1.5x. Clear bearish confluence for a short.
════════════════════
🟢 $BNB 4-hour bearish signal
⚠️ Technical analysis: Bearish entry on the 4-hour chart, with daily bearish confluence confirmed. MACD bearish crossover below zero, with expanding green bars, signals accelerating bearish momentum. Moving averages are bearishly aligned and diverging downward. KDJ has crossed down but is not yet oversold. Volume is normal at 1.3x.
📢 Market update: Solayer (LAYER) airdrop ongoing: Binance announced the fourth HODLer airdrop. Users can receive LAYER by subscribing with BNB through Simple Earn during the eligible period (2025-09-19).
════════════════════
🟢 $USAR 4-hour bearish signal
⚠️ Technical analysis: Multi-timeframe bearish confluence: on the 4-hour chart, EMA5 crossed below EMA8, signaling a short-term bearish turn. Daily bearish confluence confirmed. KDJ is weak, with bears in control. Volume is moderately elevated at 1.2x.
════════════════════
🔔 Follow for first-hand market updates 🔔
#多周期共振 #GALA #BNB #USAR
📌 When trading, pay attention to whether the candlestick patterns align
$GALA /$BNB /$USAR 4-hour and daily charts are turning bearish together. Don't catch a falling knife 🔥
════════════════════
🟢 $GALA 4-hour bearish signal
⚠️ Technical analysis: 4-hour entry signal + daily bearish confluence confirmed! MACD bearish crossover accelerating downward, moving averages in bearish alignment, KDJ weak, and volume up 1.5x. Clear bearish confluence for a short.
════════════════════
🟢 $BNB 4-hour bearish signal
⚠️ Technical analysis: Bearish entry on the 4-hour chart, with daily bearish confluence confirmed. MACD bearish crossover below zero, with expanding green bars, signals accelerating bearish momentum. Moving averages are bearishly aligned and diverging downward. KDJ has crossed down but is not yet oversold. Volume is normal at 1.3x.
📢 Market update: Solayer (LAYER) airdrop ongoing: Binance announced the fourth HODLer airdrop. Users can receive LAYER by subscribing with BNB through Simple Earn during the eligible period (2025-09-19).
════════════════════
🟢 $USAR 4-hour bearish signal
⚠️ Technical analysis: Multi-timeframe bearish confluence: on the 4-hour chart, EMA5 crossed below EMA8, signaling a short-term bearish turn. Daily bearish confluence confirmed. KDJ is weak, with bears in control. Volume is moderately elevated at 1.2x.
════════════════════
🔔 Follow for first-hand market updates 🔔
#多周期共振 #GALA #BNB #USAR
📌 When trading, pay attention to whether the candlestick patterns align
════════════════════
🟢 $GALA 4-hour bearish signal
⚠️ Technical analysis: 4-hour entry signal + daily bearish confluence confirmed! MACD bearish crossover accelerating downward, moving averages in bearish alignment, KDJ weak, and volume up 1.5x. Clear bearish confluence for a short.
════════════════════
🟢 $BNB 4-hour bearish signal
⚠️ Technical analysis: Bearish entry on the 4-hour chart, with daily bearish confluence confirmed. MACD bearish crossover below zero, with expanding green bars, signals accelerating bearish momentum. Moving averages are bearishly aligned and diverging downward. KDJ has crossed down but is not yet oversold. Volume is normal at 1.3x.
📢 Market update: Solayer (LAYER) airdrop ongoing: Binance announced the fourth HODLer airdrop. Users can receive LAYER by subscribing with BNB through Simple Earn during the eligible period (2025-09-19).
════════════════════
🟢 $USAR 4-hour bearish signal
⚠️ Technical analysis: Multi-timeframe bearish confluence: on the 4-hour chart, EMA5 crossed below EMA8, signaling a short-term bearish turn. Daily bearish confluence confirmed. KDJ is weak, with bears in control. Volume is moderately elevated at 1.2x.
════════════════════
🔔 Follow for first-hand market updates 🔔
#多周期共振 #GALA #BNB #USAR
📌 When trading, pay attention to whether the candlestick patterns align
82
·
--
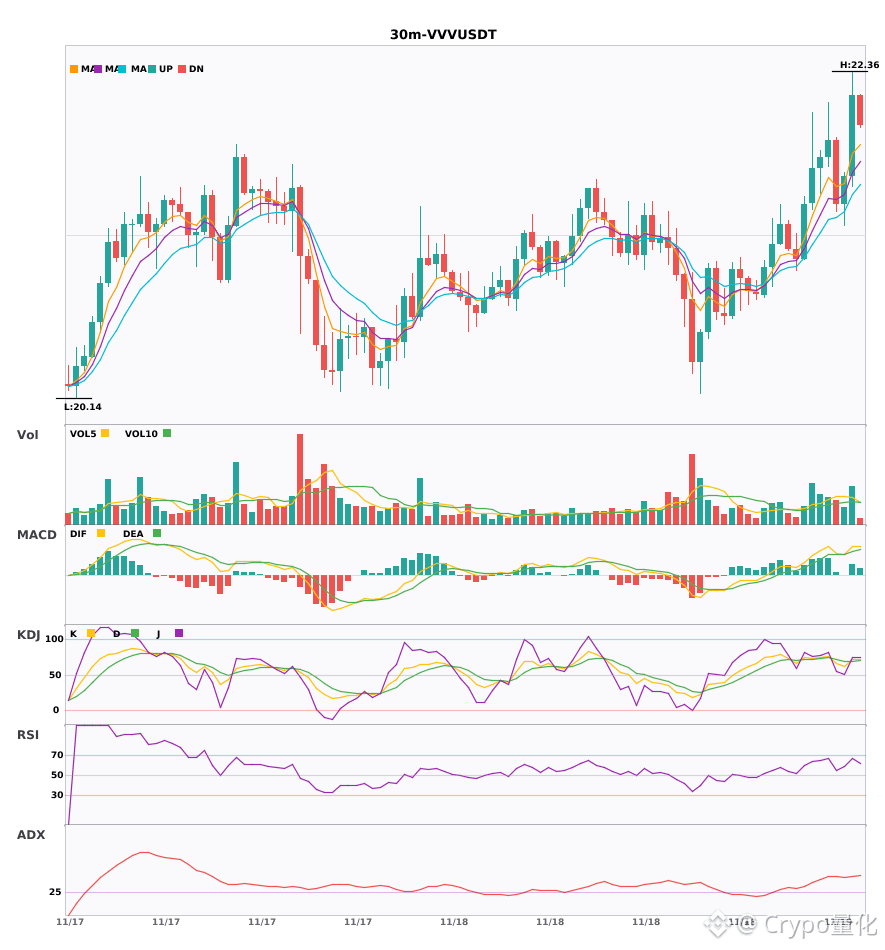
$VVV / $USAR 30-minute golden cross with rising volume; bullish signals have arrived at the same time 🔥
════════════════════
🔴 $VVV 30-minute bullish signal
⚠️ Technical analysis: ADX is as high as 45—the trend is very strong! MACD has formed a golden cross with rising volume, and the red bars continue to grow. The moving averages are in bullish alignment and spreading upward. KDJ has formed a golden cross but isn’t overbought yet. Volume has also risen to 1.6 times its previous level, suggesting a bullish short-term outlook.
════════════════════
🔴 $USAR 30-minute bullish signal
⚠️ Technical analysis: ADX is at 31, and the trend is quite clear. The bulls have been running after the MACD golden cross, but the red bars aren’t as strong as before. The moving averages are in bullish alignment and spreading upward. K has crossed above D but hasn’t entered the overbought zone, and volume has risen to 1.8 times its previous level.
════════════════════
🔔 Follow for first-hand market updates 🔔
#技术分析 #VVV #USAR
📌 When trading, pay attention to whether the candlestick patterns match.
$VVV / $USAR 30-minute golden cross with rising volume; bullish signals have arrived at the same time 🔥
════════════════════
🔴 $VVV 30-minute bullish signal
⚠️ Technical analysis: ADX is as high as 45—the trend is very strong! MACD has formed a golden cross with rising volume, and the red bars continue to grow. The moving averages are in bullish alignment and spreading upward. KDJ has formed a golden cross but isn’t overbought yet. Volume has also risen to 1.6 times its previous level, suggesting a bullish short-term outlook.
════════════════════
🔴 $USAR 30-minute bullish signal
⚠️ Technical analysis: ADX is at 31, and the trend is quite clear. The bulls have been running after the MACD golden cross, but the red bars aren’t as strong as before. The moving averages are in bullish alignment and spreading upward. K has crossed above D but hasn’t entered the overbought zone, and volume has risen to 1.8 times its previous level.
════════════════════
🔔 Follow for first-hand market updates 🔔
#技术分析 #VVV #USAR
📌 When trading, pay attention to whether the candlestick patterns match.
════════════════════
🔴 $VVV 30-minute bullish signal
⚠️ Technical analysis: ADX is as high as 45—the trend is very strong! MACD has formed a golden cross with rising volume, and the red bars continue to grow. The moving averages are in bullish alignment and spreading upward. KDJ has formed a golden cross but isn’t overbought yet. Volume has also risen to 1.6 times its previous level, suggesting a bullish short-term outlook.
════════════════════
🔴 $USAR 30-minute bullish signal
⚠️ Technical analysis: ADX is at 31, and the trend is quite clear. The bulls have been running after the MACD golden cross, but the red bars aren’t as strong as before. The moving averages are in bullish alignment and spreading upward. K has crossed above D but hasn’t entered the overbought zone, and volume has risen to 1.8 times its previous level.
════════════════════
🔔 Follow for first-hand market updates 🔔
#技术分析 #VVV #USAR
📌 When trading, pay attention to whether the candlestick patterns match.
6


·
--
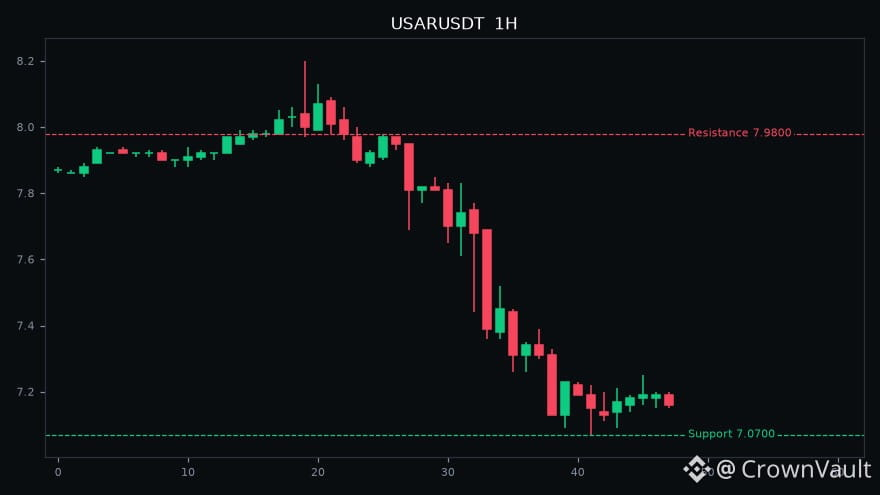
At the 7.2nd percentile, I actually placed several long orders.
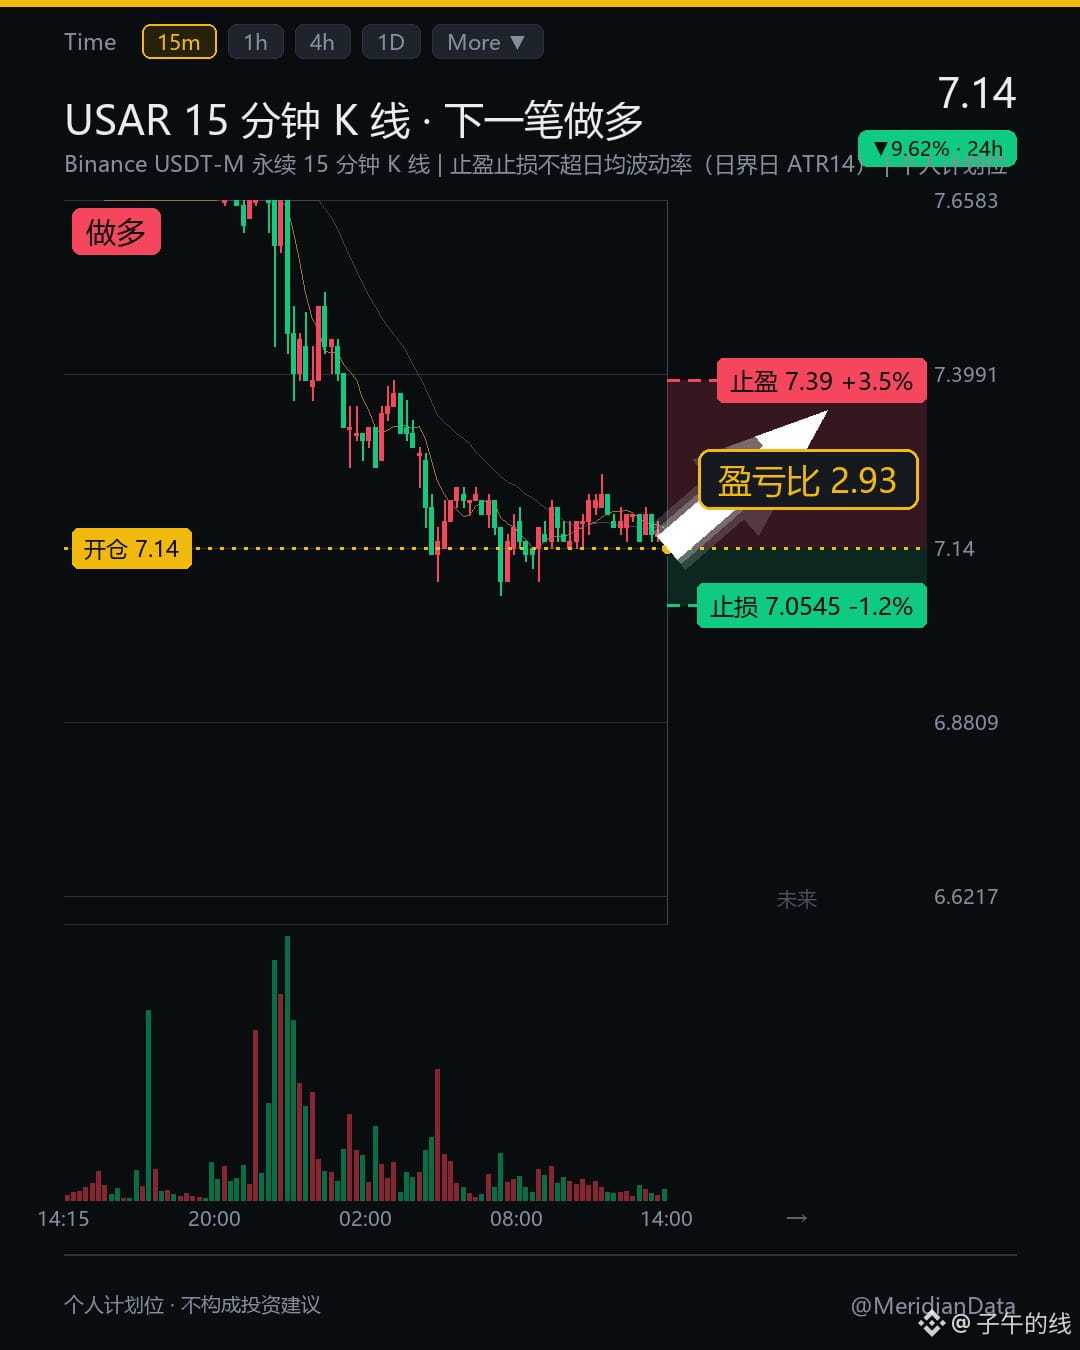
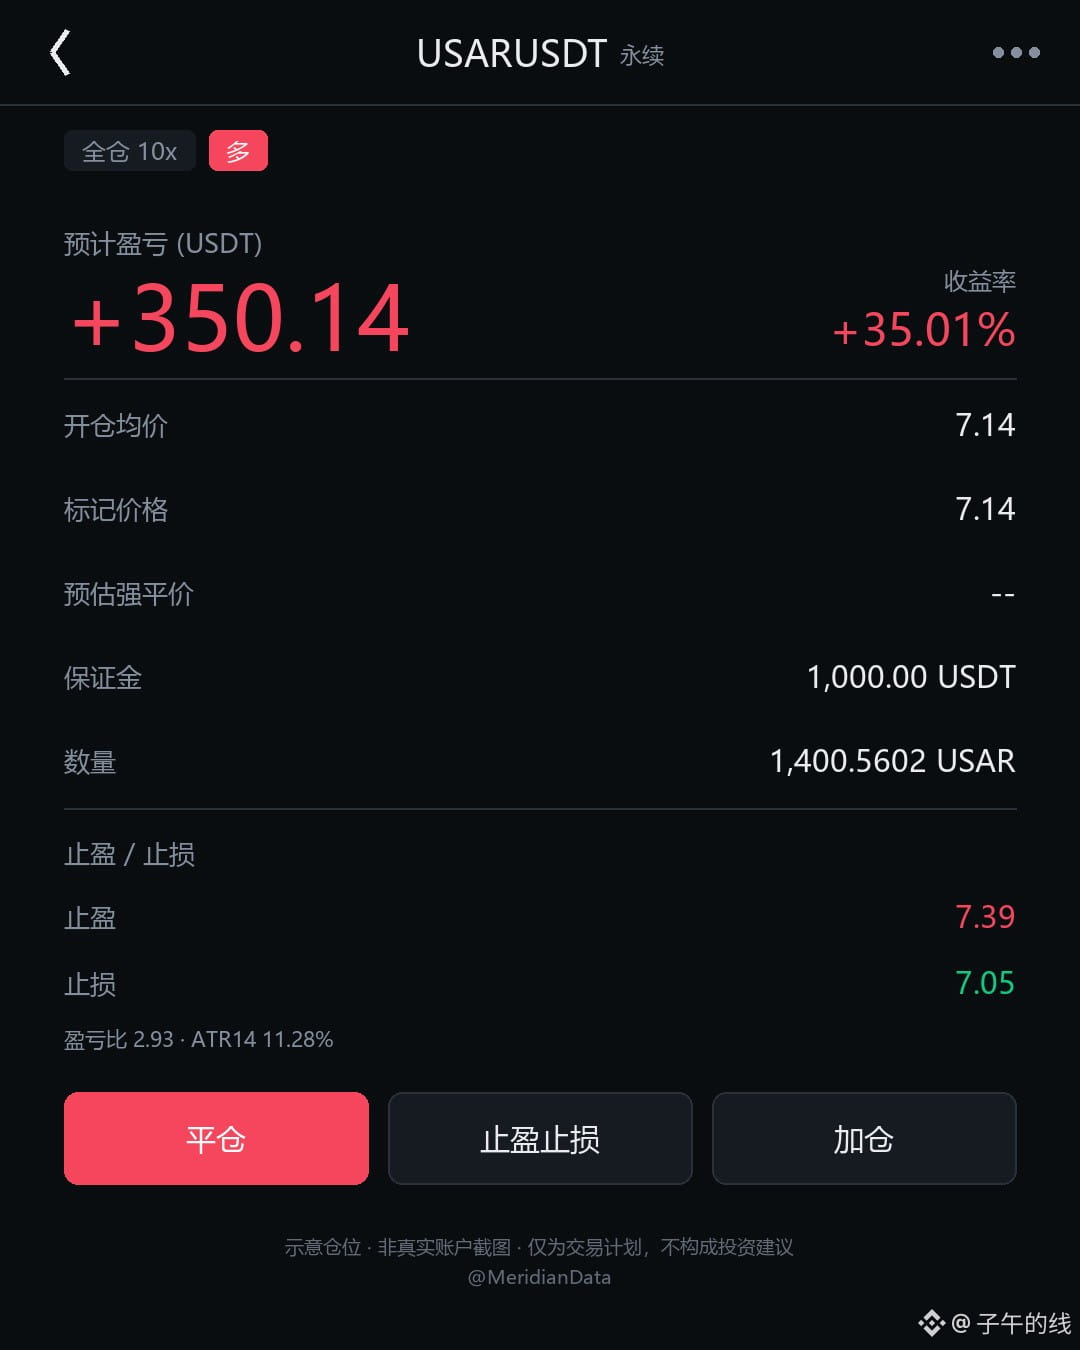
For this trade, $USAR , I'm going long.
Take profit: 7.39
Stop loss: 7.0545
{future}(USARUSDT)
You might be wondering the obvious question: why am I going long at this price?
First, the price level. We're right at the bottom of the 20-day range. It's down 18.77% in seven days, and I don't believe it can keep falling. There's clearly a split in opinion here, so a move lower won't come that easily.
Honestly, I only dared to enter after checking this chart. The average daily volatility is 11.28%.
I set both my take-profit and stop-loss within the average daily volatility, rather than focusing on all those fancy price levels. With a market like this, a single wick can leave a crater.
It's like releasing water from a reservoir: buyers only get interested once the water level is near the bottom.
I'm not chasing it. If it breaks down, I'll accept the loss.
The risk-reward ratio is close to 3:1. You can decide for yourselves if it's worth it. I'm willing to take a shot at this level. The setup is clear; if I'm wrong, I'll own it.
Let's talk in the comments: what do you think of trades at such low percentiles?
$BNB $TRX
#USAR #BNB #Cryptocurrency
The above is a record of my personal trading system and data observations, and does not constitute investment advice.
At the 7.2nd percentile, I actually placed several long orders.
For this trade, $USAR , I'm going long.
Take profit: 7.39
Stop loss: 7.0545
You might be wondering the obvious question: why am I going long at this price?
First, the price level. We're right at the bottom of the 20-day range. It's down 18.77% in seven days, and I don't believe it can keep falling. There's clearly a split in opinion here, so a move lower won't come that easily.
Honestly, I only dared to enter after checking this chart. The average daily volatility is 11.28%.
I set both my take-profit and stop-loss within the average daily volatility, rather than focusing on all those fancy price levels. With a market like this, a single wick can leave a crater.
It's like releasing water from a reservoir: buyers only get interested once the water level is near the bottom.
I'm not chasing it. If it breaks down, I'll accept the loss.
The risk-reward ratio is close to 3:1. You can decide for yourselves if it's worth it. I'm willing to take a shot at this level. The setup is clear; if I'm wrong, I'll own it.
Let's talk in the comments: what do you think of trades at such low percentiles?
$BNB $TRX
#USAR #BNB #Cryptocurrency
The above is a record of my personal trading system and data observations, and does not constitute investment advice.
For this trade, $USAR , I'm going long.
Take profit: 7.39
Stop loss: 7.0545
You might be wondering the obvious question: why am I going long at this price?
First, the price level. We're right at the bottom of the 20-day range. It's down 18.77% in seven days, and I don't believe it can keep falling. There's clearly a split in opinion here, so a move lower won't come that easily.
Honestly, I only dared to enter after checking this chart. The average daily volatility is 11.28%.
I set both my take-profit and stop-loss within the average daily volatility, rather than focusing on all those fancy price levels. With a market like this, a single wick can leave a crater.
It's like releasing water from a reservoir: buyers only get interested once the water level is near the bottom.
I'm not chasing it. If it breaks down, I'll accept the loss.
The risk-reward ratio is close to 3:1. You can decide for yourselves if it's worth it. I'm willing to take a shot at this level. The setup is clear; if I'm wrong, I'll own it.
Let's talk in the comments: what do you think of trades at such low percentiles?
$BNB $TRX
#USAR #BNB #Cryptocurrency
The above is a record of my personal trading system and data observations, and does not constitute investment advice.
·
--
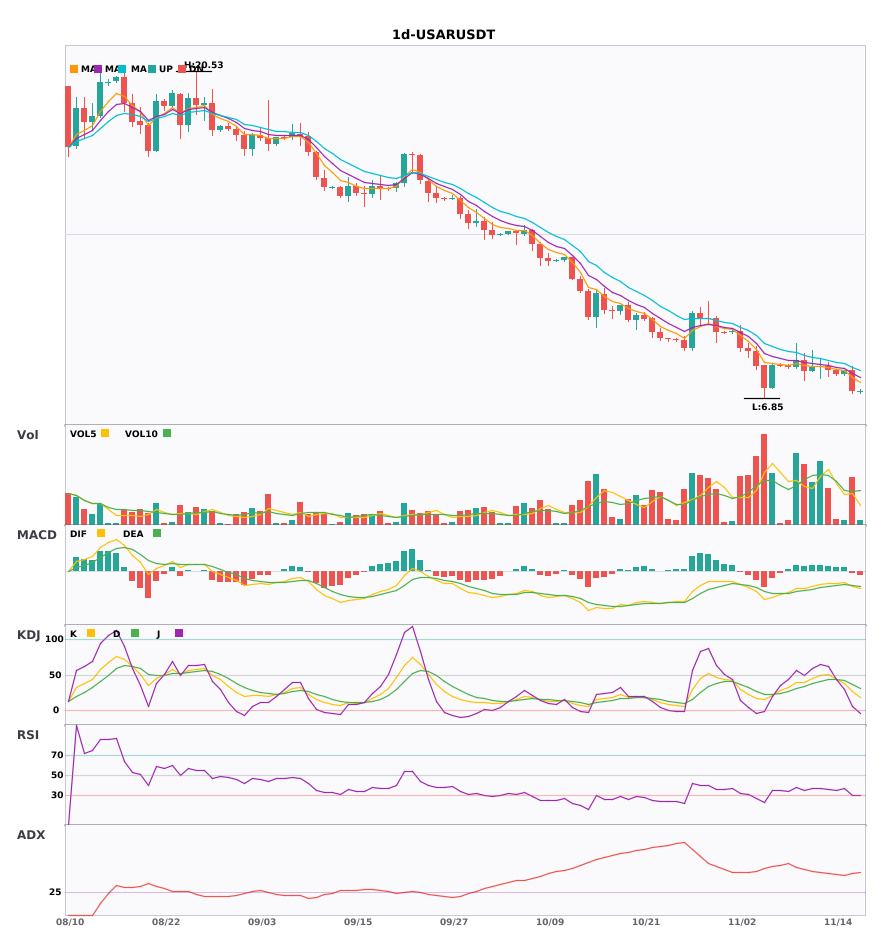
$USAR Daily and weekly bearish alignment; bearish warning—watch out for risk 🔥
════════════════════
🟢 $USAR Daily bearish signal
⚠️Technical analysis: Weekly and daily bearish alignment confirmed: MACD bearish crossover with expanding green bars, moving averages in a diverging bearish alignment, KDJ weak with K crossing below D, volume up 1.4×
════════════════════
🔔 Follow for the latest market updates 🔔
#多周期共振 #USAR
📌 When trading, pay attention to whether the candlestick pattern meets the criteria
$USAR Daily and weekly bearish alignment; bearish warning—watch out for risk 🔥
════════════════════
🟢 $USAR Daily bearish signal
⚠️Technical analysis: Weekly and daily bearish alignment confirmed: MACD bearish crossover with expanding green bars, moving averages in a diverging bearish alignment, KDJ weak with K crossing below D, volume up 1.4×
════════════════════
🔔 Follow for the latest market updates 🔔
#多周期共振 #USAR
📌 When trading, pay attention to whether the candlestick pattern meets the criteria
════════════════════
🟢 $USAR Daily bearish signal
⚠️Technical analysis: Weekly and daily bearish alignment confirmed: MACD bearish crossover with expanding green bars, moving averages in a diverging bearish alignment, KDJ weak with K crossing below D, volume up 1.4×
════════════════════
🔔 Follow for the latest market updates 🔔
#多周期共振 #USAR
📌 When trading, pay attention to whether the candlestick pattern meets the criteria
8
·
--
$USAR 30-minute multi-timeframe confluence; the 4-hour bearish trend is confirmed 🔥
════════════════════
🟢 $USAR 30-minute bearish signal
⚠️Technical analysis: 4-hour bearish trend + 30-minute entry confluence confirmed. MACD is below zero with a high-volume bearish crossover; moving averages are bearishly aligned and diverging downward; KDJ has crossed down but is not oversold. Volume is normal; short-term outlook is bearish.
════════════════════
🔔 Follow for first-hand market updates 🔔
#多周期共振 #USAR
📌 When trading, pay attention to whether the candlestick pattern aligns
$USAR 30-minute multi-timeframe confluence; the 4-hour bearish trend is confirmed 🔥
════════════════════
🟢 $USAR 30-minute bearish signal
⚠️Technical analysis: 4-hour bearish trend + 30-minute entry confluence confirmed. MACD is below zero with a high-volume bearish crossover; moving averages are bearishly aligned and diverging downward; KDJ has crossed down but is not oversold. Volume is normal; short-term outlook is bearish.
════════════════════
🔔 Follow for first-hand market updates 🔔
#多周期共振 #USAR
📌 When trading, pay attention to whether the candlestick pattern aligns
════════════════════
🟢 $USAR 30-minute bearish signal
⚠️Technical analysis: 4-hour bearish trend + 30-minute entry confluence confirmed. MACD is below zero with a high-volume bearish crossover; moving averages are bearishly aligned and diverging downward; KDJ has crossed down but is not oversold. Volume is normal; short-term outlook is bearish.
════════════════════
🔔 Follow for first-hand market updates 🔔
#多周期共振 #USAR
📌 When trading, pay attention to whether the candlestick pattern aligns
4
·
--
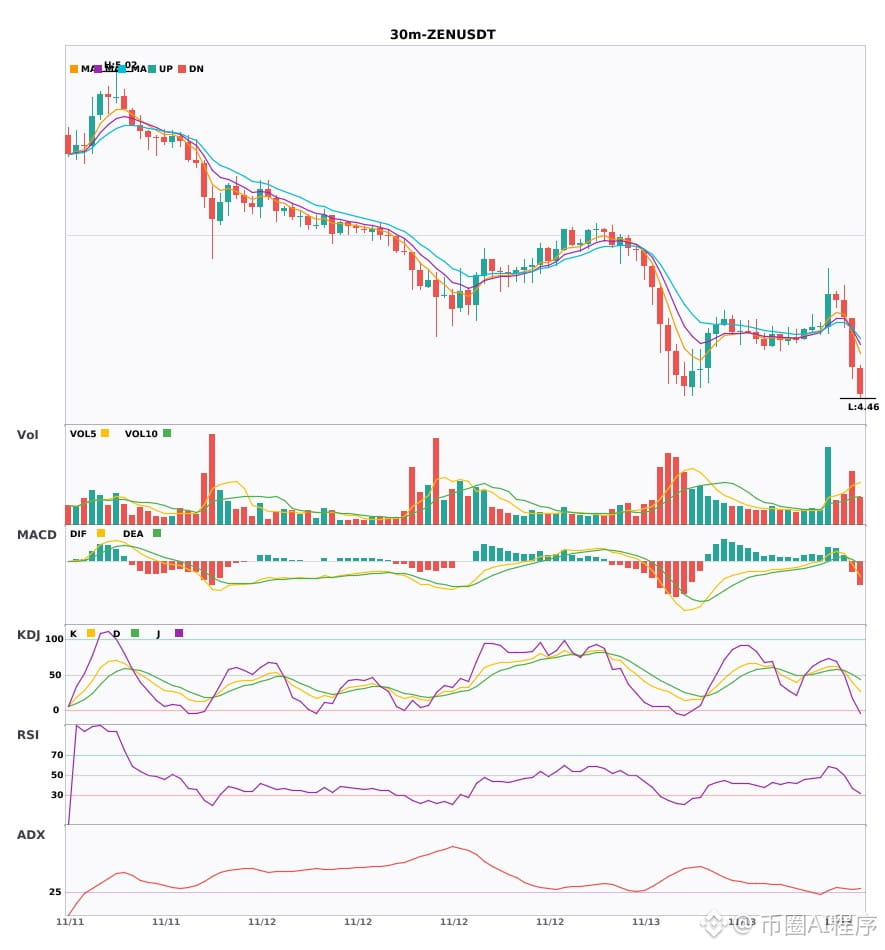
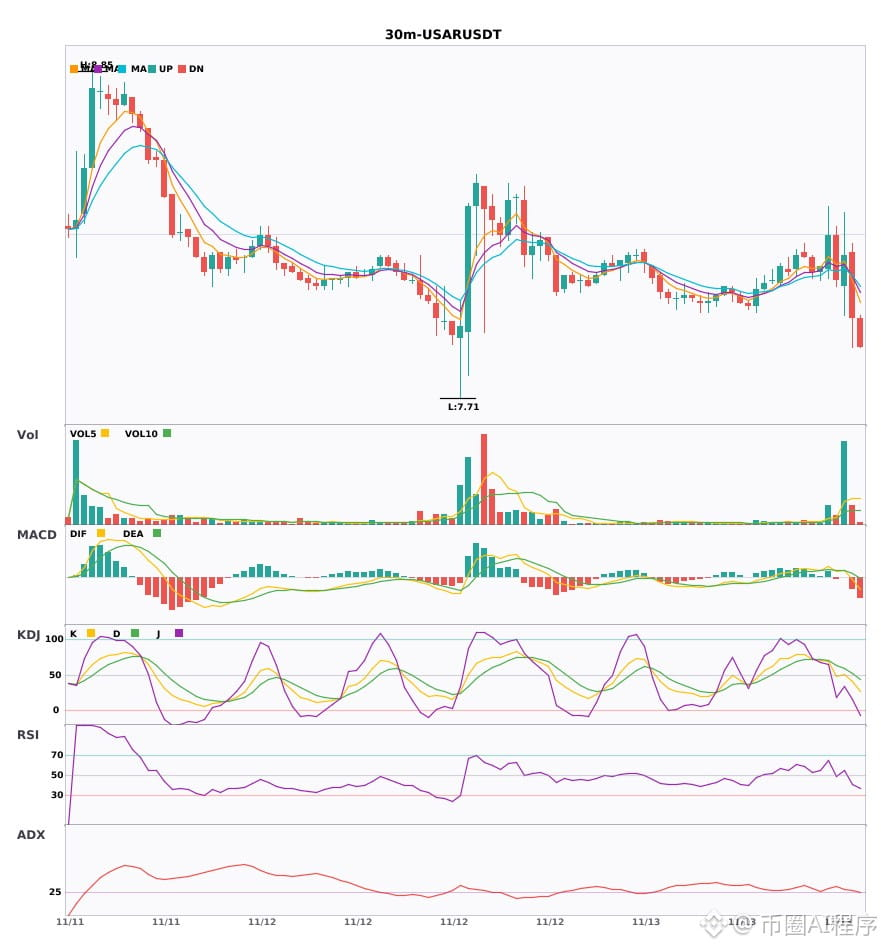
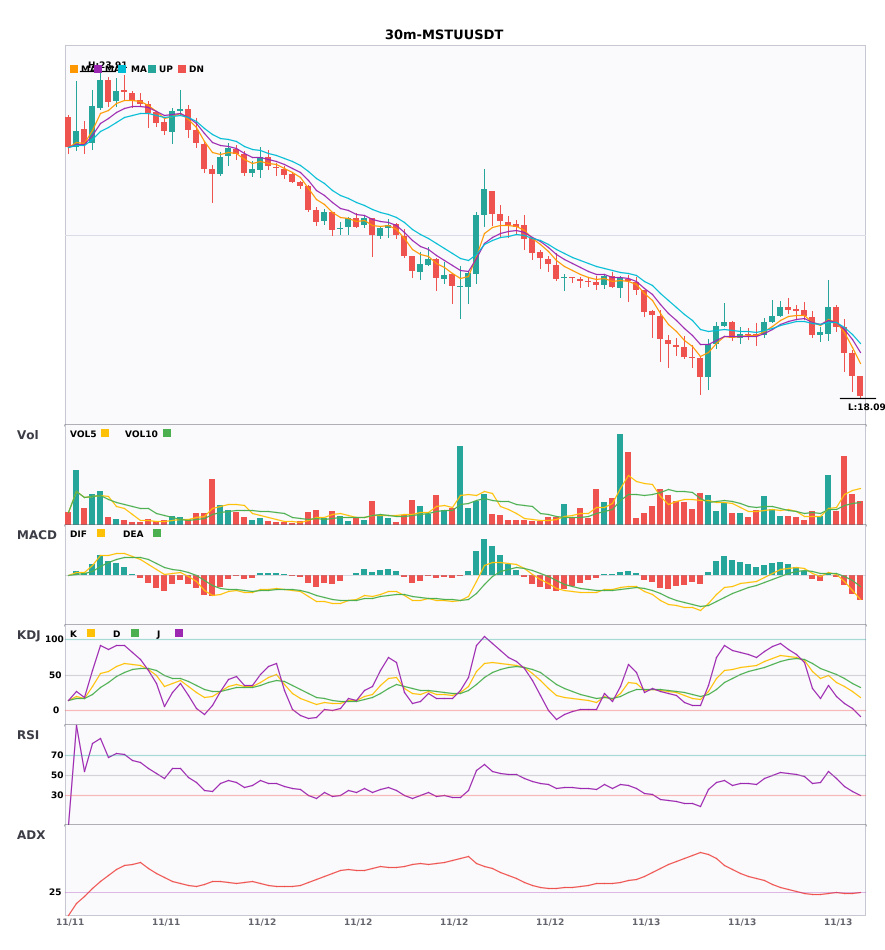
$ZEN $USAR $MSTU 30-minute 4-hour double bearish signal🔥
════════════════════
🟢 $ZEN 30-minute bearish signal
⚠️Technical analysis: 4-hour bearish trend + 30-minute confluence confirmation; MACD bearish crossover with accelerating volume; moving averages bearishly aligned and diverging downward; trading volume doubled
════════════════════
🟢 $USAR 30-minute bearish signal
⚠️Technical analysis: 4-hour bullish trend + daily bullish confluence confirmation; 30-minute MACD bullish crossover with rising volume and red bars continuing to grow; moving averages bullishly aligned and diverging upward; KDJ K crossed above D and has not entered the overbought zone
════════════════════
🟢 $MSTU 30-minute bearish signal
⚠️Technical analysis: 4-hour bearish trend + 30-minute confluence confirmation: MACD bearish crossover broke below the zero line on rising volume; moving averages bearishly aligned and moving downward; KDJ K crossed below D but is not oversold; volume increased 3.4 times
════════════════════
🔔 Follow to get first-hand market updates 🔔
#多周期共振 #ZEN #USAR #MSTU
📌 When trading, pay attention to whether the candlestick pattern aligns
$ZEN $USAR $MSTU 30-minute 4-hour double bearish signal🔥
════════════════════
🟢 $ZEN 30-minute bearish signal
⚠️Technical analysis: 4-hour bearish trend + 30-minute confluence confirmation; MACD bearish crossover with accelerating volume; moving averages bearishly aligned and diverging downward; trading volume doubled
════════════════════
🟢 $USAR 30-minute bearish signal
⚠️Technical analysis: 4-hour bullish trend + daily bullish confluence confirmation; 30-minute MACD bullish crossover with rising volume and red bars continuing to grow; moving averages bullishly aligned and diverging upward; KDJ K crossed above D and has not entered the overbought zone
════════════════════
🟢 $MSTU 30-minute bearish signal
⚠️Technical analysis: 4-hour bearish trend + 30-minute confluence confirmation: MACD bearish crossover broke below the zero line on rising volume; moving averages bearishly aligned and moving downward; KDJ K crossed below D but is not oversold; volume increased 3.4 times
════════════════════
🔔 Follow to get first-hand market updates 🔔
#多周期共振 #ZEN #USAR #MSTU
📌 When trading, pay attention to whether the candlestick pattern aligns
════════════════════
🟢 $ZEN 30-minute bearish signal
⚠️Technical analysis: 4-hour bearish trend + 30-minute confluence confirmation; MACD bearish crossover with accelerating volume; moving averages bearishly aligned and diverging downward; trading volume doubled
════════════════════
🟢 $USAR 30-minute bearish signal
⚠️Technical analysis: 4-hour bullish trend + daily bullish confluence confirmation; 30-minute MACD bullish crossover with rising volume and red bars continuing to grow; moving averages bullishly aligned and diverging upward; KDJ K crossed above D and has not entered the overbought zone
════════════════════
🟢 $MSTU 30-minute bearish signal
⚠️Technical analysis: 4-hour bearish trend + 30-minute confluence confirmation: MACD bearish crossover broke below the zero line on rising volume; moving averages bearishly aligned and moving downward; KDJ K crossed below D but is not oversold; volume increased 3.4 times
════════════════════
🔔 Follow to get first-hand market updates 🔔
#多周期共振 #ZEN #USAR #MSTU
📌 When trading, pay attention to whether the candlestick pattern aligns
46
·
--
Bearish alignment on the 30-minute and 4-hour moving averages; confirmed synchronized downside signals across 3 coins 🔥
════════════════════
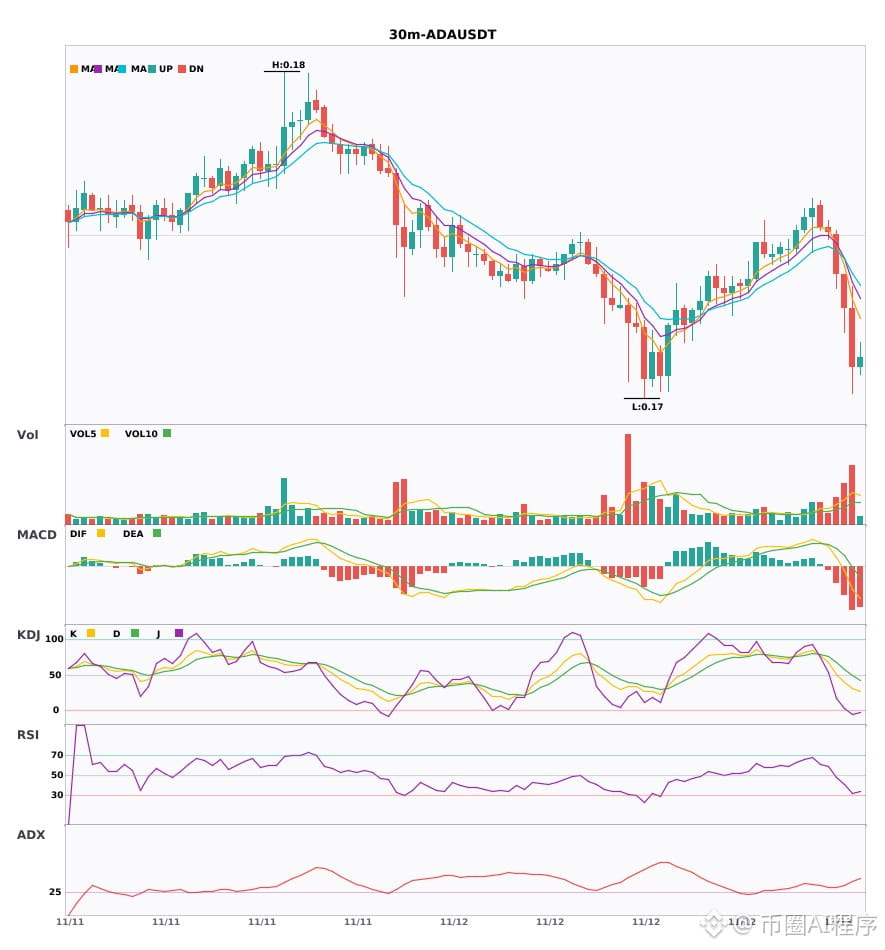
🟢 $ADA 30-minute bearish signal
⚠️ Technical analysis: 4-hour bearish trend + 30-minute confluence confirmation. MACD green bars continue to expand, signaling strengthening momentum. Moving averages are bearishly aligned and diverging downward. K has crossed below D but is not yet in oversold territory. Volume has increased 2.6-fold; the bearish signal is clear.
════════════════════
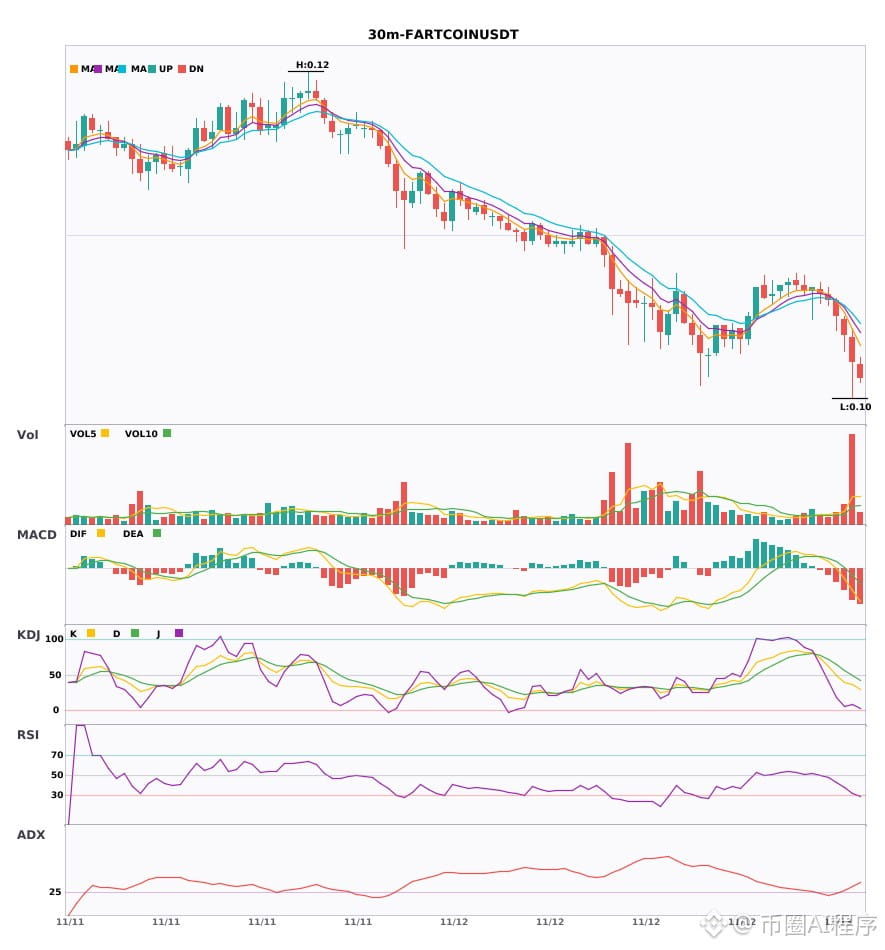
🟢 $FARTCOIN 30-minute bearish signal
⚠️ Technical analysis: 4-hour bearish trend + multi-timeframe confluence for a 30-minute entry! MACD has formed a death cross and fallen below the zero line. Moving averages have just formed a bearish alignment and are diverging downward. Volume has increased 1.9-fold; the confluence short signal is clear.
════════════════════
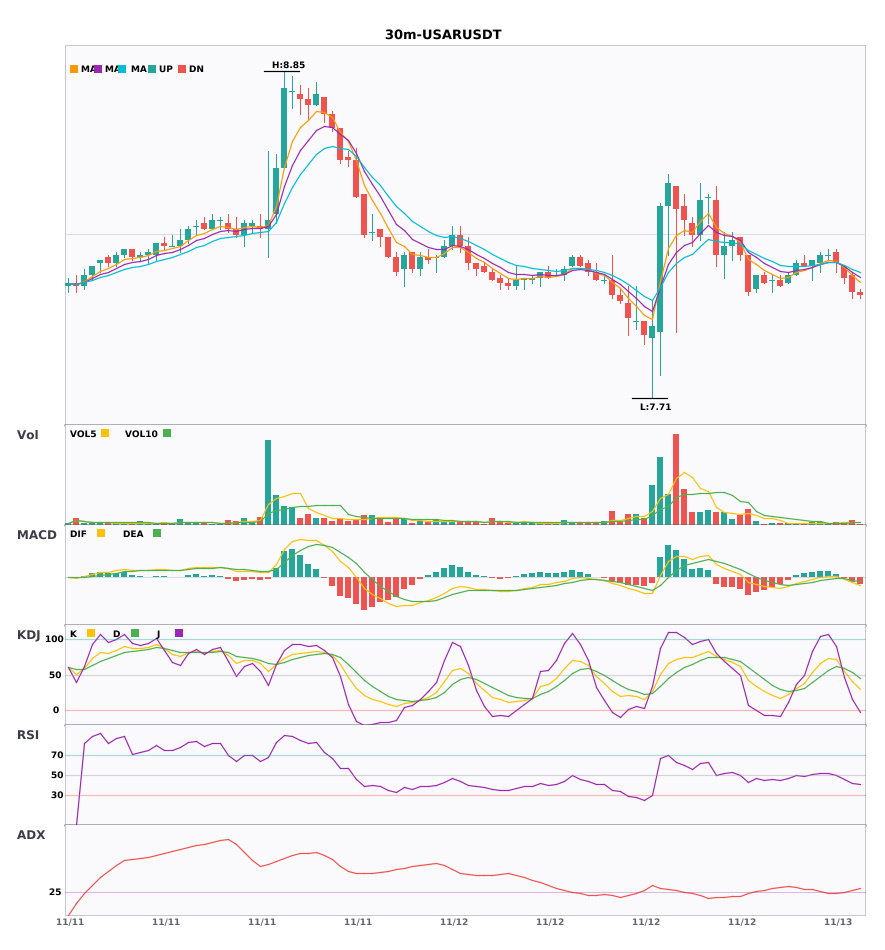
🟢 $USAR 30-minute bearish signal
⚠️ Technical analysis: 4-hour bearish confluence confirmed. On the 30-minute chart, MACD has formed a death cross with rising volume, EMA has just crossed bearishly, and KDJ has formed a death cross but is not oversold. Volume is at a normal 1.3x. Short.
════════════════════
🔔 Follow for first-hand market movement alerts 🔔
#多周期共振 #ADA #FARTCOIN #USAR
📌 When trading, pay attention to whether the candlestick pattern matches
Bearish alignment on the 30-minute and 4-hour moving averages; confirmed synchronized downside signals across 3 coins 🔥
════════════════════
🟢 $ADA 30-minute bearish signal
⚠️ Technical analysis: 4-hour bearish trend + 30-minute confluence confirmation. MACD green bars continue to expand, signaling strengthening momentum. Moving averages are bearishly aligned and diverging downward. K has crossed below D but is not yet in oversold territory. Volume has increased 2.6-fold; the bearish signal is clear.
════════════════════
🟢 $FARTCOIN 30-minute bearish signal
⚠️ Technical analysis: 4-hour bearish trend + multi-timeframe confluence for a 30-minute entry! MACD has formed a death cross and fallen below the zero line. Moving averages have just formed a bearish alignment and are diverging downward. Volume has increased 1.9-fold; the confluence short signal is clear.
════════════════════
🟢 $USAR 30-minute bearish signal
⚠️ Technical analysis: 4-hour bearish confluence confirmed. On the 30-minute chart, MACD has formed a death cross with rising volume, EMA has just crossed bearishly, and KDJ has formed a death cross but is not oversold. Volume is at a normal 1.3x. Short.
════════════════════
🔔 Follow for first-hand market movement alerts 🔔
#多周期共振 #ADA #FARTCOIN #USAR
📌 When trading, pay attention to whether the candlestick pattern matches
════════════════════
🟢 $ADA 30-minute bearish signal
⚠️ Technical analysis: 4-hour bearish trend + 30-minute confluence confirmation. MACD green bars continue to expand, signaling strengthening momentum. Moving averages are bearishly aligned and diverging downward. K has crossed below D but is not yet in oversold territory. Volume has increased 2.6-fold; the bearish signal is clear.
════════════════════
🟢 $FARTCOIN 30-minute bearish signal
⚠️ Technical analysis: 4-hour bearish trend + multi-timeframe confluence for a 30-minute entry! MACD has formed a death cross and fallen below the zero line. Moving averages have just formed a bearish alignment and are diverging downward. Volume has increased 1.9-fold; the confluence short signal is clear.
════════════════════
🟢 $USAR 30-minute bearish signal
⚠️ Technical analysis: 4-hour bearish confluence confirmed. On the 30-minute chart, MACD has formed a death cross with rising volume, EMA has just crossed bearishly, and KDJ has formed a death cross but is not oversold. Volume is at a normal 1.3x. Short.
════════════════════
🔔 Follow for first-hand market movement alerts 🔔
#多周期共振 #ADA #FARTCOIN #USAR
📌 When trading, pay attention to whether the candlestick pattern matches
29
·
--
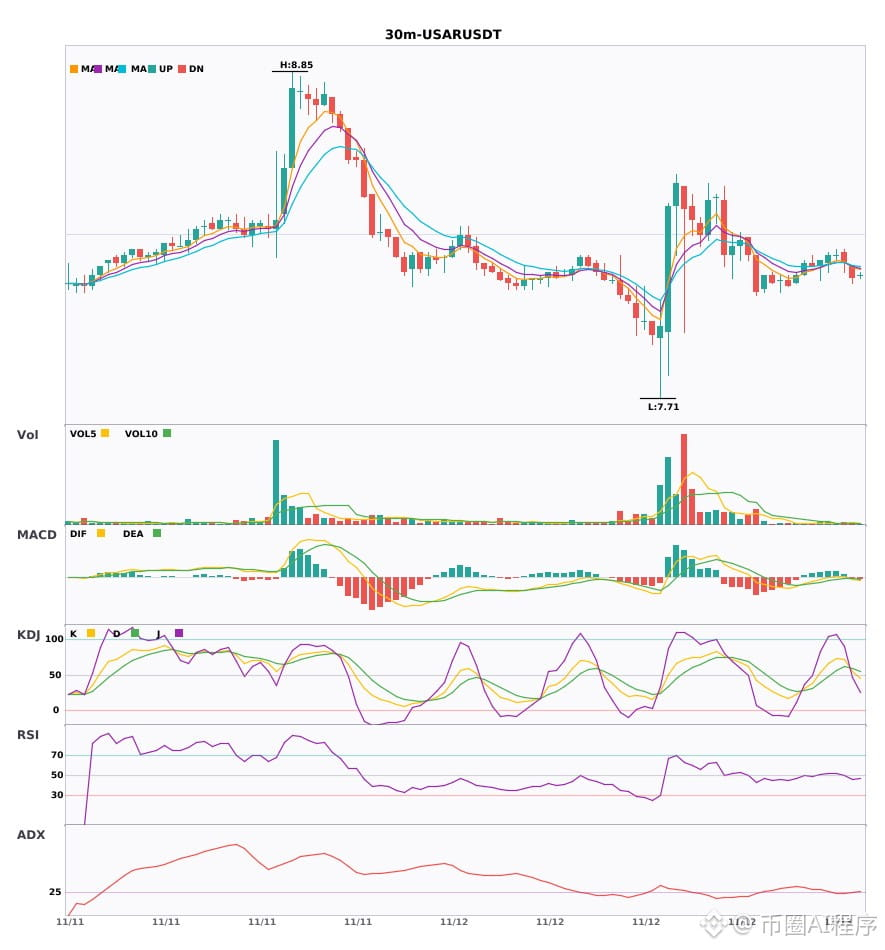
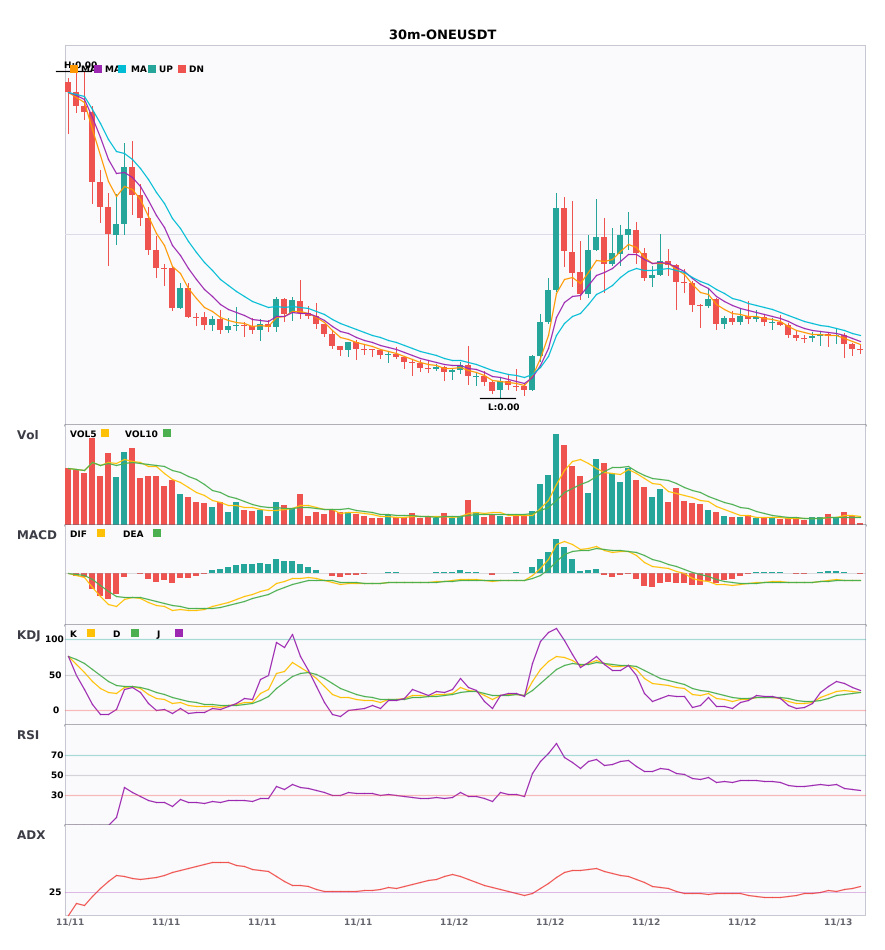
$LTC / $USAR / $ONE 30-minute shorts + 4-hour shorts aligned; multi-timeframe confluence turns bearish 🔥
════════════════════
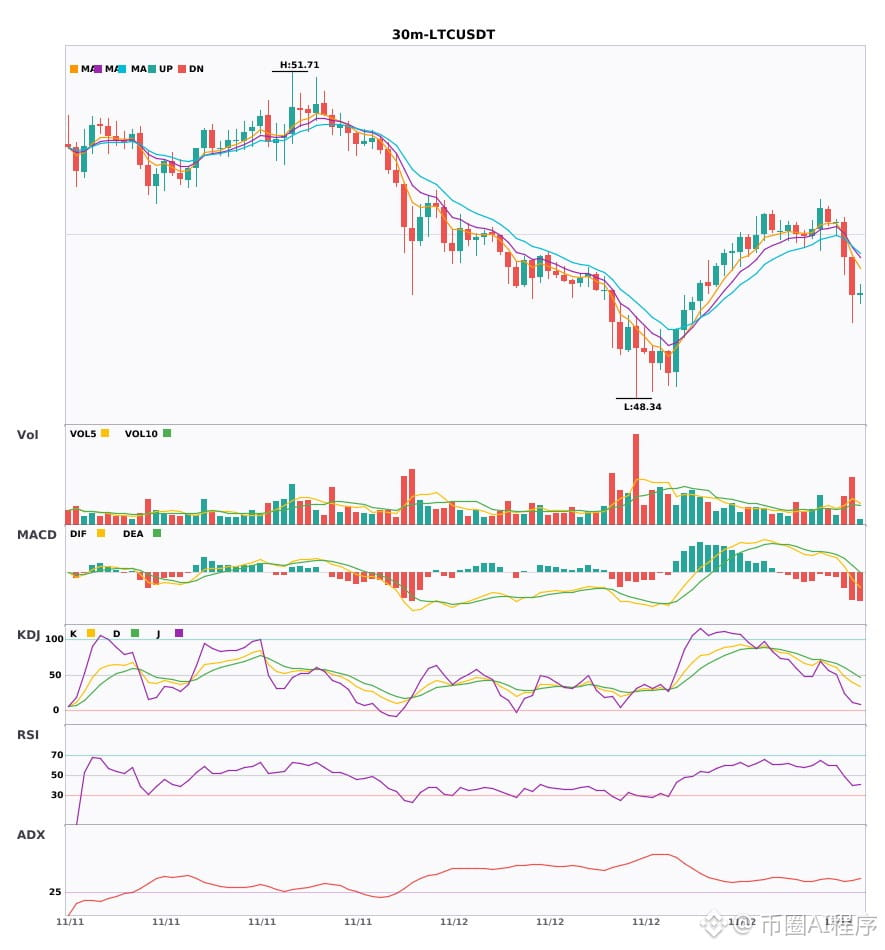
🟢 $LTC 30-minute short signal
⚠️Technical analysis: 30-minute entry signal: MACD breaks below the zero line and turns bearish; moving averages have just formed a bearish alignment and are diverging downward; volume is 2.4 times higher. 4-hour bearish confluence confirmed; multiple timeframes are aligned to the downside.
════════════════════
🟢 $USAR 30-minute short signal
⚠️Technical analysis: 4-hour bearish trend + 30-minute entry signal create multi-timeframe confluence. MACD bearish crossover below zero with accelerating volume; EMA5 has just crossed below EMA8, turning bearish; KDJ bearish crossover without being overbought; volume is normal. Confluence points to the downside.
════════════════════
🟢 $ONE 30-minute short signal
⚠️Technical analysis: Multi-timeframe confluence for a short: 4-hour bearish trend + 30-minute entry signal confirmed. MACD bearish crossover with accelerating volume; moving averages are bearishly aligned and trending downward; KDJ is weak, with bears in control.
════════════════════
🔔 Follow for first-hand alerts on unusual market movements 🔔
#多周期共振 #LTC #USAR #ONE
📌 When trading, pay attention to whether the candlestick pattern confirms the signal
$LTC / $USAR / $ONE 30-minute shorts + 4-hour shorts aligned; multi-timeframe confluence turns bearish 🔥
════════════════════
🟢 $LTC 30-minute short signal
⚠️Technical analysis: 30-minute entry signal: MACD breaks below the zero line and turns bearish; moving averages have just formed a bearish alignment and are diverging downward; volume is 2.4 times higher. 4-hour bearish confluence confirmed; multiple timeframes are aligned to the downside.
════════════════════
🟢 $USAR 30-minute short signal
⚠️Technical analysis: 4-hour bearish trend + 30-minute entry signal create multi-timeframe confluence. MACD bearish crossover below zero with accelerating volume; EMA5 has just crossed below EMA8, turning bearish; KDJ bearish crossover without being overbought; volume is normal. Confluence points to the downside.
════════════════════
🟢 $ONE 30-minute short signal
⚠️Technical analysis: Multi-timeframe confluence for a short: 4-hour bearish trend + 30-minute entry signal confirmed. MACD bearish crossover with accelerating volume; moving averages are bearishly aligned and trending downward; KDJ is weak, with bears in control.
════════════════════
🔔 Follow for first-hand alerts on unusual market movements 🔔
#多周期共振 #LTC #USAR #ONE
📌 When trading, pay attention to whether the candlestick pattern confirms the signal
════════════════════
🟢 $LTC 30-minute short signal
⚠️Technical analysis: 30-minute entry signal: MACD breaks below the zero line and turns bearish; moving averages have just formed a bearish alignment and are diverging downward; volume is 2.4 times higher. 4-hour bearish confluence confirmed; multiple timeframes are aligned to the downside.
════════════════════
🟢 $USAR 30-minute short signal
⚠️Technical analysis: 4-hour bearish trend + 30-minute entry signal create multi-timeframe confluence. MACD bearish crossover below zero with accelerating volume; EMA5 has just crossed below EMA8, turning bearish; KDJ bearish crossover without being overbought; volume is normal. Confluence points to the downside.
════════════════════
🟢 $ONE 30-minute short signal
⚠️Technical analysis: Multi-timeframe confluence for a short: 4-hour bearish trend + 30-minute entry signal confirmed. MACD bearish crossover with accelerating volume; moving averages are bearishly aligned and trending downward; KDJ is weak, with bears in control.
════════════════════
🔔 Follow for first-hand alerts on unusual market movements 🔔
#多周期共振 #LTC #USAR #ONE
📌 When trading, pay attention to whether the candlestick pattern confirms the signal
13
·
--
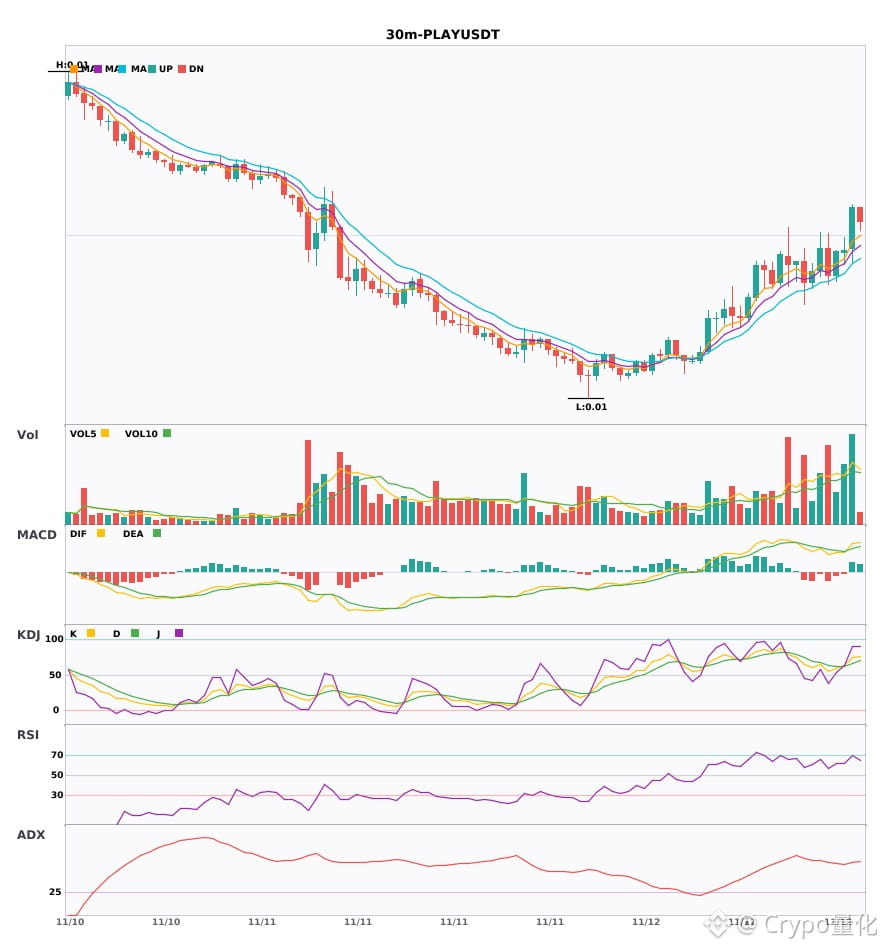
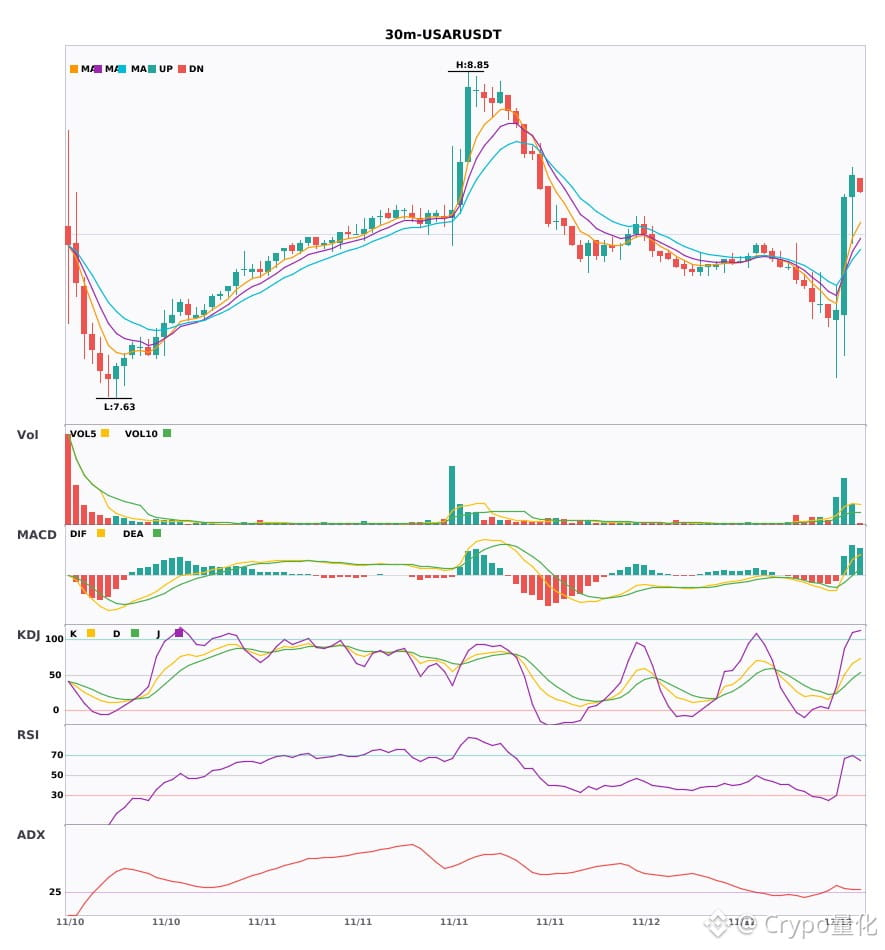
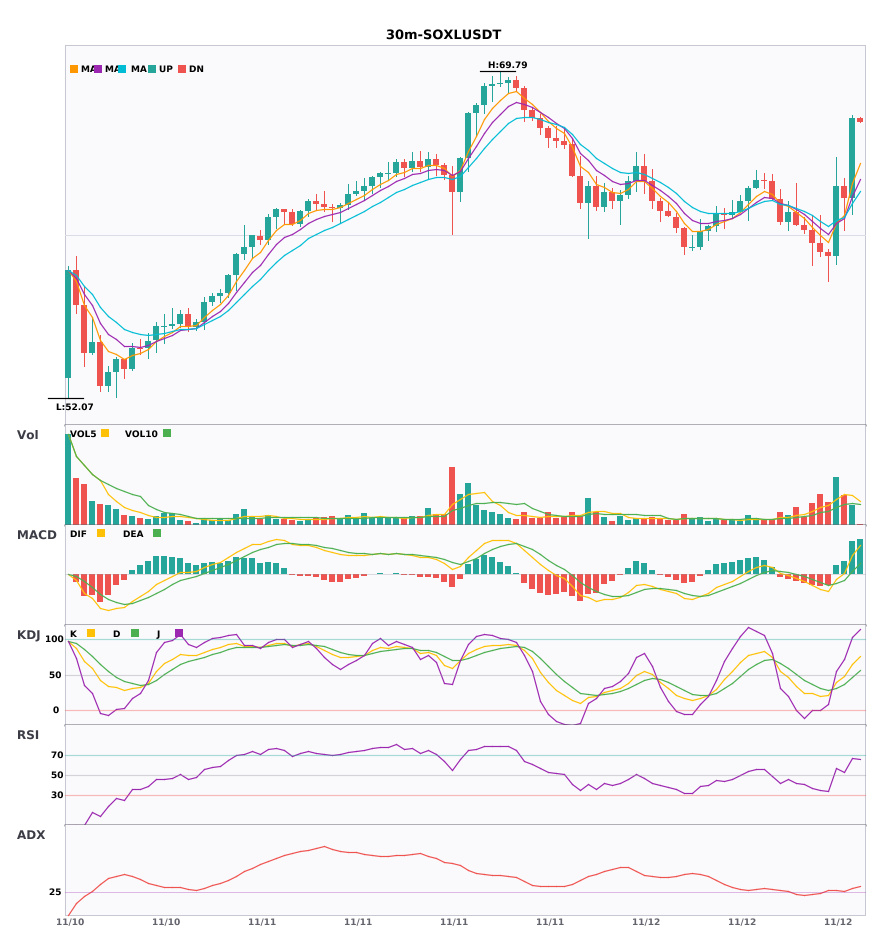
$PLAY / $USAR / $SOXL 30-minute confluence turns bullish; bullish signals appear simultaneously 🔥
════════════════════
🔴 $PLAY 30-minute bullish signal
⚠️Technical analysis: ADX(58) indicates a very strong trend (beware of a potentially overheated pullback) | MACD golden cross above zero; bullish momentum is being released | EMA5 > EMA8 > EMA13, bullish alignment | KDJ is running strong, with bulls in control (K: 74.1, D: 66.3) | Volume increases (1.7x)
════════════════════
🔴 $USAR 30-minute bullish signal
⚠️Technical analysis: ADX(31) indicates a clear trending market | MACD is bullish; the trend is strong and momentum is increasing | EMA5 > EMA8 > EMA13, bullish alignment | Volume surges (4.3x)
════════════════════
🔴 $SOXL 30-minute bullish signal
⚠️Technical analysis: ADX(29) indicates a trend is forming; an opportunity to participate | MACD DIF breaks above the zero line, signaling a bullish trend reversal | EMA5 crosses above EMA8, signaling a short-term bullish reversal | KDJ is running weak, with bears in control (K: 48.6, D: 37.3) | Volume surges (2.7x)
════════════════════
🔔 Follow for first-hand market updates 🔔
#技术分析 #PLAY #USAR #SOXL
📌 When trading, pay attention to whether the candlestick pattern confirms the signal
$PLAY / $USAR / $SOXL 30-minute confluence turns bullish; bullish signals appear simultaneously 🔥
════════════════════
🔴 $PLAY 30-minute bullish signal
⚠️Technical analysis: ADX(58) indicates a very strong trend (beware of a potentially overheated pullback) | MACD golden cross above zero; bullish momentum is being released | EMA5 > EMA8 > EMA13, bullish alignment | KDJ is running strong, with bulls in control (K: 74.1, D: 66.3) | Volume increases (1.7x)
════════════════════
🔴 $USAR 30-minute bullish signal
⚠️Technical analysis: ADX(31) indicates a clear trending market | MACD is bullish; the trend is strong and momentum is increasing | EMA5 > EMA8 > EMA13, bullish alignment | Volume surges (4.3x)
════════════════════
🔴 $SOXL 30-minute bullish signal
⚠️Technical analysis: ADX(29) indicates a trend is forming; an opportunity to participate | MACD DIF breaks above the zero line, signaling a bullish trend reversal | EMA5 crosses above EMA8, signaling a short-term bullish reversal | KDJ is running weak, with bears in control (K: 48.6, D: 37.3) | Volume surges (2.7x)
════════════════════
🔔 Follow for first-hand market updates 🔔
#技术分析 #PLAY #USAR #SOXL
📌 When trading, pay attention to whether the candlestick pattern confirms the signal
════════════════════
🔴 $PLAY 30-minute bullish signal
⚠️Technical analysis: ADX(58) indicates a very strong trend (beware of a potentially overheated pullback) | MACD golden cross above zero; bullish momentum is being released | EMA5 > EMA8 > EMA13, bullish alignment | KDJ is running strong, with bulls in control (K: 74.1, D: 66.3) | Volume increases (1.7x)
════════════════════
🔴 $USAR 30-minute bullish signal
⚠️Technical analysis: ADX(31) indicates a clear trending market | MACD is bullish; the trend is strong and momentum is increasing | EMA5 > EMA8 > EMA13, bullish alignment | Volume surges (4.3x)
════════════════════
🔴 $SOXL 30-minute bullish signal
⚠️Technical analysis: ADX(29) indicates a trend is forming; an opportunity to participate | MACD DIF breaks above the zero line, signaling a bullish trend reversal | EMA5 crosses above EMA8, signaling a short-term bullish reversal | KDJ is running weak, with bears in control (K: 48.6, D: 37.3) | Volume surges (2.7x)
════════════════════
🔔 Follow for first-hand market updates 🔔
#技术分析 #PLAY #USAR #SOXL
📌 When trading, pay attention to whether the candlestick pattern confirms the signal
20

·
--
Verified
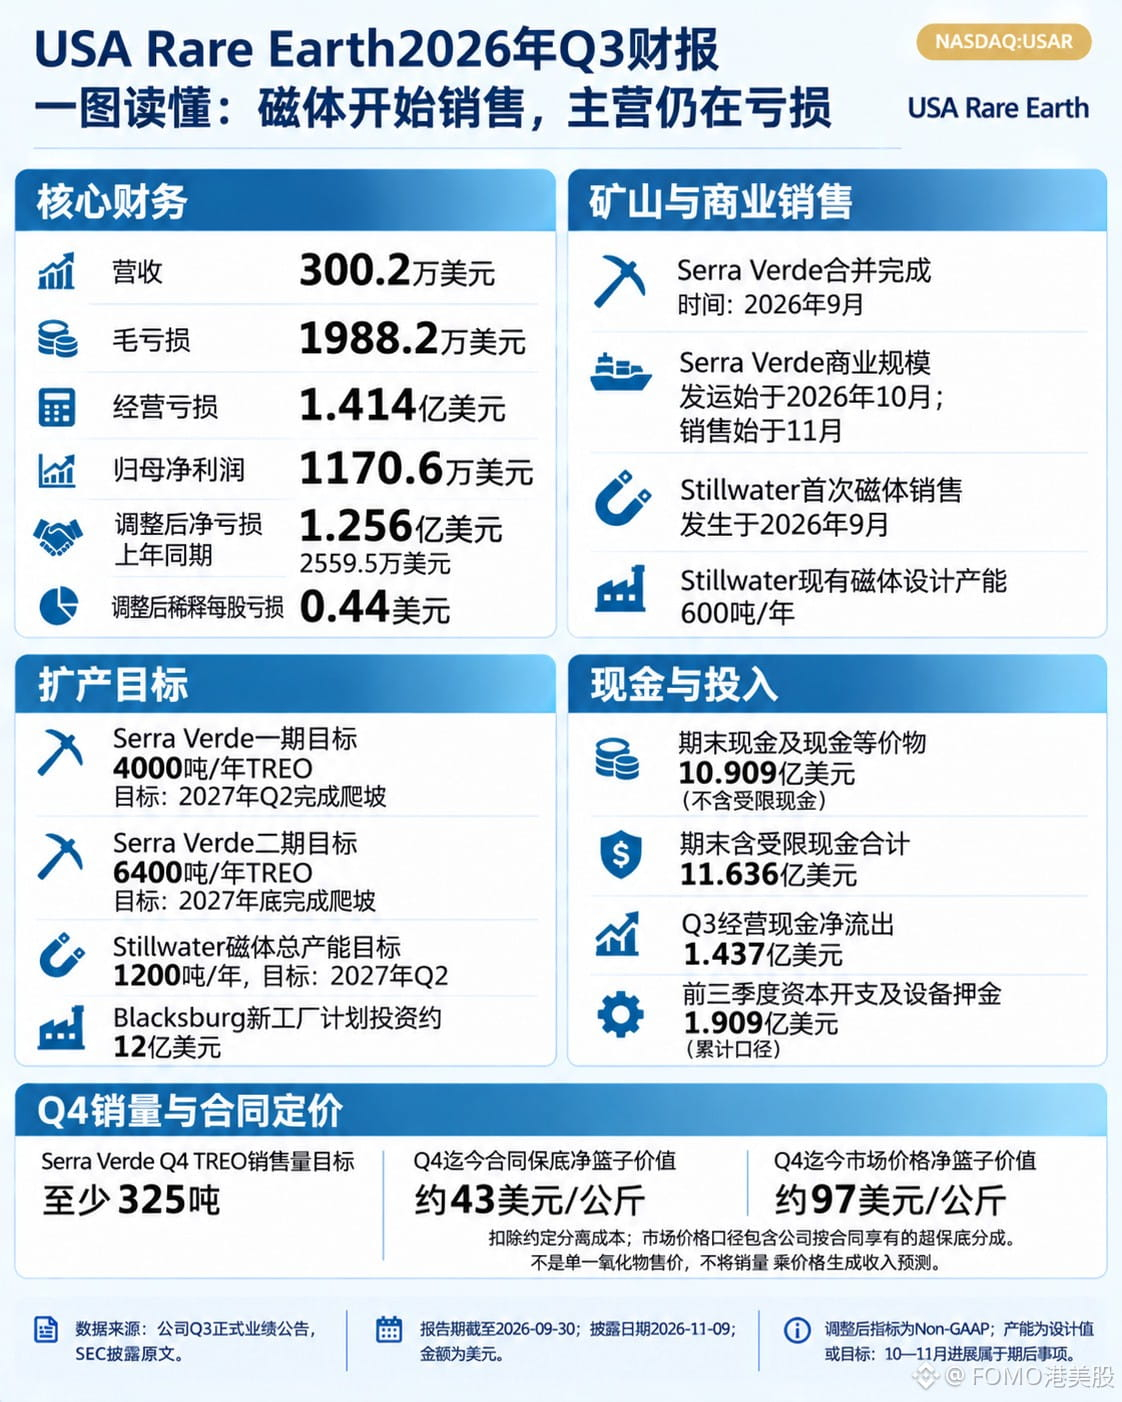
USA Rare Earth $USARB reported third-quarter revenue of $3.002 million, an operating loss of $141.4 million, yet positive net income attributable to the parent of $11.706 million.
The business did move forward. In September, the Stillwater plant sold its first batch of sintered NdFeB block magnets, with a designed capacity of 600 tonnes per year. Serra Verde’s merger was also completed in September, but commercial shipments only began in October, and sales only started in November, so they are not included in the third quarter. The Q4 TREO sales target is at least 325 tonnes.
The profit came from valuation gains.
The $136.6 million fair value gain fell $4.8 million short of offsetting the $141.4 million operating loss; it took other items to bring net income to $11.706 million. The company’s adjusted net loss was $125.6 million, 4.9 times that of the same period last year. Gross loss was $19.882 million, and the operating loss was 47 times revenue.
Cash at quarter-end was $1.0909 billion. Quarterly operating cash outflow was $143.7 million, enough to fund operations for seven and a half quarters. The budget for the new Blacksburg plant is $1.2 billion, more than the cash on the books. Whether those 325 tonnes in Q4 can turn into revenue will mark the first step in the ramp-up.
{spot}(USARBUSDT)
#USAR #BStocks #股票财报季
USA Rare Earth $USARB reported third-quarter revenue of $3.002 million, an operating loss of $141.4 million, yet positive net income attributable to the parent of $11.706 million.
The business did move forward. In September, the Stillwater plant sold its first batch of sintered NdFeB block magnets, with a designed capacity of 600 tonnes per year. Serra Verde’s merger was also completed in September, but commercial shipments only began in October, and sales only started in November, so they are not included in the third quarter. The Q4 TREO sales target is at least 325 tonnes.
The profit came from valuation gains.
The $136.6 million fair value gain fell $4.8 million short of offsetting the $141.4 million operating loss; it took other items to bring net income to $11.706 million. The company’s adjusted net loss was $125.6 million, 4.9 times that of the same period last year. Gross loss was $19.882 million, and the operating loss was 47 times revenue.
Cash at quarter-end was $1.0909 billion. Quarterly operating cash outflow was $143.7 million, enough to fund operations for seven and a half quarters. The budget for the new Blacksburg plant is $1.2 billion, more than the cash on the books. Whether those 325 tonnes in Q4 can turn into revenue will mark the first step in the ramp-up.
#USAR #BStocks #股票财报季
The business did move forward. In September, the Stillwater plant sold its first batch of sintered NdFeB block magnets, with a designed capacity of 600 tonnes per year. Serra Verde’s merger was also completed in September, but commercial shipments only began in October, and sales only started in November, so they are not included in the third quarter. The Q4 TREO sales target is at least 325 tonnes.
The profit came from valuation gains.
The $136.6 million fair value gain fell $4.8 million short of offsetting the $141.4 million operating loss; it took other items to bring net income to $11.706 million. The company’s adjusted net loss was $125.6 million, 4.9 times that of the same period last year. Gross loss was $19.882 million, and the operating loss was 47 times revenue.
Cash at quarter-end was $1.0909 billion. Quarterly operating cash outflow was $143.7 million, enough to fund operations for seven and a half quarters. The budget for the new Blacksburg plant is $1.2 billion, more than the cash on the books. Whether those 325 tonnes in Q4 can turn into revenue will mark the first step in the ramp-up.
#USAR #BStocks #股票财报季
828
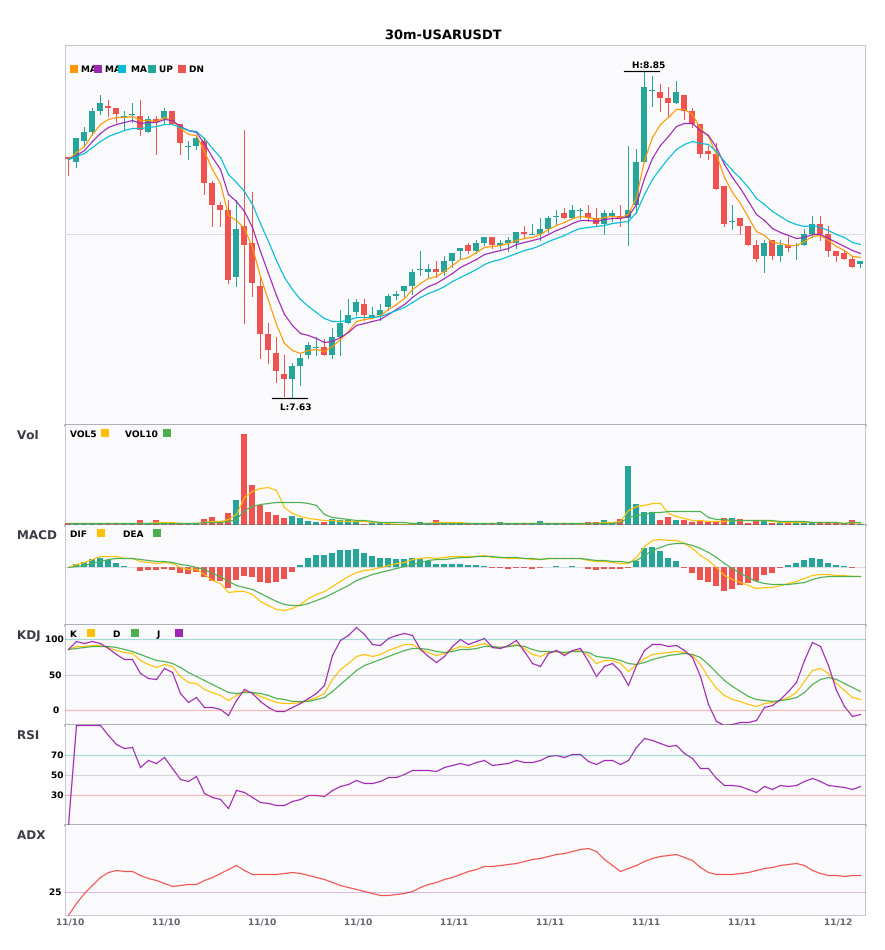
$USAR 30-minute technical outlook has weakened; beware of risk
📉 $USAR | 30-minute bearish signal
━━━━━━━━━━━━━━━━━━
Technical analysis: ADX(44) indicates a clear trending market | MACD bearish cross below zero, bearish momentum accelerating | EMA5 < EMA8 < EMA13, bearish alignment | KDJ trading weakly, bears in control (K is 18.5, D is 31.9) | Volume increased (2.0x)
Price change: -0.3700%
━━━━━━━━━━━━━━━━━━
#技术分析 #USAR
📌 The above is for reference only and does not constitute investment advice
$USAR 30-minute technical outlook has weakened; beware of risk
📉 $USAR | 30-minute bearish signal
━━━━━━━━━━━━━━━━━━
Technical analysis: ADX(44) indicates a clear trending market | MACD bearish cross below zero, bearish momentum accelerating | EMA5 < EMA8 < EMA13, bearish alignment | KDJ trading weakly, bears in control (K is 18.5, D is 31.9) | Volume increased (2.0x)
Price change: -0.3700%
━━━━━━━━━━━━━━━━━━
#技术分析 #USAR
📌 The above is for reference only and does not constitute investment advice
📉 $USAR | 30-minute bearish signal
━━━━━━━━━━━━━━━━━━
Technical analysis: ADX(44) indicates a clear trending market | MACD bearish cross below zero, bearish momentum accelerating | EMA5 < EMA8 < EMA13, bearish alignment | KDJ trading weakly, bears in control (K is 18.5, D is 31.9) | Volume increased (2.0x)
Price change: -0.3700%
━━━━━━━━━━━━━━━━━━
#技术分析 #USAR
📌 The above is for reference only and does not constitute investment advice
3
·
--
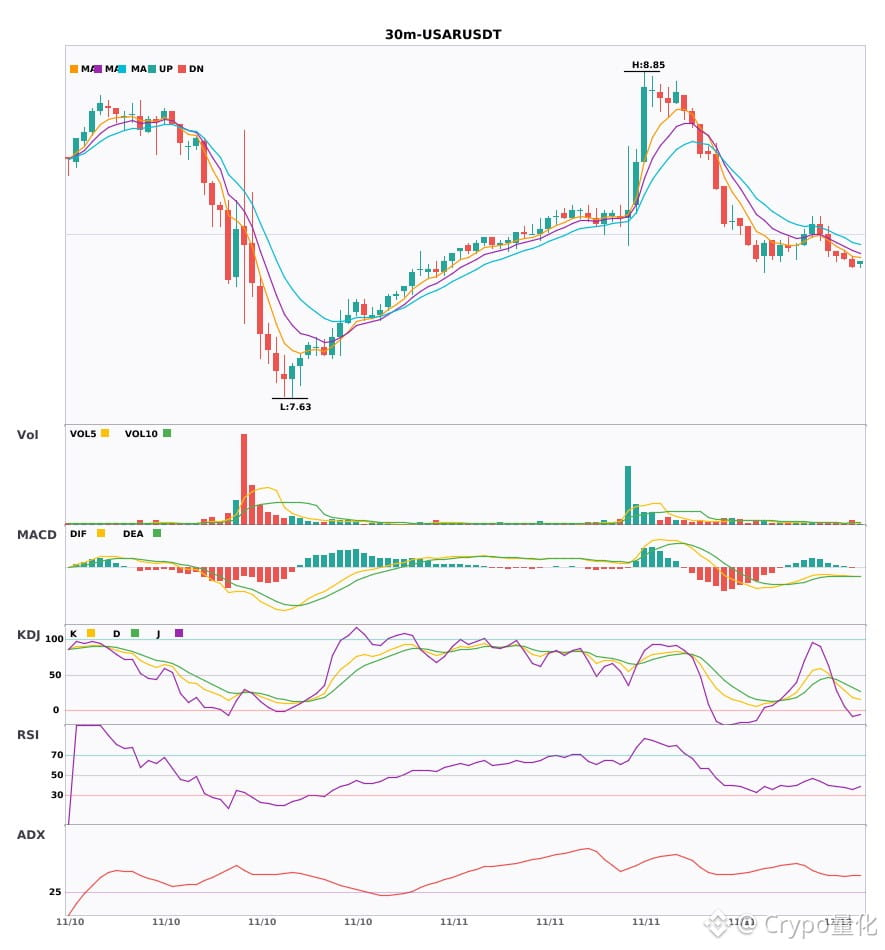
$USAR 30 30-minute bearish alert 🔥
════════════════════
🟢 $USAR 30 30-minute bearish signal
⚠️Technical analysis: ADX (44) indicates a clear trending market | MACD bearish crossover below zero, bearish momentum accelerating | EMA5 < EMA8 < EMA13, bearish alignment | KDJ showing weakness, bears in control (K: 18.5, D: 31.9) | Volume increased (2.0x)
════════════════════
🔔 Follow for the latest market updates 🔔
#技术分析 #USAR
📌 When trading, pay attention to whether the candlestick pattern confirms the signal
$USAR 30 30-minute bearish alert 🔥
════════════════════
🟢 $USAR 30 30-minute bearish signal
⚠️Technical analysis: ADX (44) indicates a clear trending market | MACD bearish crossover below zero, bearish momentum accelerating | EMA5 < EMA8 < EMA13, bearish alignment | KDJ showing weakness, bears in control (K: 18.5, D: 31.9) | Volume increased (2.0x)
════════════════════
🔔 Follow for the latest market updates 🔔
#技术分析 #USAR
📌 When trading, pay attention to whether the candlestick pattern confirms the signal
════════════════════
🟢 $USAR 30 30-minute bearish signal
⚠️Technical analysis: ADX (44) indicates a clear trending market | MACD bearish crossover below zero, bearish momentum accelerating | EMA5 < EMA8 < EMA13, bearish alignment | KDJ showing weakness, bears in control (K: 18.5, D: 31.9) | Volume increased (2.0x)
════════════════════
🔔 Follow for the latest market updates 🔔
#技术分析 #USAR
📌 When trading, pay attention to whether the candlestick pattern confirms the signal
6
·
--
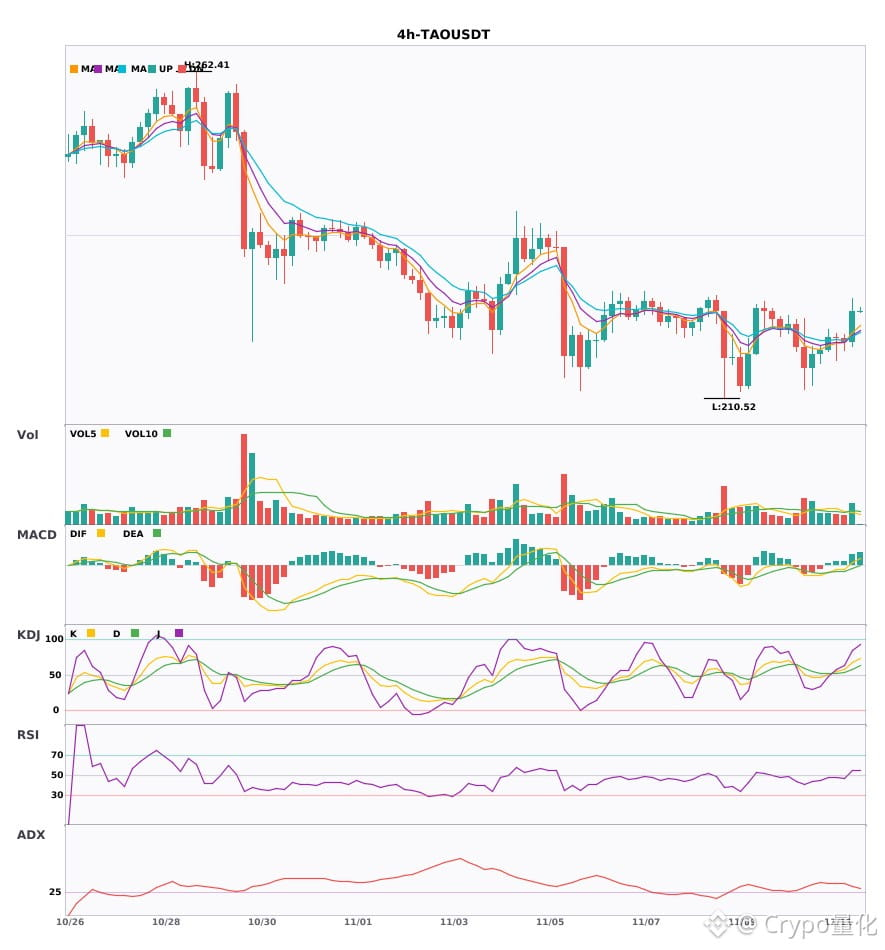
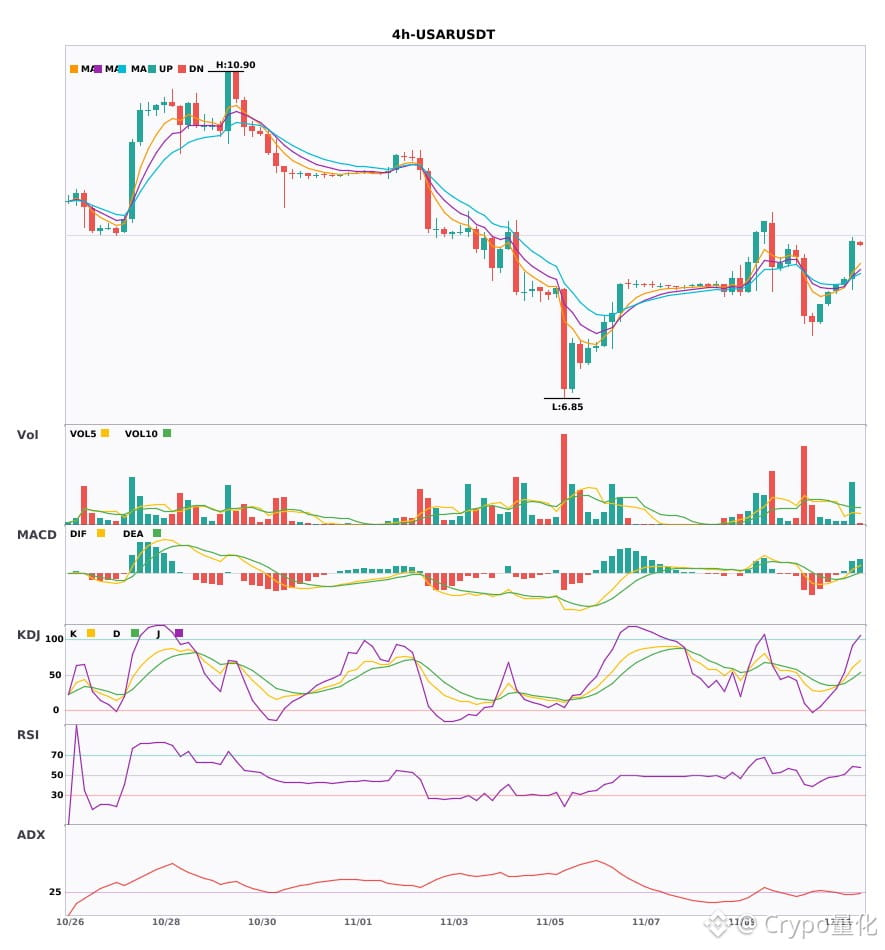
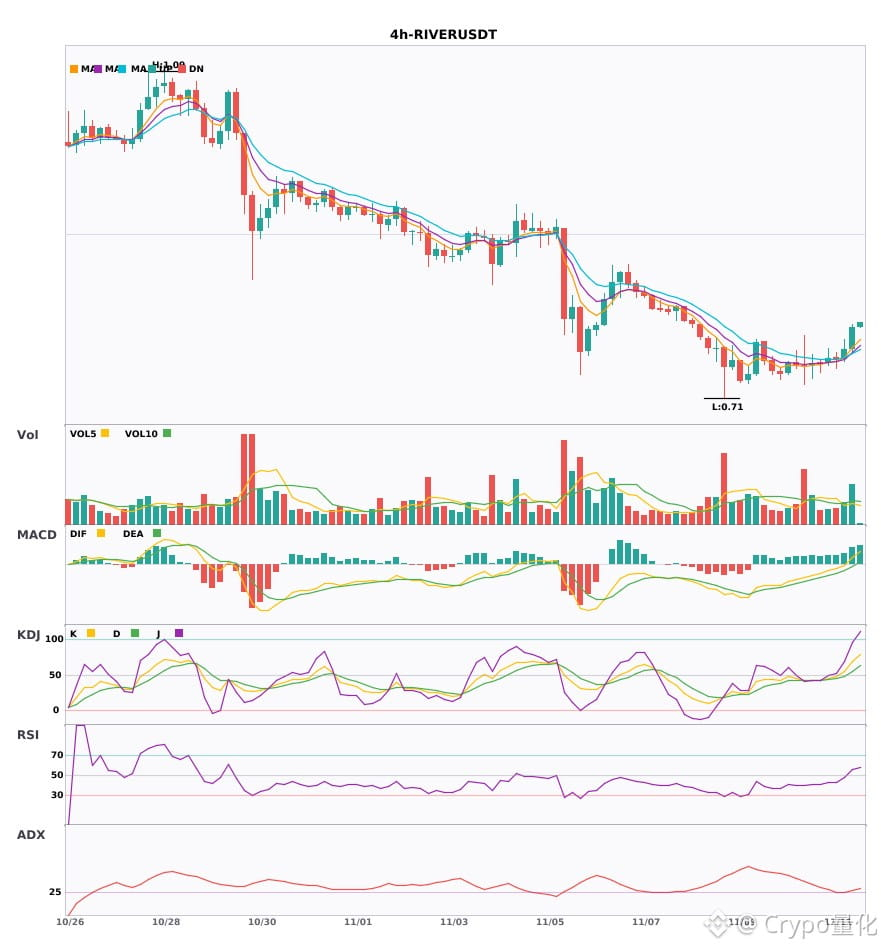
$TAO / $USAR / $RIVER 4-hour confluence turns bullish, with bullish signals appearing simultaneously 🔥
════════════════════
🔴 $TAO 4-hour bullish signal
⚠️Technical analysis: ADX(33): clear trending market | MACDDIF breaks above the zero line; trend turns bullish | EMA5 crosses above EMA8; short-term trend turns bullish | KDJ is strong, with bulls in control (K: 66.8, D: 58.4) | Volume increases (1.5x)
════════════════════
🔴 $USAR 4-hour bullish signal
⚠️Technical analysis: ADX(25): trend is forming; entry is possible | MACDDIF breaks above the zero line; trend turns bullish | EMA5 crosses above EMA8; short-term trend turns bullish | Volume increases (2.4x)
════════════════════
🔴 $RIVER 4-hour bullish signal
⚠️Technical analysis: ADX(28): trend is forming; entry is possible | MACDDIF breaks above the zero line; trend turns bullish | EMA5 > EMA8 > EMA13: bullish alignment | KDJ is strong, with bulls in control (K: 68.4, D: 55.0) | Volume increases (1.7x)
════════════════════
🔔 Follow for first-hand market movement updates 🔔
#技术分析 #TAO #USAR #RIVER
📌 When trading, pay attention to whether the candlestick pattern aligns
$TAO / $USAR / $RIVER 4-hour confluence turns bullish, with bullish signals appearing simultaneously 🔥
════════════════════
🔴 $TAO 4-hour bullish signal
⚠️Technical analysis: ADX(33): clear trending market | MACDDIF breaks above the zero line; trend turns bullish | EMA5 crosses above EMA8; short-term trend turns bullish | KDJ is strong, with bulls in control (K: 66.8, D: 58.4) | Volume increases (1.5x)
════════════════════
🔴 $USAR 4-hour bullish signal
⚠️Technical analysis: ADX(25): trend is forming; entry is possible | MACDDIF breaks above the zero line; trend turns bullish | EMA5 crosses above EMA8; short-term trend turns bullish | Volume increases (2.4x)
════════════════════
🔴 $RIVER 4-hour bullish signal
⚠️Technical analysis: ADX(28): trend is forming; entry is possible | MACDDIF breaks above the zero line; trend turns bullish | EMA5 > EMA8 > EMA13: bullish alignment | KDJ is strong, with bulls in control (K: 68.4, D: 55.0) | Volume increases (1.7x)
════════════════════
🔔 Follow for first-hand market movement updates 🔔
#技术分析 #TAO #USAR #RIVER
📌 When trading, pay attention to whether the candlestick pattern aligns
════════════════════
🔴 $TAO 4-hour bullish signal
⚠️Technical analysis: ADX(33): clear trending market | MACDDIF breaks above the zero line; trend turns bullish | EMA5 crosses above EMA8; short-term trend turns bullish | KDJ is strong, with bulls in control (K: 66.8, D: 58.4) | Volume increases (1.5x)
════════════════════
🔴 $USAR 4-hour bullish signal
⚠️Technical analysis: ADX(25): trend is forming; entry is possible | MACDDIF breaks above the zero line; trend turns bullish | EMA5 crosses above EMA8; short-term trend turns bullish | Volume increases (2.4x)
════════════════════
🔴 $RIVER 4-hour bullish signal
⚠️Technical analysis: ADX(28): trend is forming; entry is possible | MACDDIF breaks above the zero line; trend turns bullish | EMA5 > EMA8 > EMA13: bullish alignment | KDJ is strong, with bulls in control (K: 68.4, D: 55.0) | Volume increases (1.7x)
════════════════════
🔔 Follow for first-hand market movement updates 🔔
#技术分析 #TAO #USAR #RIVER
📌 When trading, pay attention to whether the candlestick pattern aligns
13
·
--
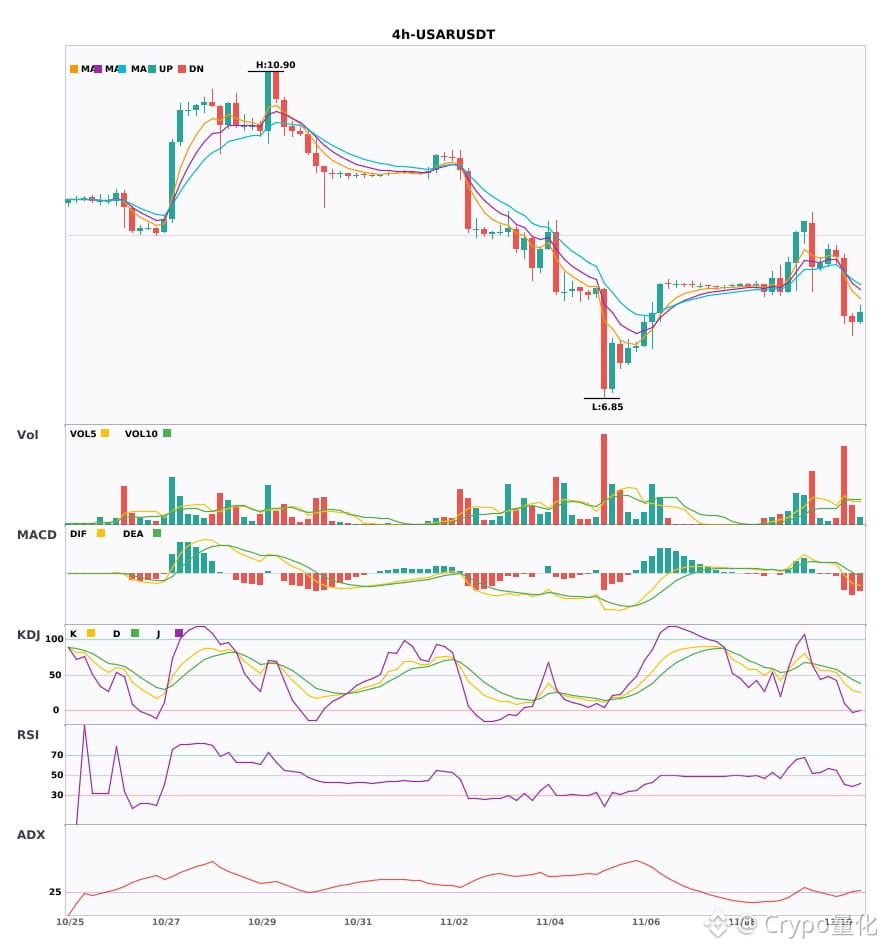
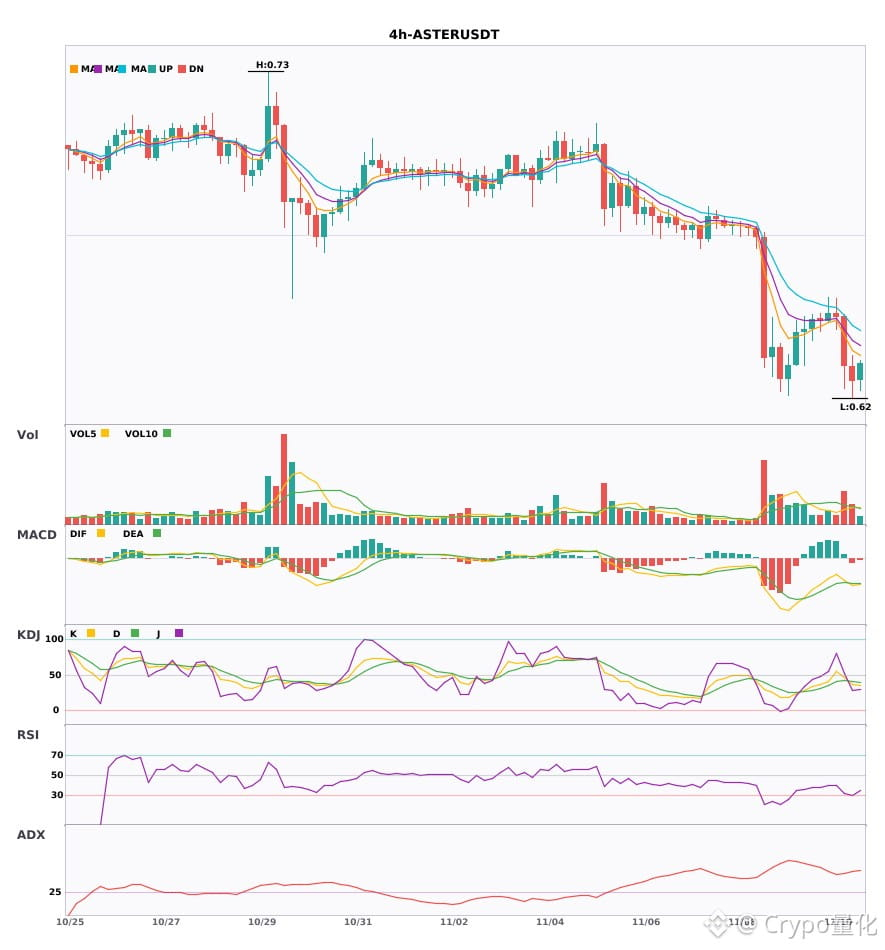
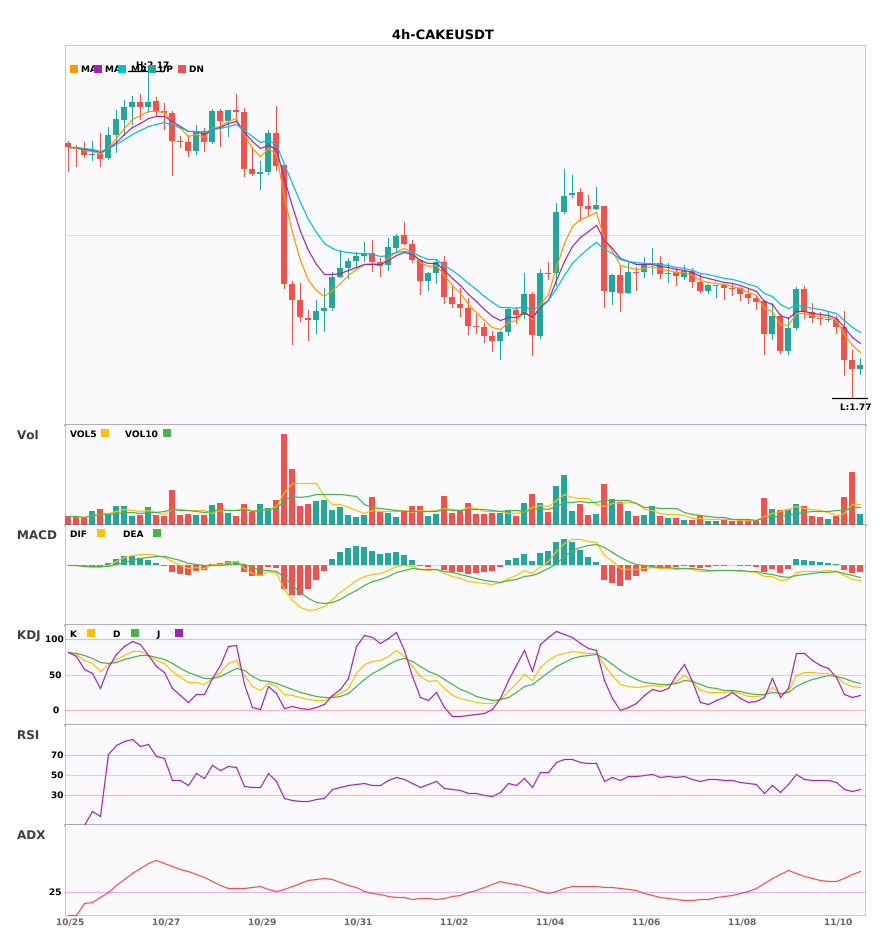
3 4-hour bearish alerts: $USAR / $ASTER / $CAKE🔥
════════════════════
🟢 $USAR 4-hour bearish signal
⚠️Technical analysis: ADX(30) Trend is forming; participation is possible | MACD is bearish, trend is weak and momentum is increasing | EMA5 < EMA8 < EMA13, bearish alignment | KDJ is weak, bears have the advantage (K: 28.5, D: 43.7) | Volume surge (3.3x)
════════════════════
🟢 $ASTER 4-hour bearish signal
⚠️Technical analysis: ADX(46) Very strong trend (beware of an overheated pullback) | MACD bearish crossover below zero, bearish momentum accelerating | EMA5 < EMA8 < EMA13, bearish alignment | KDJ bearish crossover, short-term outlook is bearish (K: 36.5, D: 40.8) | Increased volume (1.7x)
════════════════════
🟢 $CAKE 4-hour bearish signal
⚠️Technical analysis: ADX(42) Clear trending market | MACD bearish crossover below zero, bearish momentum accelerating | EMA5 < EMA8 < EMA13, bearish alignment | KDJ is weak, bears have the advantage (K: 37.7, D: 44.8) | Increased volume (1.9x)
════════════════════
🔔 Follow for firsthand market updates 🔔
#技术分析 #USAR #ASTER #CAKE
📌 When trading, pay attention to whether the candlestick pattern aligns
3 4-hour bearish alerts: $USAR / $ASTER / $CAKE 🔥
════════════════════
🟢 $USAR 4-hour bearish signal
⚠️Technical analysis: ADX(30) Trend is forming; participation is possible | MACD is bearish, trend is weak and momentum is increasing | EMA5 < EMA8 < EMA13, bearish alignment | KDJ is weak, bears have the advantage (K: 28.5, D: 43.7) | Volume surge (3.3x)
════════════════════
🟢 $ASTER 4-hour bearish signal
⚠️Technical analysis: ADX(46) Very strong trend (beware of an overheated pullback) | MACD bearish crossover below zero, bearish momentum accelerating | EMA5 < EMA8 < EMA13, bearish alignment | KDJ bearish crossover, short-term outlook is bearish (K: 36.5, D: 40.8) | Increased volume (1.7x)
════════════════════
🟢 $CAKE 4-hour bearish signal
⚠️Technical analysis: ADX(42) Clear trending market | MACD bearish crossover below zero, bearish momentum accelerating | EMA5 < EMA8 < EMA13, bearish alignment | KDJ is weak, bears have the advantage (K: 37.7, D: 44.8) | Increased volume (1.9x)
════════════════════
🔔 Follow for firsthand market updates 🔔
#技术分析 #USAR #ASTER #CAKE
📌 When trading, pay attention to whether the candlestick pattern aligns
════════════════════
🟢 $USAR 4-hour bearish signal
⚠️Technical analysis: ADX(30) Trend is forming; participation is possible | MACD is bearish, trend is weak and momentum is increasing | EMA5 < EMA8 < EMA13, bearish alignment | KDJ is weak, bears have the advantage (K: 28.5, D: 43.7) | Volume surge (3.3x)
════════════════════
🟢 $ASTER 4-hour bearish signal
⚠️Technical analysis: ADX(46) Very strong trend (beware of an overheated pullback) | MACD bearish crossover below zero, bearish momentum accelerating | EMA5 < EMA8 < EMA13, bearish alignment | KDJ bearish crossover, short-term outlook is bearish (K: 36.5, D: 40.8) | Increased volume (1.7x)
════════════════════
🟢 $CAKE 4-hour bearish signal
⚠️Technical analysis: ADX(42) Clear trending market | MACD bearish crossover below zero, bearish momentum accelerating | EMA5 < EMA8 < EMA13, bearish alignment | KDJ is weak, bears have the advantage (K: 37.7, D: 44.8) | Increased volume (1.9x)
════════════════════
🔔 Follow for firsthand market updates 🔔
#技术分析 #USAR #ASTER #CAKE
📌 When trading, pay attention to whether the candlestick pattern aligns
13
·
--
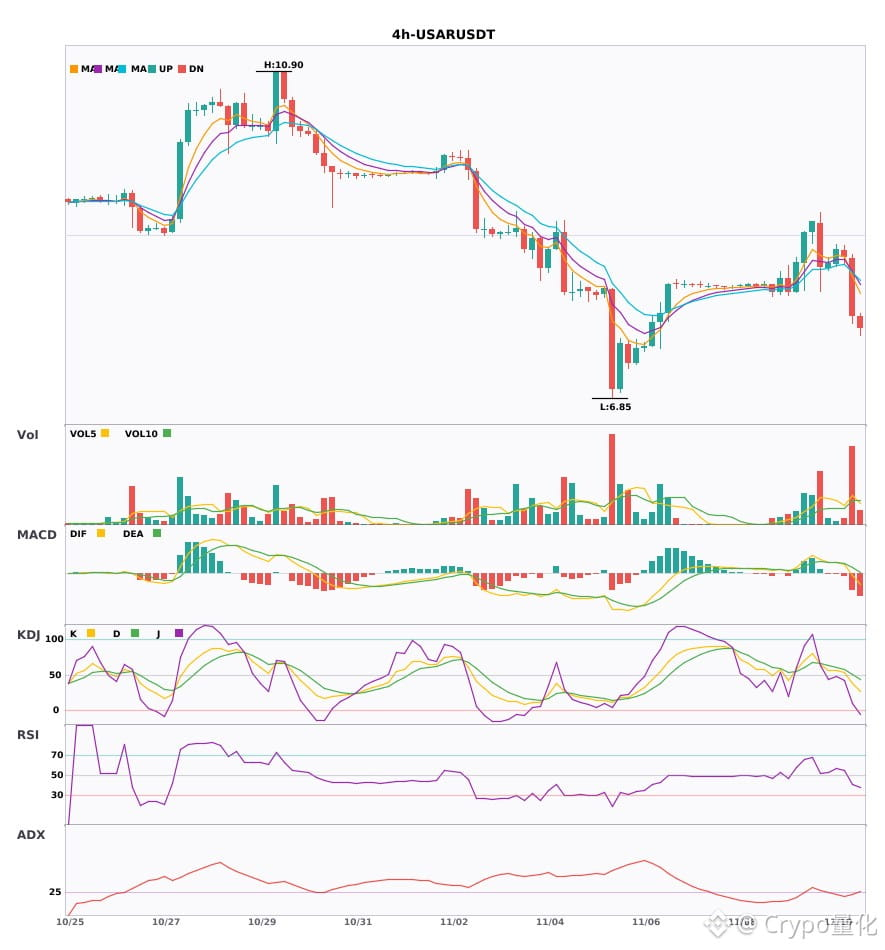
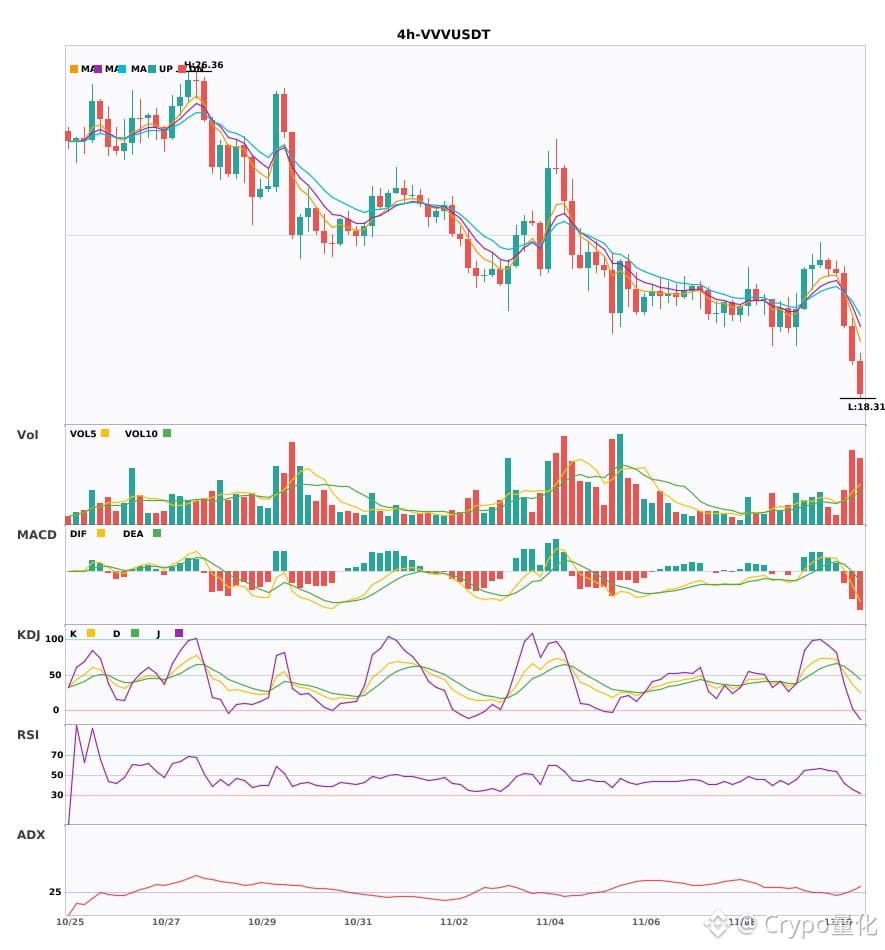
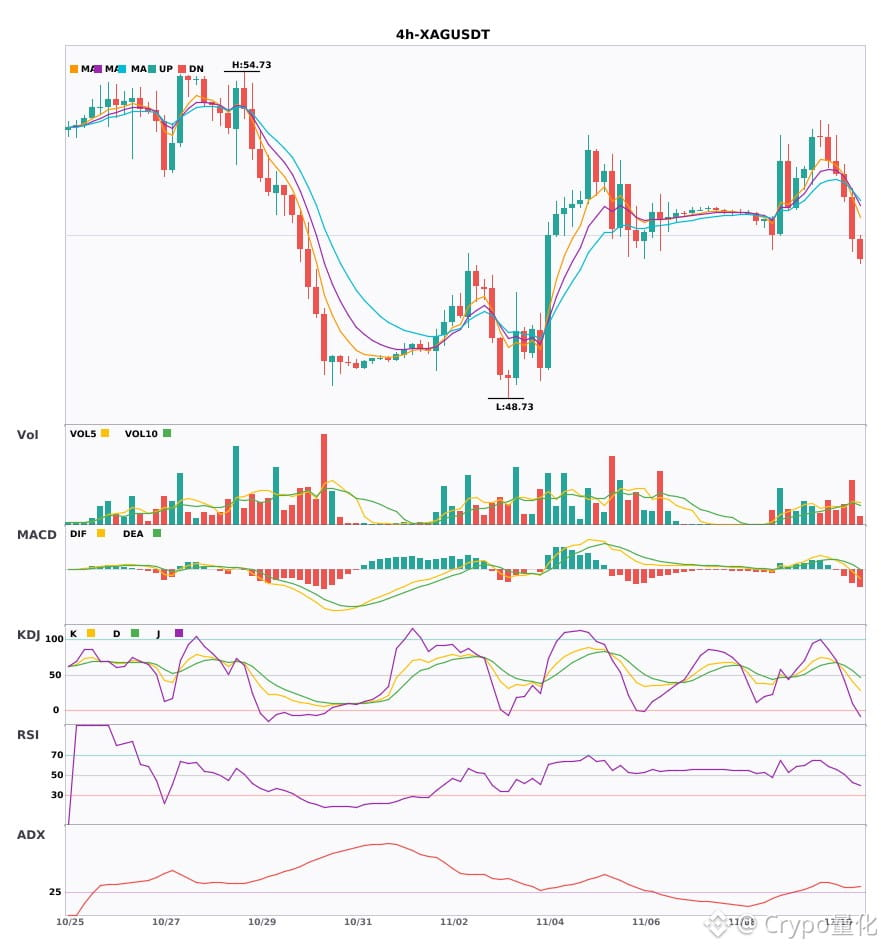
$USAR / $VVV / $XAG 4-hour technical indicators are weakening in unison; watch out for risk 🔥
════════════════════
🟢 $USAR 4-hour bearish signal
⚠️Technical analysis: ADX(26) Trend is forming; entry is possible | MACDDIF has fallen below the zero line; trend turns bearish | EMA5 crosses below EMA8; short-term trend turns bearish | Volume surge (3.3x)
════════════════════
🟢 $VVV 4-hour bearish signal
⚠️Technical analysis: ADX(30) Trend is forming; entry is possible | MACDDIF has fallen below the zero line; trend turns bearish | EMA5 < EMA8 < EMA13; bearish alignment | Volume surge (2.6x)
════════════════════
🟢 $XAG 4-hour bearish signal
⚠️Technical analysis: ADX(33) Clear trending market | MACDDIF has fallen below the zero line; trend turns bearish | EMA5 crosses below EMA8; short-term trend turns bearish | Increased volume (2.0x)
════════════════════
🔔 Follow for the latest market movements 🔔
#技术分析 #USAR #VVV #XAG
📌 When trading, pay attention to whether the candlestick pattern is consistent
$USAR / $VVV / $XAG 4-hour technical indicators are weakening in unison; watch out for risk 🔥
════════════════════
🟢 $USAR 4-hour bearish signal
⚠️Technical analysis: ADX(26) Trend is forming; entry is possible | MACDDIF has fallen below the zero line; trend turns bearish | EMA5 crosses below EMA8; short-term trend turns bearish | Volume surge (3.3x)
════════════════════
🟢 $VVV 4-hour bearish signal
⚠️Technical analysis: ADX(30) Trend is forming; entry is possible | MACDDIF has fallen below the zero line; trend turns bearish | EMA5 < EMA8 < EMA13; bearish alignment | Volume surge (2.6x)
════════════════════
🟢 $XAG 4-hour bearish signal
⚠️Technical analysis: ADX(33) Clear trending market | MACDDIF has fallen below the zero line; trend turns bearish | EMA5 crosses below EMA8; short-term trend turns bearish | Increased volume (2.0x)
════════════════════
🔔 Follow for the latest market movements 🔔
#技术分析 #USAR #VVV #XAG
📌 When trading, pay attention to whether the candlestick pattern is consistent
════════════════════
🟢 $USAR 4-hour bearish signal
⚠️Technical analysis: ADX(26) Trend is forming; entry is possible | MACDDIF has fallen below the zero line; trend turns bearish | EMA5 crosses below EMA8; short-term trend turns bearish | Volume surge (3.3x)
════════════════════
🟢 $VVV 4-hour bearish signal
⚠️Technical analysis: ADX(30) Trend is forming; entry is possible | MACDDIF has fallen below the zero line; trend turns bearish | EMA5 < EMA8 < EMA13; bearish alignment | Volume surge (2.6x)
════════════════════
🟢 $XAG 4-hour bearish signal
⚠️Technical analysis: ADX(33) Clear trending market | MACDDIF has fallen below the zero line; trend turns bearish | EMA5 crosses below EMA8; short-term trend turns bearish | Increased volume (2.0x)
════════════════════
🔔 Follow for the latest market movements 🔔
#技术分析 #USAR #VVV #XAG
📌 When trading, pay attention to whether the candlestick pattern is consistent
8
Log in to explore more content
Join global crypto users on Binance Square
⚡️ Get latest and useful information about crypto.
💬 Trusted by the world’s largest crypto exchange.
👍 Discover real insights from verified creators.
Email / Phone number
Trending Topics
1
#NvidiaLoses$2.7TrillionInMonthAndAHalf
16,477 views
114 Discussing
2
#CanBTCReboundAfterFallingBelow60K?
746,379 views
2,945 Discussing
3
#GlobalStocksFaceLongestLosingStreakSince2023
265,205 views
1,972 Discussing
4
#BlackRockIBITPostsRecord$541MSingleDayOutflow
30,570 views
88 Discussing
5
#AnthropicPlungesTowardIPOPriceonDay2
134,831 views
1,196 Discussing
6
#TwentyOneCapitalAdds172.25BTC
61,462 views
652 Discussing
7
#HKBillWouldExcludeTokenizedDepositsFromVirtualAssets
7,591 views
50 Discussing
8
#BNBDropsBelow540USDTWith8.46%DailyDecline
74,156 views
642 Discussing
9
#HKBillProposesHK$100KFineForUnauthorizedCryptoTitles
2,490 views
22 Discussing
10
#BitMineFaces$10.1BUnrealizedETHLoss
5,188 views
28 Discussing