
#mstu
mstu
5,228 views
85 Discussing
Hot
Latest

·
--
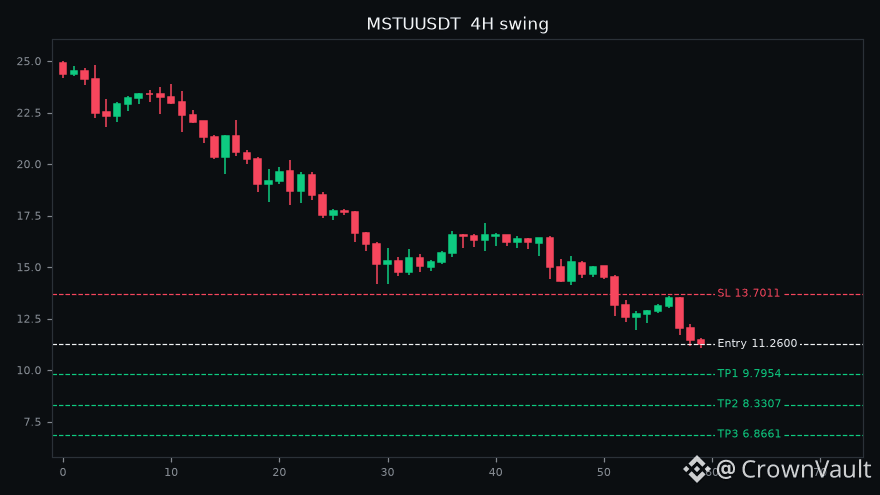
🔴 $MSTU trade idea: SHORT (4H swing)
Entry: 11.2600
SL: 13.7011
TP1: 9.7954
TP2: 8.3307
TP3: 6.8661
EMA20 < EMA50 | RSI 27 | MACD bearish | ATR 8.7% | Vol 0.6x
Use low leverage and manage risk.
#Futures #MSTU #CryptoTrading #Crypto
⚠️ Educational only, not financial advice. DYOR.
🔴 $MSTU trade idea: SHORT (4H swing)
Entry: 11.2600
SL: 13.7011
TP1: 9.7954
TP2: 8.3307
TP3: 6.8661
EMA20 < EMA50 | RSI 27 | MACD bearish | ATR 8.7% | Vol 0.6x
Use low leverage and manage risk.
#Futures #MSTU #CryptoTrading #Crypto
⚠️ Educational only, not financial advice. DYOR.
Entry: 11.2600
SL: 13.7011
TP1: 9.7954
TP2: 8.3307
TP3: 6.8661
EMA20 < EMA50 | RSI 27 | MACD bearish | ATR 8.7% | Vol 0.6x
Use low leverage and manage risk.
#Futures #MSTU #CryptoTrading #Crypto
⚠️ Educational only, not financial advice. DYOR.
1

·
--
MSTU fell 20.07% over 24 hours, while long accounts still make up 68% and the funding rate remains at +0.0232%.
Binance TradFi perpetual (traditional financial instrument; high gap risk outside trading hours) | MSTU remains weak intraday; first, watch whether selling pressure eases before looking for a recovery. At 2026-11-20 17:55:08 Beijing time, the price was around 10.71 (30m indicators use the 17:30 closing candlestick), with 24h trading volume of about 13.8626 million; absolute trading volume does not necessarily mean relatively heavy volume. Flows: long accounts at 68%; taker buy/sell ratio 0.83 (taker selling pressure dominates); 30m open interest -1.1%; funding rate +0.0232%.
Reference indicators: the 30m ATR trend band reference level is 11.558584. The price is below it, indicating a weak structure; watch whether it can reclaim that level. The 30m KDJ is 47.23/50.49/40.72, indicating that short-term sentiment remains divided and in the middle range.
The split in opinion here is quite specific: some expect a further breakdown, while others expect a recovery from panic. I’d rather see whether the taker buy/sell ratio of 0.83 can get back above 1. If it can’t, even a sharp rebound could easily turn into a weak recovery.
#MSTU #UnusualMoveAlert
MSTU fell 20.07% over 24 hours, while long accounts still make up 68% and the funding rate remains at +0.0232%.
Binance TradFi perpetual (traditional financial instrument; high gap risk outside trading hours) | MSTU remains weak intraday; first, watch whether selling pressure eases before looking for a recovery. At 2026-11-20 17:55:08 Beijing time, the price was around 10.71 (30m indicators use the 17:30 closing candlestick), with 24h trading volume of about 13.8626 million; absolute trading volume does not necessarily mean relatively heavy volume. Flows: long accounts at 68%; taker buy/sell ratio 0.83 (taker selling pressure dominates); 30m open interest -1.1%; funding rate +0.0232%.
Reference indicators: the 30m ATR trend band reference level is 11.558584. The price is below it, indicating a weak structure; watch whether it can reclaim that level. The 30m KDJ is 47.23/50.49/40.72, indicating that short-term sentiment remains divided and in the middle range.
The split in opinion here is quite specific: some expect a further breakdown, while others expect a recovery from panic. I’d rather see whether the taker buy/sell ratio of 0.83 can get back above 1. If it can’t, even a sharp rebound could easily turn into a weak recovery.
#MSTU #UnusualMoveAlert
Binance TradFi perpetual (traditional financial instrument; high gap risk outside trading hours) | MSTU remains weak intraday; first, watch whether selling pressure eases before looking for a recovery. At 2026-11-20 17:55:08 Beijing time, the price was around 10.71 (30m indicators use the 17:30 closing candlestick), with 24h trading volume of about 13.8626 million; absolute trading volume does not necessarily mean relatively heavy volume. Flows: long accounts at 68%; taker buy/sell ratio 0.83 (taker selling pressure dominates); 30m open interest -1.1%; funding rate +0.0232%.
Reference indicators: the 30m ATR trend band reference level is 11.558584. The price is below it, indicating a weak structure; watch whether it can reclaim that level. The 30m KDJ is 47.23/50.49/40.72, indicating that short-term sentiment remains divided and in the middle range.
The split in opinion here is quite specific: some expect a further breakdown, while others expect a recovery from panic. I’d rather see whether the taker buy/sell ratio of 0.83 can get back above 1. If it can’t, even a sharp rebound could easily turn into a weak recovery.
#MSTU #UnusualMoveAlert
1

·
--
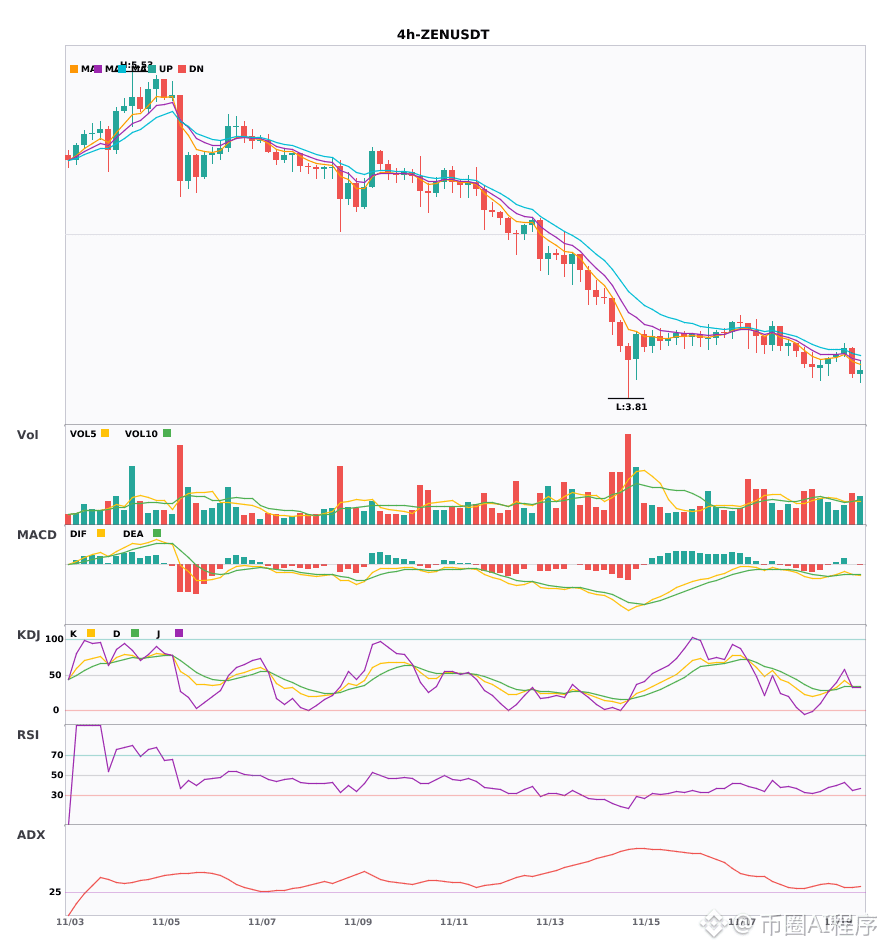
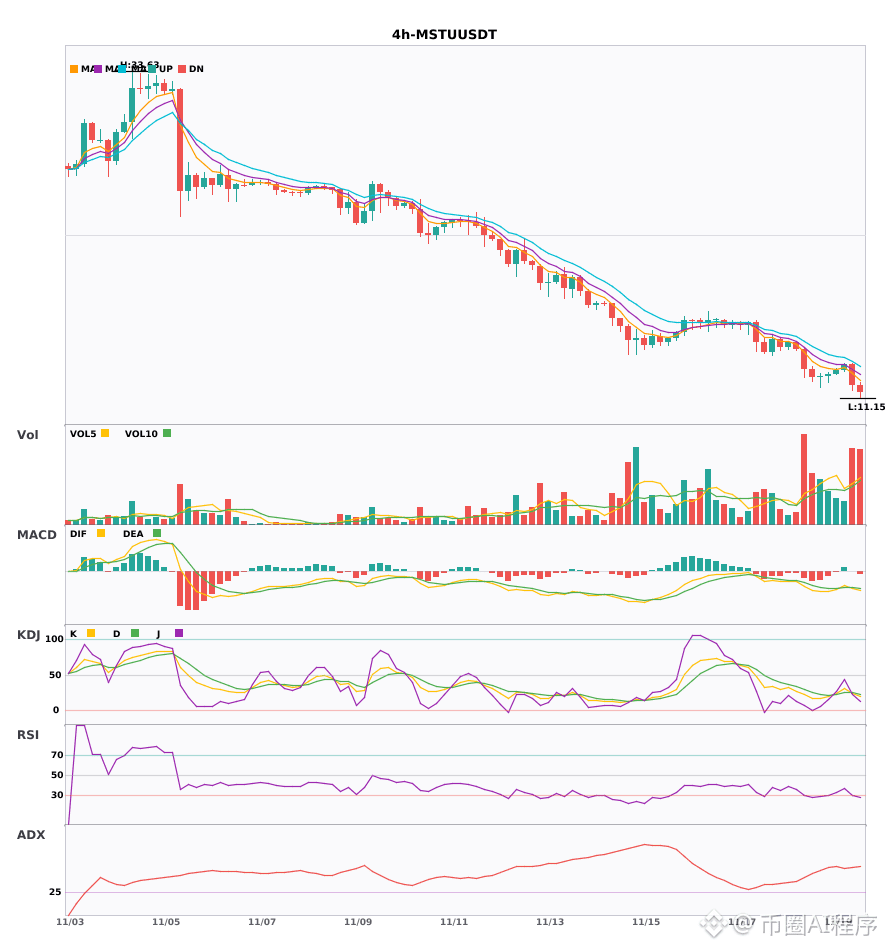
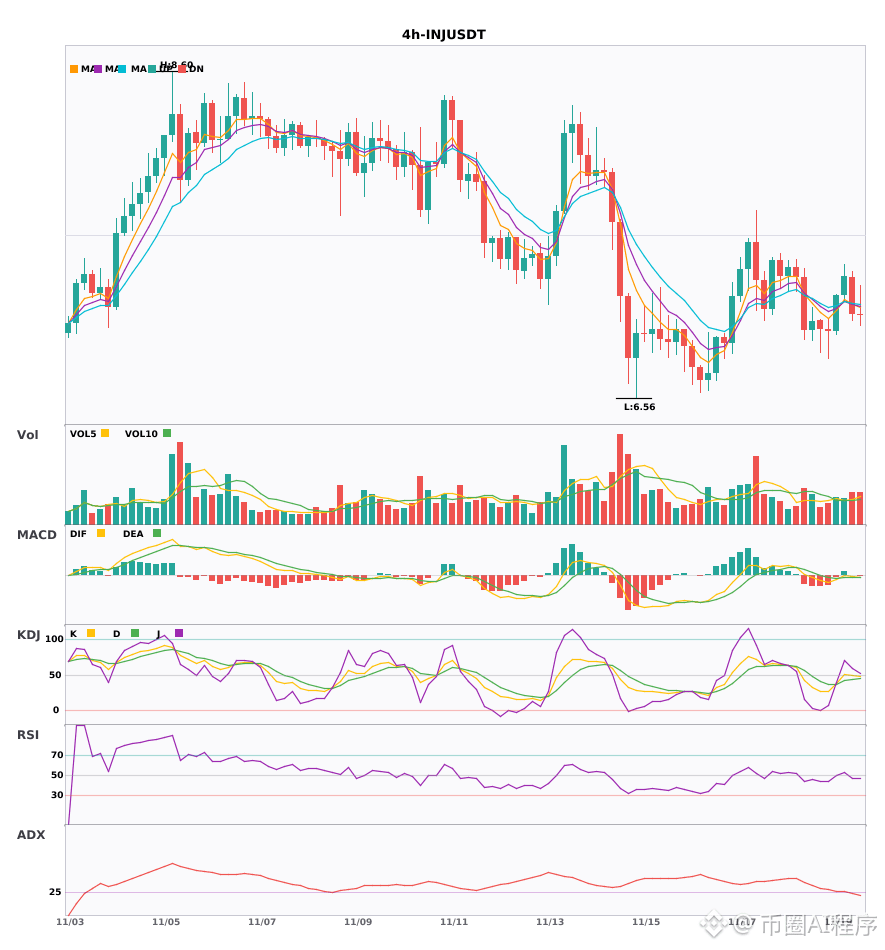
All 3 coins are bearish on the 4-hour and daily charts. A multi-timeframe confluence bearish signal is here 🔥
════════════════════
🟢 $ZEN 4-hour Bearish Signal
⚠️ Technical analysis: 4-hour entry: MACD bearish crossover below zero, with expanding green bars; moving averages are bearishly aligned and diverging downward; KDJ bearish crossover, not yet oversold. Daily bearish confluence confirmed—a multi-timeframe bearish signal.
════════════════════
🟢 $MSTU 4-hour Bearish Signal
⚠️ Technical analysis: Daily and 4-hour bearish confluence confirmed! MACD bearish crossover below zero with volume, moving averages bearishly aligned and pointing downward, KDJ bearish crossover but not yet oversold, and trading volume up 2x. The confluence bearish signal is clear.
════════════════════
🟢 $INJ 4-hour Bearish Signal
⚠️ Technical analysis: 4-hour and daily bearish confluence. MACD bearish crossover below the zero line; EMA5 crossed below EMA8, forming a bearish alignment; KDJ bearish crossover, with K below D, indicating weakness; volume up 1.3x. Bearish signal.
════════════════════
🔔 Follow for real-time market updates 🔔
#多周期共振 #ZEN #MSTU #INJ
📌 When trading, watch whether the candlestick patterns confirm the signal
All 3 coins are bearish on the 4-hour and daily charts. A multi-timeframe confluence bearish signal is here 🔥
════════════════════
🟢 $ZEN 4-hour Bearish Signal
⚠️ Technical analysis: 4-hour entry: MACD bearish crossover below zero, with expanding green bars; moving averages are bearishly aligned and diverging downward; KDJ bearish crossover, not yet oversold. Daily bearish confluence confirmed—a multi-timeframe bearish signal.
════════════════════
🟢 $MSTU 4-hour Bearish Signal
⚠️ Technical analysis: Daily and 4-hour bearish confluence confirmed! MACD bearish crossover below zero with volume, moving averages bearishly aligned and pointing downward, KDJ bearish crossover but not yet oversold, and trading volume up 2x. The confluence bearish signal is clear.
════════════════════
🟢 $INJ 4-hour Bearish Signal
⚠️ Technical analysis: 4-hour and daily bearish confluence. MACD bearish crossover below the zero line; EMA5 crossed below EMA8, forming a bearish alignment; KDJ bearish crossover, with K below D, indicating weakness; volume up 1.3x. Bearish signal.
════════════════════
🔔 Follow for real-time market updates 🔔
#多周期共振 #ZEN #MSTU #INJ
📌 When trading, watch whether the candlestick patterns confirm the signal
════════════════════
🟢 $ZEN 4-hour Bearish Signal
⚠️ Technical analysis: 4-hour entry: MACD bearish crossover below zero, with expanding green bars; moving averages are bearishly aligned and diverging downward; KDJ bearish crossover, not yet oversold. Daily bearish confluence confirmed—a multi-timeframe bearish signal.
════════════════════
🟢 $MSTU 4-hour Bearish Signal
⚠️ Technical analysis: Daily and 4-hour bearish confluence confirmed! MACD bearish crossover below zero with volume, moving averages bearishly aligned and pointing downward, KDJ bearish crossover but not yet oversold, and trading volume up 2x. The confluence bearish signal is clear.
════════════════════
🟢 $INJ 4-hour Bearish Signal
⚠️ Technical analysis: 4-hour and daily bearish confluence. MACD bearish crossover below the zero line; EMA5 crossed below EMA8, forming a bearish alignment; KDJ bearish crossover, with K below D, indicating weakness; volume up 1.3x. Bearish signal.
════════════════════
🔔 Follow for real-time market updates 🔔
#多周期共振 #ZEN #MSTU #INJ
📌 When trading, watch whether the candlestick patterns confirm the signal
5

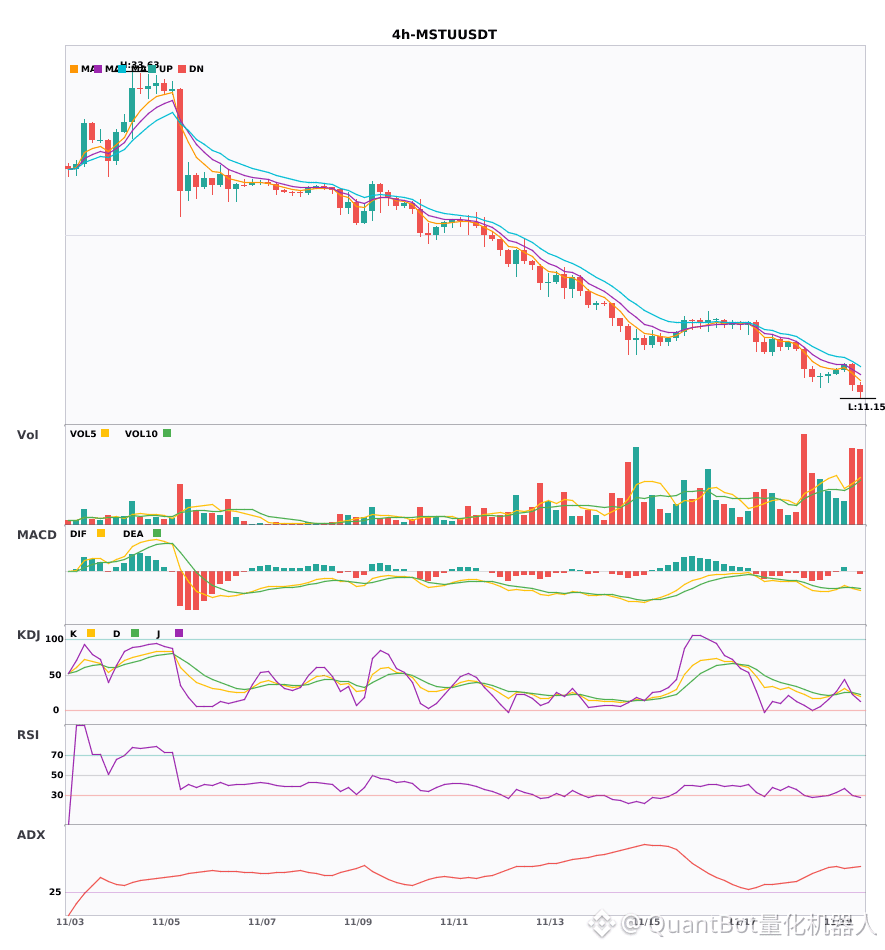
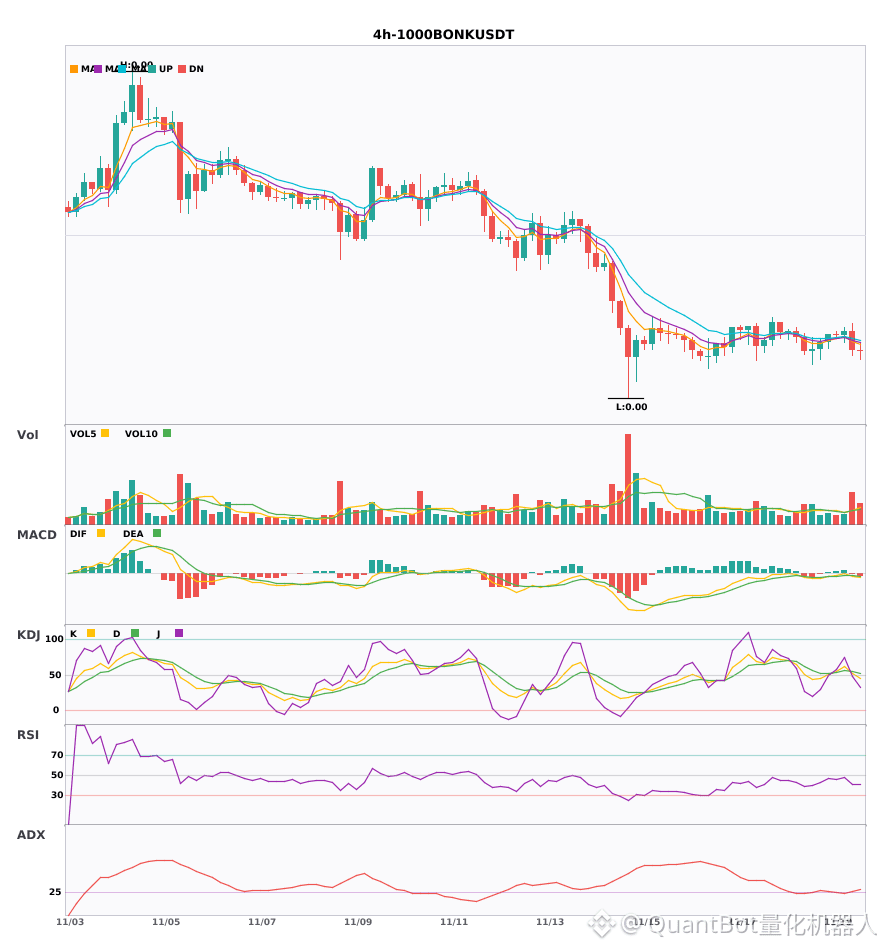
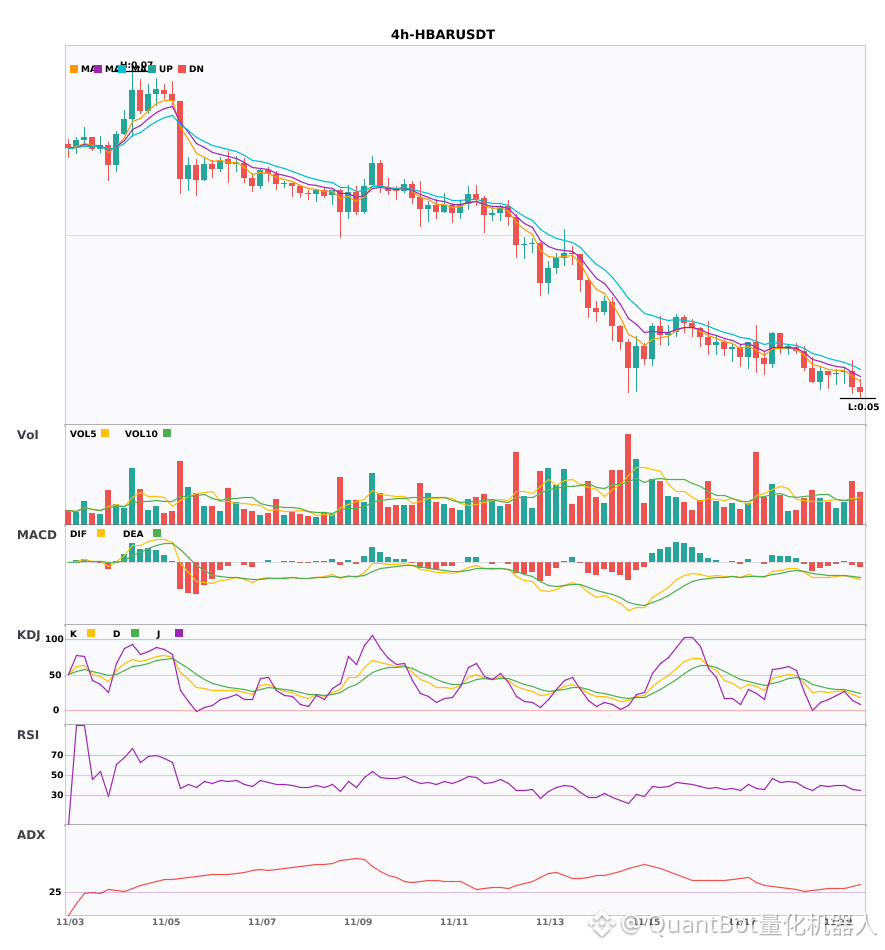
$MSTU $1000BONK $HBAR Four-hour bearish signals, short-term pressure
📉 $MSTU | 4-hour bearish signal
━━━━━━━━━━━━━━━━━━
Technical analysis: ADX (54) is extremely strong; beware of a pullback. MACD bearish crossover below zero, with bearish momentum accelerating. EMAs are in bearish alignment. KDJ bearish crossover, bearish outlook. Volume increased 2x.
Price change: -11.0200%
📉 $1000BONK | 4-hour bearish signal
━━━━━━━━━━━━━━━━━━
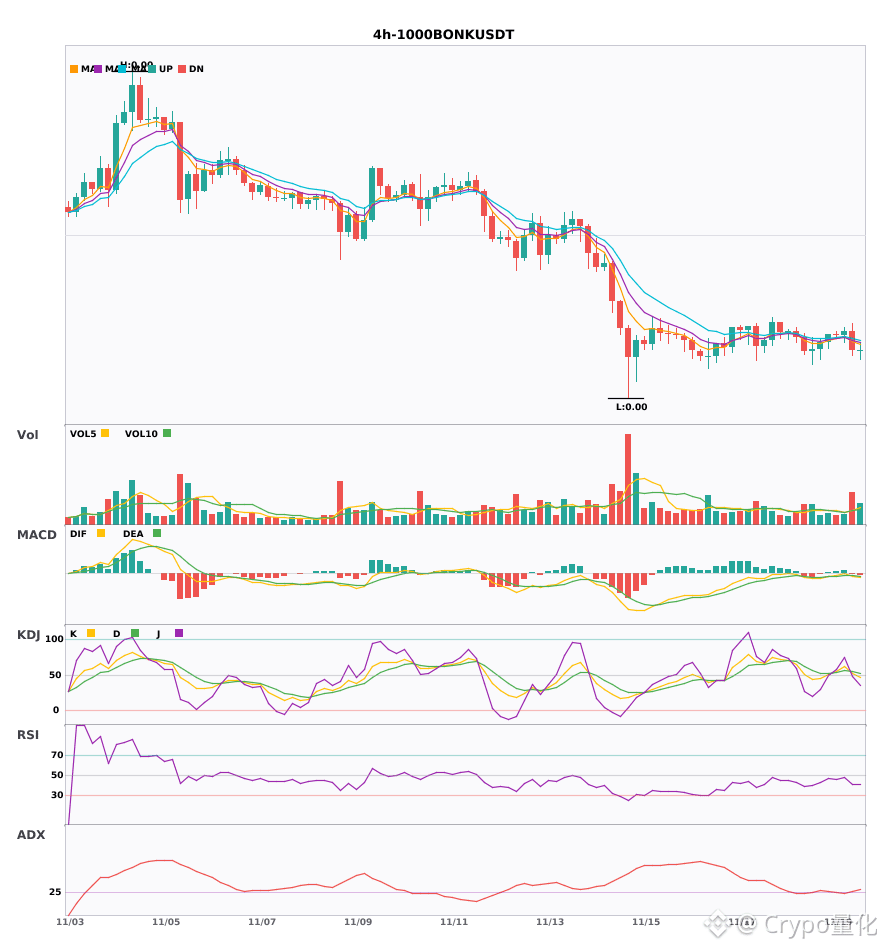
Technical analysis: ADX (25) signals a trend beginning. MACD bearish crossover below zero. EMA5 crossed below EMA8, turning bearish in the short term. KDJ bearish crossover (K52.4/D54.9). Volume increased 2.3x.
Price change: -2.4800%
📉 $HBAR | 4-hour bearish signal
━━━━━━━━━━━━━━━━━━
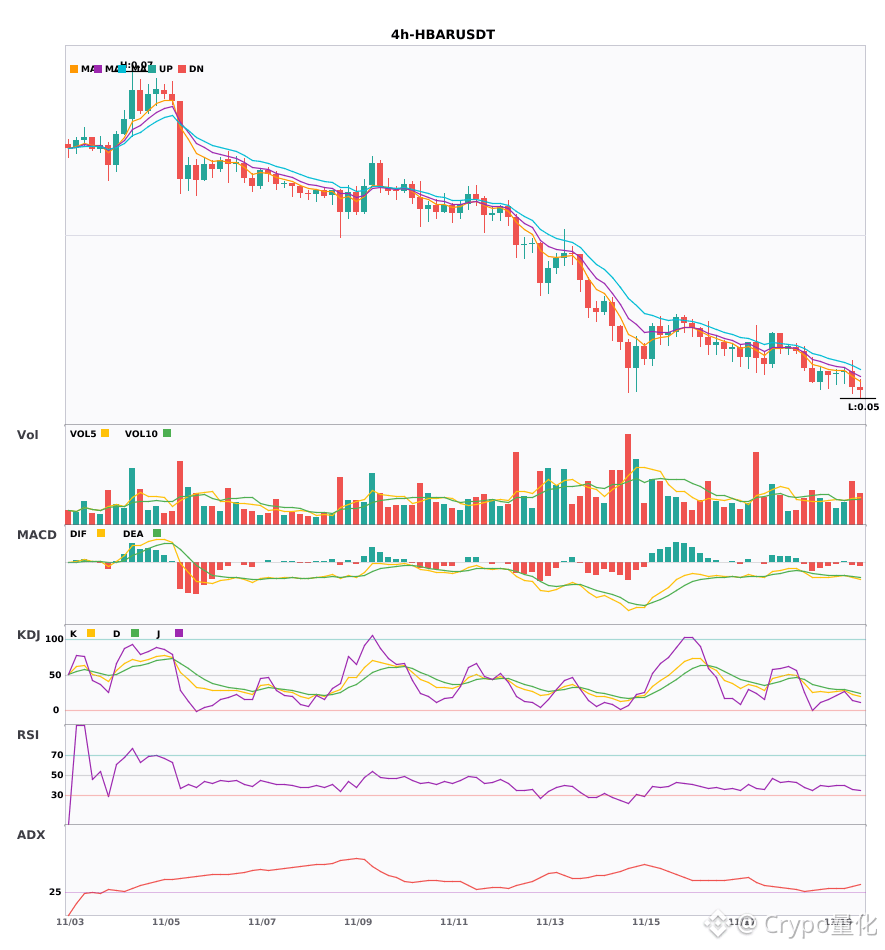
Technical analysis: ADX (34) signals a clear trend. MACD bearish crossover below zero, with bearish momentum accelerating. EMA5<8<13 in bearish alignment. KDJ is weak (K22.8/D27.0). Volume increased 1.7x.
Price change: -1.7300%
━━━━━━━━━━━━━━━━━━
#技术分析 #MSTU #1000BONK #HBAR
📌 The above is for informational purposes only and does not constitute investment advice.
$MSTU $1000BONK $HBAR Four-hour bearish signals, short-term pressure
📉 $MSTU | 4-hour bearish signal
━━━━━━━━━━━━━━━━━━
Technical analysis: ADX (54) is extremely strong; beware of a pullback. MACD bearish crossover below zero, with bearish momentum accelerating. EMAs are in bearish alignment. KDJ bearish crossover, bearish outlook. Volume increased 2x.
Price change: -11.0200%
📉 $1000BONK | 4-hour bearish signal
━━━━━━━━━━━━━━━━━━
Technical analysis: ADX (25) signals a trend beginning. MACD bearish crossover below zero. EMA5 crossed below EMA8, turning bearish in the short term. KDJ bearish crossover (K52.4/D54.9). Volume increased 2.3x.
Price change: -2.4800%
📉 $HBAR | 4-hour bearish signal
━━━━━━━━━━━━━━━━━━
Technical analysis: ADX (34) signals a clear trend. MACD bearish crossover below zero, with bearish momentum accelerating. EMA5<8<13 in bearish alignment. KDJ is weak (K22.8/D27.0). Volume increased 1.7x.
Price change: -1.7300%
━━━━━━━━━━━━━━━━━━
#技术分析 #MSTU #1000BONK #HBAR
📌 The above is for informational purposes only and does not constitute investment advice.
📉 $MSTU | 4-hour bearish signal
━━━━━━━━━━━━━━━━━━
Technical analysis: ADX (54) is extremely strong; beware of a pullback. MACD bearish crossover below zero, with bearish momentum accelerating. EMAs are in bearish alignment. KDJ bearish crossover, bearish outlook. Volume increased 2x.
Price change: -11.0200%
📉 $1000BONK | 4-hour bearish signal
━━━━━━━━━━━━━━━━━━
Technical analysis: ADX (25) signals a trend beginning. MACD bearish crossover below zero. EMA5 crossed below EMA8, turning bearish in the short term. KDJ bearish crossover (K52.4/D54.9). Volume increased 2.3x.
Price change: -2.4800%
📉 $HBAR | 4-hour bearish signal
━━━━━━━━━━━━━━━━━━
Technical analysis: ADX (34) signals a clear trend. MACD bearish crossover below zero, with bearish momentum accelerating. EMA5<8<13 in bearish alignment. KDJ is weak (K22.8/D27.0). Volume increased 1.7x.
Price change: -1.7300%
━━━━━━━━━━━━━━━━━━
#技术分析 #MSTU #1000BONK #HBAR
📌 The above is for informational purposes only and does not constitute investment advice.
33

·
--
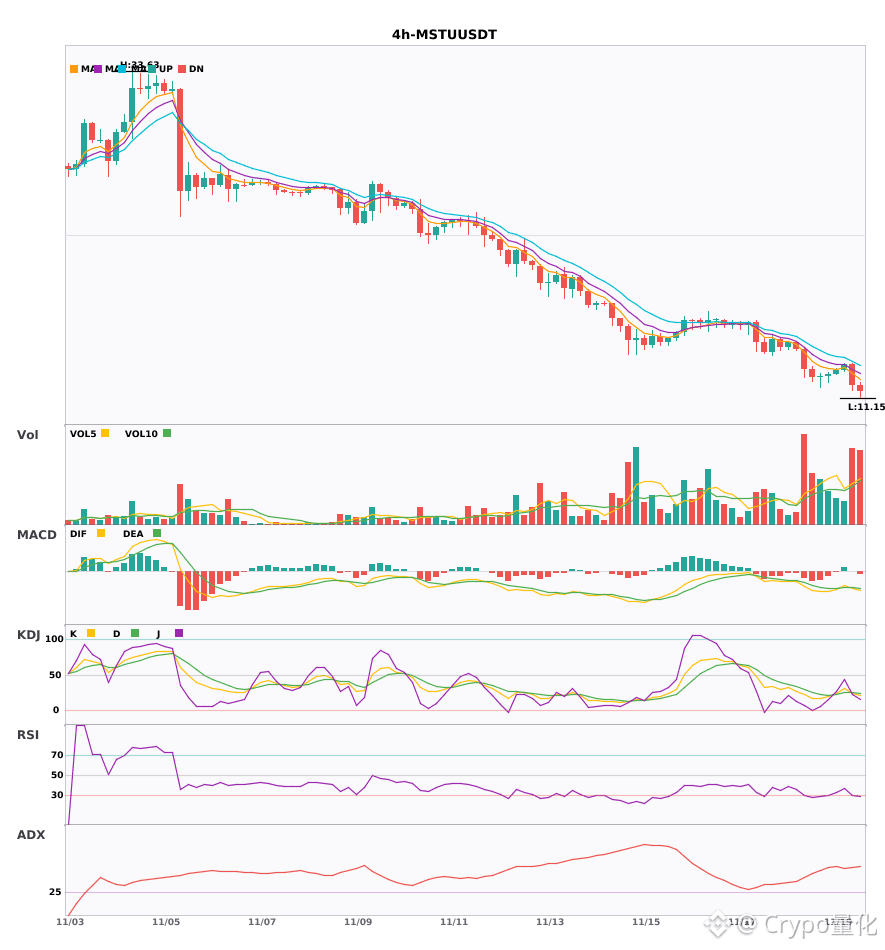
4-hour bearish alerts for 3 coins, watch out for a drop: $MSTU / $1000BONK / $HBAR🔥
════════════════════
🟢 $MSTU 4-hour bearish signal
⚠️Technical analysis: ADX is surging; the trend is strong, but watch out for an overheated pullback. The MACD bearish crossover shows bears gaining momentum, and the moving averages are bearishly aligned and trending downward. The KDJ bearish crossover points to short-term weakness, with volume up 2x.
════════════════════
🟢 $1000BONK 4-hour bearish signal
⚠️Technical analysis: The ADX trend has just started to pick up, so you can enter | MACD bearish crossover below zero, with bears accelerating | Short-term moving averages have just formed a bearish alignment | KDJ has crossed below the death line but is not yet in oversold territory (K52.4 D54.9) | Volume is up 2.3x
════════════════════
🟢 $HBAR 4-hour bearish signal
⚠️Technical analysis: ADX indicates a clear trend. The MACD bearish crossover below the zero line is accelerating the decline; the moving averages are bearishly aligned and diverging downward. KDJ is weak, with K below D and at a low level. Volume is up 1.7x, with bears in control.
════════════════════
🔔 Follow for first-hand market updates 🔔
#技术分析 #MSTU #1000BONK #HBAR
📌 When trading, pay attention to whether the candlestick pattern matches
4-hour bearish alerts for 3 coins, watch out for a drop: $MSTU / $1000BONK / $HBAR 🔥
════════════════════
🟢 $MSTU 4-hour bearish signal
⚠️Technical analysis: ADX is surging; the trend is strong, but watch out for an overheated pullback. The MACD bearish crossover shows bears gaining momentum, and the moving averages are bearishly aligned and trending downward. The KDJ bearish crossover points to short-term weakness, with volume up 2x.
════════════════════
🟢 $1000BONK 4-hour bearish signal
⚠️Technical analysis: The ADX trend has just started to pick up, so you can enter | MACD bearish crossover below zero, with bears accelerating | Short-term moving averages have just formed a bearish alignment | KDJ has crossed below the death line but is not yet in oversold territory (K52.4 D54.9) | Volume is up 2.3x
════════════════════
🟢 $HBAR 4-hour bearish signal
⚠️Technical analysis: ADX indicates a clear trend. The MACD bearish crossover below the zero line is accelerating the decline; the moving averages are bearishly aligned and diverging downward. KDJ is weak, with K below D and at a low level. Volume is up 1.7x, with bears in control.
════════════════════
🔔 Follow for first-hand market updates 🔔
#技术分析 #MSTU #1000BONK #HBAR
📌 When trading, pay attention to whether the candlestick pattern matches
════════════════════
🟢 $MSTU 4-hour bearish signal
⚠️Technical analysis: ADX is surging; the trend is strong, but watch out for an overheated pullback. The MACD bearish crossover shows bears gaining momentum, and the moving averages are bearishly aligned and trending downward. The KDJ bearish crossover points to short-term weakness, with volume up 2x.
════════════════════
🟢 $1000BONK 4-hour bearish signal
⚠️Technical analysis: The ADX trend has just started to pick up, so you can enter | MACD bearish crossover below zero, with bears accelerating | Short-term moving averages have just formed a bearish alignment | KDJ has crossed below the death line but is not yet in oversold territory (K52.4 D54.9) | Volume is up 2.3x
════════════════════
🟢 $HBAR 4-hour bearish signal
⚠️Technical analysis: ADX indicates a clear trend. The MACD bearish crossover below the zero line is accelerating the decline; the moving averages are bearishly aligned and diverging downward. KDJ is weak, with K below D and at a low level. Volume is up 1.7x, with bears in control.
════════════════════
🔔 Follow for first-hand market updates 🔔
#技术分析 #MSTU #1000BONK #HBAR
📌 When trading, pay attention to whether the candlestick pattern matches
6
·
--
Both short- and long-term timeframes are bearish! 3 coins showing bearish confluence on the 30-minute and 4-hour charts 🔥
════════════════════
🟢 $MSTU 30-minute bearish signal
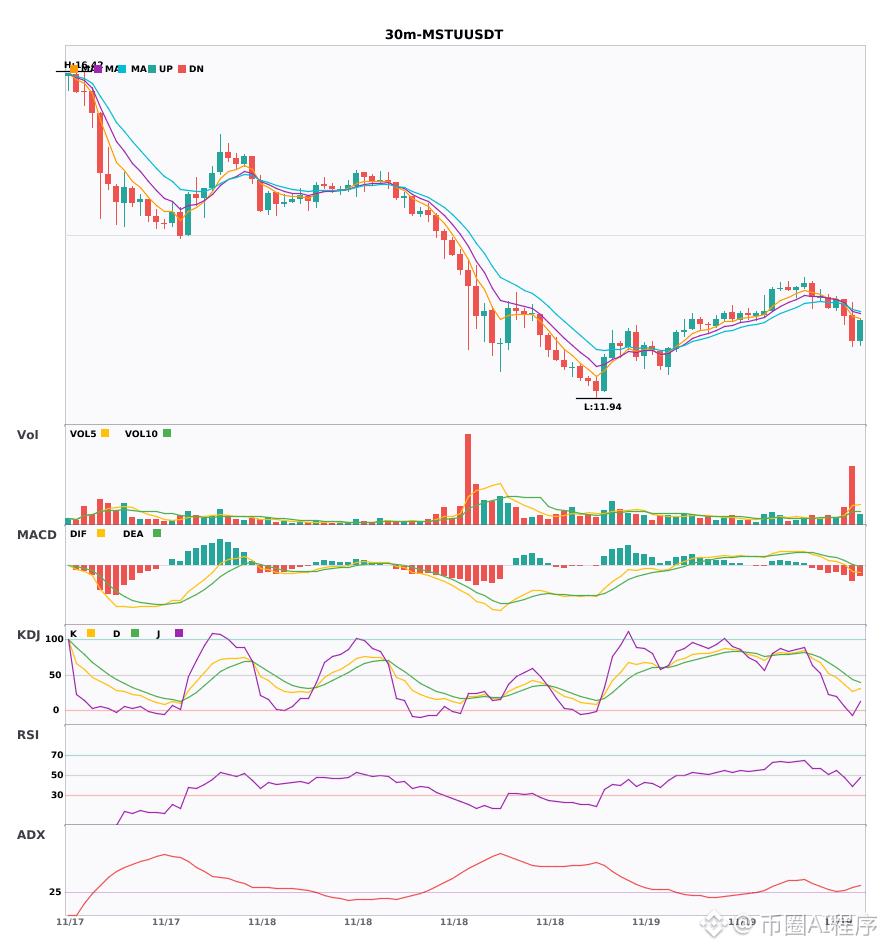
⚠️ Technical analysis: 4-hour bearish trend confirmed by 30-minute confluence. MACD bearish crossover below the zero line, with expanding green bars. Moving averages are bearishly aligned and diverging downward. KDJ K crossed below D but is not yet oversold. Trading volume surged to 4.5×.
════════════════════
🟢 $ZEN 30-minute bearish signal
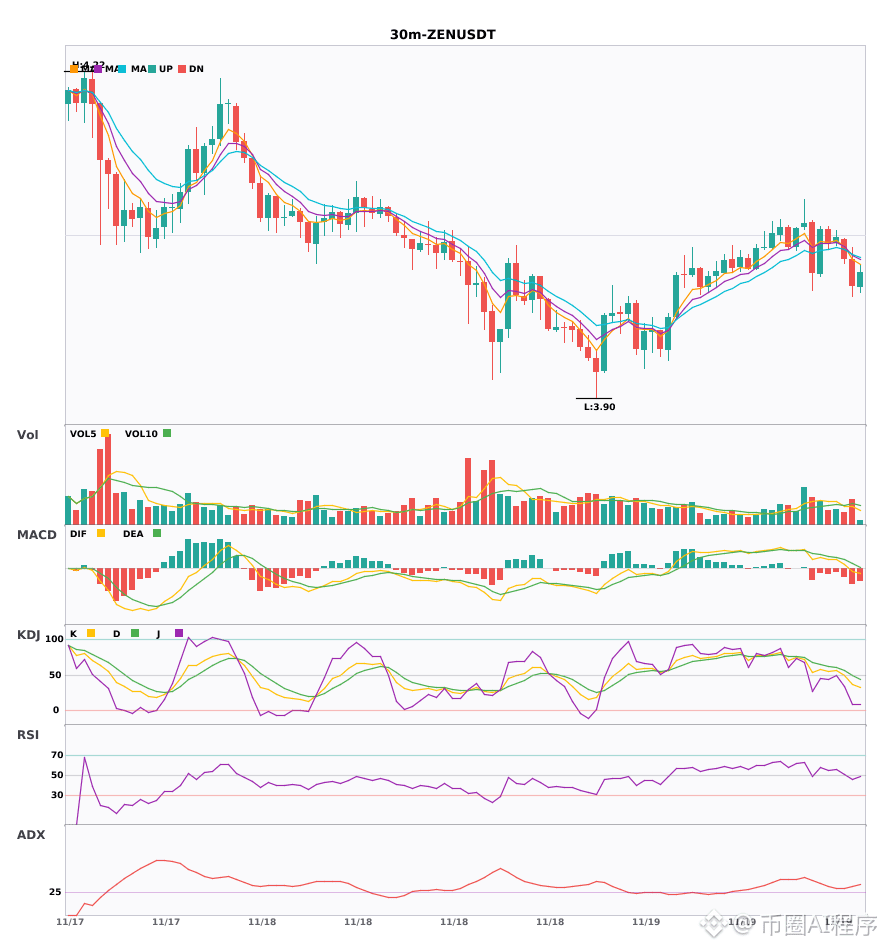
⚠️ Technical analysis: 30-minute entry confirmed by 4-hour bearish confluence. MACD bearish crossover with increased volume below the zero line. Moving averages are bearishly aligned and diverging downward. KDJ K crossed below D but is not oversold. Volume increased 1.2×, offering a multi-timeframe confluence short opportunity.
════════════════════
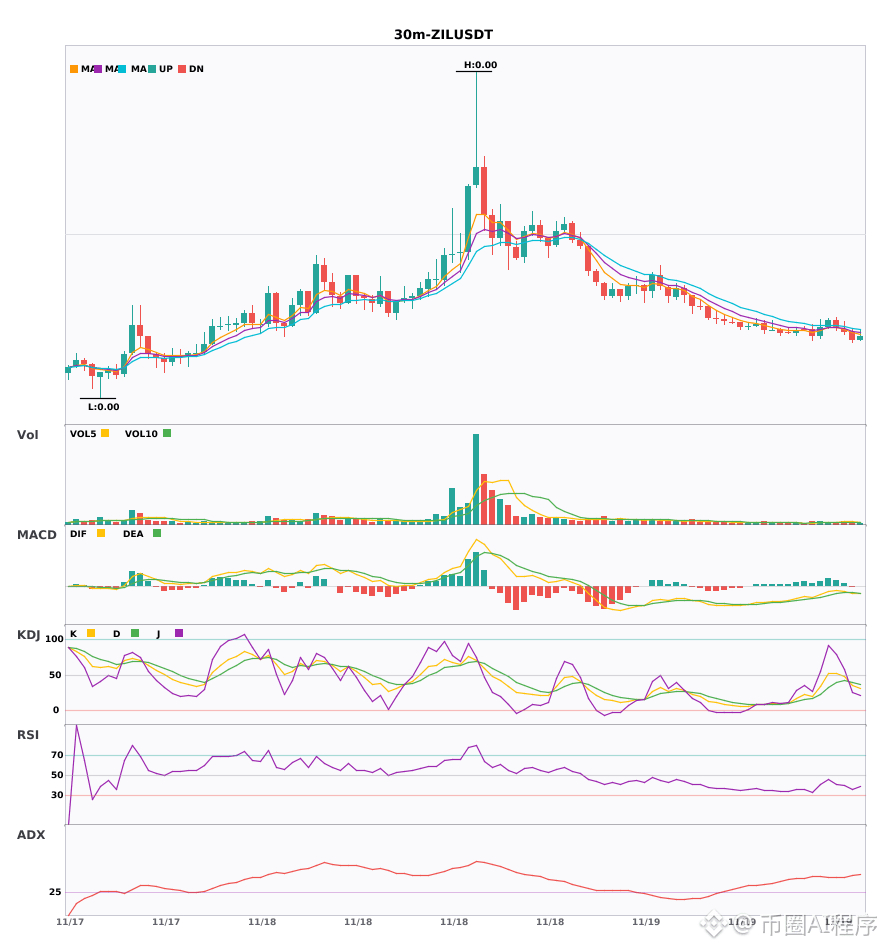
🟢 $ZIL 30-minute bearish signal
⚠️ Technical analysis: 4-hour bearish trend and 30-minute confluence point to a short opportunity. MACD bearish crossover below the zero line with increased volume. Moving averages have just formed a bearish alignment. KDJ bearish crossover, not yet oversold. Volume is at a normal 1.3×.
════════════════════
🔔 Follow for the latest market updates 🔔
#多周期共振 #MSTU #ZEN #ZIL
📌 When trading, watch for whether the candlestick pattern confirms the setup
Both short- and long-term timeframes are bearish! 3 coins showing bearish confluence on the 30-minute and 4-hour charts 🔥
════════════════════
🟢 $MSTU 30-minute bearish signal
⚠️ Technical analysis: 4-hour bearish trend confirmed by 30-minute confluence. MACD bearish crossover below the zero line, with expanding green bars. Moving averages are bearishly aligned and diverging downward. KDJ K crossed below D but is not yet oversold. Trading volume surged to 4.5×.
════════════════════
🟢 $ZEN 30-minute bearish signal
⚠️ Technical analysis: 30-minute entry confirmed by 4-hour bearish confluence. MACD bearish crossover with increased volume below the zero line. Moving averages are bearishly aligned and diverging downward. KDJ K crossed below D but is not oversold. Volume increased 1.2×, offering a multi-timeframe confluence short opportunity.
════════════════════
🟢 $ZIL 30-minute bearish signal
⚠️ Technical analysis: 4-hour bearish trend and 30-minute confluence point to a short opportunity. MACD bearish crossover below the zero line with increased volume. Moving averages have just formed a bearish alignment. KDJ bearish crossover, not yet oversold. Volume is at a normal 1.3×.
════════════════════
🔔 Follow for the latest market updates 🔔
#多周期共振 #MSTU #ZEN #ZIL
📌 When trading, watch for whether the candlestick pattern confirms the setup
════════════════════
🟢 $MSTU 30-minute bearish signal
⚠️ Technical analysis: 4-hour bearish trend confirmed by 30-minute confluence. MACD bearish crossover below the zero line, with expanding green bars. Moving averages are bearishly aligned and diverging downward. KDJ K crossed below D but is not yet oversold. Trading volume surged to 4.5×.
════════════════════
🟢 $ZEN 30-minute bearish signal
⚠️ Technical analysis: 30-minute entry confirmed by 4-hour bearish confluence. MACD bearish crossover with increased volume below the zero line. Moving averages are bearishly aligned and diverging downward. KDJ K crossed below D but is not oversold. Volume increased 1.2×, offering a multi-timeframe confluence short opportunity.
════════════════════
🟢 $ZIL 30-minute bearish signal
⚠️ Technical analysis: 4-hour bearish trend and 30-minute confluence point to a short opportunity. MACD bearish crossover below the zero line with increased volume. Moving averages have just formed a bearish alignment. KDJ bearish crossover, not yet oversold. Volume is at a normal 1.3×.
════════════════════
🔔 Follow for the latest market updates 🔔
#多周期共振 #MSTU #ZEN #ZIL
📌 When trading, watch for whether the candlestick pattern confirms the setup
5
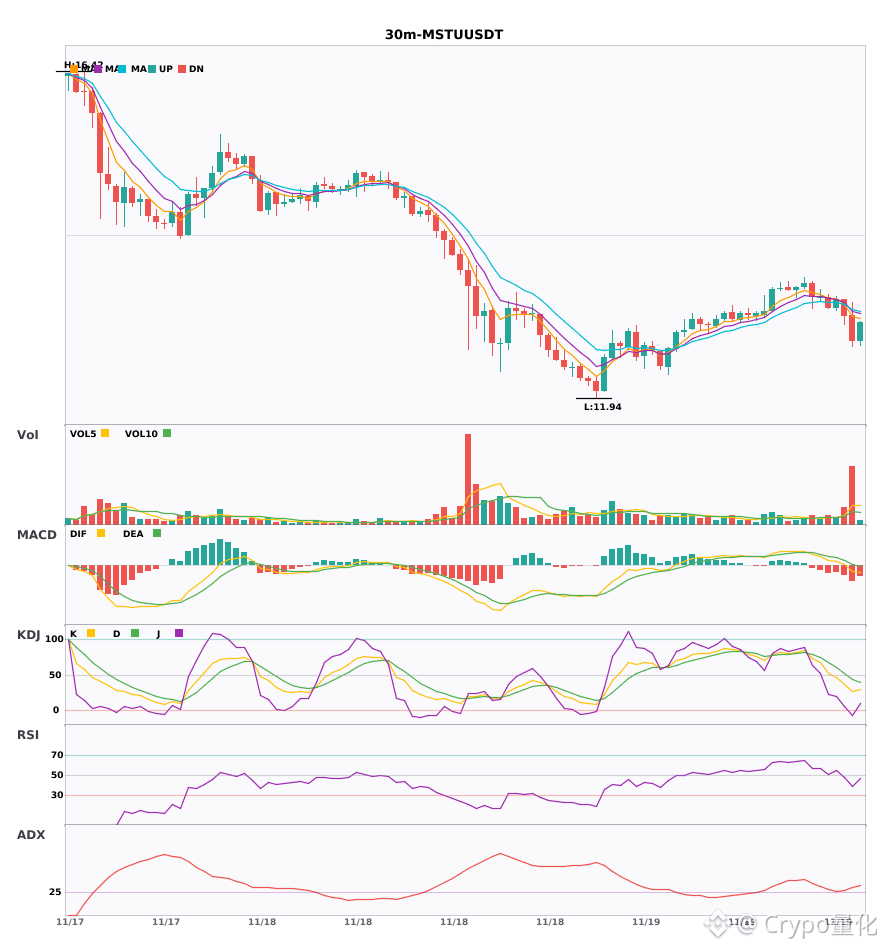
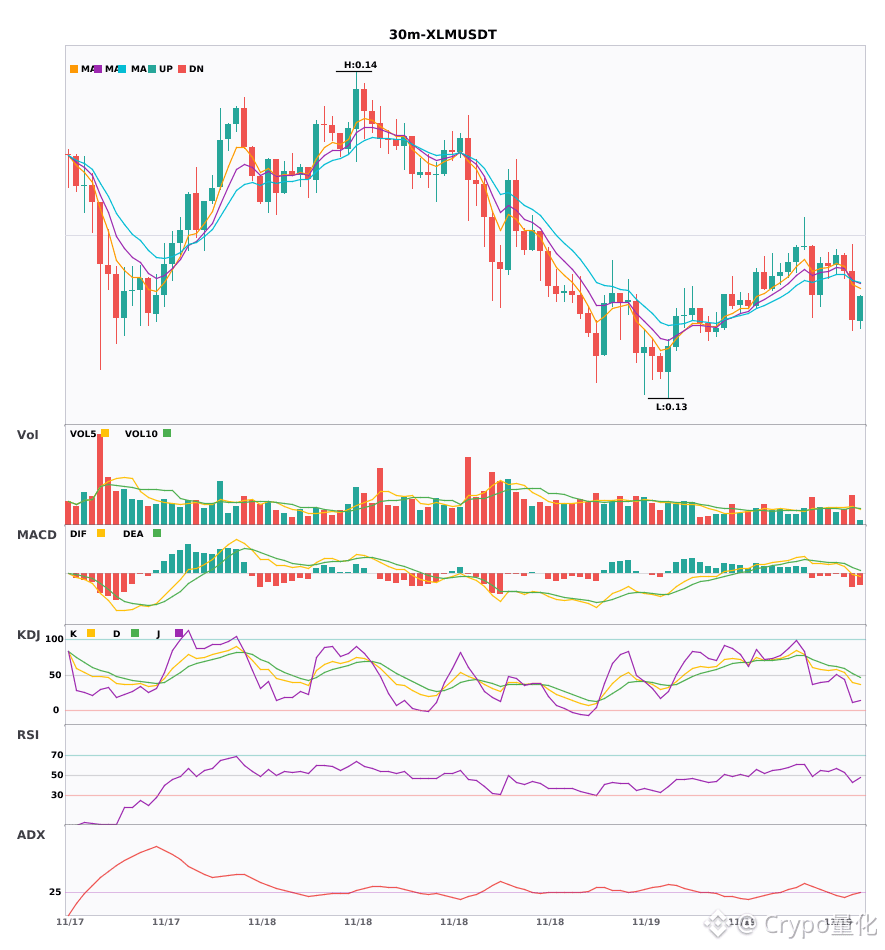
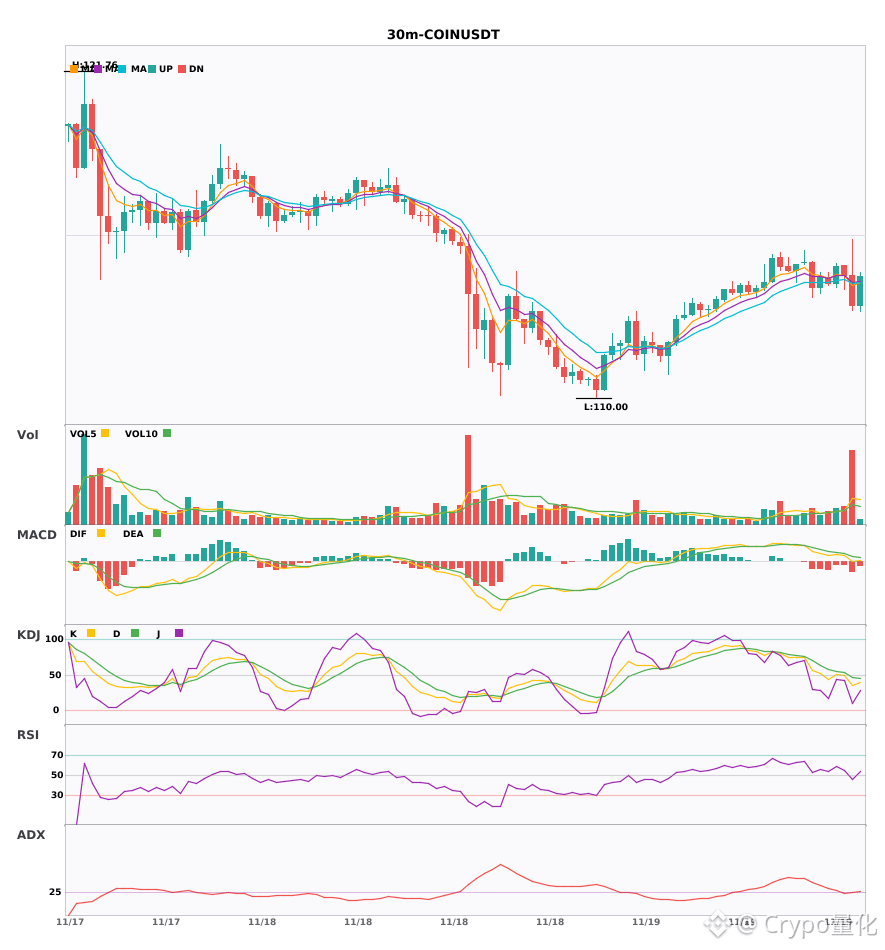
$MSTU/$XLM/$COIN 30-minute timeframe resonance turns bearish, with bearish signals confirmed simultaneously across all three coins
📉 $MSTU | 30-minute bearish signal
━━━━━━━━━━━━━━━━━━
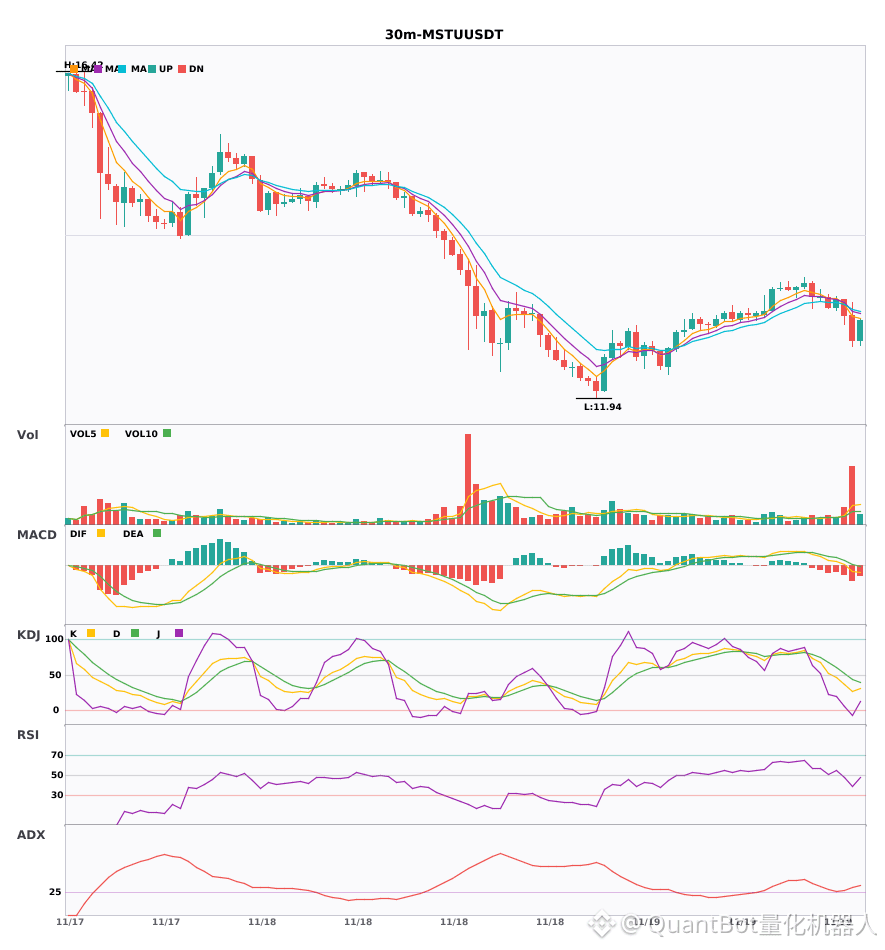
Technical analysis: ADX(34) indicates a strong trend; MACD DIF crosses below the zero line, turning bearish; EMA5/8/13 are bearishly aligned; KDJ is weak (K27.5, D44.4), with bears in control; volume expands to 4.5x.
Price change: -2.6000%
📉 $XLM | 30-minute bearish signal
━━━━━━━━━━━━━━━━━━
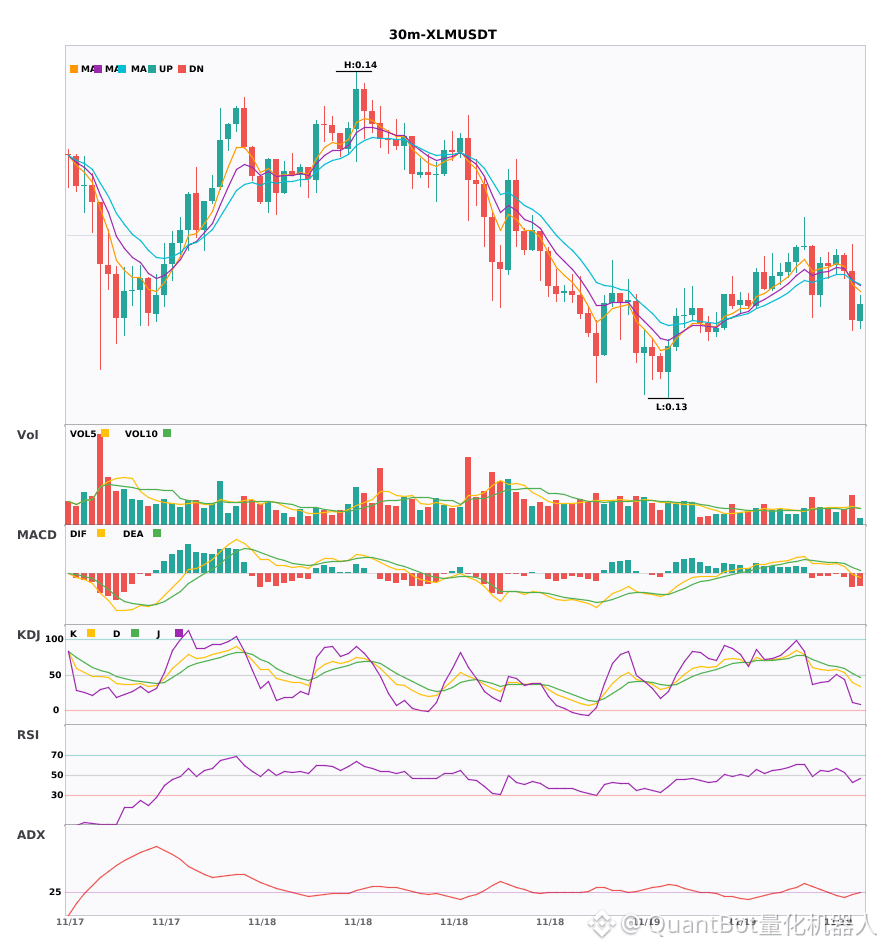
Technical analysis: ADX(25) trend is established and actionable | MACD DIF breaks below the zero line, turning bearish | EMA5 crosses below EMA8, bearish in the short term | Volume expands 1.7x
Price change: -0.8400%
📉 $COIN | 30-minute bearish signal
━━━━━━━━━━━━━━━━━━
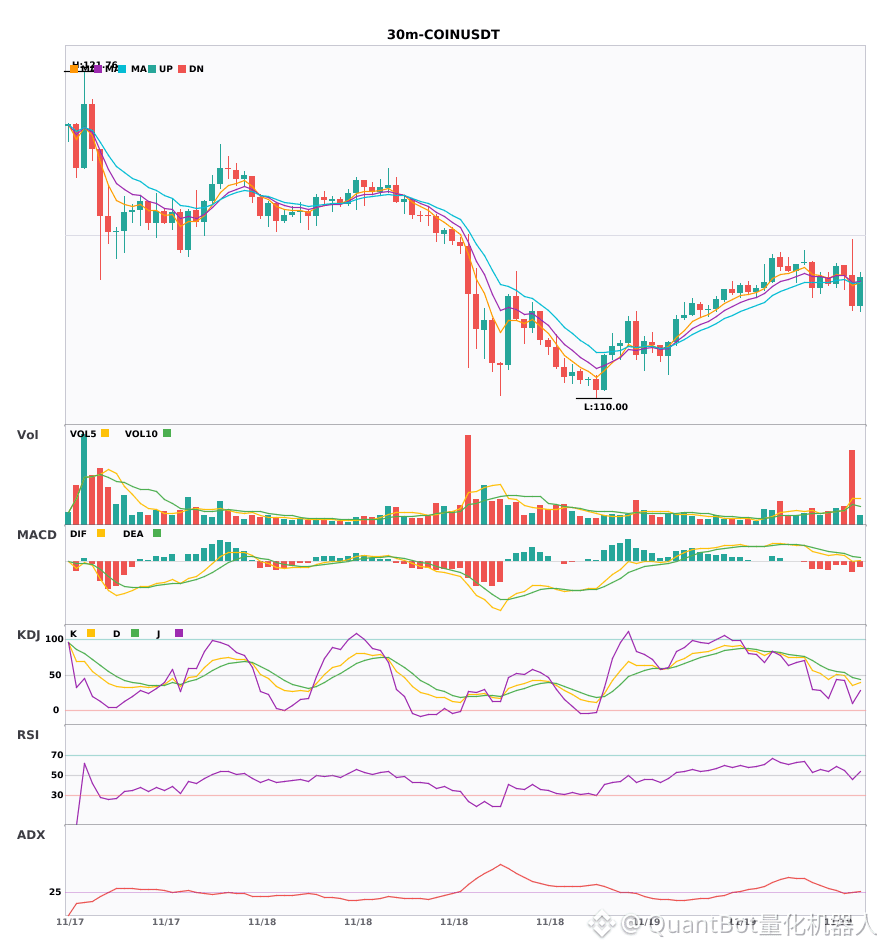
Technical analysis: ADX(26) trend is established and actionable | MACD DIF breaks below the zero line, turning bearish | EMA5 crosses below EMA8, turning bearish in the short term | KDJ favors bears (K34.8/D47.1) | Volume expands 3.7x
Price change: -0.9400%
━━━━━━━━━━━━━━━━━━
#技术分析 #MSTU #XLM #COIN
📌 The above content is for reference only and does not constitute investment advice
$MSTU /$XLM /$COIN 30-minute timeframe resonance turns bearish, with bearish signals confirmed simultaneously across all three coins
📉 $MSTU | 30-minute bearish signal
━━━━━━━━━━━━━━━━━━
Technical analysis: ADX(34) indicates a strong trend; MACD DIF crosses below the zero line, turning bearish; EMA5/8/13 are bearishly aligned; KDJ is weak (K27.5, D44.4), with bears in control; volume expands to 4.5x.
Price change: -2.6000%
📉 $XLM | 30-minute bearish signal
━━━━━━━━━━━━━━━━━━
Technical analysis: ADX(25) trend is established and actionable | MACD DIF breaks below the zero line, turning bearish | EMA5 crosses below EMA8, bearish in the short term | Volume expands 1.7x
Price change: -0.8400%
📉 $COIN | 30-minute bearish signal
━━━━━━━━━━━━━━━━━━
Technical analysis: ADX(26) trend is established and actionable | MACD DIF breaks below the zero line, turning bearish | EMA5 crosses below EMA8, turning bearish in the short term | KDJ favors bears (K34.8/D47.1) | Volume expands 3.7x
Price change: -0.9400%
━━━━━━━━━━━━━━━━━━
#技术分析 #MSTU #XLM #COIN
📌 The above content is for reference only and does not constitute investment advice
📉 $MSTU | 30-minute bearish signal
━━━━━━━━━━━━━━━━━━
Technical analysis: ADX(34) indicates a strong trend; MACD DIF crosses below the zero line, turning bearish; EMA5/8/13 are bearishly aligned; KDJ is weak (K27.5, D44.4), with bears in control; volume expands to 4.5x.
Price change: -2.6000%
📉 $XLM | 30-minute bearish signal
━━━━━━━━━━━━━━━━━━
Technical analysis: ADX(25) trend is established and actionable | MACD DIF breaks below the zero line, turning bearish | EMA5 crosses below EMA8, bearish in the short term | Volume expands 1.7x
Price change: -0.8400%
📉 $COIN | 30-minute bearish signal
━━━━━━━━━━━━━━━━━━
Technical analysis: ADX(26) trend is established and actionable | MACD DIF breaks below the zero line, turning bearish | EMA5 crosses below EMA8, turning bearish in the short term | KDJ favors bears (K34.8/D47.1) | Volume expands 3.7x
Price change: -0.9400%
━━━━━━━━━━━━━━━━━━
#技术分析 #MSTU #XLM #COIN
📌 The above content is for reference only and does not constitute investment advice
6
·
--
$MSTU/$XLM/$COIN 30 minutes bearish; the short-term outlook still calls for holding on 🔥
════════════════════
🟢 $MSTU 30-minute bearish signal
⚠️ Technical analysis: ADX shows a clear trend; MACD's DIF has fallen below the zero line, turning bearish; the moving averages have just formed a bearish alignment; KDJ is weakening, with bears in control (K27.5/D44.4); trading volume surged to 4.5 times its usual level.
════════════════════
🟢 $XLM 30-minute bearish signal
⚠️ Technical analysis: ADX (25) indicates the trend is gaining strength, so a trade is possible | MACD's DIF has fallen below the zero line, leaning bearish | EMA5 has crossed below EMA8, bearish in the short term | Trading volume is up 1.7 times
════════════════════
🟢 $COIN 30-minute bearish signal
⚠️ Technical analysis: The ADX trend is just taking shape and is worth watching; MACD's DIF has fallen below the zero line and is starting to turn bearish; EMA5 has crossed below EMA8, bearish in the short term; in KDJ, K has crossed below D and is not yet oversold, so bears have the upper hand; trading volume surged to 3.7 times its usual level.
════════════════════
🔔 Follow for first-hand market updates 🔔
#技术分析 #MSTU #XLM #COIN
📌 When trading, check whether the candlestick pattern matches.
$MSTU /$XLM /$COIN 30 minutes bearish; the short-term outlook still calls for holding on 🔥
════════════════════
🟢 $MSTU 30-minute bearish signal
⚠️ Technical analysis: ADX shows a clear trend; MACD's DIF has fallen below the zero line, turning bearish; the moving averages have just formed a bearish alignment; KDJ is weakening, with bears in control (K27.5/D44.4); trading volume surged to 4.5 times its usual level.
════════════════════
🟢 $XLM 30-minute bearish signal
⚠️ Technical analysis: ADX (25) indicates the trend is gaining strength, so a trade is possible | MACD's DIF has fallen below the zero line, leaning bearish | EMA5 has crossed below EMA8, bearish in the short term | Trading volume is up 1.7 times
════════════════════
🟢 $COIN 30-minute bearish signal
⚠️ Technical analysis: The ADX trend is just taking shape and is worth watching; MACD's DIF has fallen below the zero line and is starting to turn bearish; EMA5 has crossed below EMA8, bearish in the short term; in KDJ, K has crossed below D and is not yet oversold, so bears have the upper hand; trading volume surged to 3.7 times its usual level.
════════════════════
🔔 Follow for first-hand market updates 🔔
#技术分析 #MSTU #XLM #COIN
📌 When trading, check whether the candlestick pattern matches.
════════════════════
🟢 $MSTU 30-minute bearish signal
⚠️ Technical analysis: ADX shows a clear trend; MACD's DIF has fallen below the zero line, turning bearish; the moving averages have just formed a bearish alignment; KDJ is weakening, with bears in control (K27.5/D44.4); trading volume surged to 4.5 times its usual level.
════════════════════
🟢 $XLM 30-minute bearish signal
⚠️ Technical analysis: ADX (25) indicates the trend is gaining strength, so a trade is possible | MACD's DIF has fallen below the zero line, leaning bearish | EMA5 has crossed below EMA8, bearish in the short term | Trading volume is up 1.7 times
════════════════════
🟢 $COIN 30-minute bearish signal
⚠️ Technical analysis: The ADX trend is just taking shape and is worth watching; MACD's DIF has fallen below the zero line and is starting to turn bearish; EMA5 has crossed below EMA8, bearish in the short term; in KDJ, K has crossed below D and is not yet oversold, so bears have the upper hand; trading volume surged to 3.7 times its usual level.
════════════════════
🔔 Follow for first-hand market updates 🔔
#技术分析 #MSTU #XLM #COIN
📌 When trading, check whether the candlestick pattern matches.
9

·
--
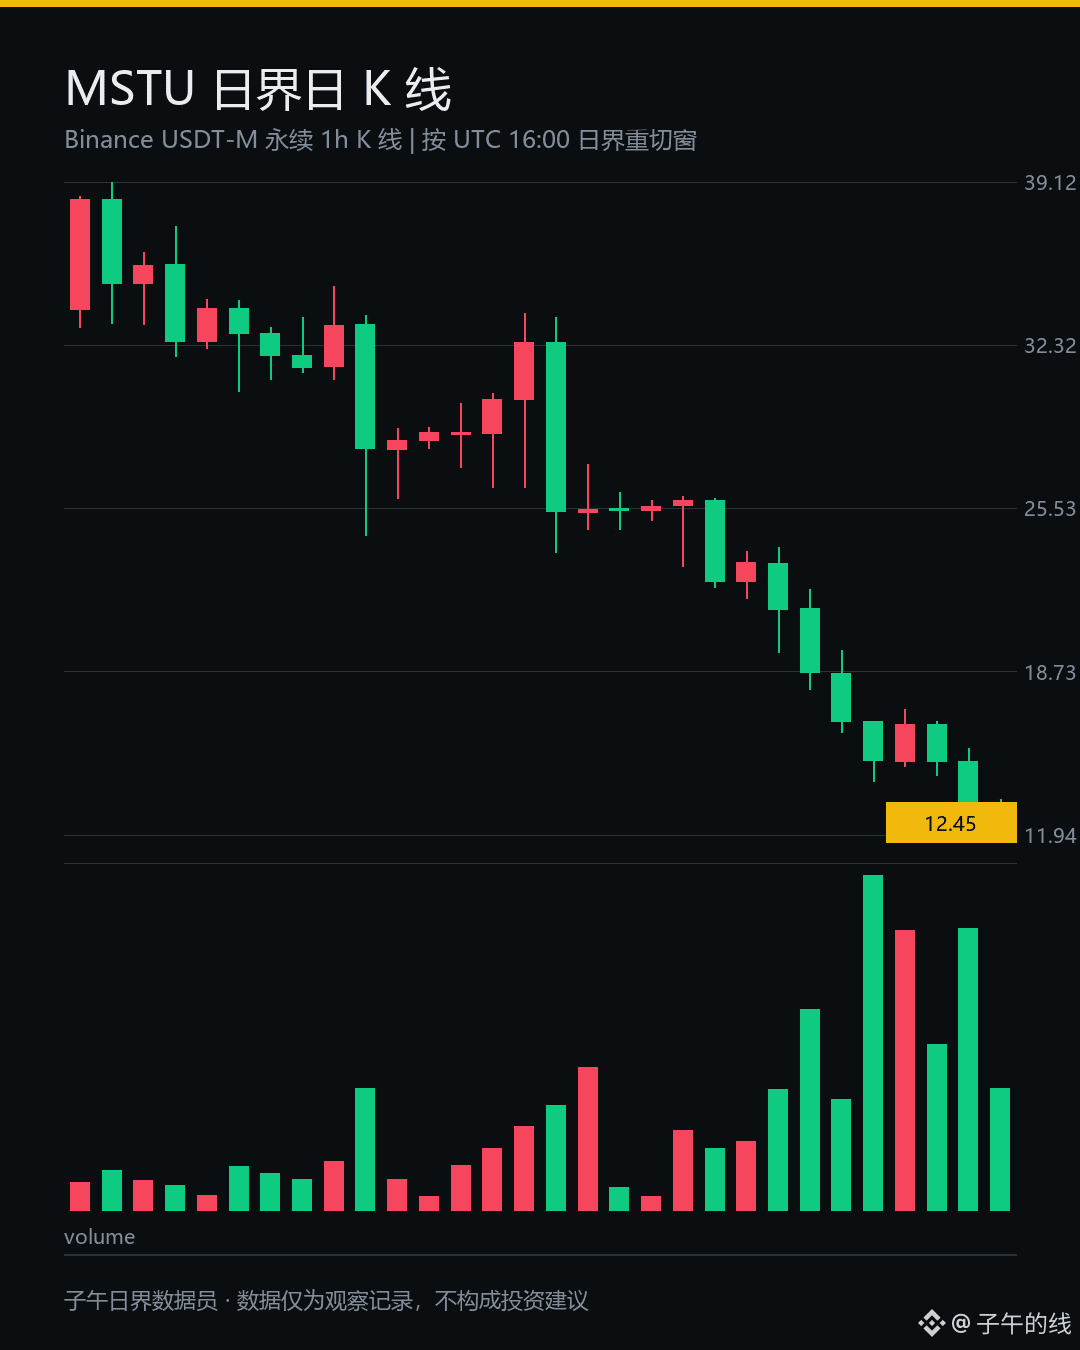
41.28%—that’s the seven-day drop for $MSTU . I stared at that number for a long time.
And now it’s still searching for a floor.
It dropped another 18.945% in 24 hours, sliding on the chart from 39.12 all the way to 12.45, without a single decent bounce along the way.
Let me make my stance clear first: don’t rush to buy the dip.
At the current price, its position in the 20-day range is -0.43%. Negative.
The range tops out at 33.63 and bottoms at 12.62, and it hasn’t even managed to stay above the lower bound.
It’s like a pot taken off the stove that’s still rolling around on the floor. Most of the water has already spilled out, and anyone who reaches for it will get burned.
The average daily volatility is 21.12%. It can swing up and down twice in a day, and with a ticker like this, a bounce can easily turn into an opportunity for holders to cash out.
Trading volume is genuinely piling up around the lows. A few red bars among the green ones suggest that people are indeed changing hands and providing support here; that hasn’t dried up.
I don’t believe this is just a sell-off to push the price down.
It’s tied to an underlying asset with two times leverage. When the underlying falls, this one takes a double hit, with no room to spare on the way down.
These tickers are inherently thinly traded, like a supermarket downstairs having a clearance sale: lots of people shouting, but few actually reaching for their wallets.
Honestly, I’ve gone over the volume and price action from the past few days twice. The holdings are shifting lower, and liquidity is so thin you can see the bottom.
Reducing my attention, not ignoring it.
I’ll keep watching for now.
What do you all think? For a ticker rolling downhill right along the lower bound, should we keep waiting, or cut our losses here?
$BTC $ETH
#MSTU #比特币 #Cryptocurrency
The above is a record of my personal trading system and observations of the data, and does not constitute investment advice.
41.28%—that’s the seven-day drop for $MSTU . I stared at that number for a long time.
And now it’s still searching for a floor.
It dropped another 18.945% in 24 hours, sliding on the chart from 39.12 all the way to 12.45, without a single decent bounce along the way.
Let me make my stance clear first: don’t rush to buy the dip.
At the current price, its position in the 20-day range is -0.43%. Negative.
The range tops out at 33.63 and bottoms at 12.62, and it hasn’t even managed to stay above the lower bound.
It’s like a pot taken off the stove that’s still rolling around on the floor. Most of the water has already spilled out, and anyone who reaches for it will get burned.
The average daily volatility is 21.12%. It can swing up and down twice in a day, and with a ticker like this, a bounce can easily turn into an opportunity for holders to cash out.
Trading volume is genuinely piling up around the lows. A few red bars among the green ones suggest that people are indeed changing hands and providing support here; that hasn’t dried up.
I don’t believe this is just a sell-off to push the price down.
It’s tied to an underlying asset with two times leverage. When the underlying falls, this one takes a double hit, with no room to spare on the way down.
These tickers are inherently thinly traded, like a supermarket downstairs having a clearance sale: lots of people shouting, but few actually reaching for their wallets.
Honestly, I’ve gone over the volume and price action from the past few days twice. The holdings are shifting lower, and liquidity is so thin you can see the bottom.
Reducing my attention, not ignoring it.
I’ll keep watching for now.
What do you all think? For a ticker rolling downhill right along the lower bound, should we keep waiting, or cut our losses here?
$BTC $ETH
#MSTU #比特币 #Cryptocurrency
The above is a record of my personal trading system and observations of the data, and does not constitute investment advice.
And now it’s still searching for a floor.
It dropped another 18.945% in 24 hours, sliding on the chart from 39.12 all the way to 12.45, without a single decent bounce along the way.
Let me make my stance clear first: don’t rush to buy the dip.
At the current price, its position in the 20-day range is -0.43%. Negative.
The range tops out at 33.63 and bottoms at 12.62, and it hasn’t even managed to stay above the lower bound.
It’s like a pot taken off the stove that’s still rolling around on the floor. Most of the water has already spilled out, and anyone who reaches for it will get burned.
The average daily volatility is 21.12%. It can swing up and down twice in a day, and with a ticker like this, a bounce can easily turn into an opportunity for holders to cash out.
Trading volume is genuinely piling up around the lows. A few red bars among the green ones suggest that people are indeed changing hands and providing support here; that hasn’t dried up.
I don’t believe this is just a sell-off to push the price down.
It’s tied to an underlying asset with two times leverage. When the underlying falls, this one takes a double hit, with no room to spare on the way down.
These tickers are inherently thinly traded, like a supermarket downstairs having a clearance sale: lots of people shouting, but few actually reaching for their wallets.
Honestly, I’ve gone over the volume and price action from the past few days twice. The holdings are shifting lower, and liquidity is so thin you can see the bottom.
Reducing my attention, not ignoring it.
I’ll keep watching for now.
What do you all think? For a ticker rolling downhill right along the lower bound, should we keep waiting, or cut our losses here?
$BTC $ETH
#MSTU #比特币 #Cryptocurrency
The above is a record of my personal trading system and observations of the data, and does not constitute investment advice.
317

·
--
Bullish
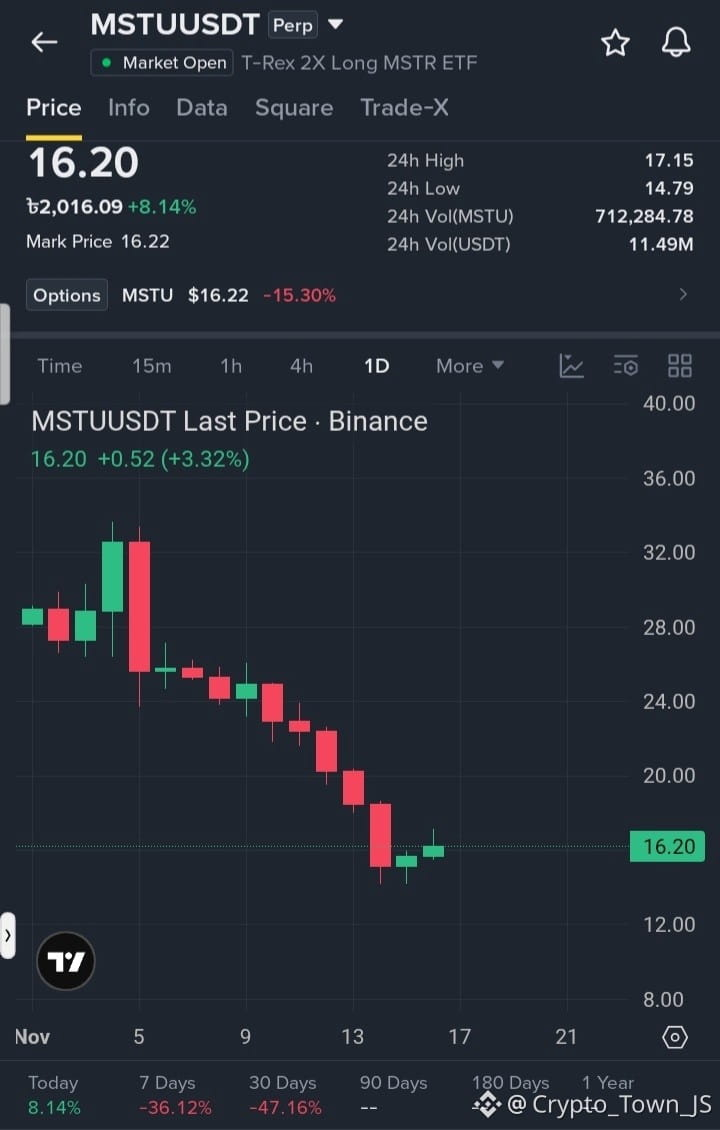
$MSTU USDT PERP Long Setup
MSTU is trading around 16.20 USDT, up approximately 8.14% over the last 24 hours. Short-term momentum is recovering, but the broader trend remains weak, with a 36.12% decline over 7 days and a 47.16% decline over 90 days. Price is approaching resistance near 17.15. A confirmed breakout could support further recovery, but caution is important due to volatility.
Entry Zone: 15.80 – 16.30
TP1: 17.15
TP2: 18.50
TP3: 20.00
SL: 14.75
#MSTU #BinanceSquare #Crypto #trading #cryptotrading
$MSTR
{future}(MSTRUSDT)
$BTC
{future}(BTCUSDT)
{future}(MSTUUSDT)
$MSTU USDT PERP Long Setup
MSTU is trading around 16.20 USDT, up approximately 8.14% over the last 24 hours. Short-term momentum is recovering, but the broader trend remains weak, with a 36.12% decline over 7 days and a 47.16% decline over 90 days. Price is approaching resistance near 17.15. A confirmed breakout could support further recovery, but caution is important due to volatility.
Entry Zone: 15.80 – 16.30
TP1: 17.15
TP2: 18.50
TP3: 20.00
SL: 14.75
#MSTU #BinanceSquare #Crypto #trading #cryptotrading
$MSTR
$BTC
MSTU is trading around 16.20 USDT, up approximately 8.14% over the last 24 hours. Short-term momentum is recovering, but the broader trend remains weak, with a 36.12% decline over 7 days and a 47.16% decline over 90 days. Price is approaching resistance near 17.15. A confirmed breakout could support further recovery, but caution is important due to volatility.
Entry Zone: 15.80 – 16.30
TP1: 17.15
TP2: 18.50
TP3: 20.00
SL: 14.75
#MSTU #BinanceSquare #Crypto #trading #cryptotrading
$MSTR
$BTC
4
·
--
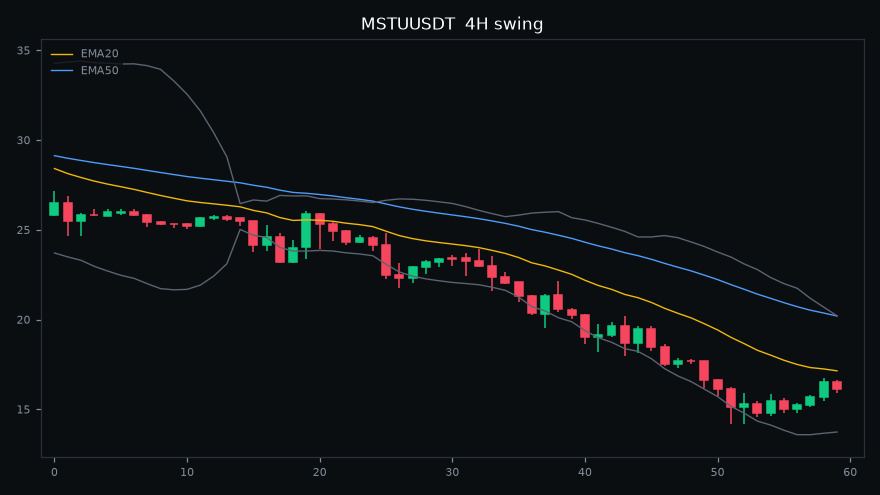
📊 $MSTU quant snapshot (4H swing)
Bias score: -60 (Strongly bearish)
Trend: EMA20 < EMA50 | MACD: bullish
RSI(14): 34 | Bollinger %B: 0.37
Volatility (ATR): 6.4% | Volume vs avg: 0.7x
Return z-score: -0.7 | BTC corr: 0.72
The numbers lean bearish, be careful with longs.
Score = average of 5 signals: EMA trend, price vs EMA50, MACD, RSI, Bollinger.
#MSTU #Trading #Binance
⚠️ For education only. Trade at your own risk.
📊 $MSTU quant snapshot (4H swing)
Bias score: -60 (Strongly bearish)
Trend: EMA20 < EMA50 | MACD: bullish
RSI(14): 34 | Bollinger %B: 0.37
Volatility (ATR): 6.4% | Volume vs avg: 0.7x
Return z-score: -0.7 | BTC corr: 0.72
The numbers lean bearish, be careful with longs.
Score = average of 5 signals: EMA trend, price vs EMA50, MACD, RSI, Bollinger.
#MSTU #Trading #Binance
⚠️ For education only. Trade at your own risk.
Bias score: -60 (Strongly bearish)
Trend: EMA20 < EMA50 | MACD: bullish
RSI(14): 34 | Bollinger %B: 0.37
Volatility (ATR): 6.4% | Volume vs avg: 0.7x
Return z-score: -0.7 | BTC corr: 0.72
The numbers lean bearish, be careful with longs.
Score = average of 5 signals: EMA trend, price vs EMA50, MACD, RSI, Bollinger.
#MSTU #Trading #Binance
⚠️ For education only. Trade at your own risk.

·
--
The 17.15 touched just after the market opened—has it reached last Friday’s 17.99 yet?
No. $MSTU ’s contract high was 17.15, and the cash market’s high for the same period was 17.14. Both are still below last Friday’s cash-market low of 17.99. The current price is about 16.31, and cash is about 16.30, with an intraday cash-market low of 15.76.
▪️ Open interest was about 127,300 this morning, later fell to 94,900, and is now about 96,800
▪️ Funding settled at 0 at both 16:00 and 00:00 (at 08:00, longs still paid 0.2123%)
Will it reclaim 17.99 first, or retest the intraday low of 15.76 first?
#MSTU #Leveraged ETF
The 17.15 touched just after the market opened—has it reached last Friday’s 17.99 yet?
No. $MSTU ’s contract high was 17.15, and the cash market’s high for the same period was 17.14. Both are still below last Friday’s cash-market low of 17.99. The current price is about 16.31, and cash is about 16.30, with an intraday cash-market low of 15.76.
▪️ Open interest was about 127,300 this morning, later fell to 94,900, and is now about 96,800
▪️ Funding settled at 0 at both 16:00 and 00:00 (at 08:00, longs still paid 0.2123%)
Will it reclaim 17.99 first, or retest the intraday low of 15.76 first?
#MSTU #Leveraged ETF
No. $MSTU ’s contract high was 17.15, and the cash market’s high for the same period was 17.14. Both are still below last Friday’s cash-market low of 17.99. The current price is about 16.31, and cash is about 16.30, with an intraday cash-market low of 15.76.
▪️ Open interest was about 127,300 this morning, later fell to 94,900, and is now about 96,800
▪️ Funding settled at 0 at both 16:00 and 00:00 (at 08:00, longs still paid 0.2123%)
Will it reclaim 17.99 first, or retest the intraday low of 15.76 first?
#MSTU #Leveraged ETF
4
·
--
Yesterday, shorts paid at the capped rate. At 8 a.m. this morning, was the same side still paying? $MSTU
No. This morning’s settlement was +0.2123%, so longs are now paying.
▪️ Perpetual contract: currently around 15.68, with a subsequent low of 14.55 and high of 15.86; Friday’s spot market closed at 19.15, with a low of 17.99
▪️ Open interest: around 136,000 yesterday at noon, around 149,100 at 16:40, and around 127,300 now
▪️ Funding rate: yesterday at 8 a.m. -2.0000%, at midnight -0.1759%, and this morning +0.2123%
Long accounts have fallen from around 68% to around 63.9%. The estimated rate at 16:00 is around 0.221%. Will positions be added back first, or will longs keep paying?
#MSTU #Leveraged ETF
Yesterday, shorts paid at the capped rate. At 8 a.m. this morning, was the same side still paying? $MSTU
No. This morning’s settlement was +0.2123%, so longs are now paying.
▪️ Perpetual contract: currently around 15.68, with a subsequent low of 14.55 and high of 15.86; Friday’s spot market closed at 19.15, with a low of 17.99
▪️ Open interest: around 136,000 yesterday at noon, around 149,100 at 16:40, and around 127,300 now
▪️ Funding rate: yesterday at 8 a.m. -2.0000%, at midnight -0.1759%, and this morning +0.2123%
Long accounts have fallen from around 68% to around 63.9%. The estimated rate at 16:00 is around 0.221%. Will positions be added back first, or will longs keep paying?
#MSTU #Leveraged ETF
No. This morning’s settlement was +0.2123%, so longs are now paying.
▪️ Perpetual contract: currently around 15.68, with a subsequent low of 14.55 and high of 15.86; Friday’s spot market closed at 19.15, with a low of 17.99
▪️ Open interest: around 136,000 yesterday at noon, around 149,100 at 16:40, and around 127,300 now
▪️ Funding rate: yesterday at 8 a.m. -2.0000%, at midnight -0.1759%, and this morning +0.2123%
Long accounts have fallen from around 68% to around 63.9%. The estimated rate at 16:00 is around 0.221%. Will positions be added back first, or will longs keep paying?
#MSTU #Leveraged ETF
191
·
--
Over the weekend, the contract open interest for $MSTU more than doubled.
On Friday, the official spot close was 19.15, with a low of 17.99; the contract hit a low of 14.18 this morning and is now around 15.25 (down about 13% over 24 hours).
▪️ Open interest: 58.4K yesterday morning, rising to 142.6K by 10 a.m. today; now around 136K
▪️ Funding rate: -0.5468% at 00:00, settled at -2.0000% at 08:00, and is still estimated at around -1.31% for 16:00
▪️ Long accounts currently make up around 68%
#MSTU #Leveraged ETF
Over the weekend, the contract open interest for $MSTU more than doubled.
On Friday, the official spot close was 19.15, with a low of 17.99; the contract hit a low of 14.18 this morning and is now around 15.25 (down about 13% over 24 hours).
▪️ Open interest: 58.4K yesterday morning, rising to 142.6K by 10 a.m. today; now around 136K
▪️ Funding rate: -0.5468% at 00:00, settled at -2.0000% at 08:00, and is still estimated at around -1.31% for 16:00
▪️ Long accounts currently make up around 68%
#MSTU #Leveraged ETF
On Friday, the official spot close was 19.15, with a low of 17.99; the contract hit a low of 14.18 this morning and is now around 15.25 (down about 13% over 24 hours).
▪️ Open interest: 58.4K yesterday morning, rising to 142.6K by 10 a.m. today; now around 136K
▪️ Funding rate: -0.5468% at 00:00, settled at -2.0000% at 08:00, and is still estimated at around -1.31% for 16:00
▪️ Long accounts currently make up around 68%
#MSTU #Leveraged ETF
231

·
--
Structural Observation | Research Framework
Research $MSTU funding rate: currently -2.0000%, with short positions somewhat crowded.
Tracking sequence: funding rate persistence → price synchronization → position changes → post-settlement recovery.
A single signal is insufficient to make a judgment.
#MSTU #Research Framework
Structural Observation | Research Framework
Research $MSTU funding rate: currently -2.0000%, with short positions somewhat crowded.
Tracking sequence: funding rate persistence → price synchronization → position changes → post-settlement recovery.
A single signal is insufficient to make a judgment.
#MSTU #Research Framework
Research $MSTU funding rate: currently -2.0000%, with short positions somewhat crowded.
Tracking sequence: funding rate persistence → price synchronization → position changes → post-settlement recovery.
A single signal is insufficient to make a judgment.
#MSTU #Research Framework
29
·
--
MSTU has two answers; first, wait for selling pressure to set the order.
Binance TradFi Perpetuals (traditional finance, with high gap risk outside trading hours) | MSTU is down 21.64% over the past 24 hours, and weakness persists. Any recovery depends first on whether selling pressure eases. Current price is around 14.48, with 24h trading volume of around 10.2244 million; the 30m volume ratio is 5.9x, indicating rising participation. Positioning: 65% of accounts are long; the taker buy/sell ratio is 0.79 (aggressive sellers are dominant); 30m open interest is up 3.8%; funding rate is -2.0000%.
Reference indicators: The 30m RSI is 28.97, in oversold territory, suggesting short-term panic is already intense. The 30m ATR trend band reference level is 15.475505; the current price is below it, indicating a weak structure. Watch whether price can reclaim that level.
Which would you wait for first: the taker buy/sell ratio of 0.79 to move back above 1, or the 30m RSI of 29 to move back above 30?
#MSTU #Unusual-Movement Alert
MSTU has two answers; first, wait for selling pressure to set the order.
Binance TradFi Perpetuals (traditional finance, with high gap risk outside trading hours) | MSTU is down 21.64% over the past 24 hours, and weakness persists. Any recovery depends first on whether selling pressure eases. Current price is around 14.48, with 24h trading volume of around 10.2244 million; the 30m volume ratio is 5.9x, indicating rising participation. Positioning: 65% of accounts are long; the taker buy/sell ratio is 0.79 (aggressive sellers are dominant); 30m open interest is up 3.8%; funding rate is -2.0000%.
Reference indicators: The 30m RSI is 28.97, in oversold territory, suggesting short-term panic is already intense. The 30m ATR trend band reference level is 15.475505; the current price is below it, indicating a weak structure. Watch whether price can reclaim that level.
Which would you wait for first: the taker buy/sell ratio of 0.79 to move back above 1, or the 30m RSI of 29 to move back above 30?
#MSTU #Unusual-Movement Alert
Binance TradFi Perpetuals (traditional finance, with high gap risk outside trading hours) | MSTU is down 21.64% over the past 24 hours, and weakness persists. Any recovery depends first on whether selling pressure eases. Current price is around 14.48, with 24h trading volume of around 10.2244 million; the 30m volume ratio is 5.9x, indicating rising participation. Positioning: 65% of accounts are long; the taker buy/sell ratio is 0.79 (aggressive sellers are dominant); 30m open interest is up 3.8%; funding rate is -2.0000%.
Reference indicators: The 30m RSI is 28.97, in oversold territory, suggesting short-term panic is already intense. The 30m ATR trend band reference level is 15.475505; the current price is below it, indicating a weak structure. Watch whether price can reclaim that level.
Which would you wait for first: the taker buy/sell ratio of 0.79 to move back above 1, or the 30m RSI of 29 to move back above 30?
#MSTU #Unusual-Movement Alert
79
·
--
Monitoring|Funding Rate Divergence
$MSTU Current funding rate: -2.0000%. Short positions appear somewhat crowded.
If the funding rate continues to rise but the price stops advancing, watch for a divergence between positioning and price. If they move in sync, the trend still needs to be validated over time.
For research purposes only.
#MSTU #FundingRateDivergence
Monitoring|Funding Rate Divergence
$MSTU Current funding rate: -2.0000%. Short positions appear somewhat crowded.
If the funding rate continues to rise but the price stops advancing, watch for a divergence between positioning and price. If they move in sync, the trend still needs to be validated over time.
For research purposes only.
#MSTU #FundingRateDivergence
$MSTU Current funding rate: -2.0000%. Short positions appear somewhat crowded.
If the funding rate continues to rise but the price stops advancing, watch for a divergence between positioning and price. If they move in sync, the trend still needs to be validated over time.
For research purposes only.
#MSTU #FundingRateDivergence
6
·
--
Sentiment Temperature Alert | Research Framework
Research $MSTU funding rate: currently -0.3079%; short positions are somewhat crowded.
Monitoring sequence: rate persistence → price synchronization → position changes → post-settlement recovery.
Manage risk first, then consider opportunities.
#MSTU #Research Framework
Sentiment Temperature Alert | Research Framework
Research $MSTU funding rate: currently -0.3079%; short positions are somewhat crowded.
Monitoring sequence: rate persistence → price synchronization → position changes → post-settlement recovery.
Manage risk first, then consider opportunities.
#MSTU #Research Framework
Research $MSTU funding rate: currently -0.3079%; short positions are somewhat crowded.
Monitoring sequence: rate persistence → price synchronization → position changes → post-settlement recovery.
Manage risk first, then consider opportunities.
#MSTU #Research Framework
1
1

·
--
Bearish
{future}(MSTUUSDT)
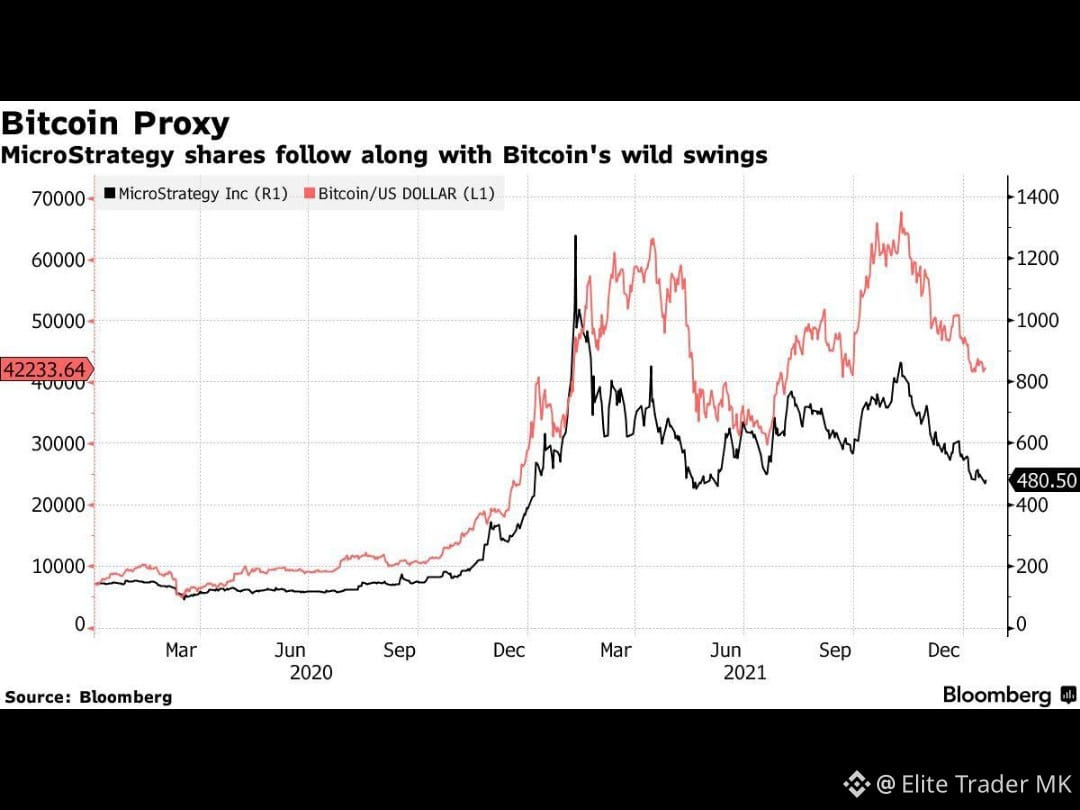
$MSTU is not a newly launched traditional cryptocurrency. It is the ticker for the T-Rex 2X Long $MSTRB Daily Target ETF, which is linked to MicroStrategy (now Strategy) stock.
Binance has introduced $MSTU perpetual futures trading, rather than a normal MSTU cryptocurrency spot listing. #mstuusdt #MSTU
$MSTU is not a newly launched traditional cryptocurrency. It is the ticker for the T-Rex 2X Long $MSTRB Daily Target ETF, which is linked to MicroStrategy (now Strategy) stock.
Binance has introduced $MSTU perpetual futures trading, rather than a normal MSTU cryptocurrency spot listing. #mstuusdt #MSTU
Binance has introduced $MSTU perpetual futures trading, rather than a normal MSTU cryptocurrency spot listing. #mstuusdt #MSTU
1
611
·
--
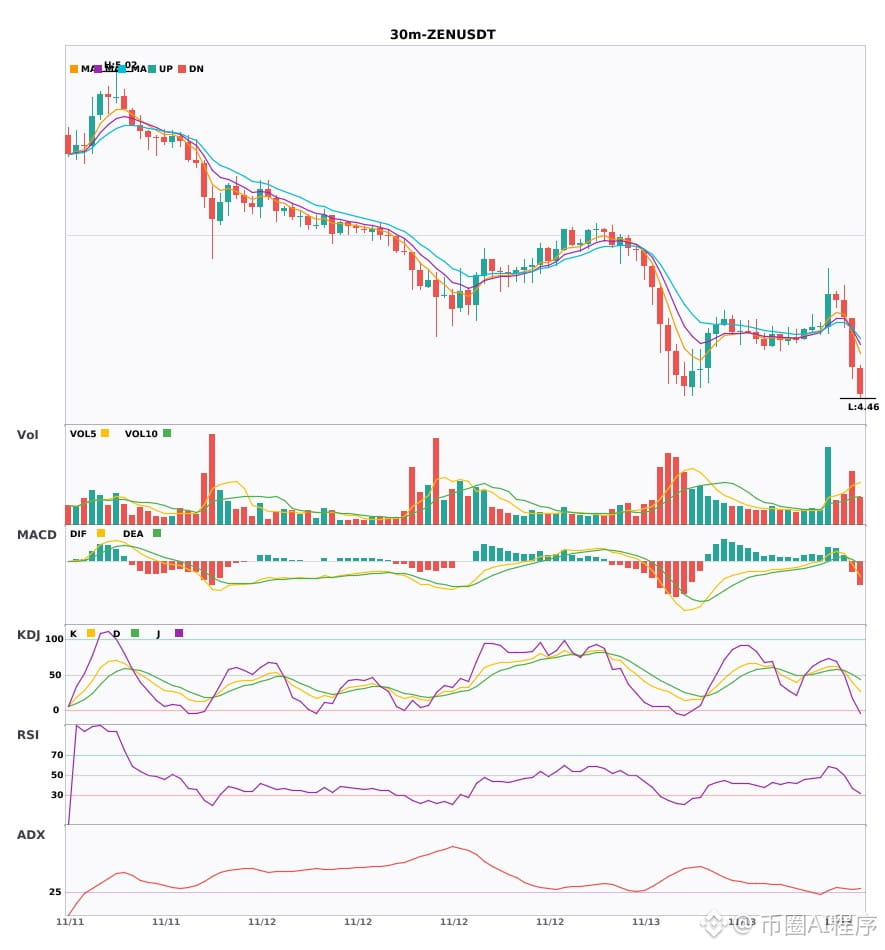
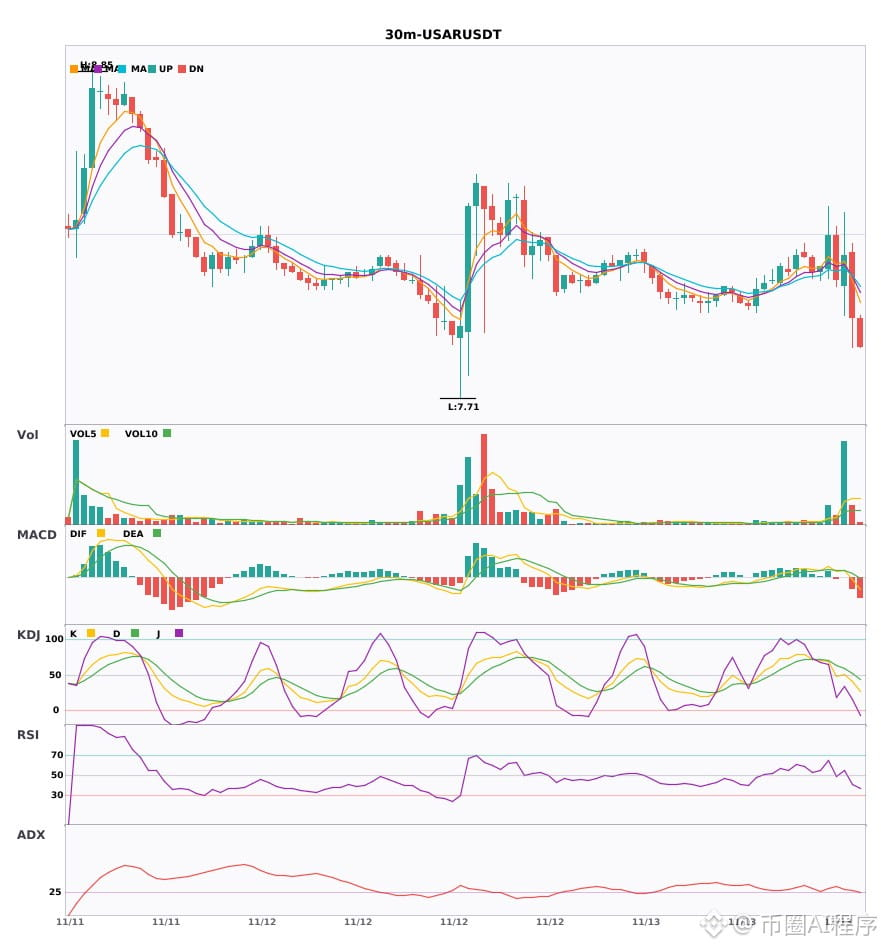
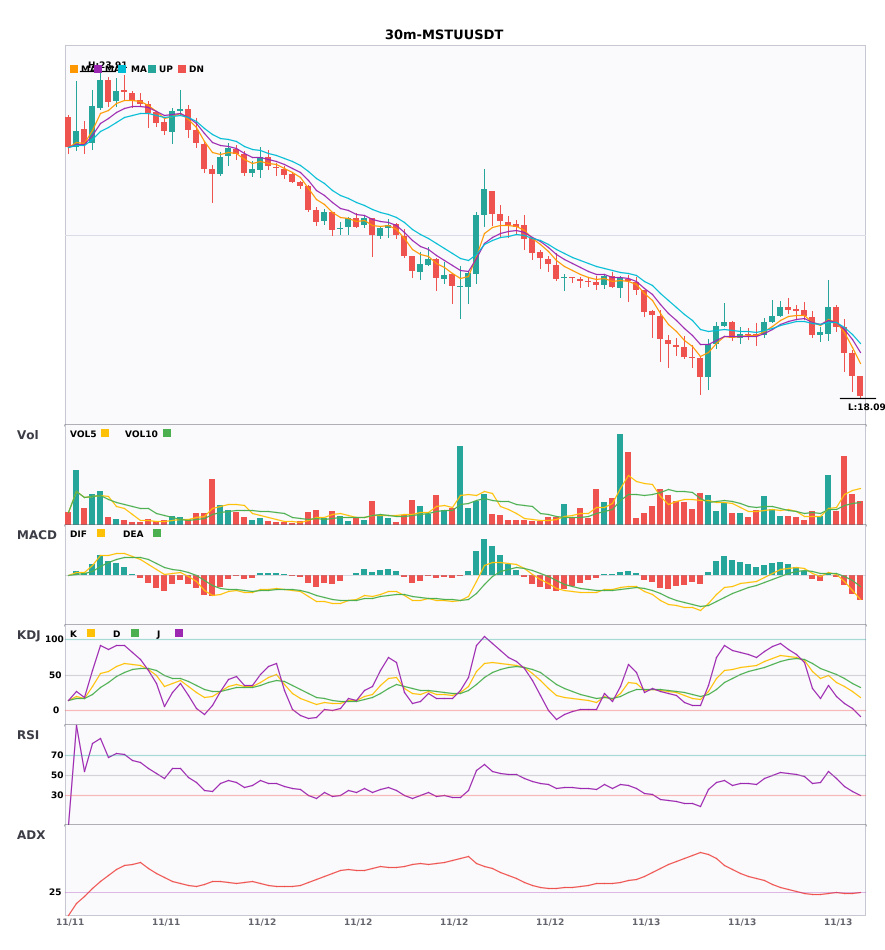
$ZEN $USAR $MSTU 30-minute 4-hour double bearish signal🔥
════════════════════
🟢 $ZEN 30-minute bearish signal
⚠️Technical analysis: 4-hour bearish trend + 30-minute confluence confirmation; MACD bearish crossover with accelerating volume; moving averages bearishly aligned and diverging downward; trading volume doubled
════════════════════
🟢 $USAR 30-minute bearish signal
⚠️Technical analysis: 4-hour bullish trend + daily bullish confluence confirmation; 30-minute MACD bullish crossover with rising volume and red bars continuing to grow; moving averages bullishly aligned and diverging upward; KDJ K crossed above D and has not entered the overbought zone
════════════════════
🟢 $MSTU 30-minute bearish signal
⚠️Technical analysis: 4-hour bearish trend + 30-minute confluence confirmation: MACD bearish crossover broke below the zero line on rising volume; moving averages bearishly aligned and moving downward; KDJ K crossed below D but is not oversold; volume increased 3.4 times
════════════════════
🔔 Follow to get first-hand market updates 🔔
#多周期共振 #ZEN #USAR #MSTU
📌 When trading, pay attention to whether the candlestick pattern aligns
$ZEN $USAR $MSTU 30-minute 4-hour double bearish signal🔥
════════════════════
🟢 $ZEN 30-minute bearish signal
⚠️Technical analysis: 4-hour bearish trend + 30-minute confluence confirmation; MACD bearish crossover with accelerating volume; moving averages bearishly aligned and diverging downward; trading volume doubled
════════════════════
🟢 $USAR 30-minute bearish signal
⚠️Technical analysis: 4-hour bullish trend + daily bullish confluence confirmation; 30-minute MACD bullish crossover with rising volume and red bars continuing to grow; moving averages bullishly aligned and diverging upward; KDJ K crossed above D and has not entered the overbought zone
════════════════════
🟢 $MSTU 30-minute bearish signal
⚠️Technical analysis: 4-hour bearish trend + 30-minute confluence confirmation: MACD bearish crossover broke below the zero line on rising volume; moving averages bearishly aligned and moving downward; KDJ K crossed below D but is not oversold; volume increased 3.4 times
════════════════════
🔔 Follow to get first-hand market updates 🔔
#多周期共振 #ZEN #USAR #MSTU
📌 When trading, pay attention to whether the candlestick pattern aligns
════════════════════
🟢 $ZEN 30-minute bearish signal
⚠️Technical analysis: 4-hour bearish trend + 30-minute confluence confirmation; MACD bearish crossover with accelerating volume; moving averages bearishly aligned and diverging downward; trading volume doubled
════════════════════
🟢 $USAR 30-minute bearish signal
⚠️Technical analysis: 4-hour bullish trend + daily bullish confluence confirmation; 30-minute MACD bullish crossover with rising volume and red bars continuing to grow; moving averages bullishly aligned and diverging upward; KDJ K crossed above D and has not entered the overbought zone
════════════════════
🟢 $MSTU 30-minute bearish signal
⚠️Technical analysis: 4-hour bearish trend + 30-minute confluence confirmation: MACD bearish crossover broke below the zero line on rising volume; moving averages bearishly aligned and moving downward; KDJ K crossed below D but is not oversold; volume increased 3.4 times
════════════════════
🔔 Follow to get first-hand market updates 🔔
#多周期共振 #ZEN #USAR #MSTU
📌 When trading, pay attention to whether the candlestick pattern aligns
46
Log in to explore more content
Join global crypto users on Binance Square
⚡️ Get latest and useful information about crypto.
💬 Trusted by the world’s largest crypto exchange.
👍 Discover real insights from verified creators.
Email / Phone number
Trending Topics
1
#CanBTCReboundAfterFallingBelow60K?
103,144 views
491 Discussing
2
#GlobalStocksFaceLongestLosingStreakSince2023
48,293 views
491 Discussing
3
#AnthropicPlungesTowardIPOPriceonDay2
15,582 views
195 Discussing
4
#GaoTengBitcoinETFListsOnHKEX
35,629 views
386 Discussing
5
#TradFiForBeginners
1M views
5,806 Discussing
6
#NvidiaBoardReportedlySplitOverHuang’sReturn
395,190 views
2,574 Discussing
7
#TetherBurns8BillionUSDTInPast20Days
40,741 views
155 Discussing
8
#BitcoinWalletSignatureFlawExploitableWithinSeconds
11,657 views
74 Discussing
9
#CanGTA6'sLaunchLiftTTWOShares?
331,964 views
1,802 Discussing
10
#HongKongProposesSFCLicensingForFourVirtualAssetServices
2,100 views
36 Discussing