
#avgo
avgo
59,850 views
1,102 Discussing
Hot
Latest

·
--
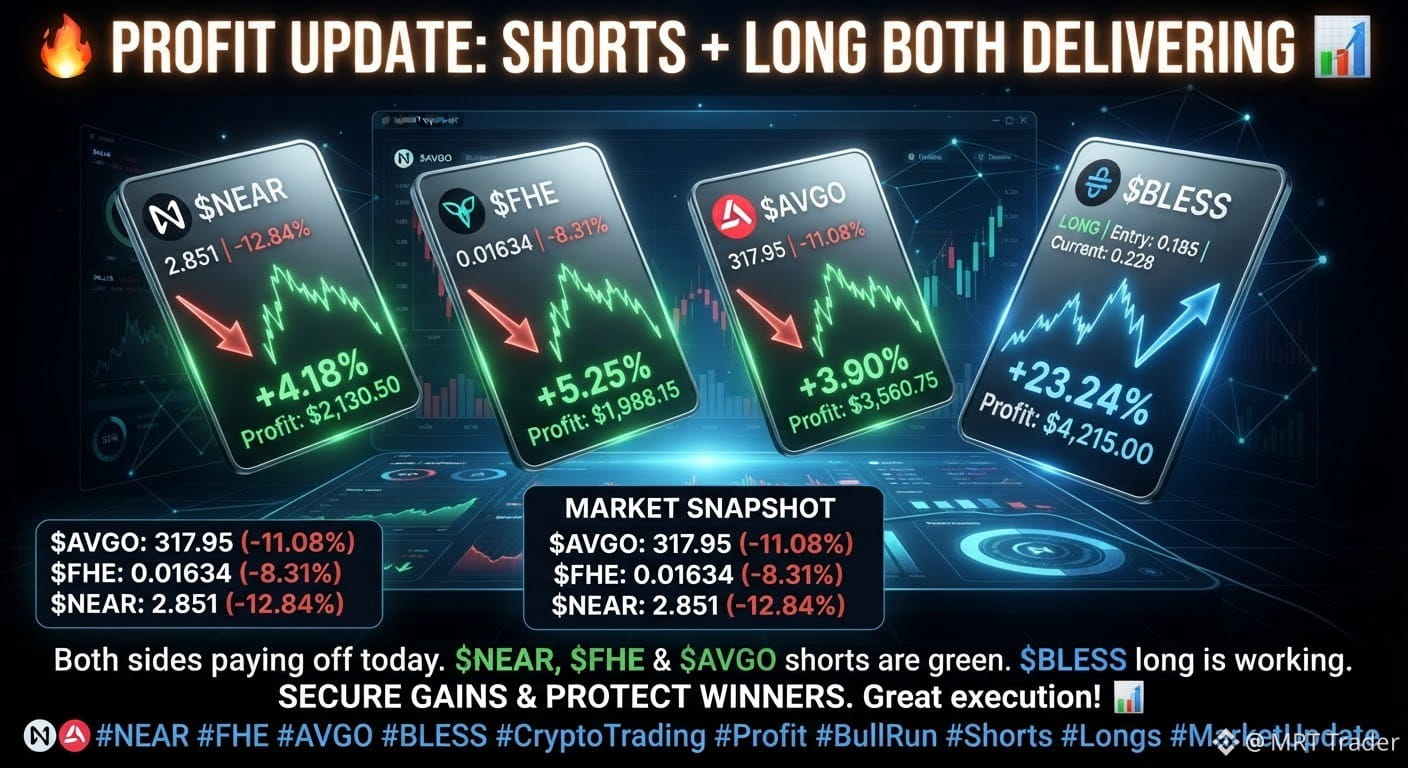
🔥 Profit Update: Shorts + Long Both Delivering 📊
Both sides of the book are paying off today. $NEAR , $FHE and $AVGO shorts are in the green, and the $BLESS long is working too. 💰
If you're sitting in profit, this is a smart area to secure some gains and protect your winners. Great execution by the team. 🙌
Market Snapshot
$AVGO: 317.95 (-11.08%)
$FHE: 0.01634 (-8.31%)
$NEAR: 2.851 (-12.84%)
#NEAR #FHE #AVGO #BLESS
🔥 Profit Update: Shorts + Long Both Delivering 📊
Both sides of the book are paying off today. $NEAR , $FHE and $AVGO shorts are in the green, and the $BLESS long is working too. 💰
If you're sitting in profit, this is a smart area to secure some gains and protect your winners. Great execution by the team. 🙌
Market Snapshot
$AVGO : 317.95 (-11.08%)
$FHE : 0.01634 (-8.31%)
$NEAR : 2.851 (-12.84%)
#NEAR #FHE #AVGO #BLESS
Both sides of the book are paying off today. $NEAR , $FHE and $AVGO shorts are in the green, and the $BLESS long is working too. 💰
If you're sitting in profit, this is a smart area to secure some gains and protect your winners. Great execution by the team. 🙌
Market Snapshot
$AVGO : 317.95 (-11.08%)
$FHE : 0.01634 (-8.31%)
$NEAR : 2.851 (-12.84%)
#NEAR #FHE #AVGO #BLESS
2
26

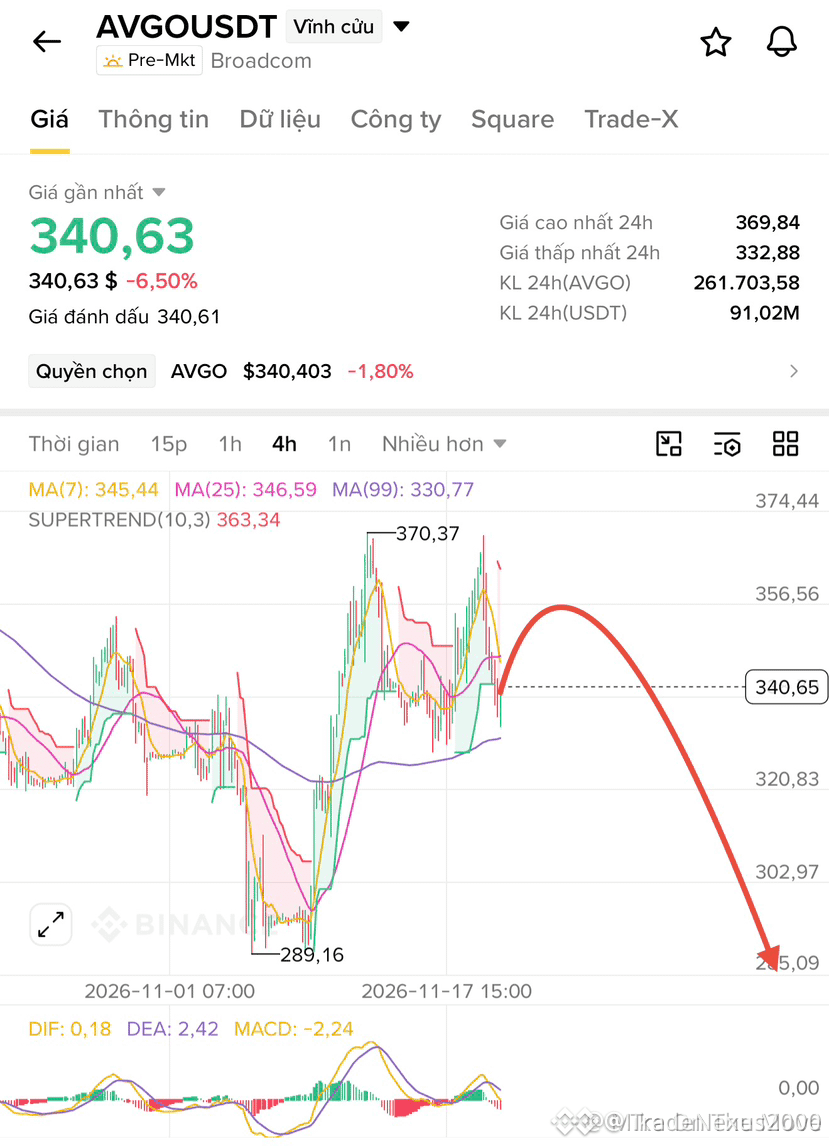
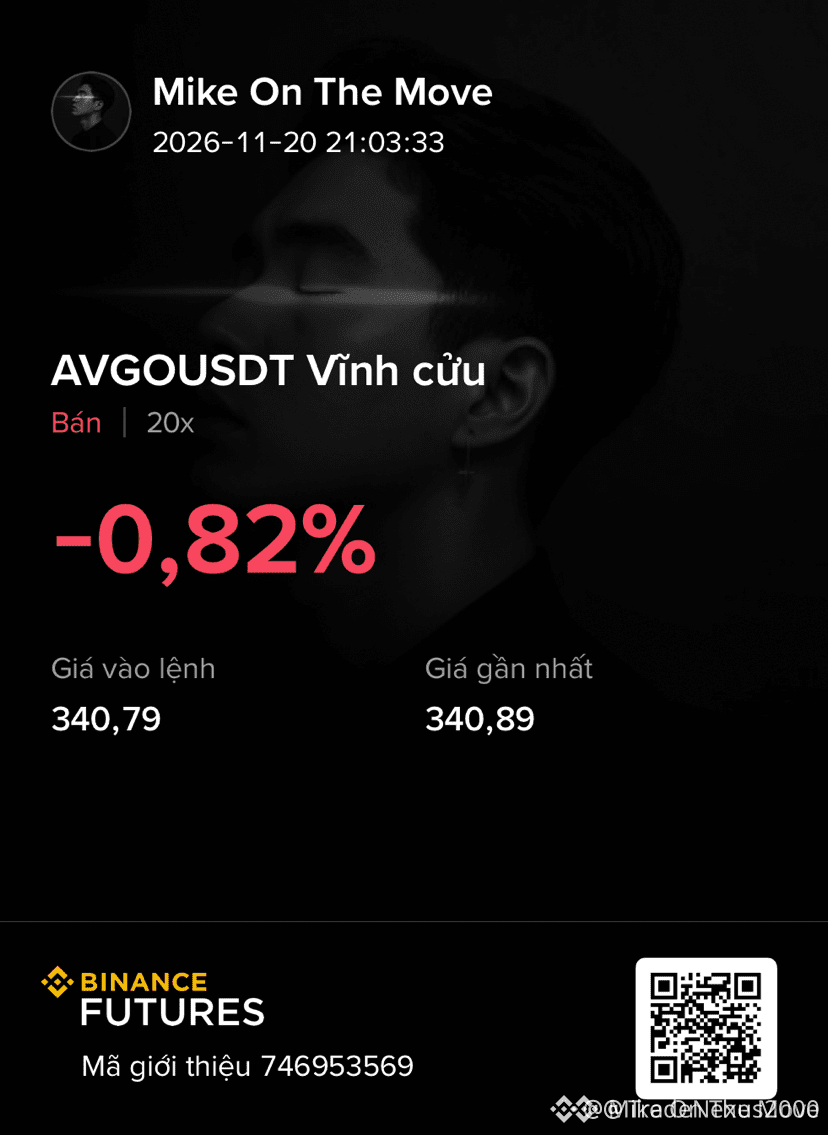
🚨 $AVGO PRESSING INTO INSTITUTIONAL SUPPLY WITH BEARISH MOMENTUM BUILDING! 📉
Entry: 338 – 344 ⚡
Target: 329, 320, 313 🚀
Stop Loss: 370 ⚠️
Smart money is currently distribution-heavy as price probes the 338 to 344 mitigation block. 📊 Order flow shows aggressive sell-side pressure absorbing retail bids near resistance, leaving a trail of unmitigated fair value gaps below. 🔍
This distribution imbalance creates a clean structural path toward our lower liquidity targets as sellers take control of the tape. ⚡ Are you positioning for this downward expansion or waiting for a deeper sweep? 👇
⚠️ Not financial advice. Always manage your risk. 🛡️
🏷️ #AVGO #ShortSetup #MarketStructure #OrderFlow
🐻 📉
🚨 $AVGO PRESSING INTO INSTITUTIONAL SUPPLY WITH BEARISH MOMENTUM BUILDING! 📉
Entry: 338 – 344 ⚡
Target: 329, 320, 313 🚀
Stop Loss: 370 ⚠️
Smart money is currently distribution-heavy as price probes the 338 to 344 mitigation block. 📊 Order flow shows aggressive sell-side pressure absorbing retail bids near resistance, leaving a trail of unmitigated fair value gaps below. 🔍
This distribution imbalance creates a clean structural path toward our lower liquidity targets as sellers take control of the tape. ⚡ Are you positioning for this downward expansion or waiting for a deeper sweep? 👇
⚠️ Not financial advice. Always manage your risk. 🛡️
🏷️ #AVGO #ShortSetup #MarketStructure #OrderFlow
🐻 📉
Entry: 338 – 344 ⚡
Target: 329, 320, 313 🚀
Stop Loss: 370 ⚠️
Smart money is currently distribution-heavy as price probes the 338 to 344 mitigation block. 📊 Order flow shows aggressive sell-side pressure absorbing retail bids near resistance, leaving a trail of unmitigated fair value gaps below. 🔍
This distribution imbalance creates a clean structural path toward our lower liquidity targets as sellers take control of the tape. ⚡ Are you positioning for this downward expansion or waiting for a deeper sweep? 👇
⚠️ Not financial advice. Always manage your risk. 🛡️
🏷️ #AVGO #ShortSetup #MarketStructure #OrderFlow
🐻 📉
2

·
--
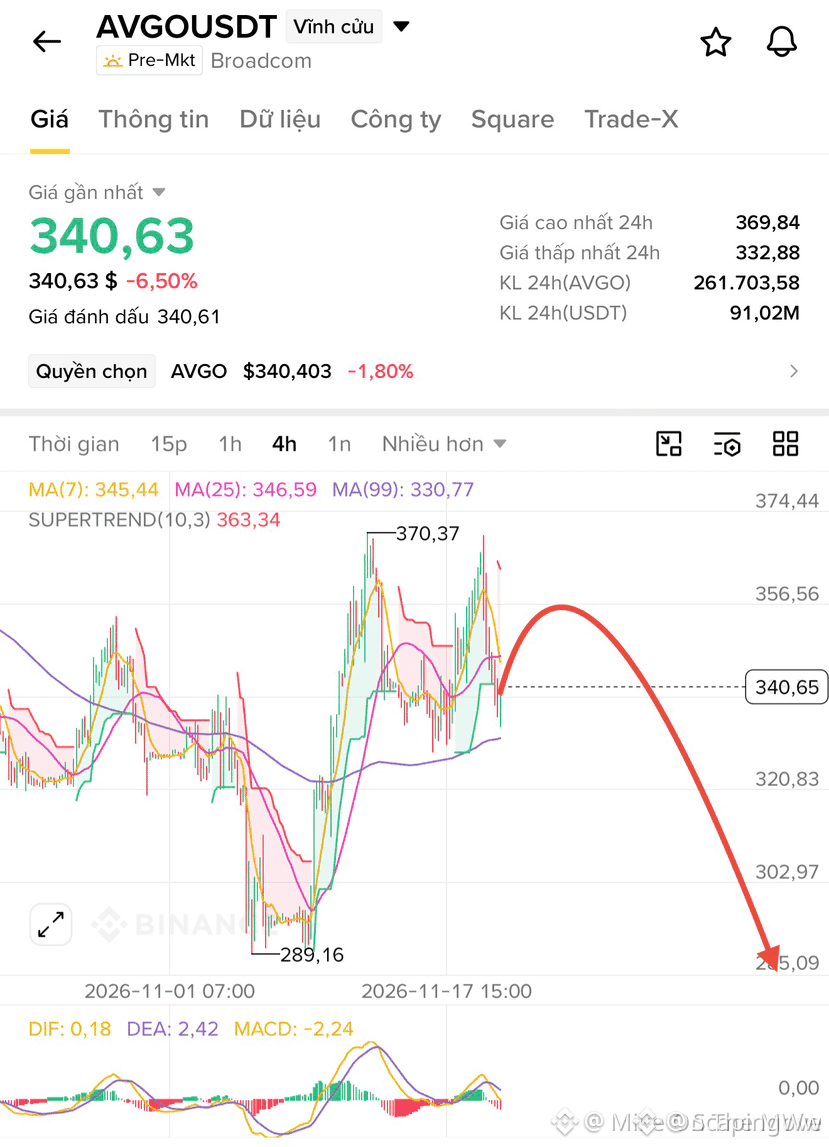
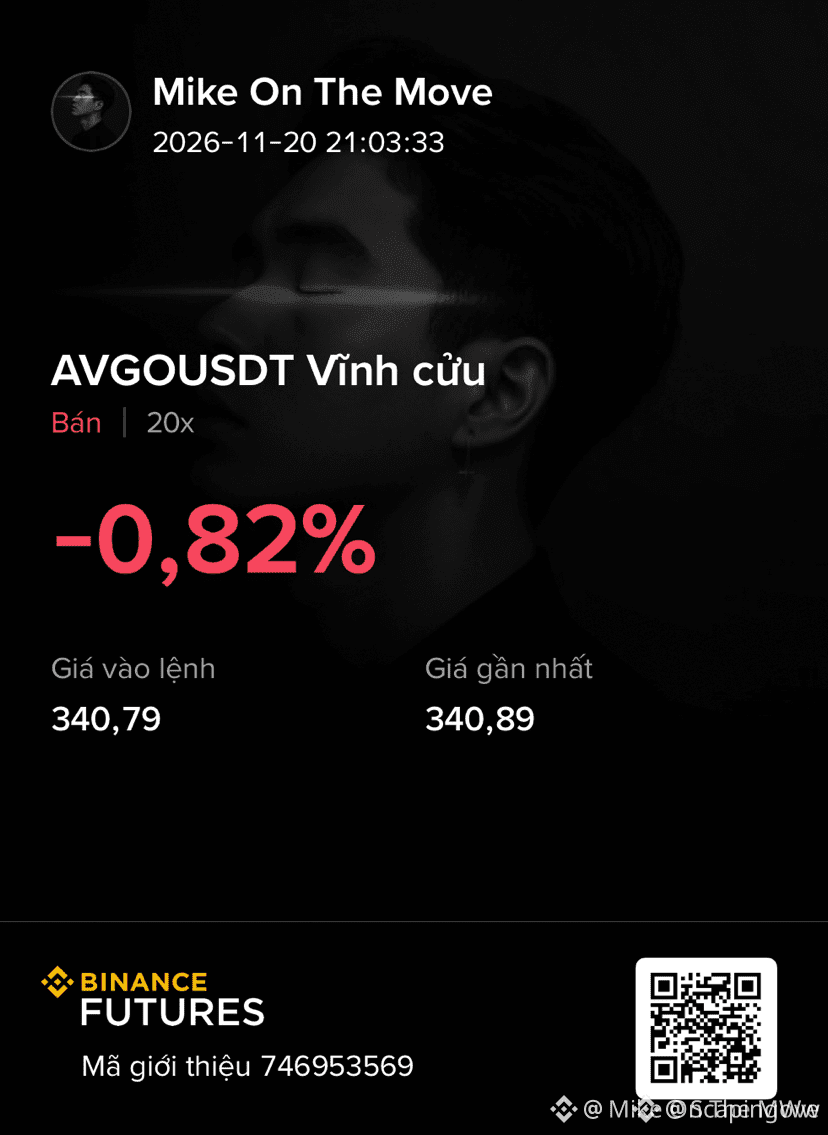
🔴 $AVGO BEARING DOWN ON RESISTANCE AS SELLERS PREPARE FOR A SHARP PULLBACK 📉
Entry: 338 – 344 ⚡
Target: 329 🚀
Stop Loss: 370 ⚠️
Bears are stepping into the upper supply band as momentum stalls out around the 344 threshold. 📊 Volume profiles show heavy distribution building right beneath resistance.
This localized rejection sets up a clean descent toward lower liquidity pools. ⚡ Managing your risk above the structural invalidation level keeps your downside completely protected.
💬 Are you shorting this resistance block or waiting for a deeper flush? 👇
⚠️ Not financial advice. Always manage your risk. 🛡️
🏷️ #AVGO #ShortSetup #Trading #Crypto
🔴 📉
🔴 $AVGO BEARING DOWN ON RESISTANCE AS SELLERS PREPARE FOR A SHARP PULLBACK 📉
Entry: 338 – 344 ⚡
Target: 329 🚀
Stop Loss: 370 ⚠️
Bears are stepping into the upper supply band as momentum stalls out around the 344 threshold. 📊 Volume profiles show heavy distribution building right beneath resistance.
This localized rejection sets up a clean descent toward lower liquidity pools. ⚡ Managing your risk above the structural invalidation level keeps your downside completely protected.
💬 Are you shorting this resistance block or waiting for a deeper flush? 👇
⚠️ Not financial advice. Always manage your risk. 🛡️
🏷️ #AVGO #ShortSetup #Trading #Crypto
🔴 📉
Entry: 338 – 344 ⚡
Target: 329 🚀
Stop Loss: 370 ⚠️
Bears are stepping into the upper supply band as momentum stalls out around the 344 threshold. 📊 Volume profiles show heavy distribution building right beneath resistance.
This localized rejection sets up a clean descent toward lower liquidity pools. ⚡ Managing your risk above the structural invalidation level keeps your downside completely protected.
💬 Are you shorting this resistance block or waiting for a deeper flush? 👇
⚠️ Not financial advice. Always manage your risk. 🛡️
🏷️ #AVGO #ShortSetup #Trading #Crypto
🔴 📉
21
·
--
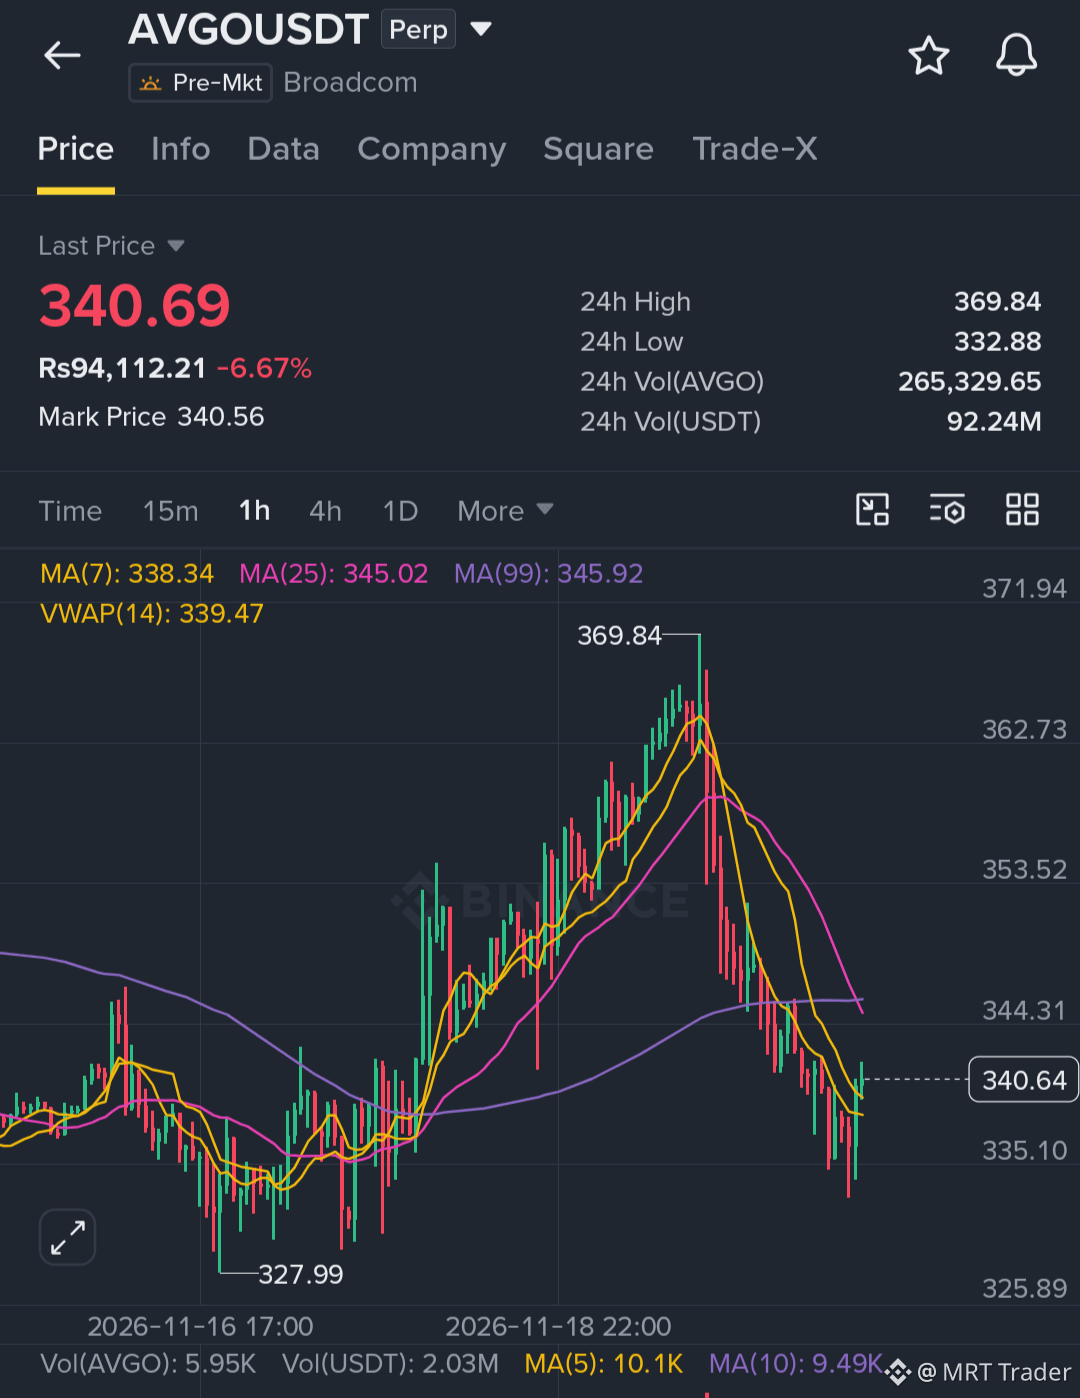
$AVGO is losing ground, and a pullback from here could open the door to a clean short. 👀
Key Level
🔴 Bearish below $327
Trade Setup (Short)
🔴 Entry Zone: $339 – $345
🎯 Targets: $329.50 / $320.50 / $313.50
⛔ Stop Loss: $369
Stay patient, wait for rejection near the entry zone, and always manage your risk.
Click here to sell now 👉 $AVGO
{future}(AVGOUSDT)
#AVGO #TradFiForBeginners
$AVGO is losing ground, and a pullback from here could open the door to a clean short. 👀
Key Level
🔴 Bearish below $327
Trade Setup (Short)
🔴 Entry Zone: $339 – $345
🎯 Targets: $329.50 / $320.50 / $313.50
⛔ Stop Loss: $369
Stay patient, wait for rejection near the entry zone, and always manage your risk.
Click here to sell now 👉 $AVGO
#AVGO #TradFiForBeginners
Key Level
🔴 Bearish below $327
Trade Setup (Short)
🔴 Entry Zone: $339 – $345
🎯 Targets: $329.50 / $320.50 / $313.50
⛔ Stop Loss: $369
Stay patient, wait for rejection near the entry zone, and always manage your risk.
Click here to sell now 👉 $AVGO
#AVGO #TradFiForBeginners
3
85

·
--
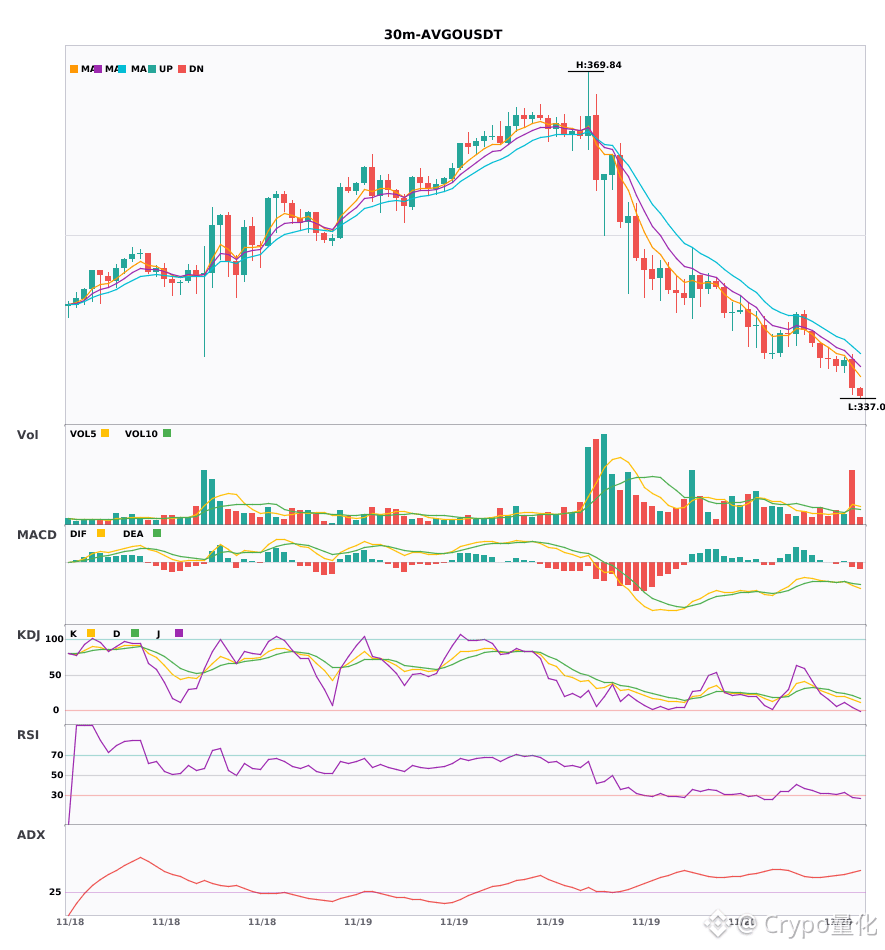
The 30-minute chart is about to drop: $PLTR $MSFT $AVGO short warning🔥
════════════════════
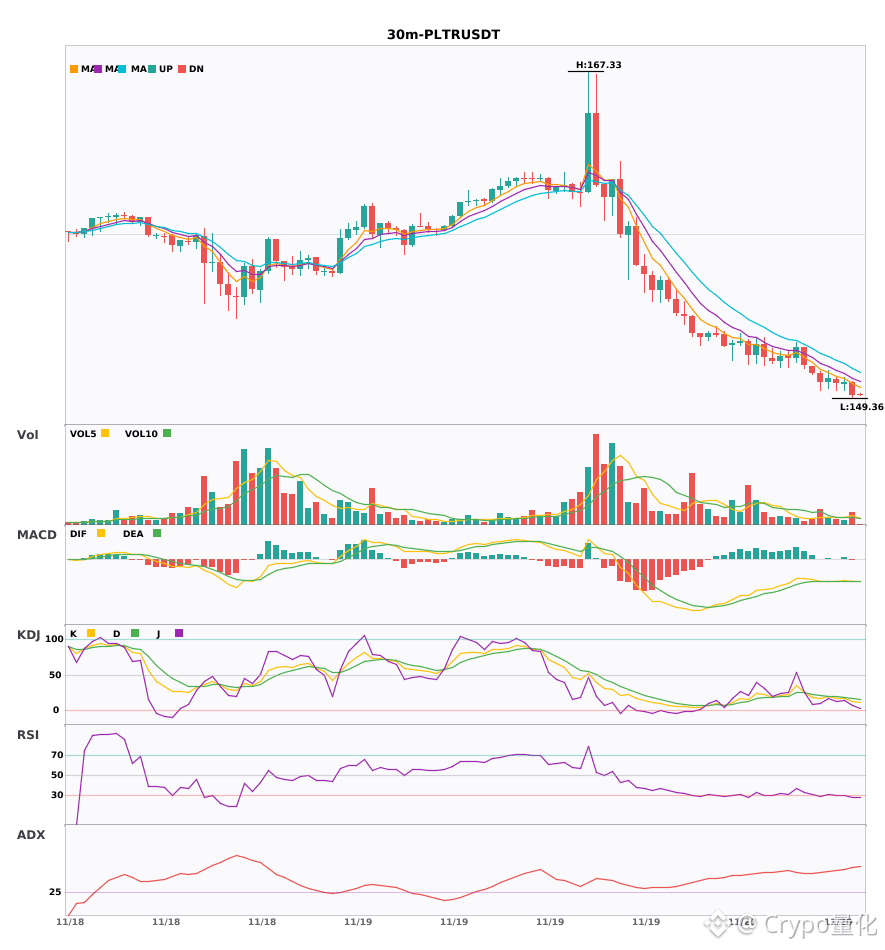
🟢 $PLTR 30-minute short signal
⚠️Technical analysis: ADX shows an extremely strong trend, but beware of an overbought pullback; MACD bearish crossover below zero, accelerating the decline; EMA bearish alignment; KDJ oversold (K13.5 D17), watch for a rebound; volume up 1.6x.
════════════════════
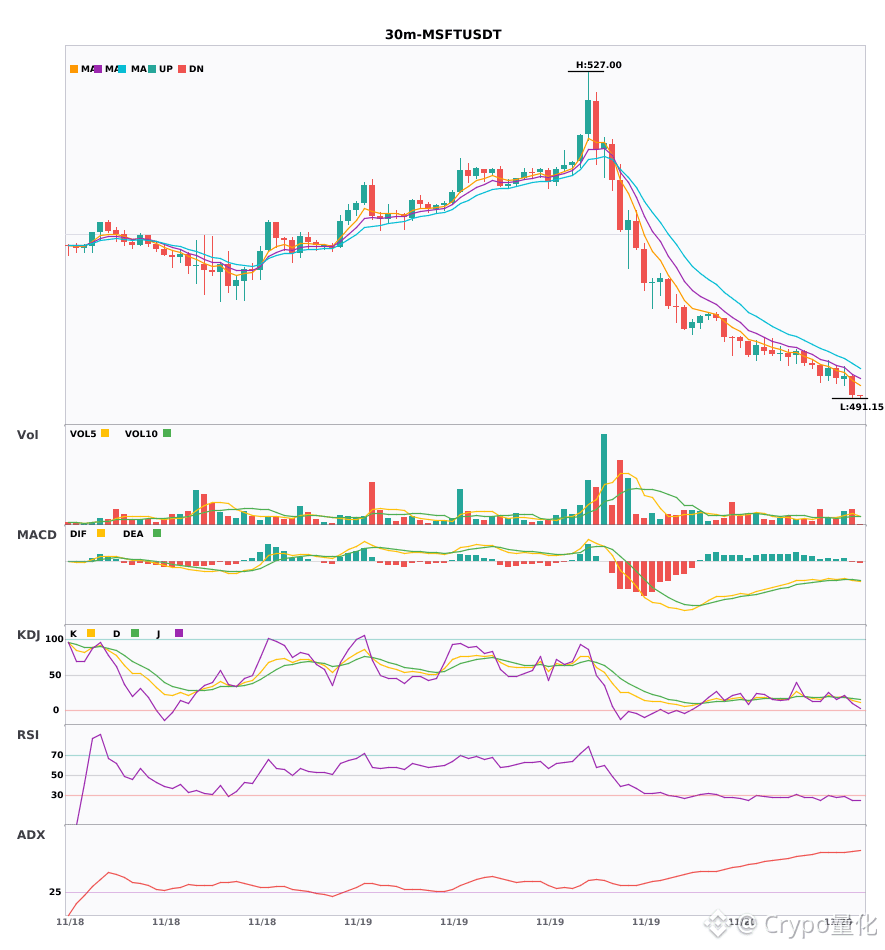
🟢 $MSFT 30-minute short signal
⚠️Technical analysis: ADX 73, extremely strong trend—beware of an overbought pullback; MACD bearish crossover below zero on rising volume, with selling pressure accelerating; moving averages aligned bearishly and pointing down; KDJ bearish crossover but already in oversold territory; volume up 1.8x.
════════════════════
🟢 $AVGO 30-minute short signal
⚠️Technical analysis: Exceptionally strong trend (47)—beware of an overheated pullback|MACD bearish crossover below zero, bearish momentum accelerating|Moving averages aligned bearishly|KDJ weak, K below D|Volume up 3.3x
════════════════════
🔔 Follow for first-hand market alerts 🔔
#技术分析 #PLTR #MSFT #AVGO
📌 When trading, check whether the candlestick pattern confirms the signal
The 30-minute chart is about to drop: $PLTR $MSFT $AVGO short warning🔥
════════════════════
🟢 $PLTR 30-minute short signal
⚠️Technical analysis: ADX shows an extremely strong trend, but beware of an overbought pullback; MACD bearish crossover below zero, accelerating the decline; EMA bearish alignment; KDJ oversold (K13.5 D17), watch for a rebound; volume up 1.6x.
════════════════════
🟢 $MSFT 30-minute short signal
⚠️Technical analysis: ADX 73, extremely strong trend—beware of an overbought pullback; MACD bearish crossover below zero on rising volume, with selling pressure accelerating; moving averages aligned bearishly and pointing down; KDJ bearish crossover but already in oversold territory; volume up 1.8x.
════════════════════
🟢 $AVGO 30-minute short signal
⚠️Technical analysis: Exceptionally strong trend (47)—beware of an overheated pullback|MACD bearish crossover below zero, bearish momentum accelerating|Moving averages aligned bearishly|KDJ weak, K below D|Volume up 3.3x
════════════════════
🔔 Follow for first-hand market alerts 🔔
#技术分析 #PLTR #MSFT #AVGO
📌 When trading, check whether the candlestick pattern confirms the signal
════════════════════
🟢 $PLTR 30-minute short signal
⚠️Technical analysis: ADX shows an extremely strong trend, but beware of an overbought pullback; MACD bearish crossover below zero, accelerating the decline; EMA bearish alignment; KDJ oversold (K13.5 D17), watch for a rebound; volume up 1.6x.
════════════════════
🟢 $MSFT 30-minute short signal
⚠️Technical analysis: ADX 73, extremely strong trend—beware of an overbought pullback; MACD bearish crossover below zero on rising volume, with selling pressure accelerating; moving averages aligned bearishly and pointing down; KDJ bearish crossover but already in oversold territory; volume up 1.8x.
════════════════════
🟢 $AVGO 30-minute short signal
⚠️Technical analysis: Exceptionally strong trend (47)—beware of an overheated pullback|MACD bearish crossover below zero, bearish momentum accelerating|Moving averages aligned bearishly|KDJ weak, K below D|Volume up 3.3x
════════════════════
🔔 Follow for first-hand market alerts 🔔
#技术分析 #PLTR #MSFT #AVGO
📌 When trading, check whether the candlestick pattern confirms the signal
5

·
--
📉 AVGOB short-term outlook is bearish; 340 USDT is the first key level
The November 20 market snapshot shows Binance spot AVGOBUSDT retreating from an intraday high of 369.39 to 343.39 USDT, down 3.54% over 24 hours, with approximately $2 million in trading volume. Trading snapshot (https://beforepump.com/coin/) · Intraday range (https://www.cexscan.com/coin-summary?symbol=AVGOB)
Broadcom shares (AVGO) surged and then retreated on Thursday, closing at $346.65, down 2.09%, and continued to fall in after-hours trading. Anthropic rose on its first day as a public company, while the Philadelphia Semiconductor Index fell 2.41% over the same period, putting pressure on the sector. Broadcom quote (https://finance.yahoo.com/quote/AVGO/) · Philadelphia Semiconductor Index (https://indexes.nasdaqomx.com/Index/History/SOX) · First day of trading (https://apnews.com/article/c4c3f4878b12989347f8a930ed813dad)
Over the next 4–24 hours, AVGOB is more likely to first retest 340–342 USDT. A break below 340 could accelerate the decline. The first rebound target is 347–349 USDT; the short-term bearish outlook would be invalidated if chip stocks rebound together after the U.S. market opens and the token’s hourly candle closes and holds above 349.
#AVGOB #AVGO #半导体 #Tokenized U.S. stocks
📉 AVGOB short-term outlook is bearish; 340 USDT is the first key level
The November 20 market snapshot shows Binance spot AVGOBUSDT retreating from an intraday high of 369.39 to 343.39 USDT, down 3.54% over 24 hours, with approximately $2 million in trading volume. Trading snapshot (https://beforepump.com/coin/) · Intraday range (https://www.cexscan.com/coin-summary?symbol=AVGOB)
Broadcom shares (AVGO) surged and then retreated on Thursday, closing at $346.65, down 2.09%, and continued to fall in after-hours trading. Anthropic rose on its first day as a public company, while the Philadelphia Semiconductor Index fell 2.41% over the same period, putting pressure on the sector. Broadcom quote (https://finance.yahoo.com/quote/AVGO/) · Philadelphia Semiconductor Index (https://indexes.nasdaqomx.com/Index/History/SOX) · First day of trading (https://apnews.com/article/c4c3f4878b12989347f8a930ed813dad)
Over the next 4–24 hours, AVGOB is more likely to first retest 340–342 USDT. A break below 340 could accelerate the decline. The first rebound target is 347–349 USDT; the short-term bearish outlook would be invalidated if chip stocks rebound together after the U.S. market opens and the token’s hourly candle closes and holds above 349.
#AVGOB #AVGO #半导体 #Tokenized U.S. stocks
The November 20 market snapshot shows Binance spot AVGOBUSDT retreating from an intraday high of 369.39 to 343.39 USDT, down 3.54% over 24 hours, with approximately $2 million in trading volume. Trading snapshot (https://beforepump.com/coin/) · Intraday range (https://www.cexscan.com/coin-summary?symbol=AVGOB)
Broadcom shares (AVGO) surged and then retreated on Thursday, closing at $346.65, down 2.09%, and continued to fall in after-hours trading. Anthropic rose on its first day as a public company, while the Philadelphia Semiconductor Index fell 2.41% over the same period, putting pressure on the sector. Broadcom quote (https://finance.yahoo.com/quote/AVGO/) · Philadelphia Semiconductor Index (https://indexes.nasdaqomx.com/Index/History/SOX) · First day of trading (https://apnews.com/article/c4c3f4878b12989347f8a930ed813dad)
Over the next 4–24 hours, AVGOB is more likely to first retest 340–342 USDT. A break below 340 could accelerate the decline. The first rebound target is 347–349 USDT; the short-term bearish outlook would be invalidated if chip stocks rebound together after the U.S. market opens and the token’s hourly candle closes and holds above 349.
#AVGOB #AVGO #半导体 #Tokenized U.S. stocks

·
--
🚀 $AVGO LONG 🚀
Entry: 345.64 – 347.72
SL: 338.37
TP1: 353.80
TP2: 358.55
TP3: 364.49
📈 Technical Outlook:
$AVGO is showing strong bullish momentum after confirming strength near a key technical zone. The setup is supported by EMA trend is bullish, price is breaking above recent resistance, RSI supports bullish momentum. As long as price holds above the entry area, buyers may continue pushing toward the listed targets.
#AVGO #Crypto #BinanceSquare #Trading
🚀 $AVGO LONG 🚀
Entry: 345.64 – 347.72
SL: 338.37
TP1: 353.80
TP2: 358.55
TP3: 364.49
📈 Technical Outlook:
$AVGO is showing strong bullish momentum after confirming strength near a key technical zone. The setup is supported by EMA trend is bullish, price is breaking above recent resistance, RSI supports bullish momentum. As long as price holds above the entry area, buyers may continue pushing toward the listed targets.
#AVGO #Crypto #BinanceSquare #Trading
Entry: 345.64 – 347.72
SL: 338.37
TP1: 353.80
TP2: 358.55
TP3: 364.49
📈 Technical Outlook:
$AVGO is showing strong bullish momentum after confirming strength near a key technical zone. The setup is supported by EMA trend is bullish, price is breaking above recent resistance, RSI supports bullish momentum. As long as price holds above the entry area, buyers may continue pushing toward the listed targets.
#AVGO #Crypto #BinanceSquare #Trading

1

·
--
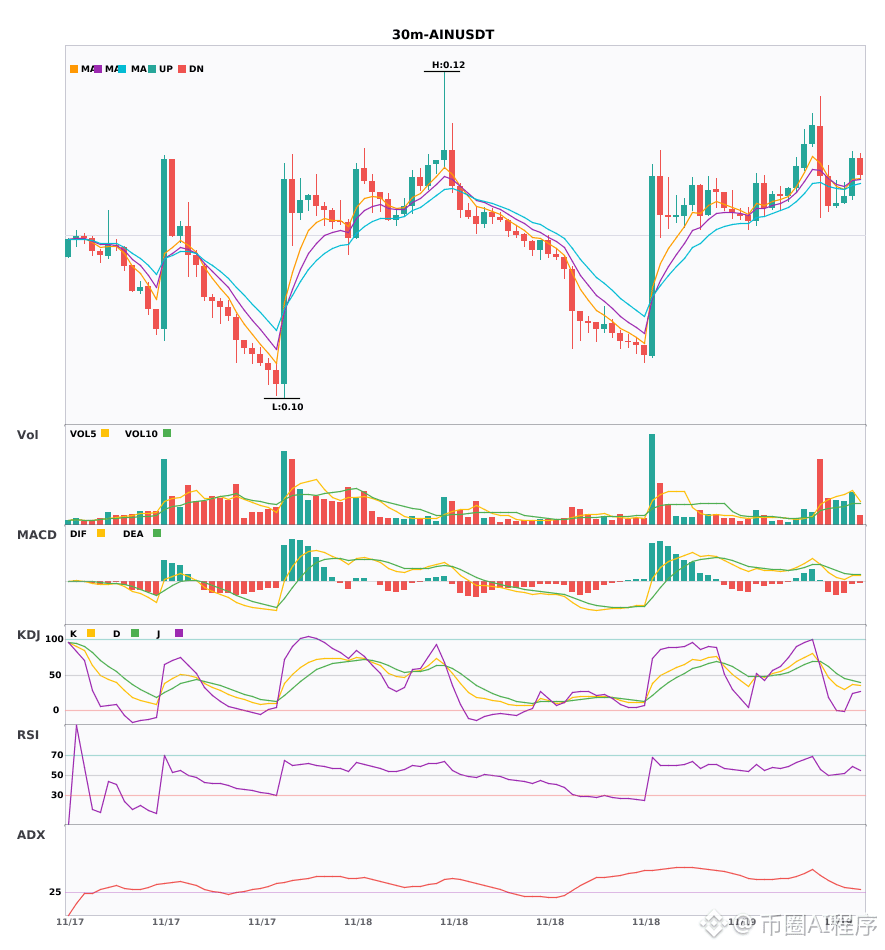
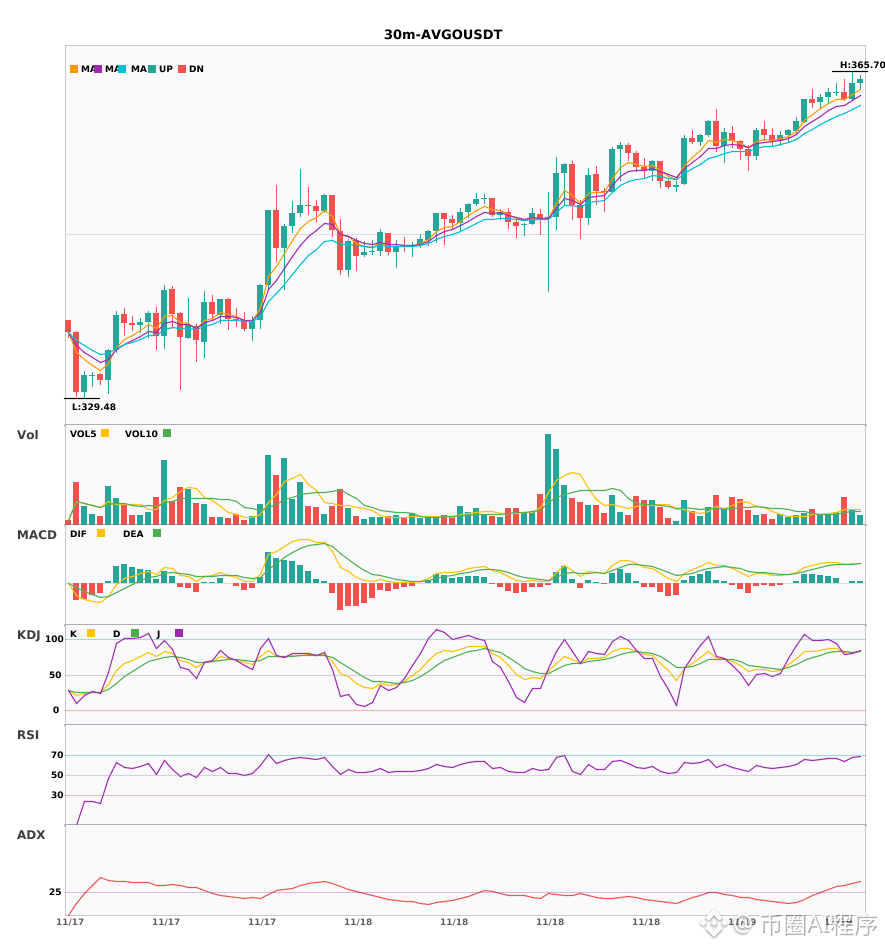
$AIN / $AVGO 30-minute bullish signal, 4-hour bullish trend confirmed 🔥
════════════════════
🔴 $AIN 30-minute bullish signal
⚠️ Technical analysis: 4-hour bullish trend + 30-minute entry, confirmed by multi-timeframe confluence! EMA5 has just crossed above EMA8, signaling a short-term bullish turn. KDJ has not yet formed a golden cross, so bears remain in control. Trading volume is up 1.5x.
════════════════════
🔴 $AVGO 30-minute bullish signal
⚠️ Technical analysis: Multi-timeframe confluence on the 4-hour and 30-minute charts! The 30-minute MACD has formed a golden cross above zero with rising volume. Moving averages are in a bullish alignment and trending upward. KDJ is entering overbought territory, so watch for a pullback. Trading volume is up 2.3x.
════════════════════
🔔 Follow us for the latest market movements 🔔
#多周期共振 #AIN #AVGO
📌 When trading, watch for confirmation from the candlestick pattern.
$AIN / $AVGO 30-minute bullish signal, 4-hour bullish trend confirmed 🔥
════════════════════
🔴 $AIN 30-minute bullish signal
⚠️ Technical analysis: 4-hour bullish trend + 30-minute entry, confirmed by multi-timeframe confluence! EMA5 has just crossed above EMA8, signaling a short-term bullish turn. KDJ has not yet formed a golden cross, so bears remain in control. Trading volume is up 1.5x.
════════════════════
🔴 $AVGO 30-minute bullish signal
⚠️ Technical analysis: Multi-timeframe confluence on the 4-hour and 30-minute charts! The 30-minute MACD has formed a golden cross above zero with rising volume. Moving averages are in a bullish alignment and trending upward. KDJ is entering overbought territory, so watch for a pullback. Trading volume is up 2.3x.
════════════════════
🔔 Follow us for the latest market movements 🔔
#多周期共振 #AIN #AVGO
📌 When trading, watch for confirmation from the candlestick pattern.
════════════════════
🔴 $AIN 30-minute bullish signal
⚠️ Technical analysis: 4-hour bullish trend + 30-minute entry, confirmed by multi-timeframe confluence! EMA5 has just crossed above EMA8, signaling a short-term bullish turn. KDJ has not yet formed a golden cross, so bears remain in control. Trading volume is up 1.5x.
════════════════════
🔴 $AVGO 30-minute bullish signal
⚠️ Technical analysis: Multi-timeframe confluence on the 4-hour and 30-minute charts! The 30-minute MACD has formed a golden cross above zero with rising volume. Moving averages are in a bullish alignment and trending upward. KDJ is entering overbought territory, so watch for a pullback. Trading volume is up 2.3x.
════════════════════
🔔 Follow us for the latest market movements 🔔
#多周期共振 #AIN #AVGO
📌 When trading, watch for confirmation from the candlestick pattern.
29
·
--
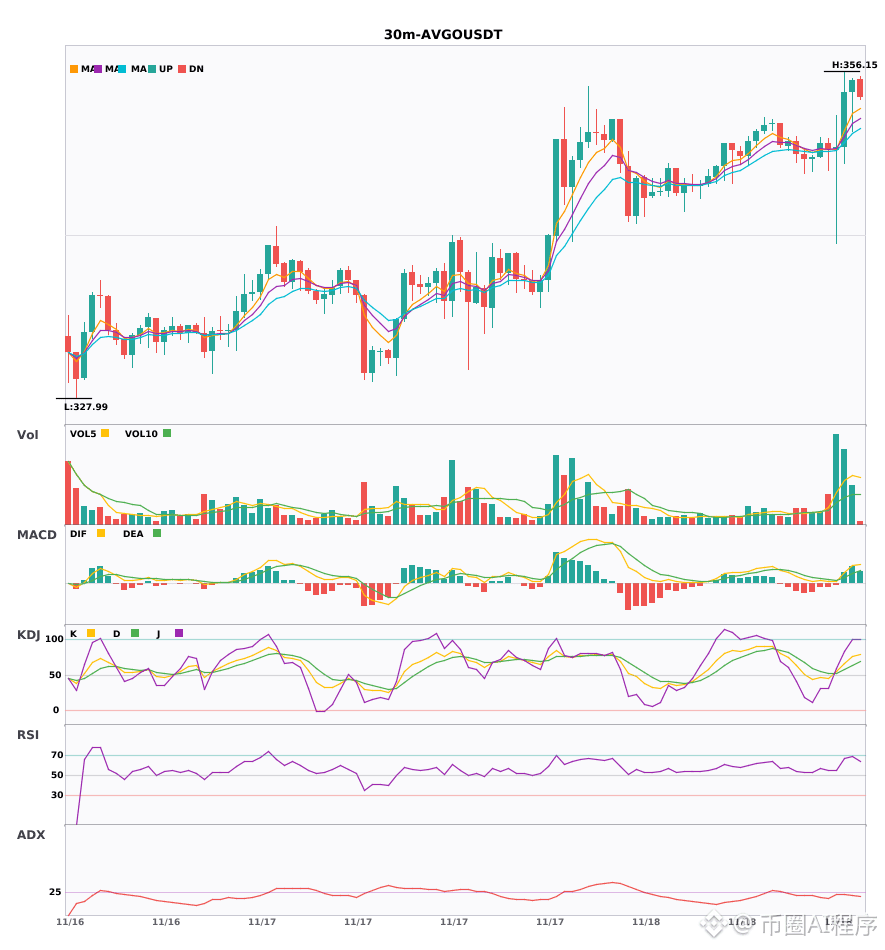
$AVGO 30-minute bullish alignment is expanding; the 4-hour trend is confirmed 🔥
════════════════════
🔴 $AVGO 30-minute bullish signal
⚠️ Technical analysis: 4-hour and 30-minute timeframes are in confluence! The 30-minute MACD has formed a bullish golden cross on increased volume, with the histogram bars growing. EMA5 has just crossed above EMA8, forming a bullish alignment. KDJ's K line has crossed above D without entering overbought territory. Trading volume has surged to 4.1x, confirming the same bullish direction on the 4-hour timeframe.
════════════════════
🔔 Follow for first-hand market movement updates 🔔
#多周期共振 #AVGO
📌 When trading, pay attention to whether the candlestick pattern confirms the signal
$AVGO 30-minute bullish alignment is expanding; the 4-hour trend is confirmed 🔥
════════════════════
🔴 $AVGO 30-minute bullish signal
⚠️ Technical analysis: 4-hour and 30-minute timeframes are in confluence! The 30-minute MACD has formed a bullish golden cross on increased volume, with the histogram bars growing. EMA5 has just crossed above EMA8, forming a bullish alignment. KDJ's K line has crossed above D without entering overbought territory. Trading volume has surged to 4.1x, confirming the same bullish direction on the 4-hour timeframe.
════════════════════
🔔 Follow for first-hand market movement updates 🔔
#多周期共振 #AVGO
📌 When trading, pay attention to whether the candlestick pattern confirms the signal
════════════════════
🔴 $AVGO 30-minute bullish signal
⚠️ Technical analysis: 4-hour and 30-minute timeframes are in confluence! The 30-minute MACD has formed a bullish golden cross on increased volume, with the histogram bars growing. EMA5 has just crossed above EMA8, forming a bullish alignment. KDJ's K line has crossed above D without entering overbought territory. Trading volume has surged to 4.1x, confirming the same bullish direction on the 4-hour timeframe.
════════════════════
🔔 Follow for first-hand market movement updates 🔔
#多周期共振 #AVGO
📌 When trading, pay attention to whether the candlestick pattern confirms the signal
3

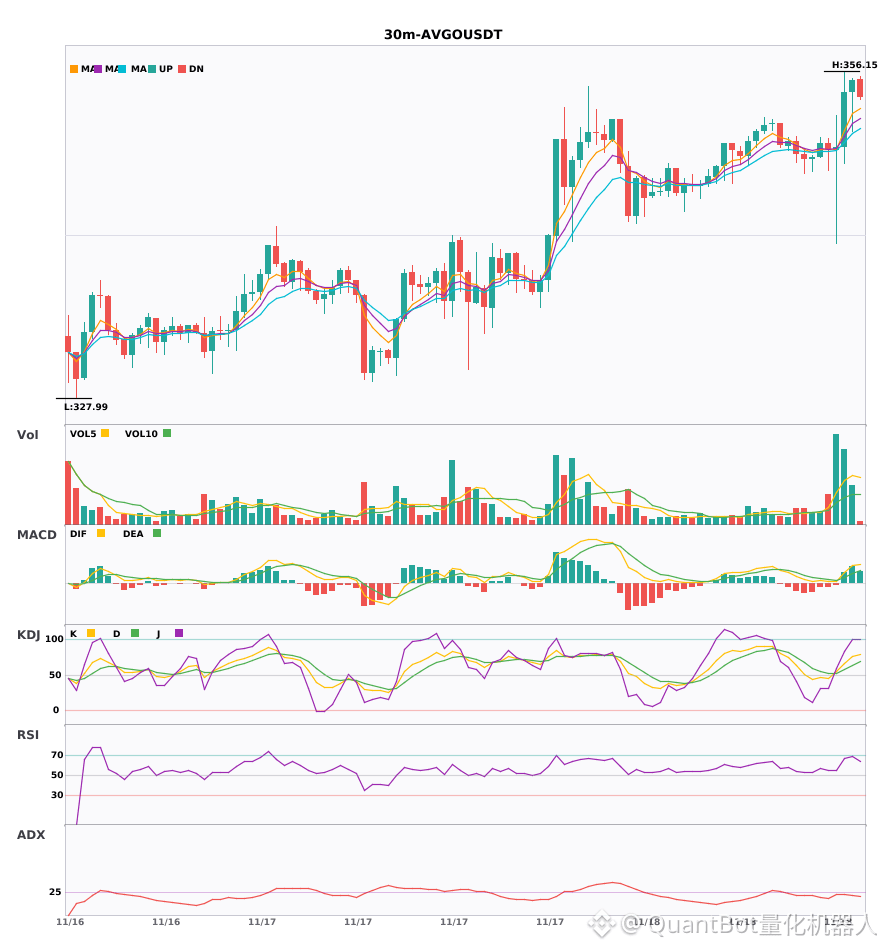
$AVGO 30-minute bullish signal confirmed by indicators
📈 $AVGO | 30-minute bullish signal
━━━━━━━━━━━━━━━━━━
Technical analysis: ADX (25) indicates an established trend; MACD has formed a golden cross above the zero line, strengthening bullish momentum; EMA5 has crossed above EMA8, signaling a short-term bullish shift; KDJ remains strong (K65.9/D57.1); trading volume is up 4.1x.
Price change: 1.3700%
━━━━━━━━━━━━━━━━━━
#技术分析 #AVGO
📌 This content is for reference only and does not constitute investment advice
$AVGO 30-minute bullish signal confirmed by indicators
📈 $AVGO | 30-minute bullish signal
━━━━━━━━━━━━━━━━━━
Technical analysis: ADX (25) indicates an established trend; MACD has formed a golden cross above the zero line, strengthening bullish momentum; EMA5 has crossed above EMA8, signaling a short-term bullish shift; KDJ remains strong (K65.9/D57.1); trading volume is up 4.1x.
Price change: 1.3700%
━━━━━━━━━━━━━━━━━━
#技术分析 #AVGO
📌 This content is for reference only and does not constitute investment advice
📈 $AVGO | 30-minute bullish signal
━━━━━━━━━━━━━━━━━━
Technical analysis: ADX (25) indicates an established trend; MACD has formed a golden cross above the zero line, strengthening bullish momentum; EMA5 has crossed above EMA8, signaling a short-term bullish shift; KDJ remains strong (K65.9/D57.1); trading volume is up 4.1x.
Price change: 1.3700%
━━━━━━━━━━━━━━━━━━
#技术分析 #AVGO
📌 This content is for reference only and does not constitute investment advice
8
·
--
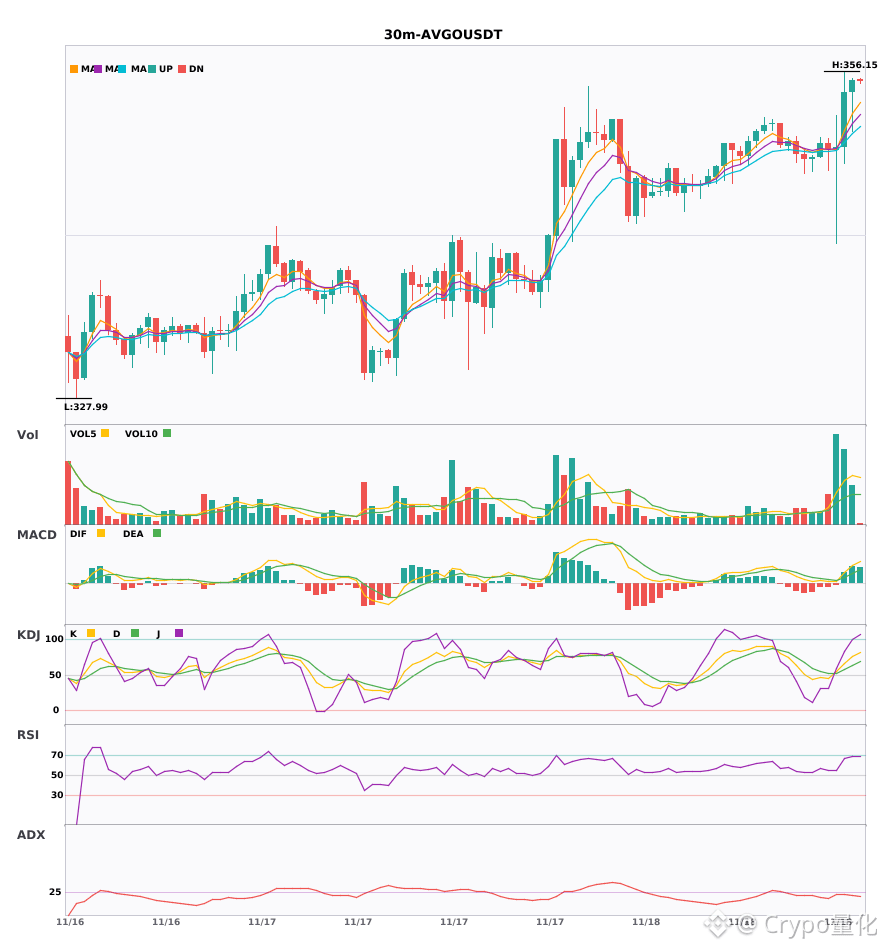
$AVGO 30-minute golden cross with volume expansion and bullish alignment—the short-term opportunity is here🔥
════════════════════
🔴 $AVGO 30-minute bullish signal
⚠️ Technicals: ADX trend is established and actionable; MACD golden cross above zero with expanding red bars; moving averages have just formed a bullish alignment; K crossed above D without entering overbought territory, giving bulls the upper hand; trading volume expanded 4.1x.
════════════════════
🔔 Follow for first-hand market updates 🔔
#技术分析 #AVGO
📌 When trading, pay attention to whether the candlestick pattern is favorable
$AVGO 30-minute golden cross with volume expansion and bullish alignment—the short-term opportunity is here🔥
════════════════════
🔴 $AVGO 30-minute bullish signal
⚠️ Technicals: ADX trend is established and actionable; MACD golden cross above zero with expanding red bars; moving averages have just formed a bullish alignment; K crossed above D without entering overbought territory, giving bulls the upper hand; trading volume expanded 4.1x.
════════════════════
🔔 Follow for first-hand market updates 🔔
#技术分析 #AVGO
📌 When trading, pay attention to whether the candlestick pattern is favorable
════════════════════
🔴 $AVGO 30-minute bullish signal
⚠️ Technicals: ADX trend is established and actionable; MACD golden cross above zero with expanding red bars; moving averages have just formed a bullish alignment; K crossed above D without entering overbought territory, giving bulls the upper hand; trading volume expanded 4.1x.
════════════════════
🔔 Follow for first-hand market updates 🔔
#技术分析 #AVGO
📌 When trading, pay attention to whether the candlestick pattern is favorable
7
·
--
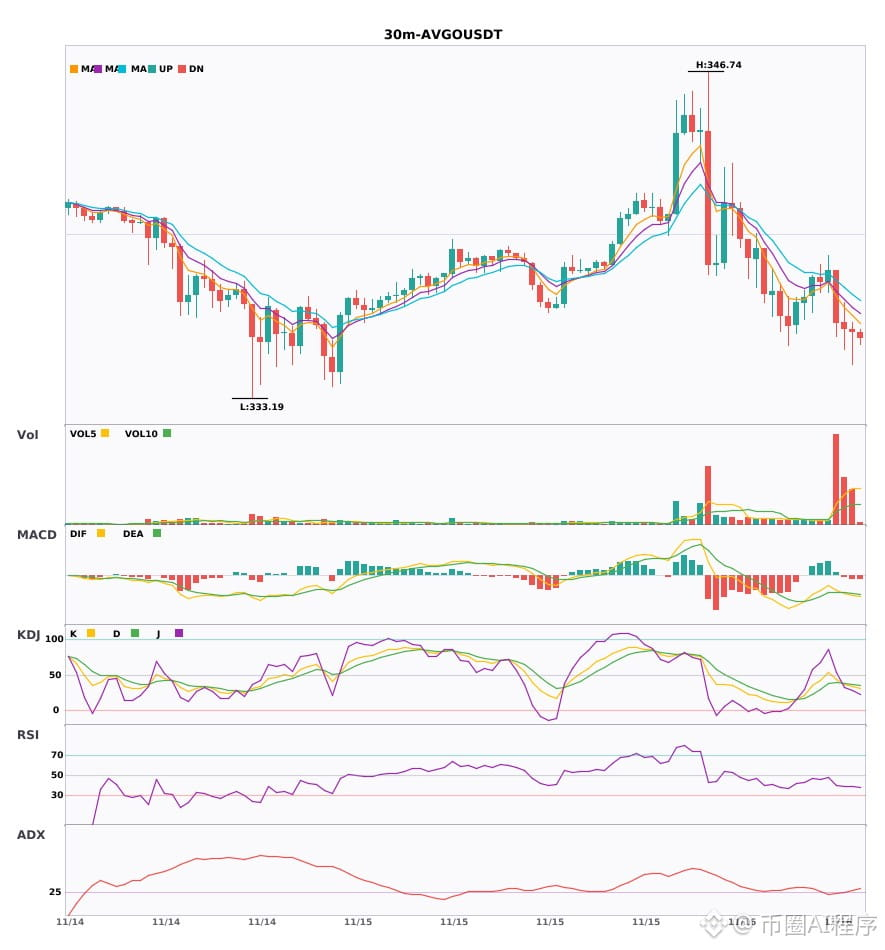
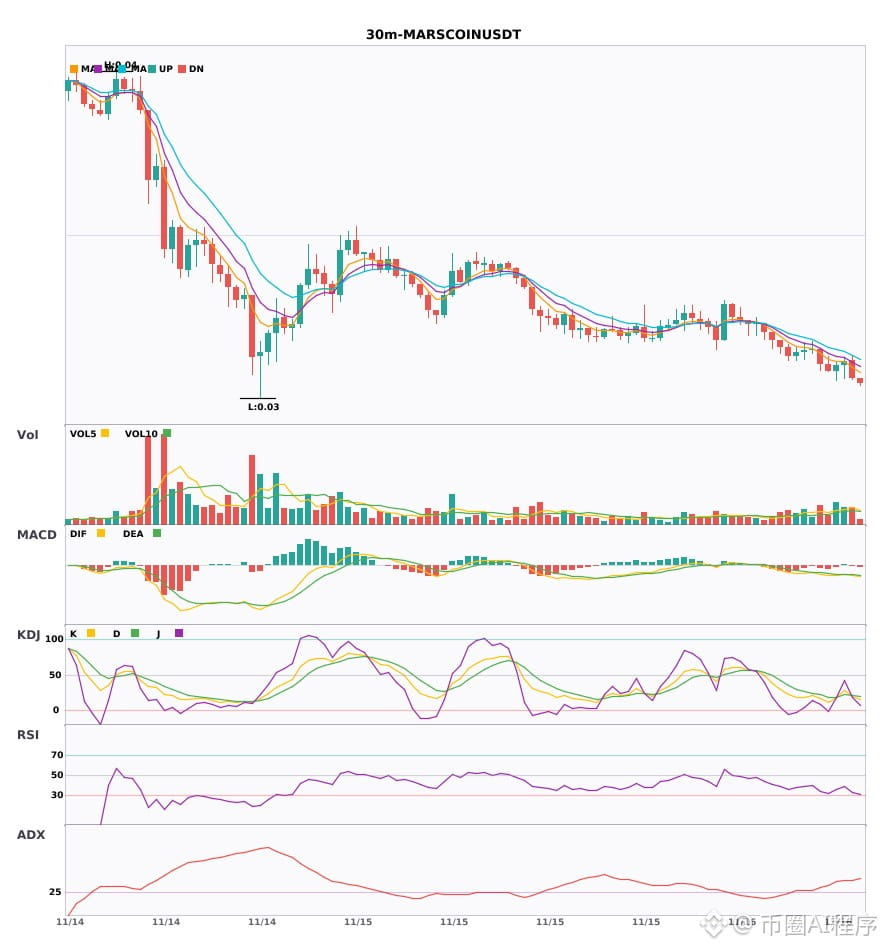
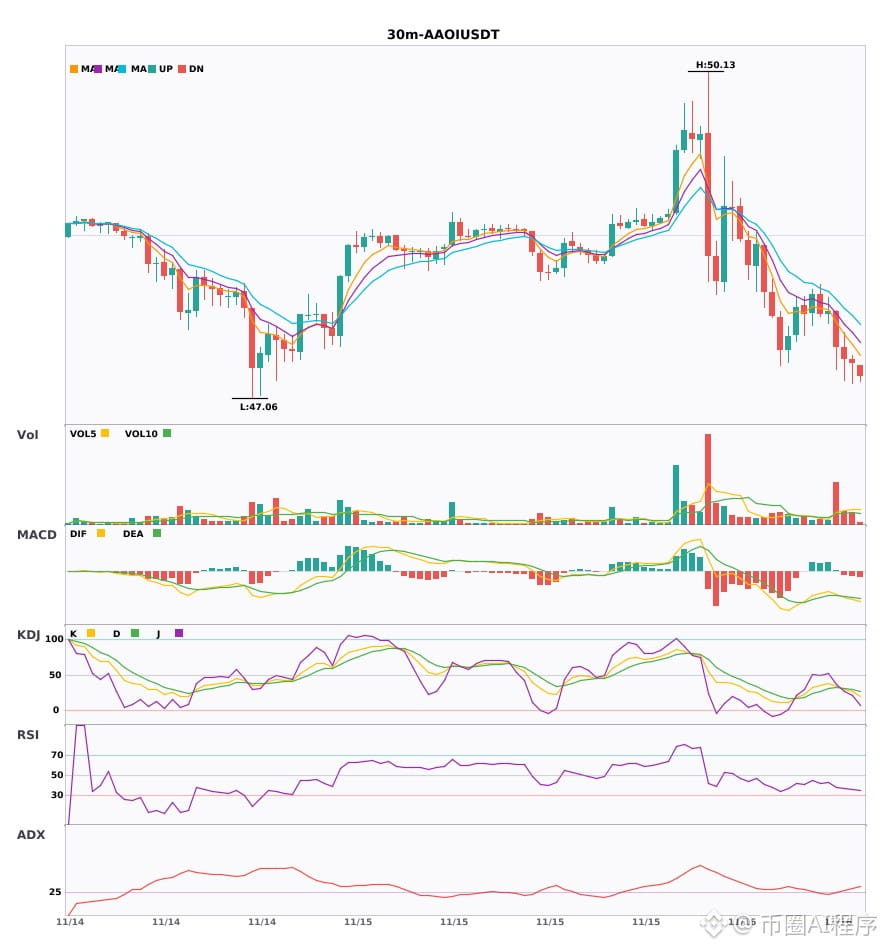
Three coins showing multi-timeframe bearish confluence; signals triggered simultaneously on the 30-minute and 4-hour charts 🔥
════════════════════
🟢 $AVGO 30-minute Short Signal
⚠️ Technical analysis: 4-hour + 30-minute bearish confluence! The 30-minute MACD has formed a bearish crossover below zero, moving averages are bearishly aligned, and the KDJ has formed a bearish crossover without being oversold. Trading volume is up 6.7x; short-term outlook is bearish.
════════════════════
🟢 $MARSCOIN 30-minute Short Signal
⚠️ Technical analysis: 4-hour bearish confluence + 30-minute entry: The MACD has formed a bearish crossover with expanding green bars, moving averages are bearishly aligned and trending downward, and the KDJ has formed a bearish crossover without being oversold. Go short.
════════════════════
🟢 $AAOI 30-minute Short Signal
⚠️ Technical analysis: 30-minute entry: The MACD has formed a bearish crossover below zero, with expanding green bars; moving averages are bearishly aligned and diverging downward; the KDJ has formed a bearish crossover without being oversold. 4-hour bearish confluence confirmed; multiple timeframes point to a bearish outlook. Trading volume is up 3.8x.
════════════════════
🔔 Follow for first-hand market movement alerts 🔔
#多周期共振 #AVGO #MARSCOIN #AAOI
📌 When trading, pay attention to whether the candlestick patterns confirm the setup
Three coins showing multi-timeframe bearish confluence; signals triggered simultaneously on the 30-minute and 4-hour charts 🔥
════════════════════
🟢 $AVGO 30-minute Short Signal
⚠️ Technical analysis: 4-hour + 30-minute bearish confluence! The 30-minute MACD has formed a bearish crossover below zero, moving averages are bearishly aligned, and the KDJ has formed a bearish crossover without being oversold. Trading volume is up 6.7x; short-term outlook is bearish.
════════════════════
🟢 $MARSCOIN 30-minute Short Signal
⚠️ Technical analysis: 4-hour bearish confluence + 30-minute entry: The MACD has formed a bearish crossover with expanding green bars, moving averages are bearishly aligned and trending downward, and the KDJ has formed a bearish crossover without being oversold. Go short.
════════════════════
🟢 $AAOI 30-minute Short Signal
⚠️ Technical analysis: 30-minute entry: The MACD has formed a bearish crossover below zero, with expanding green bars; moving averages are bearishly aligned and diverging downward; the KDJ has formed a bearish crossover without being oversold. 4-hour bearish confluence confirmed; multiple timeframes point to a bearish outlook. Trading volume is up 3.8x.
════════════════════
🔔 Follow for first-hand market movement alerts 🔔
#多周期共振 #AVGO #MARSCOIN #AAOI
📌 When trading, pay attention to whether the candlestick patterns confirm the setup
════════════════════
🟢 $AVGO 30-minute Short Signal
⚠️ Technical analysis: 4-hour + 30-minute bearish confluence! The 30-minute MACD has formed a bearish crossover below zero, moving averages are bearishly aligned, and the KDJ has formed a bearish crossover without being oversold. Trading volume is up 6.7x; short-term outlook is bearish.
════════════════════
🟢 $MARSCOIN 30-minute Short Signal
⚠️ Technical analysis: 4-hour bearish confluence + 30-minute entry: The MACD has formed a bearish crossover with expanding green bars, moving averages are bearishly aligned and trending downward, and the KDJ has formed a bearish crossover without being oversold. Go short.
════════════════════
🟢 $AAOI 30-minute Short Signal
⚠️ Technical analysis: 30-minute entry: The MACD has formed a bearish crossover below zero, with expanding green bars; moving averages are bearishly aligned and diverging downward; the KDJ has formed a bearish crossover without being oversold. 4-hour bearish confluence confirmed; multiple timeframes point to a bearish outlook. Trading volume is up 3.8x.
════════════════════
🔔 Follow for first-hand market movement alerts 🔔
#多周期共振 #AVGO #MARSCOIN #AAOI
📌 When trading, pay attention to whether the candlestick patterns confirm the setup
5
·
--
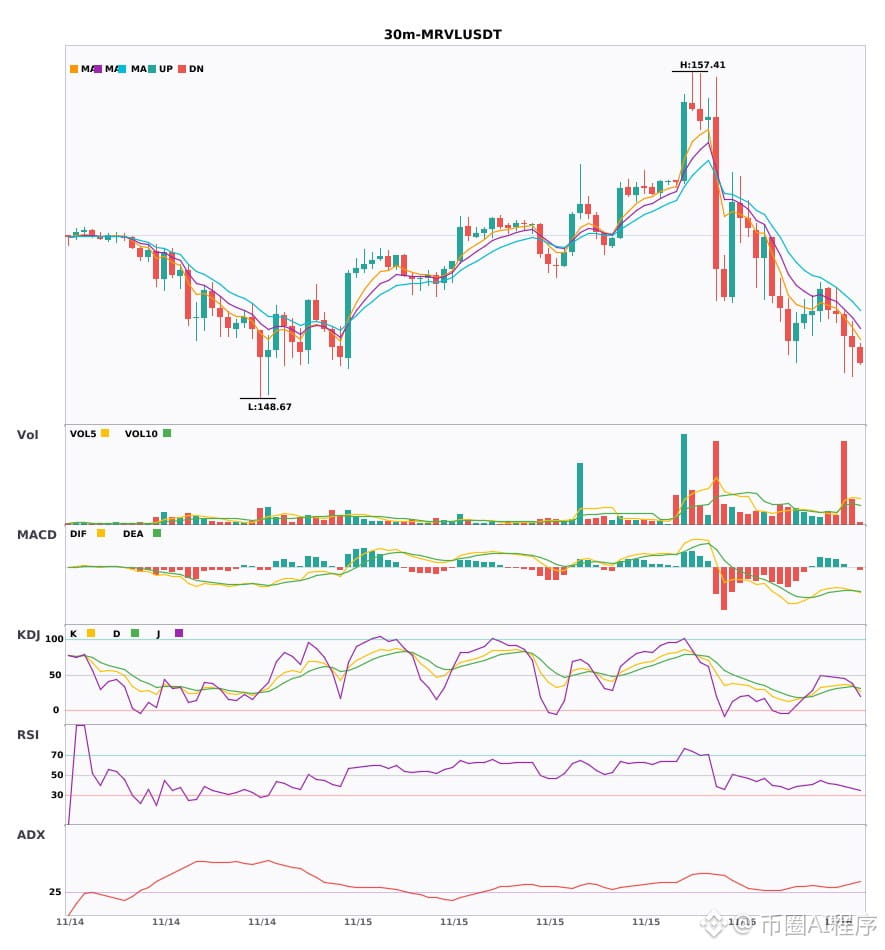
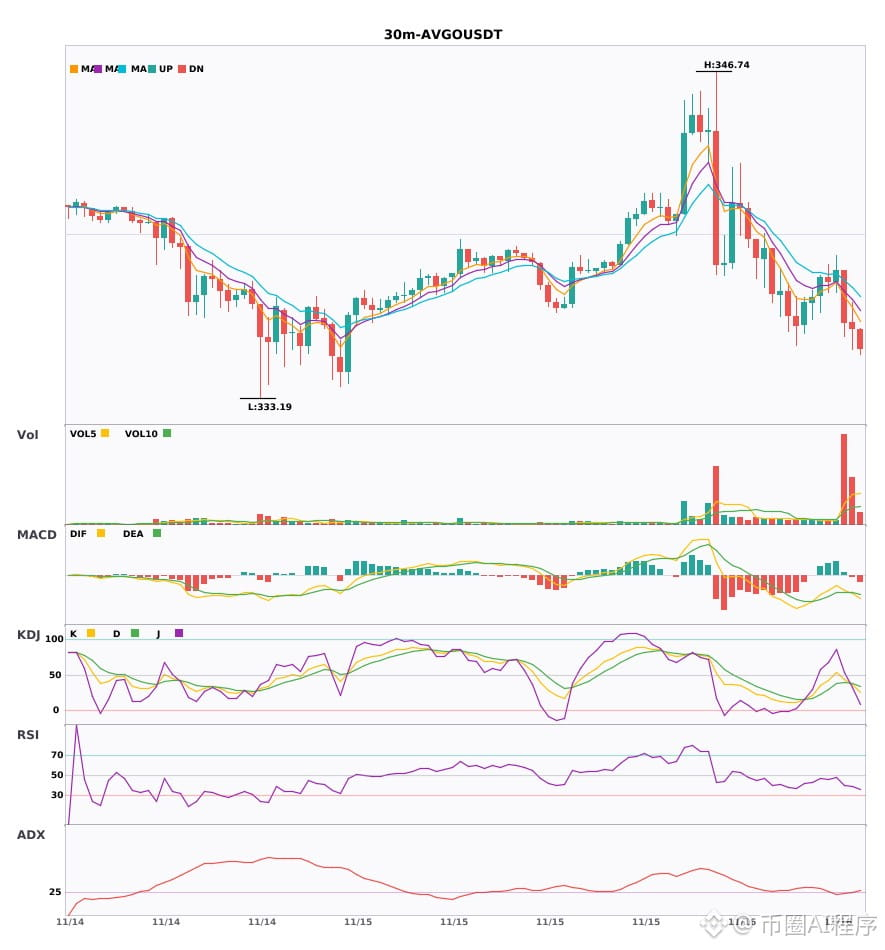
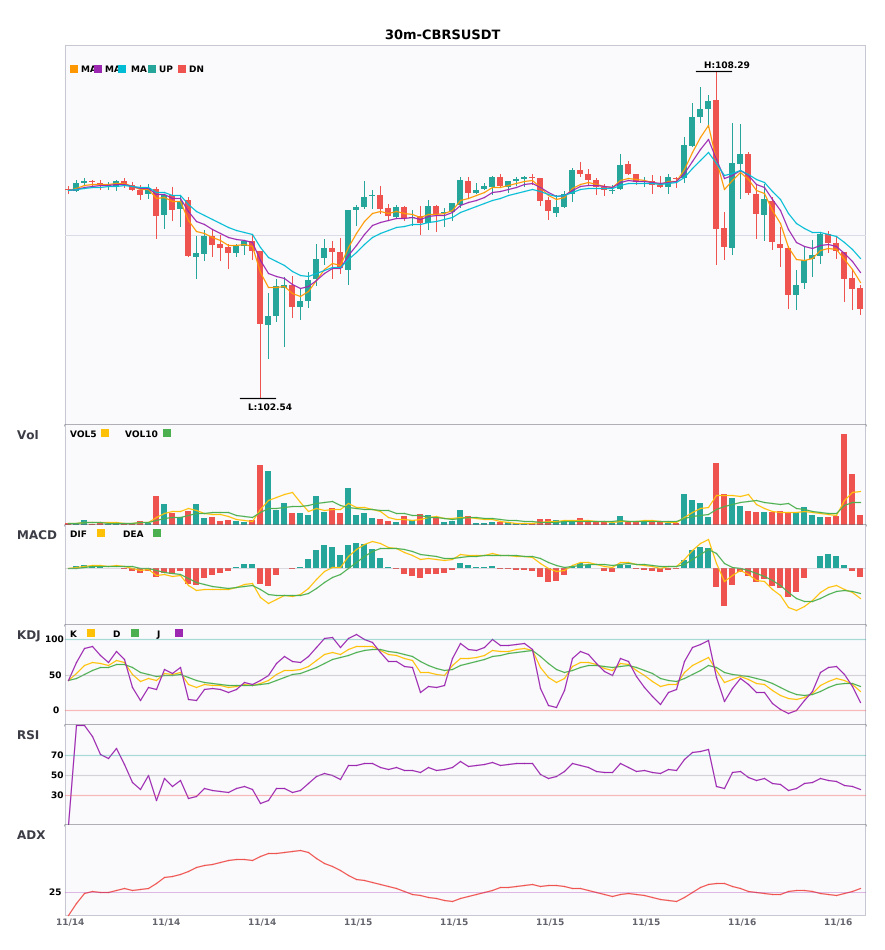
$MRVL/$AVGO/$CBRS 30-minute and 4-hour bearish confluence—still room to fall 🔥
════════════════════
🟢 $MRVL 30-minute bearish signal
⚠️Technical analysis: 4-hour bearish confluence confirmed. 30-minute entry: MACD bearish cross below zero with rising volume; moving averages bearishly aligned and diverging downward; KDJ is weak; volume surged 4.2x.
════════════════════
🟢 $AVGO 30-minute bearish signal
⚠️Technical analysis: 30-minute MACD bearish crossover with rising volume; KDJ bearish crossover has not yet reached oversold territory; moving averages bearishly aligned and diverging downward; volume increased 6.7x. 4-hour and 30-minute bearish confluence confirmed; short-term outlook is bearish.
════════════════════
🟢 $CBRS 30-minute bearish signal
⚠️Technical analysis: Multiple timeframes align bearishly: 4-hour downtrend + 30-minute confluence confirmed. MACD bearish crossover below zero signals accelerating downside; moving averages are bearishly aligned; KDJ has crossed bearishly but is not oversold; volume surged 4.8x. Short-term bias is bearish.
════════════════════
🔔 Follow for real-time market alerts 🔔
#多周期共振 #MRVL #AVGO #CBRS
📌 When trading, check whether the candlestick pattern confirms the setup.
$MRVL /$AVGO /$CBRS 30-minute and 4-hour bearish confluence—still room to fall 🔥
════════════════════
🟢 $MRVL 30-minute bearish signal
⚠️Technical analysis: 4-hour bearish confluence confirmed. 30-minute entry: MACD bearish cross below zero with rising volume; moving averages bearishly aligned and diverging downward; KDJ is weak; volume surged 4.2x.
════════════════════
🟢 $AVGO 30-minute bearish signal
⚠️Technical analysis: 30-minute MACD bearish crossover with rising volume; KDJ bearish crossover has not yet reached oversold territory; moving averages bearishly aligned and diverging downward; volume increased 6.7x. 4-hour and 30-minute bearish confluence confirmed; short-term outlook is bearish.
════════════════════
🟢 $CBRS 30-minute bearish signal
⚠️Technical analysis: Multiple timeframes align bearishly: 4-hour downtrend + 30-minute confluence confirmed. MACD bearish crossover below zero signals accelerating downside; moving averages are bearishly aligned; KDJ has crossed bearishly but is not oversold; volume surged 4.8x. Short-term bias is bearish.
════════════════════
🔔 Follow for real-time market alerts 🔔
#多周期共振 #MRVL #AVGO #CBRS
📌 When trading, check whether the candlestick pattern confirms the setup.
════════════════════
🟢 $MRVL 30-minute bearish signal
⚠️Technical analysis: 4-hour bearish confluence confirmed. 30-minute entry: MACD bearish cross below zero with rising volume; moving averages bearishly aligned and diverging downward; KDJ is weak; volume surged 4.2x.
════════════════════
🟢 $AVGO 30-minute bearish signal
⚠️Technical analysis: 30-minute MACD bearish crossover with rising volume; KDJ bearish crossover has not yet reached oversold territory; moving averages bearishly aligned and diverging downward; volume increased 6.7x. 4-hour and 30-minute bearish confluence confirmed; short-term outlook is bearish.
════════════════════
🟢 $CBRS 30-minute bearish signal
⚠️Technical analysis: Multiple timeframes align bearishly: 4-hour downtrend + 30-minute confluence confirmed. MACD bearish crossover below zero signals accelerating downside; moving averages are bearishly aligned; KDJ has crossed bearishly but is not oversold; volume surged 4.8x. Short-term bias is bearish.
════════════════════
🔔 Follow for real-time market alerts 🔔
#多周期共振 #MRVL #AVGO #CBRS
📌 When trading, check whether the candlestick pattern confirms the setup.
4
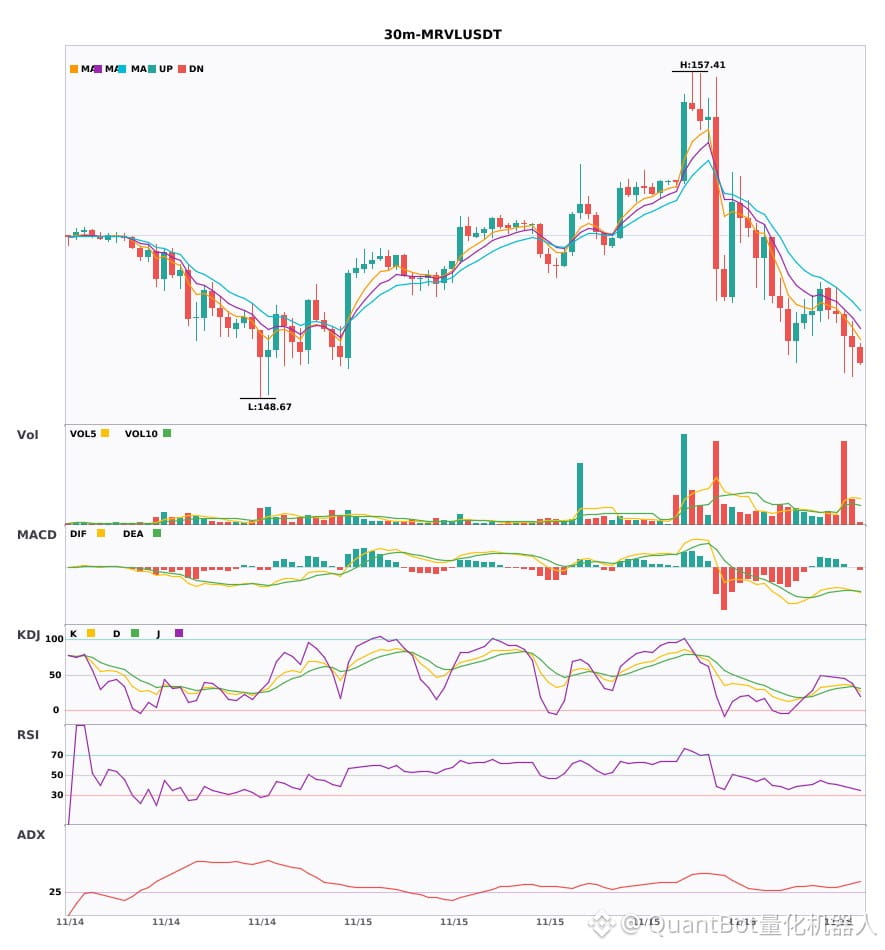
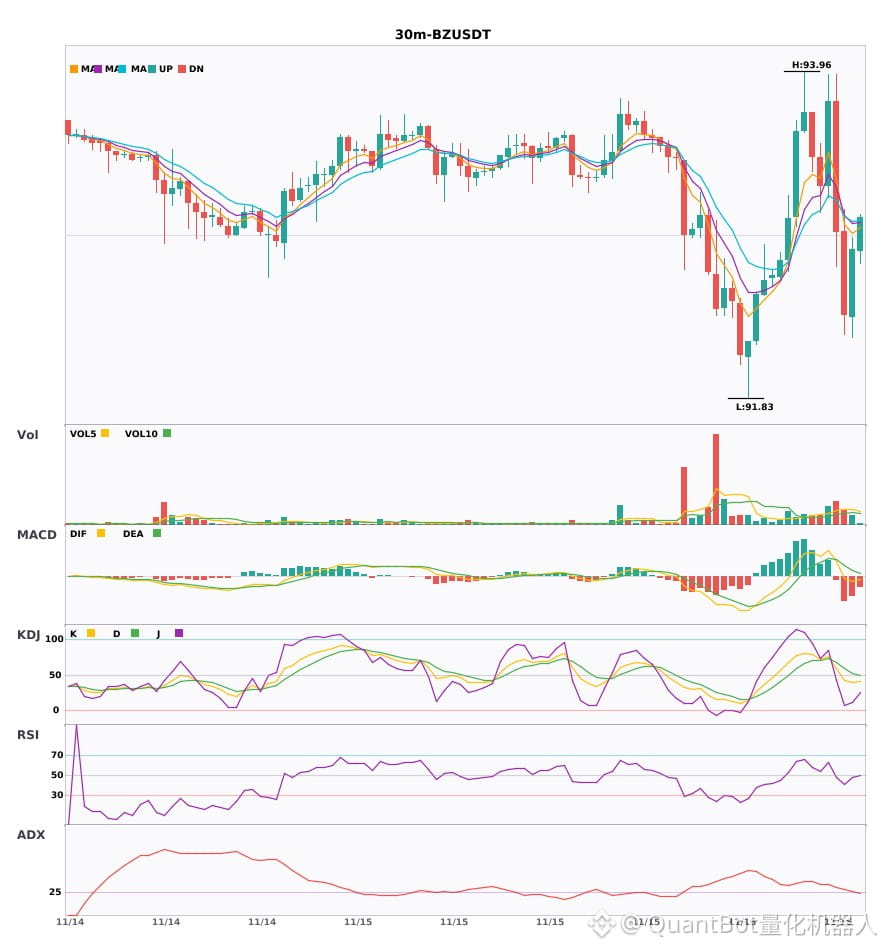
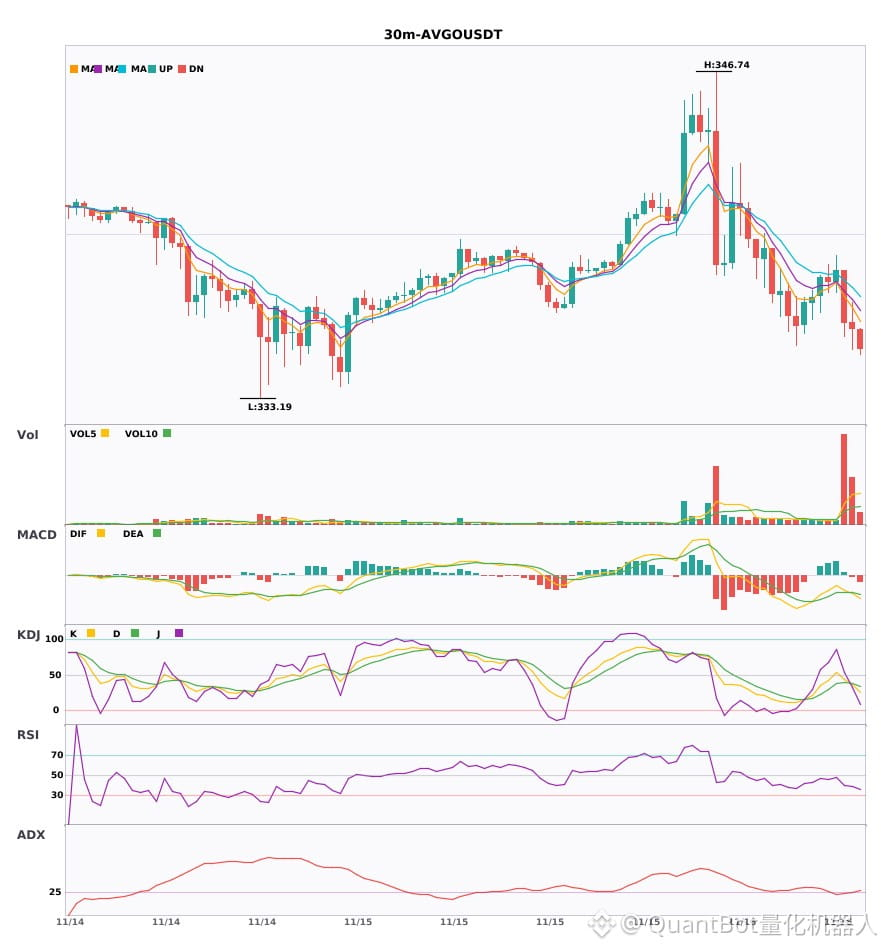
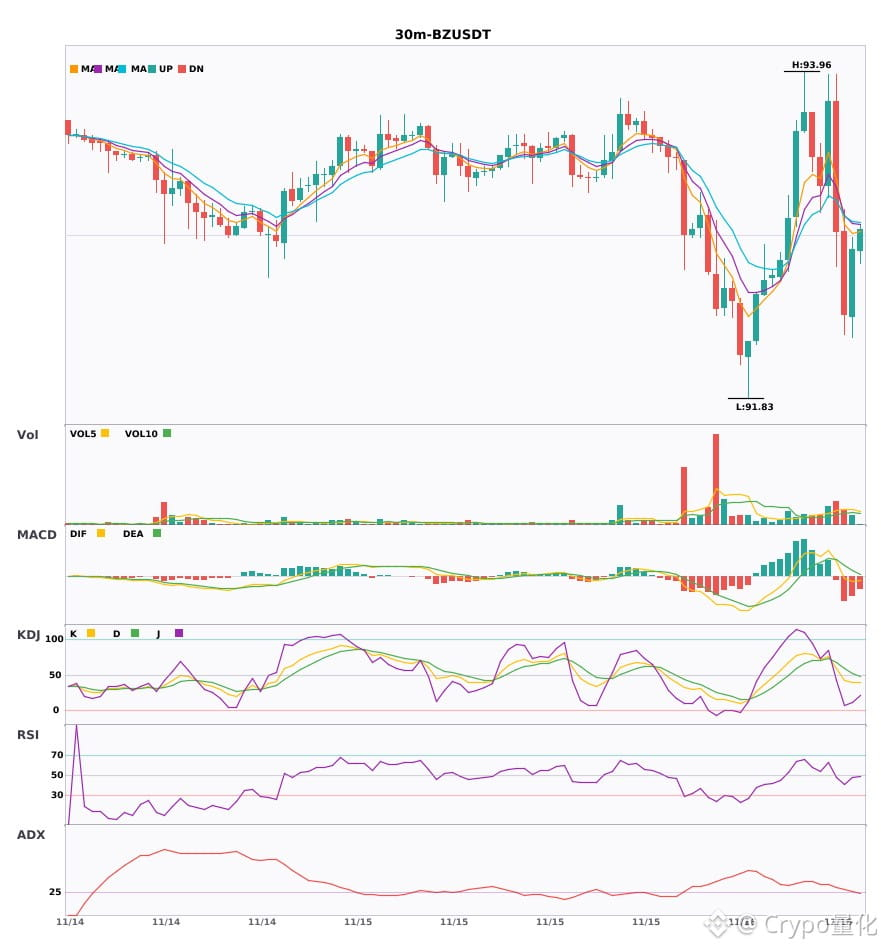
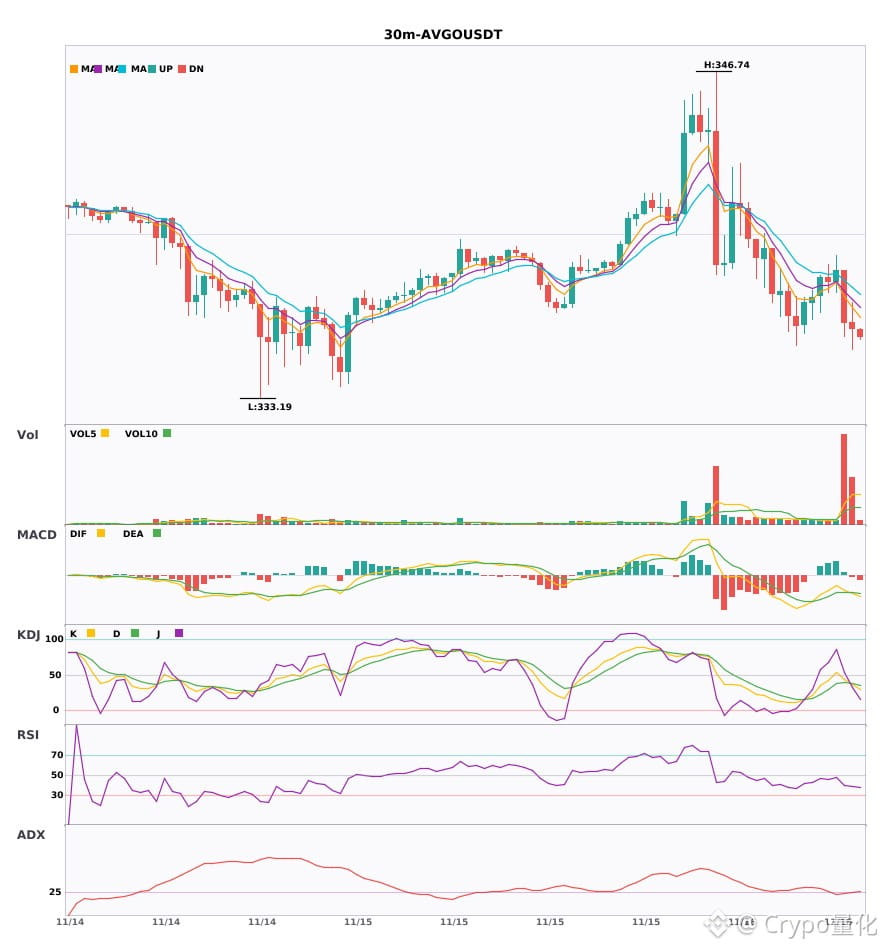
$MRVL $BZ $AVGO 30-minute synchronized weakening, risk alert
📉 $MRVL | 30-minute bearish signal
━━━━━━━━━━━━━━━━━━
Technical analysis: ADX(38) indicates a pronounced trend; MACD has formed a death cross below zero, with bearish momentum accelerating; EMAs are bearishly aligned; KDJ is at low levels (K34.7/D33.3); trading volume has increased 4.2x.
Price change: -0.1800%
📉 $BZ | 30-minute bearish signal
━━━━━━━━━━━━━━━━━━
Technical analysis: ADX(29) shows a developing trend, offering a potential opportunity to participate; MACD DIF has broken below the zero line, turning bearish; EMA5 has crossed below EMA8, indicating a short-term bearish outlook; trading volume has increased 2.2x.
Price change: -0.5800%
📉 $AVGO | 30-minute bearish signal
━━━━━━━━━━━━━━━━━━
Technical analysis: ADX(27) indicates an established trend; MACD has formed a death cross below zero; EMA5<8<13 are bearishly aligned; KDJ death cross at K36.7/D38.8; volume has increased 6.7x, indicating a bearish outlook.
Price change: -0.0800%
━━━━━━━━━━━━━━━━━━
#技术分析 #MRVL #BZ #AVGO
📌 The above is for reference only and does not constitute investment advice
$MRVL $BZ $AVGO 30-minute synchronized weakening, risk alert
📉 $MRVL | 30-minute bearish signal
━━━━━━━━━━━━━━━━━━
Technical analysis: ADX(38) indicates a pronounced trend; MACD has formed a death cross below zero, with bearish momentum accelerating; EMAs are bearishly aligned; KDJ is at low levels (K34.7/D33.3); trading volume has increased 4.2x.
Price change: -0.1800%
📉 $BZ | 30-minute bearish signal
━━━━━━━━━━━━━━━━━━
Technical analysis: ADX(29) shows a developing trend, offering a potential opportunity to participate; MACD DIF has broken below the zero line, turning bearish; EMA5 has crossed below EMA8, indicating a short-term bearish outlook; trading volume has increased 2.2x.
Price change: -0.5800%
📉 $AVGO | 30-minute bearish signal
━━━━━━━━━━━━━━━━━━
Technical analysis: ADX(27) indicates an established trend; MACD has formed a death cross below zero; EMA5<8<13 are bearishly aligned; KDJ death cross at K36.7/D38.8; volume has increased 6.7x, indicating a bearish outlook.
Price change: -0.0800%
━━━━━━━━━━━━━━━━━━
#技术分析 #MRVL #BZ #AVGO
📌 The above is for reference only and does not constitute investment advice
📉 $MRVL | 30-minute bearish signal
━━━━━━━━━━━━━━━━━━
Technical analysis: ADX(38) indicates a pronounced trend; MACD has formed a death cross below zero, with bearish momentum accelerating; EMAs are bearishly aligned; KDJ is at low levels (K34.7/D33.3); trading volume has increased 4.2x.
Price change: -0.1800%
📉 $BZ | 30-minute bearish signal
━━━━━━━━━━━━━━━━━━
Technical analysis: ADX(29) shows a developing trend, offering a potential opportunity to participate; MACD DIF has broken below the zero line, turning bearish; EMA5 has crossed below EMA8, indicating a short-term bearish outlook; trading volume has increased 2.2x.
Price change: -0.5800%
📉 $AVGO | 30-minute bearish signal
━━━━━━━━━━━━━━━━━━
Technical analysis: ADX(27) indicates an established trend; MACD has formed a death cross below zero; EMA5<8<13 are bearishly aligned; KDJ death cross at K36.7/D38.8; volume has increased 6.7x, indicating a bearish outlook.
Price change: -0.0800%
━━━━━━━━━━━━━━━━━━
#技术分析 #MRVL #BZ #AVGO
📌 The above is for reference only and does not constitute investment advice
2
·
--
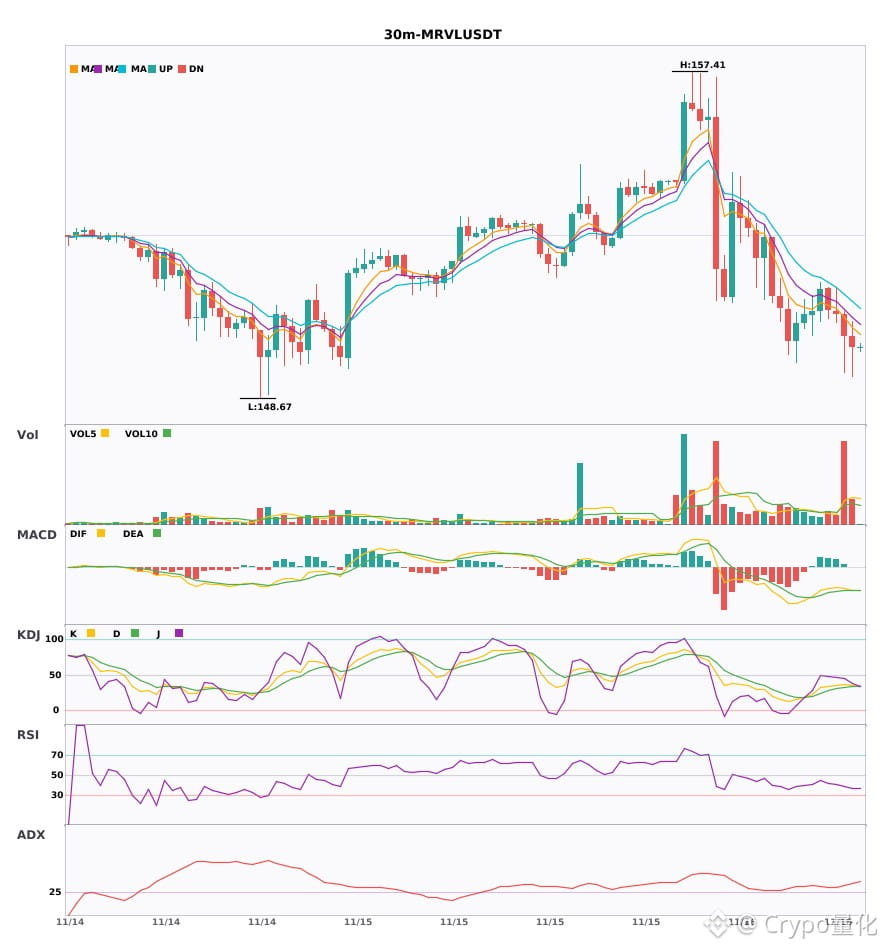
30-minute short signal is here $MRVL $BZ $AVGO Don't chase longs 🔥
════════════════════
🟢 $MRVL 30-minute short signal
⚠️Technical analysis: The trend is quite strong. MACD has formed a bearish cross below the zero line, with bearish momentum accelerating. The moving averages are bearishly aligned and pointing downward. KDJ favors the bears (K34.7 D33.3). Trading volume is 4.2 times higher.
════════════════════
🟢 $BZ 30-minute short signal
⚠️Technical analysis: ADX is at 29, and the trend is just starting—there's an opportunity to follow it. MACD's DIF has fallen below the zero line, indicating bearish momentum. Short-term moving averages have crossed bearishly and are pointing downward. Trading volume is up 2.2 times.
════════════════════
🟢 $AVGO 30-minute short signal
⚠️Technical analysis: The trend is just emerging—an opportunity to go short|MACD bearish cross below zero, with expanding green bars as bearish momentum builds|Moving averages are bearishly aligned and pointing downward|K has crossed below D and remains outside the oversold zone; short-term outlook is bearish|Heavy selling on 6.7 times the volume
════════════════════
🔔 Follow for first-hand market movement alerts 🔔
#技术分析 #MRVL #BZ #AVGO
📌 When trading, pay attention to whether the candlestick pattern confirms the signal
30-minute short signal is here $MRVL $BZ $AVGO Don't chase longs 🔥
════════════════════
🟢 $MRVL 30-minute short signal
⚠️Technical analysis: The trend is quite strong. MACD has formed a bearish cross below the zero line, with bearish momentum accelerating. The moving averages are bearishly aligned and pointing downward. KDJ favors the bears (K34.7 D33.3). Trading volume is 4.2 times higher.
════════════════════
🟢 $BZ 30-minute short signal
⚠️Technical analysis: ADX is at 29, and the trend is just starting—there's an opportunity to follow it. MACD's DIF has fallen below the zero line, indicating bearish momentum. Short-term moving averages have crossed bearishly and are pointing downward. Trading volume is up 2.2 times.
════════════════════
🟢 $AVGO 30-minute short signal
⚠️Technical analysis: The trend is just emerging—an opportunity to go short|MACD bearish cross below zero, with expanding green bars as bearish momentum builds|Moving averages are bearishly aligned and pointing downward|K has crossed below D and remains outside the oversold zone; short-term outlook is bearish|Heavy selling on 6.7 times the volume
════════════════════
🔔 Follow for first-hand market movement alerts 🔔
#技术分析 #MRVL #BZ #AVGO
📌 When trading, pay attention to whether the candlestick pattern confirms the signal
════════════════════
🟢 $MRVL 30-minute short signal
⚠️Technical analysis: The trend is quite strong. MACD has formed a bearish cross below the zero line, with bearish momentum accelerating. The moving averages are bearishly aligned and pointing downward. KDJ favors the bears (K34.7 D33.3). Trading volume is 4.2 times higher.
════════════════════
🟢 $BZ 30-minute short signal
⚠️Technical analysis: ADX is at 29, and the trend is just starting—there's an opportunity to follow it. MACD's DIF has fallen below the zero line, indicating bearish momentum. Short-term moving averages have crossed bearishly and are pointing downward. Trading volume is up 2.2 times.
════════════════════
🟢 $AVGO 30-minute short signal
⚠️Technical analysis: The trend is just emerging—an opportunity to go short|MACD bearish cross below zero, with expanding green bars as bearish momentum builds|Moving averages are bearishly aligned and pointing downward|K has crossed below D and remains outside the oversold zone; short-term outlook is bearish|Heavy selling on 6.7 times the volume
════════════════════
🔔 Follow for first-hand market movement alerts 🔔
#技术分析 #MRVL #BZ #AVGO
📌 When trading, pay attention to whether the candlestick pattern confirms the signal
8
·
--
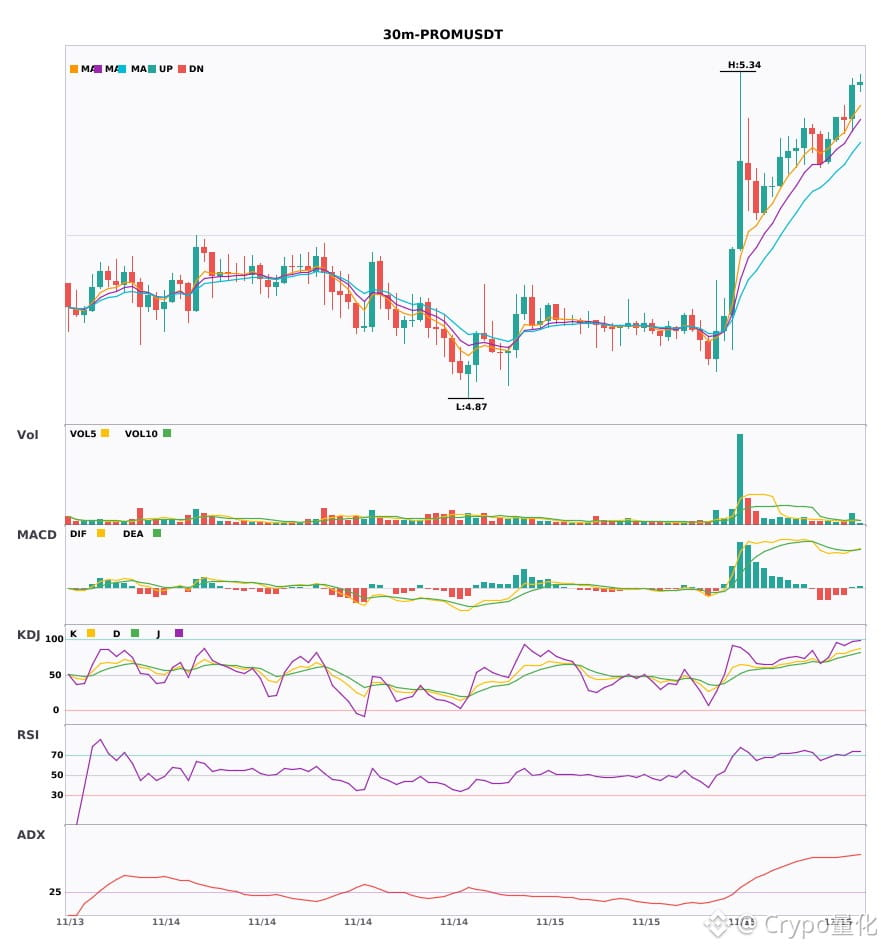
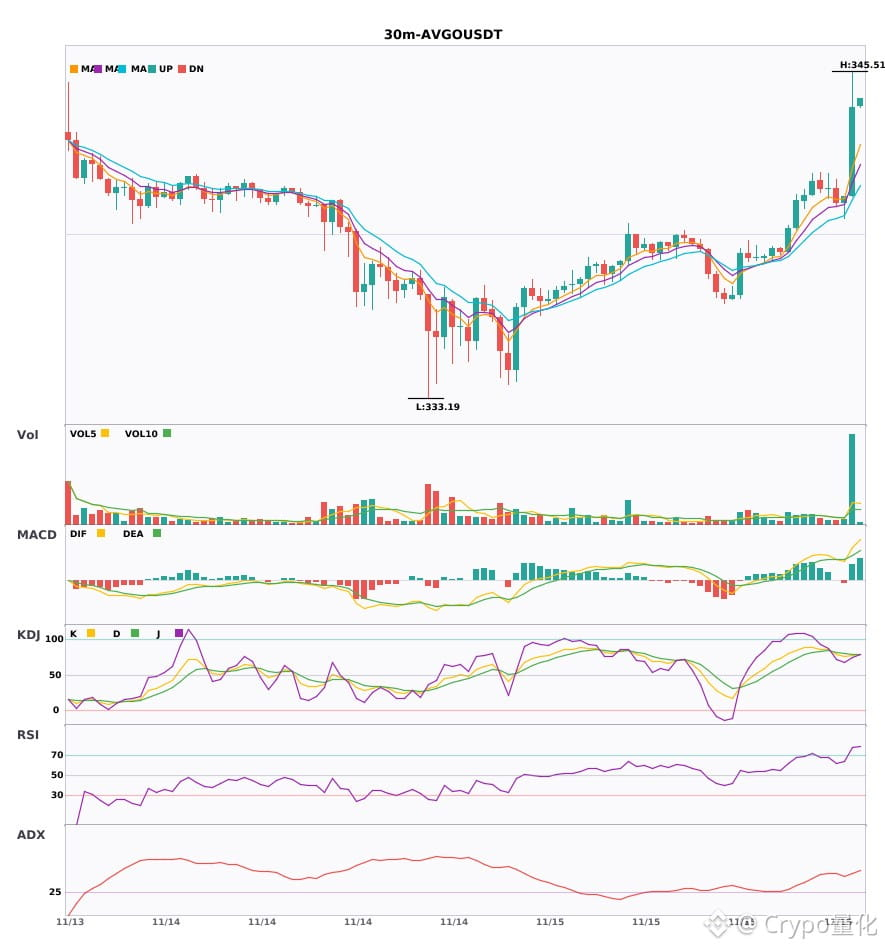
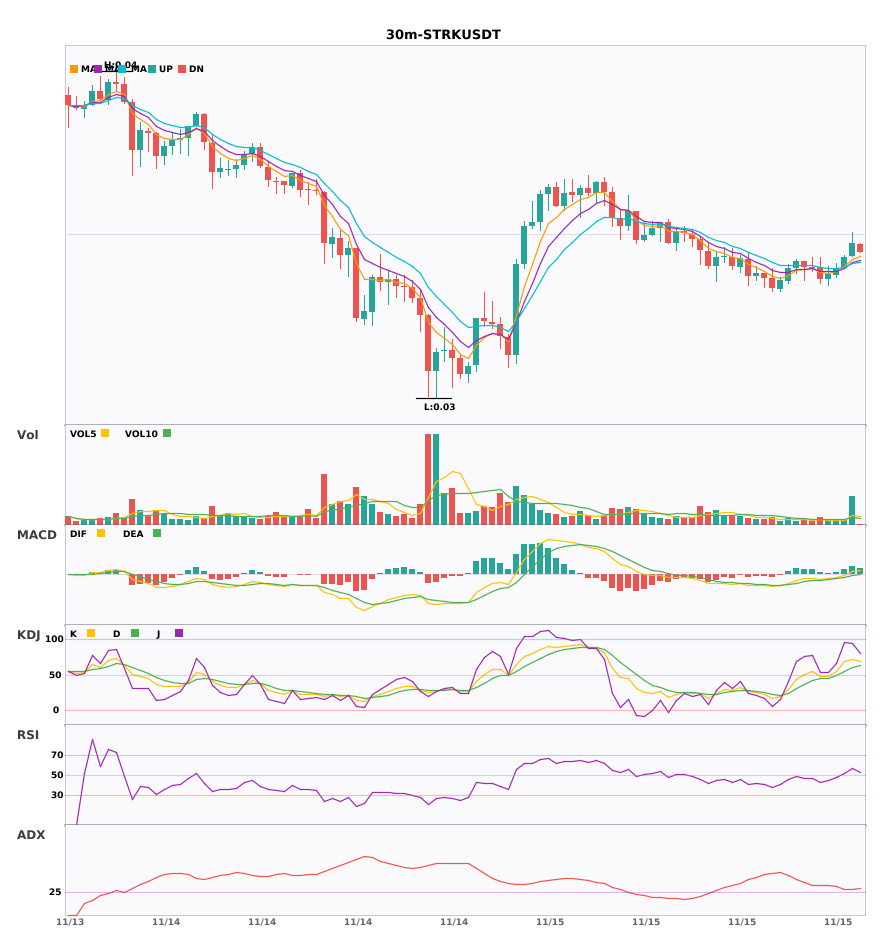
$PROM $AVGO $STRK 30-minute bullish alignment across three coins—short-term opportunity is here 🔥
════════════════════
🔴 $PROM 3 30-minute bullish signal
⚠️ Technical analysis: ADX (68) indicates an extremely strong trend; beware of overheating and a pullback|MACD bullish crossover with rising volume; red bars continue to expand|Moving averages are aligned bullishly and diverging upward|KDJ is strong; K has crossed above D without entering overbought territory|Trading volume has doubled
════════════════════
🔴 $AVGO 30-minute bullish signal
⚠️ Technical analysis: Extremely strong trend; watch for an overheated pullback; MACD bullish crossover with rising volume, releasing bullish momentum; moving averages are aligned bullishly; KDJ favors the bulls; trading volume surged 5.7 times.
════════════════════
🔴 $STRK 30-minute bullish signal
⚠️ Technical analysis: ADX trend is established and worth following; MACD bullish crossover above the zero line; moving averages have just diverged bullishly; KDJ crossed above D without entering overbought territory; volume has increased fourfold—bullish outlook
════════════════════
🔔 Follow for first-hand market updates 🔔
#技术分析 #PROM #AVGO #STRK
📌 When trading, check whether the candlestick pattern confirms the setup
$PROM $AVGO $STRK 30-minute bullish alignment across three coins—short-term opportunity is here 🔥
════════════════════
🔴 $PROM 3 30-minute bullish signal
⚠️ Technical analysis: ADX (68) indicates an extremely strong trend; beware of overheating and a pullback|MACD bullish crossover with rising volume; red bars continue to expand|Moving averages are aligned bullishly and diverging upward|KDJ is strong; K has crossed above D without entering overbought territory|Trading volume has doubled
════════════════════
🔴 $AVGO 30-minute bullish signal
⚠️ Technical analysis: Extremely strong trend; watch for an overheated pullback; MACD bullish crossover with rising volume, releasing bullish momentum; moving averages are aligned bullishly; KDJ favors the bulls; trading volume surged 5.7 times.
════════════════════
🔴 $STRK 30-minute bullish signal
⚠️ Technical analysis: ADX trend is established and worth following; MACD bullish crossover above the zero line; moving averages have just diverged bullishly; KDJ crossed above D without entering overbought territory; volume has increased fourfold—bullish outlook
════════════════════
🔔 Follow for first-hand market updates 🔔
#技术分析 #PROM #AVGO #STRK
📌 When trading, check whether the candlestick pattern confirms the setup
════════════════════
🔴 $PROM 3 30-minute bullish signal
⚠️ Technical analysis: ADX (68) indicates an extremely strong trend; beware of overheating and a pullback|MACD bullish crossover with rising volume; red bars continue to expand|Moving averages are aligned bullishly and diverging upward|KDJ is strong; K has crossed above D without entering overbought territory|Trading volume has doubled
════════════════════
🔴 $AVGO 30-minute bullish signal
⚠️ Technical analysis: Extremely strong trend; watch for an overheated pullback; MACD bullish crossover with rising volume, releasing bullish momentum; moving averages are aligned bullishly; KDJ favors the bulls; trading volume surged 5.7 times.
════════════════════
🔴 $STRK 30-minute bullish signal
⚠️ Technical analysis: ADX trend is established and worth following; MACD bullish crossover above the zero line; moving averages have just diverged bullishly; KDJ crossed above D without entering overbought territory; volume has increased fourfold—bullish outlook
════════════════════
🔔 Follow for first-hand market updates 🔔
#技术分析 #PROM #AVGO #STRK
📌 When trading, check whether the candlestick pattern confirms the setup
16
·
--
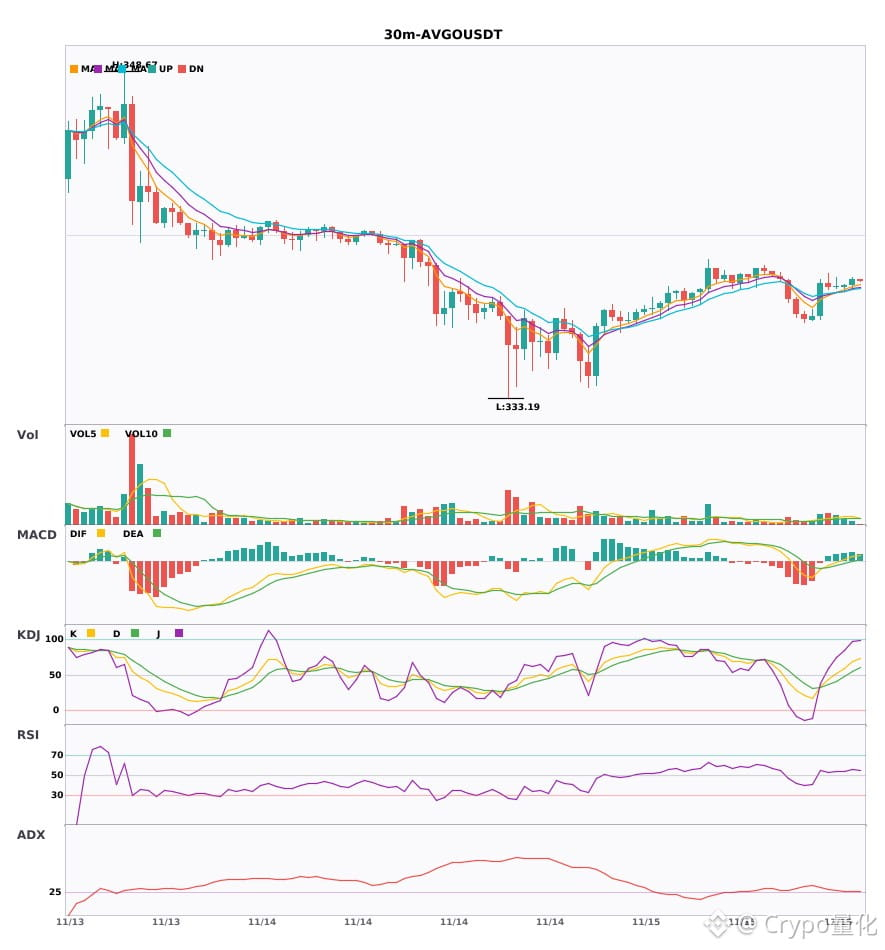
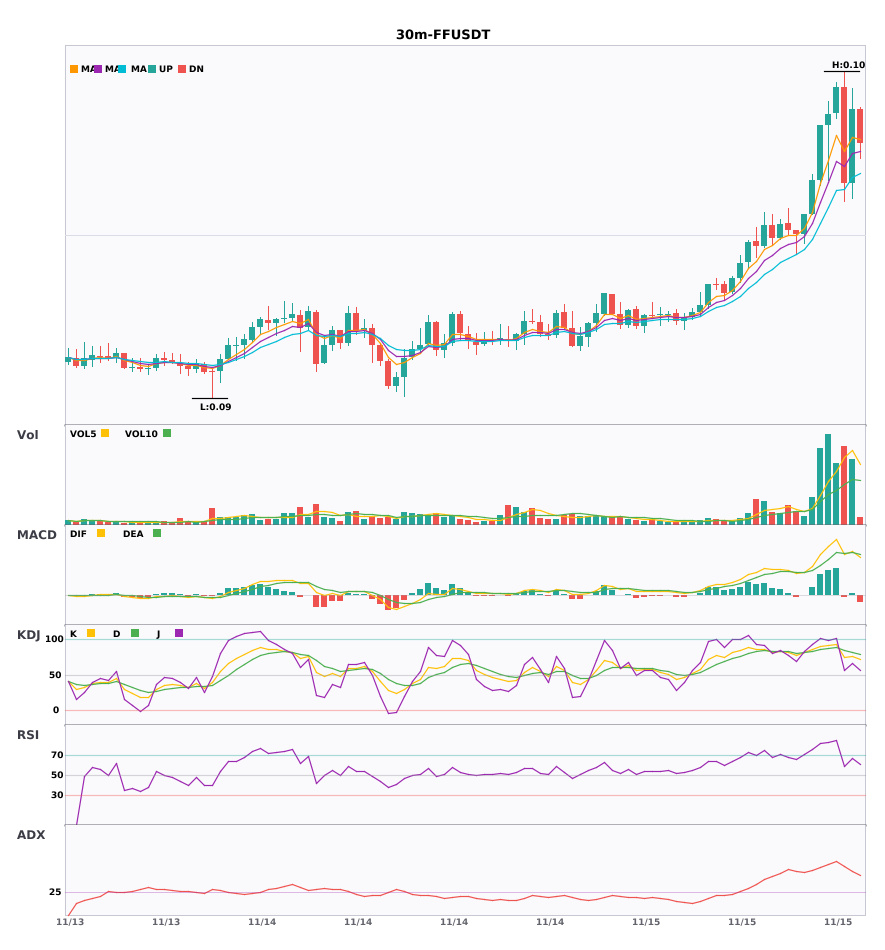
$MMT/$AVGO/$FF 30-minute golden cross with surging volume and bulls firing on all cylinders 🔥
════════════════════
🔴 $MMT 30-minute bullish signal
⚠️ Technical analysis: ADX 42 indicates a clear trend. MACD golden cross with expanding red bars. Moving averages are in a bullish alignment and diverging upward. K crossed above D without entering the overbought zone. Volume surged 2.2x.
════════════════════
🔴 $AVGO 30-minute bullish signal
⚠️ Technical analysis: ADX 29 indicates the trend is just starting to take shape, so you can follow along. MACD golden cross on rising volume; DIF has moved above the zero line, turning bullish. Moving averages are in a bullish alignment and diverging upward. Trading volume surged 1.7x.
════════════════════
🔴 $FF 30-minute bullish signal
⚠️ Technical analysis: The trend is very strong, but watch out for a pullback. MACD golden cross with rising volume and expanding red bars. Moving averages are in a bullish alignment and diverging upward. KDJ strongly favors the bulls. Trading volume doubled.
════════════════════
🔔 Follow for the latest market moves 🔔
#技术分析 #MMT #AVGO #FF
📌 When trading, pay attention to whether the candlestick pattern confirms the setup.
$MMT /$AVGO /$FF 30-minute golden cross with surging volume and bulls firing on all cylinders 🔥
════════════════════
🔴 $MMT 30-minute bullish signal
⚠️ Technical analysis: ADX 42 indicates a clear trend. MACD golden cross with expanding red bars. Moving averages are in a bullish alignment and diverging upward. K crossed above D without entering the overbought zone. Volume surged 2.2x.
════════════════════
🔴 $AVGO 30-minute bullish signal
⚠️ Technical analysis: ADX 29 indicates the trend is just starting to take shape, so you can follow along. MACD golden cross on rising volume; DIF has moved above the zero line, turning bullish. Moving averages are in a bullish alignment and diverging upward. Trading volume surged 1.7x.
════════════════════
🔴 $FF 30-minute bullish signal
⚠️ Technical analysis: The trend is very strong, but watch out for a pullback. MACD golden cross with rising volume and expanding red bars. Moving averages are in a bullish alignment and diverging upward. KDJ strongly favors the bulls. Trading volume doubled.
════════════════════
🔔 Follow for the latest market moves 🔔
#技术分析 #MMT #AVGO #FF
📌 When trading, pay attention to whether the candlestick pattern confirms the setup.
════════════════════
🔴 $MMT 30-minute bullish signal
⚠️ Technical analysis: ADX 42 indicates a clear trend. MACD golden cross with expanding red bars. Moving averages are in a bullish alignment and diverging upward. K crossed above D without entering the overbought zone. Volume surged 2.2x.
════════════════════
🔴 $AVGO 30-minute bullish signal
⚠️ Technical analysis: ADX 29 indicates the trend is just starting to take shape, so you can follow along. MACD golden cross on rising volume; DIF has moved above the zero line, turning bullish. Moving averages are in a bullish alignment and diverging upward. Trading volume surged 1.7x.
════════════════════
🔴 $FF 30-minute bullish signal
⚠️ Technical analysis: The trend is very strong, but watch out for a pullback. MACD golden cross with rising volume and expanding red bars. Moving averages are in a bullish alignment and diverging upward. KDJ strongly favors the bulls. Trading volume doubled.
════════════════════
🔔 Follow for the latest market moves 🔔
#技术分析 #MMT #AVGO #FF
📌 When trading, pay attention to whether the candlestick pattern confirms the setup.
12


·
--
Partly True
IF A STOCK RISES 25% IN 4 DAYS, DO YOU HAVE TO CHASE IT?
BROADCOM’S HISTORY OFFERS AN INTERESTING LESSON.
$AVGO
Broadcom closed at $293.69 on November 6. It rose to approximately $368 over the next 4 trading days. Gain: 25%
So what happened in the past when the same thing occurred?
Since 2009, it has risen by more than 20% in 4 days only 6 times.
In 5 of those 6 instances, the stock continued to rise over the following year.
In 3 of them, the annual gain exceeded 90%.
However, following each of those 5 instances, the stock pulled back by more than 10% at least once.
Broadcom’s adjusted earnings per share grew 96% year-over-year in the last quarter. In other words, there’s a real growth strategy behind the rally. But the stock isn’t cheap anymore. It’s trading at about 38 times its adjusted earnings over the past 12 months.
Missing an opportunity is one thing; blindly chasing the next rally is another.
#AVGO
IF A STOCK RISES 25% IN 4 DAYS, DO YOU HAVE TO CHASE IT?
BROADCOM’S HISTORY OFFERS AN INTERESTING LESSON.
$AVGO
Broadcom closed at $293.69 on November 6. It rose to approximately $368 over the next 4 trading days. Gain: 25%
So what happened in the past when the same thing occurred?
Since 2009, it has risen by more than 20% in 4 days only 6 times.
In 5 of those 6 instances, the stock continued to rise over the following year.
In 3 of them, the annual gain exceeded 90%.
However, following each of those 5 instances, the stock pulled back by more than 10% at least once.
Broadcom’s adjusted earnings per share grew 96% year-over-year in the last quarter. In other words, there’s a real growth strategy behind the rally. But the stock isn’t cheap anymore. It’s trading at about 38 times its adjusted earnings over the past 12 months.
Missing an opportunity is one thing; blindly chasing the next rally is another.
#AVGO
BROADCOM’S HISTORY OFFERS AN INTERESTING LESSON.
$AVGO
Broadcom closed at $293.69 on November 6. It rose to approximately $368 over the next 4 trading days. Gain: 25%
So what happened in the past when the same thing occurred?
Since 2009, it has risen by more than 20% in 4 days only 6 times.
In 5 of those 6 instances, the stock continued to rise over the following year.
In 3 of them, the annual gain exceeded 90%.
However, following each of those 5 instances, the stock pulled back by more than 10% at least once.
Broadcom’s adjusted earnings per share grew 96% year-over-year in the last quarter. In other words, there’s a real growth strategy behind the rally. But the stock isn’t cheap anymore. It’s trading at about 38 times its adjusted earnings over the past 12 months.
Missing an opportunity is one thing; blindly chasing the next rally is another.
#AVGO
1
834

·
--
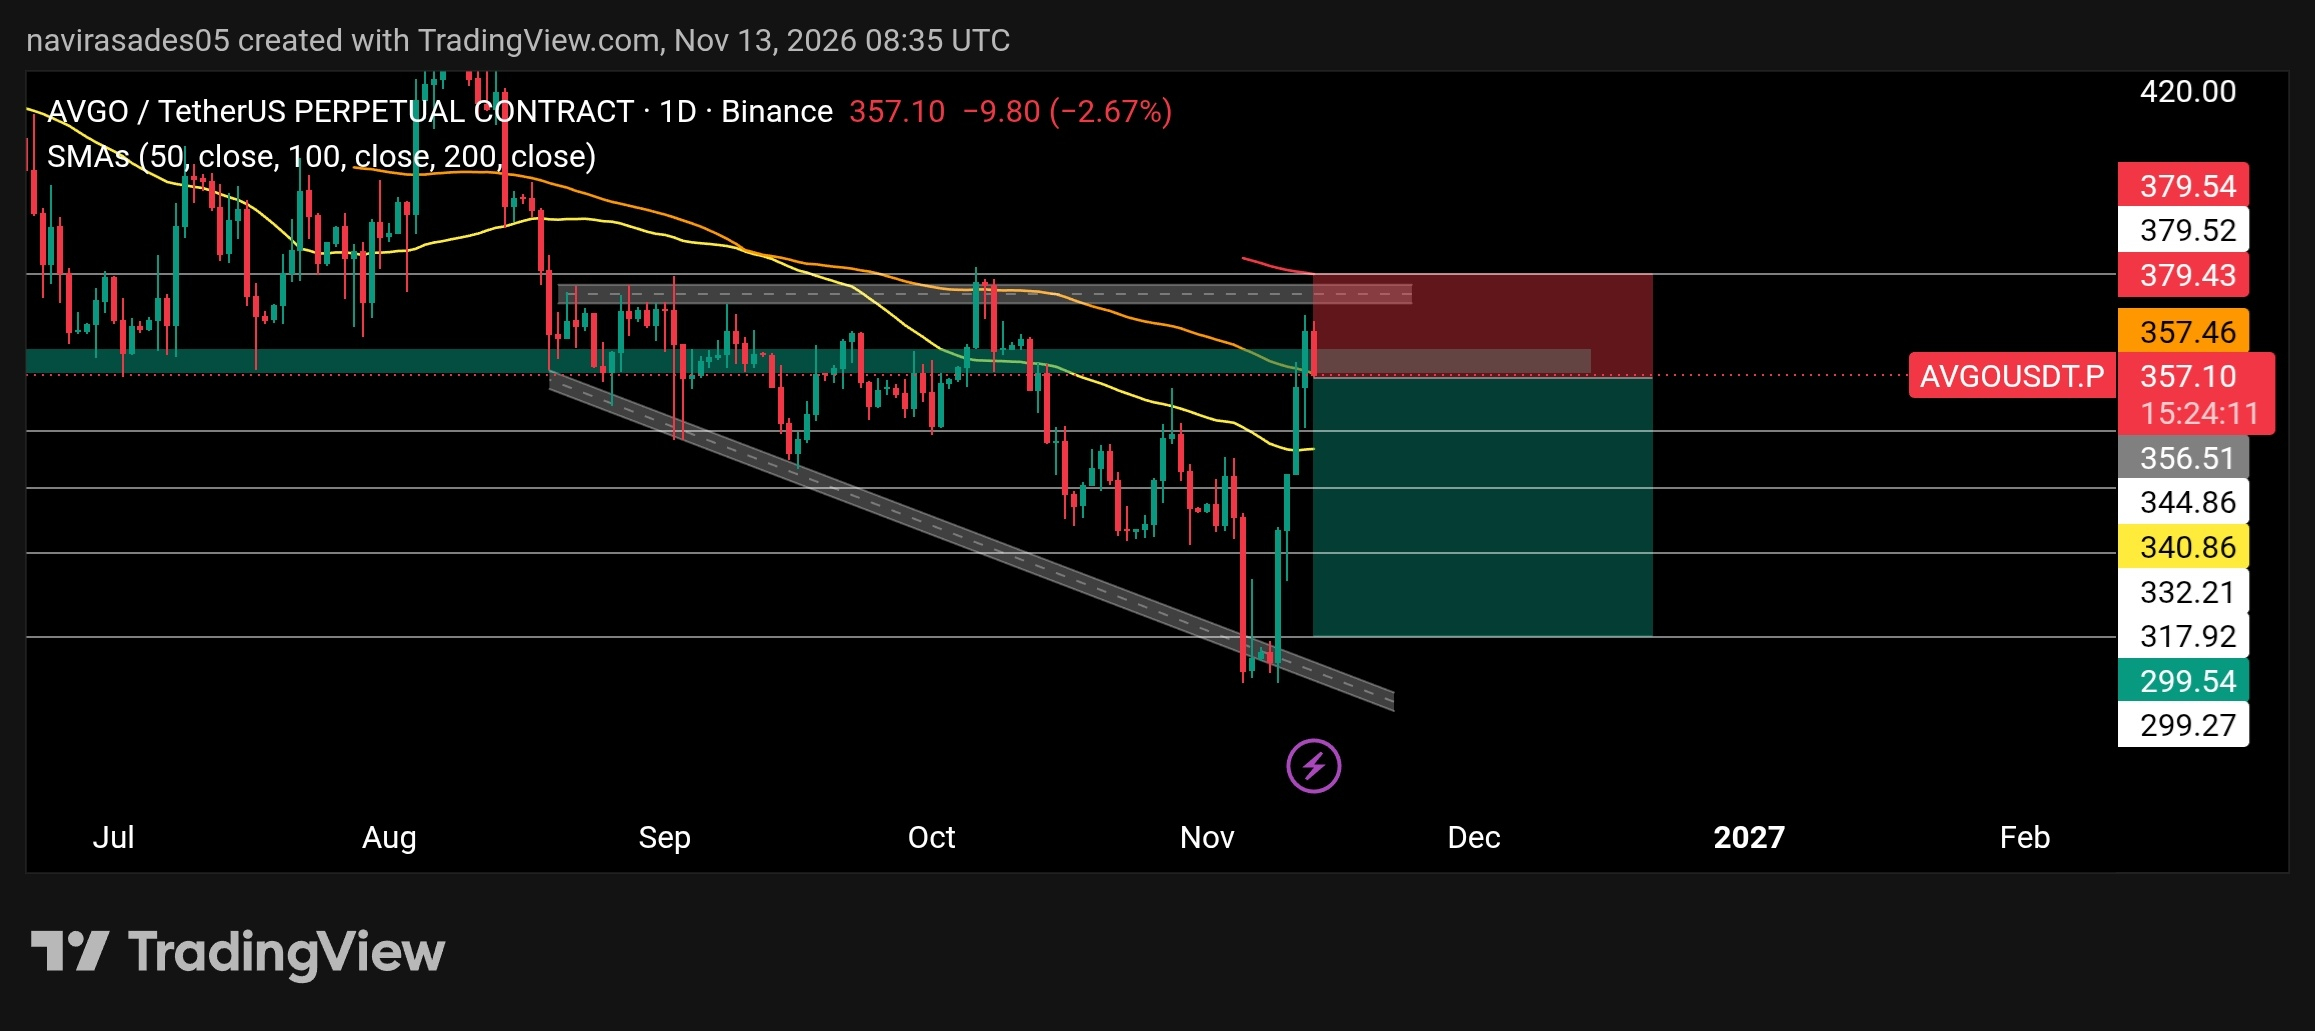
$AVGO GET SHORT TRADE AFTER CLOSE 4H CANDLE BRAKING THIS GREEN SUPPORT
{future}(AVGOUSDT)
use 3x leverage
use 1% of your wallet balance
Entry = 356 - 350
Tp 1 = 344
Tp 2 = 332
Tp 3 = 317
Sl = 379
#stoke #AVGO #ShortSignal #TradingSignal
$AVGO GET SHORT TRADE AFTER CLOSE 4H CANDLE BRAKING THIS GREEN SUPPORT
use 3x leverage
use 1% of your wallet balance
Entry = 356 - 350
Tp 1 = 344
Tp 2 = 332
Tp 3 = 317
Sl = 379
#stoke #AVGO #ShortSignal #TradingSignal
use 3x leverage
use 1% of your wallet balance
Entry = 356 - 350
Tp 1 = 344
Tp 2 = 332
Tp 3 = 317
Sl = 379
#stoke #AVGO #ShortSignal #TradingSignal
2
1
5
875

·
--
Bearish
First, Jensen Huang of Nvidia. Next will most likely be Broadcom—you can tell by looking at its shareholders.
There are rumors on X that antitrust laws will be used to break up Nvidia. This playbook leaves no room to take on Broadcom. Now that they’re done with Nvidia, it’s time to move on to the next target. #avgo #AMD #INTC
First, Jensen Huang of Nvidia. Next will most likely be Broadcom—you can tell by looking at its shareholders.
There are rumors on X that antitrust laws will be used to break up Nvidia. This playbook leaves no room to take on Broadcom. Now that they’re done with Nvidia, it’s time to move on to the next target. #avgo #AMD #INTC
There are rumors on X that antitrust laws will be used to break up Nvidia. This playbook leaves no room to take on Broadcom. Now that they’re done with Nvidia, it’s time to move on to the next target. #avgo #AMD #INTC

1
365
Log in to explore more content
Join global crypto users on Binance Square
⚡️ Get latest and useful information about crypto.
💬 Trusted by the world’s largest crypto exchange.
👍 Discover real insights from verified creators.
Email / Phone number
Trending Topics
1
#NvidiaLoses$2.7TrillionInMonthAndAHalf
18,046 views
116 Discussing
2
#CanBTCReboundAfterFallingBelow60K?
750,467 views
2,958 Discussing
3
#GlobalStocksFaceLongestLosingStreakSince2023
272,226 views
1,979 Discussing
4
#BlackRockIBITPostsRecord$541MSingleDayOutflow
31,956 views
88 Discussing
5
#AnthropicPlungesTowardIPOPriceonDay2
138,889 views
1,202 Discussing
6
#TwentyOneCapitalAdds172.25BTC
63,357 views
655 Discussing
7
#HKBillWouldExcludeTokenizedDepositsFromVirtualAssets
7,987 views
50 Discussing
8
#BNBDropsBelow540USDTWith8.46%DailyDecline
76,021 views
648 Discussing
9
#HKBillProposesHK$100KFineForUnauthorizedCryptoTitles
2,541 views
22 Discussing
10
#BitMineFaces$10.1BUnrealizedETHLoss
5,348 views
28 Discussing