
#nvdl
nvdl
5,064 views
111 Discussing
Hot
Latest

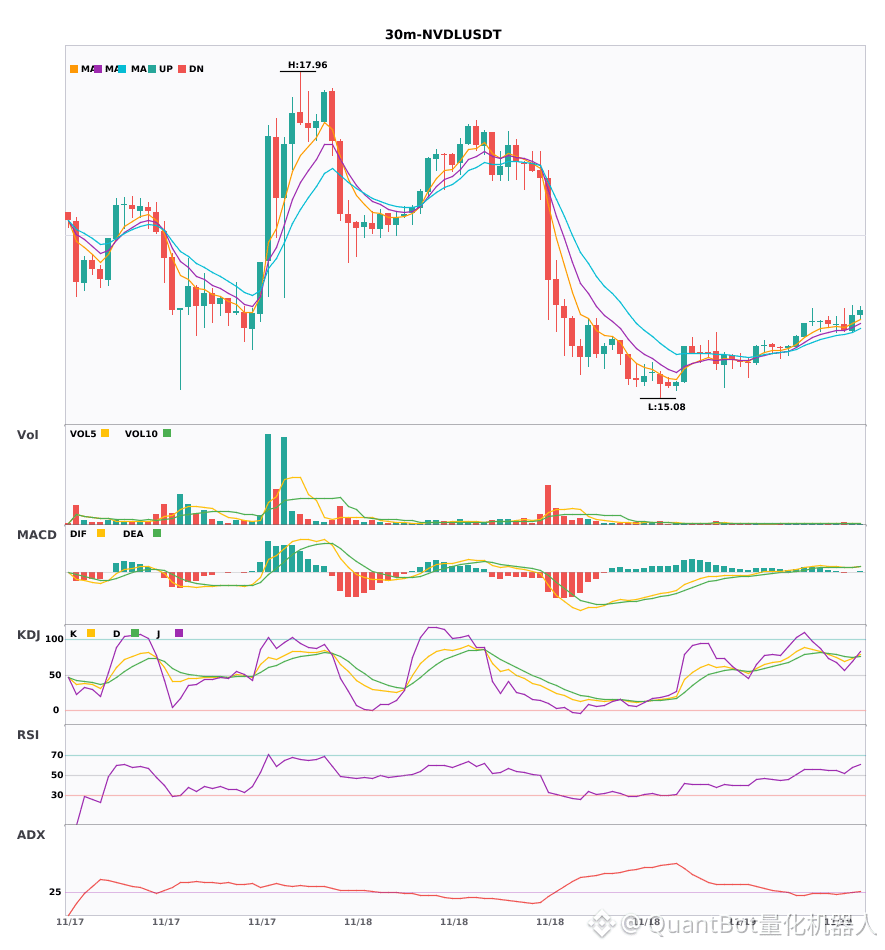
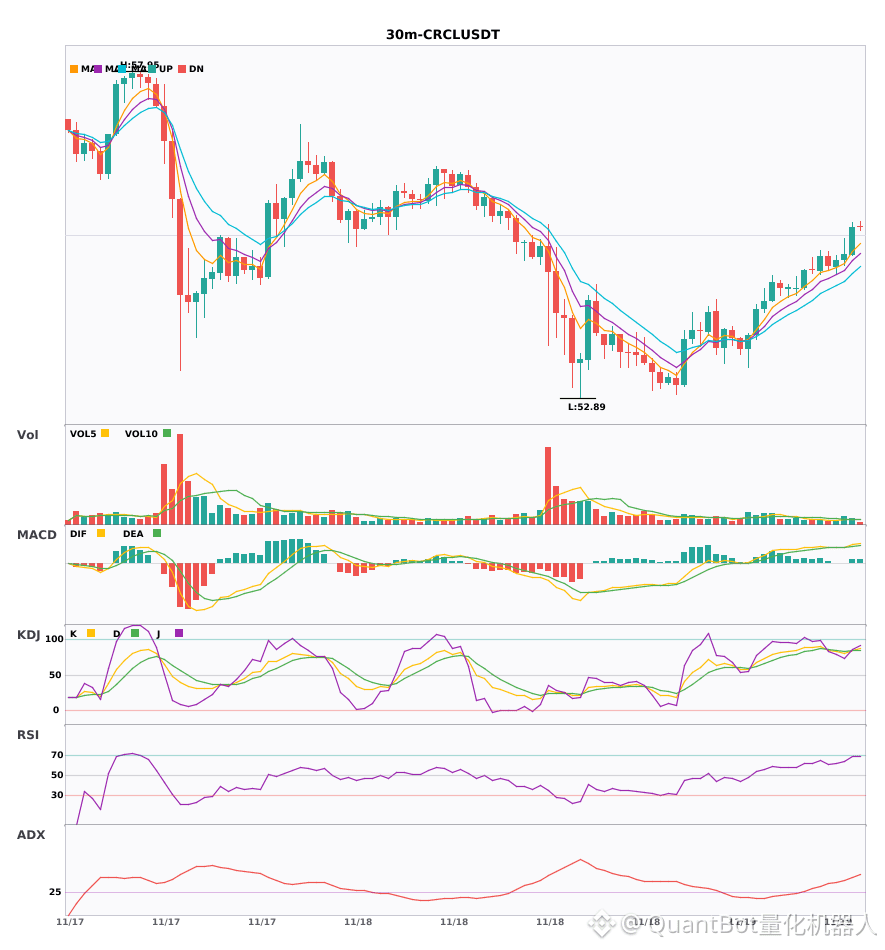
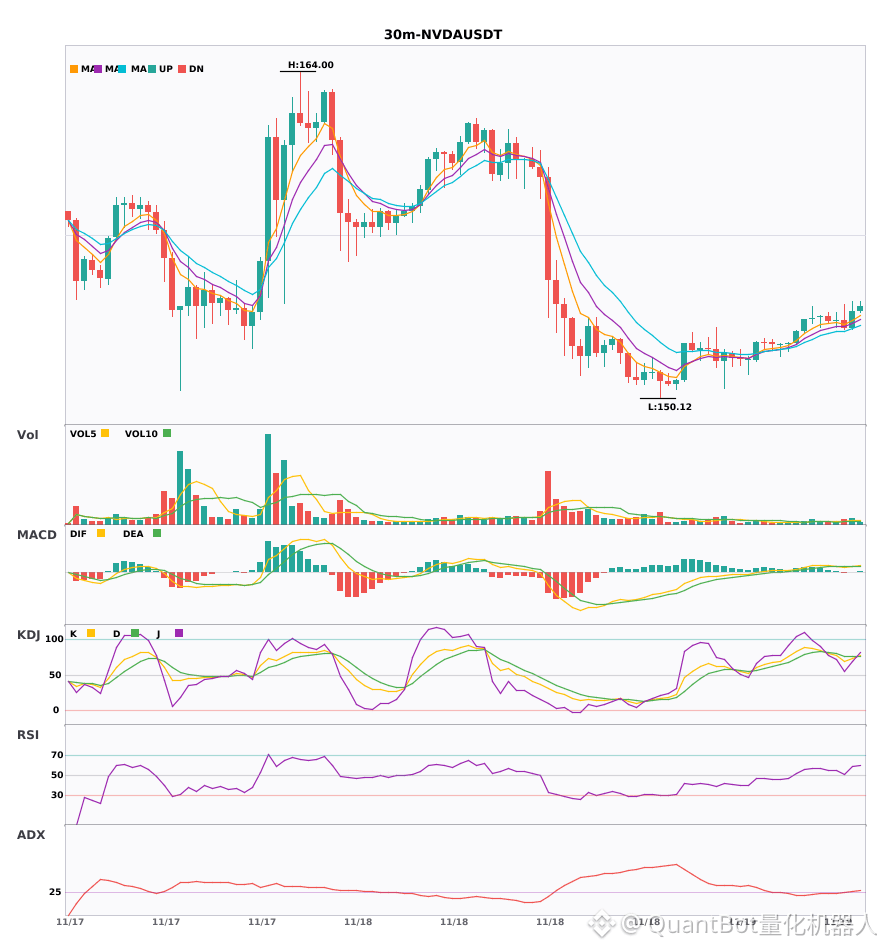
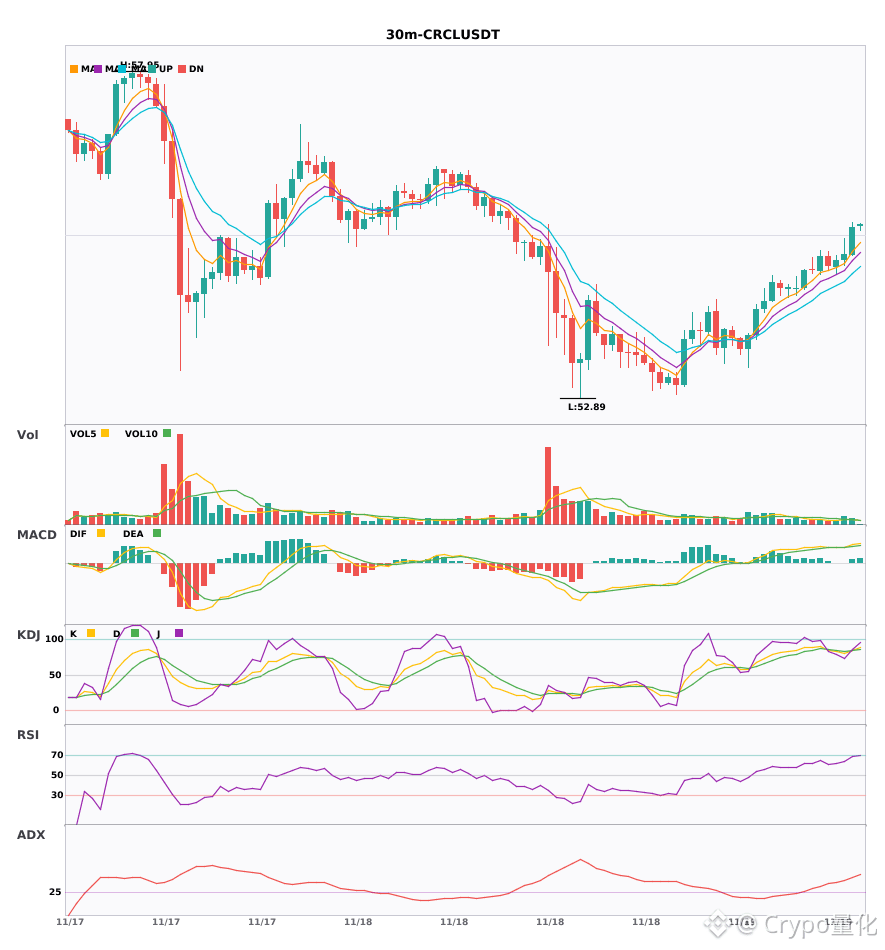
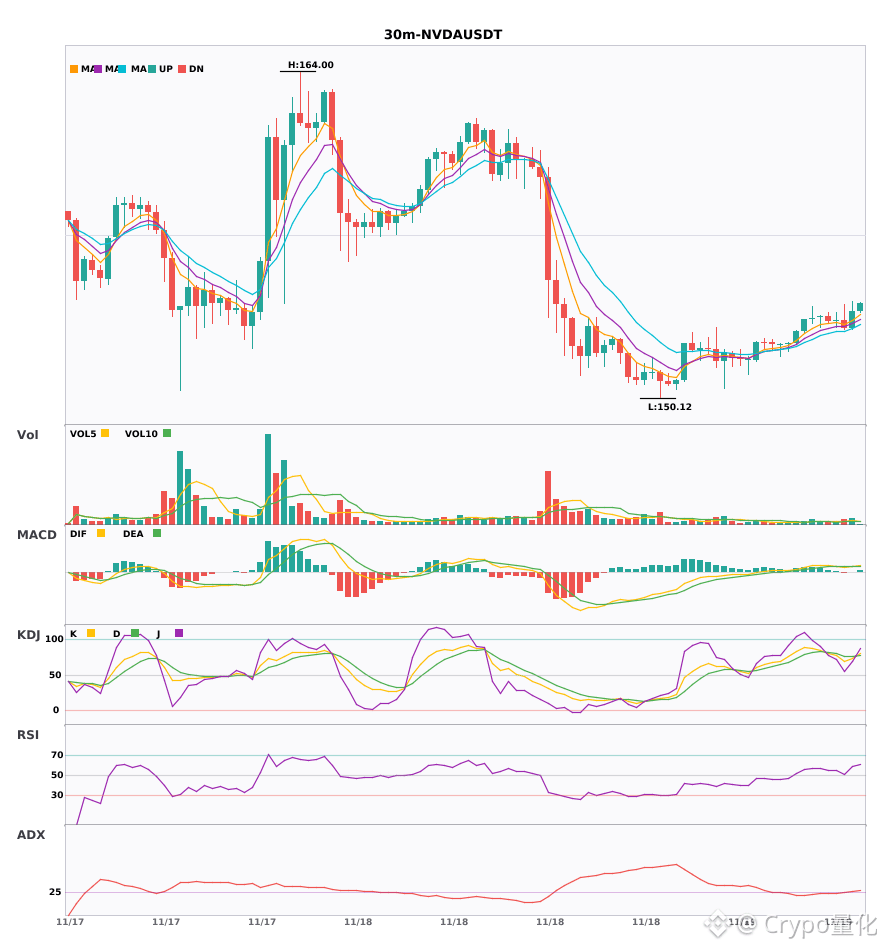
$NVDL/$CRCL/$NVDA 30m bullish convergence, short-term outlook bullish
📈 $NVDL | 30-minute bullish signal
━━━━━━━━━━━━━━━━━━
Technical analysis: ADX(27) shows an emerging trend, making this worth considering; MACD has formed a golden cross above the zero line, with strengthening bullish momentum; EMA5>EMA8>EMA13, in a bullish alignment; KDJ is running at high levels (K72.4/D74.4), with bulls in control; volume has increased by approximately 1.9x.
Price change: 0.8300%
📈 $CRCL | 30-minute bullish signal
━━━━━━━━━━━━━━━━━━
Technical analysis: ADX(48) indicates an extremely strong trend; beware of a pullback; MACD golden cross above zero; bullish EMA alignment; KDJ golden cross (84.5/83.7); volume up 1.5x.
Price change: 0.7600%
📈 $NVDA | 30-minute bullish signal
━━━━━━━━━━━━━━━━━━
Technical analysis: ADX(29) confirms the trend, making this worth considering; MACD golden cross above zero, with momentum being released; EMA5>8>13 bullish alignment; KDJ is strong (K73.1/D75.3); volume up 1.9x.
Price change: 0.4800%
━━━━━━━━━━━━━━━━━━
#技术分析 #NVDL #CRCL #NVDA
📌 The above content is for reference only and does not constitute investment advice
$NVDL /$CRCL /$NVDA 30m bullish convergence, short-term outlook bullish
📈 $NVDL | 30-minute bullish signal
━━━━━━━━━━━━━━━━━━
Technical analysis: ADX(27) shows an emerging trend, making this worth considering; MACD has formed a golden cross above the zero line, with strengthening bullish momentum; EMA5>EMA8>EMA13, in a bullish alignment; KDJ is running at high levels (K72.4/D74.4), with bulls in control; volume has increased by approximately 1.9x.
Price change: 0.8300%
📈 $CRCL | 30-minute bullish signal
━━━━━━━━━━━━━━━━━━
Technical analysis: ADX(48) indicates an extremely strong trend; beware of a pullback; MACD golden cross above zero; bullish EMA alignment; KDJ golden cross (84.5/83.7); volume up 1.5x.
Price change: 0.7600%
📈 $NVDA | 30-minute bullish signal
━━━━━━━━━━━━━━━━━━
Technical analysis: ADX(29) confirms the trend, making this worth considering; MACD golden cross above zero, with momentum being released; EMA5>8>13 bullish alignment; KDJ is strong (K73.1/D75.3); volume up 1.9x.
Price change: 0.4800%
━━━━━━━━━━━━━━━━━━
#技术分析 #NVDL #CRCL #NVDA
📌 The above content is for reference only and does not constitute investment advice
📈 $NVDL | 30-minute bullish signal
━━━━━━━━━━━━━━━━━━
Technical analysis: ADX(27) shows an emerging trend, making this worth considering; MACD has formed a golden cross above the zero line, with strengthening bullish momentum; EMA5>EMA8>EMA13, in a bullish alignment; KDJ is running at high levels (K72.4/D74.4), with bulls in control; volume has increased by approximately 1.9x.
Price change: 0.8300%
📈 $CRCL | 30-minute bullish signal
━━━━━━━━━━━━━━━━━━
Technical analysis: ADX(48) indicates an extremely strong trend; beware of a pullback; MACD golden cross above zero; bullish EMA alignment; KDJ golden cross (84.5/83.7); volume up 1.5x.
Price change: 0.7600%
📈 $NVDA | 30-minute bullish signal
━━━━━━━━━━━━━━━━━━
Technical analysis: ADX(29) confirms the trend, making this worth considering; MACD golden cross above zero, with momentum being released; EMA5>8>13 bullish alignment; KDJ is strong (K73.1/D75.3); volume up 1.9x.
Price change: 0.4800%
━━━━━━━━━━━━━━━━━━
#技术分析 #NVDL #CRCL #NVDA
📌 The above content is for reference only and does not constitute investment advice
7

·
--
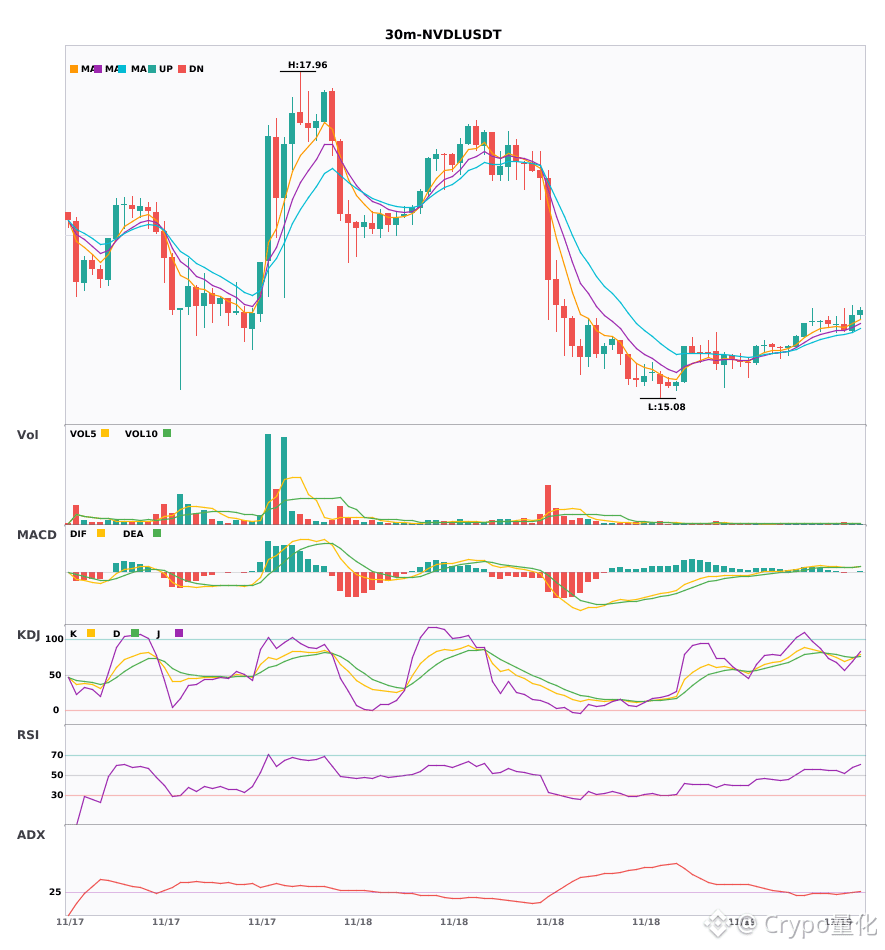
$NVDL/$CRCL/$NVDA 30-minute triple bullish signals all appear 🔥
════════════════════
🔴 $NVDL 30-minute bullish signal
⚠️Technical analysis: ADX shows the trend is just getting started, so there may be an opportunity to participate | MACD bullish crossover with rising volume; the red bars continue to grow | Moving averages are aligned bullishly and diverging upward | KDJ is strong, with K crossing above D and not yet in overbought territory | Trading volume is up 1.9x
════════════════════
🔴 $CRCL 30-minute bullish signal
⚠️Technical analysis: ADX 48 indicates a very strong trend, but beware of overheating and a pullback; MACD bullish crossover above zero, with red bars continuing to grow; moving averages are aligned bullishly and diverging upward; KDJ bullish crossover signals strength, with volume up 1.5x.
════════════════════
🔴 $NVDA 30-minute bullish signal
⚠️Technical analysis: MACD bullish crossover above zero with rising volume; moving averages have just formed a bullish alignment and are diverging upward; KDJ shows strong bullish momentum at high levels; trading volume is up about 1.9x. The trend is taking shape, so there may be an opportunity to participate.
════════════════════
🔔 Follow for first-hand market activity alerts 🔔
#技术分析 #NVDL #CRCL #NVDA
📌 When trading, pay attention to whether the candlestick patterns align
$NVDL /$CRCL /$NVDA 30-minute triple bullish signals all appear 🔥
════════════════════
🔴 $NVDL 30-minute bullish signal
⚠️Technical analysis: ADX shows the trend is just getting started, so there may be an opportunity to participate | MACD bullish crossover with rising volume; the red bars continue to grow | Moving averages are aligned bullishly and diverging upward | KDJ is strong, with K crossing above D and not yet in overbought territory | Trading volume is up 1.9x
════════════════════
🔴 $CRCL 30-minute bullish signal
⚠️Technical analysis: ADX 48 indicates a very strong trend, but beware of overheating and a pullback; MACD bullish crossover above zero, with red bars continuing to grow; moving averages are aligned bullishly and diverging upward; KDJ bullish crossover signals strength, with volume up 1.5x.
════════════════════
🔴 $NVDA 30-minute bullish signal
⚠️Technical analysis: MACD bullish crossover above zero with rising volume; moving averages have just formed a bullish alignment and are diverging upward; KDJ shows strong bullish momentum at high levels; trading volume is up about 1.9x. The trend is taking shape, so there may be an opportunity to participate.
════════════════════
🔔 Follow for first-hand market activity alerts 🔔
#技术分析 #NVDL #CRCL #NVDA
📌 When trading, pay attention to whether the candlestick patterns align
════════════════════
🔴 $NVDL 30-minute bullish signal
⚠️Technical analysis: ADX shows the trend is just getting started, so there may be an opportunity to participate | MACD bullish crossover with rising volume; the red bars continue to grow | Moving averages are aligned bullishly and diverging upward | KDJ is strong, with K crossing above D and not yet in overbought territory | Trading volume is up 1.9x
════════════════════
🔴 $CRCL 30-minute bullish signal
⚠️Technical analysis: ADX 48 indicates a very strong trend, but beware of overheating and a pullback; MACD bullish crossover above zero, with red bars continuing to grow; moving averages are aligned bullishly and diverging upward; KDJ bullish crossover signals strength, with volume up 1.5x.
════════════════════
🔴 $NVDA 30-minute bullish signal
⚠️Technical analysis: MACD bullish crossover above zero with rising volume; moving averages have just formed a bullish alignment and are diverging upward; KDJ shows strong bullish momentum at high levels; trading volume is up about 1.9x. The trend is taking shape, so there may be an opportunity to participate.
════════════════════
🔔 Follow for first-hand market activity alerts 🔔
#技术分析 #NVDL #CRCL #NVDA
📌 When trading, pay attention to whether the candlestick patterns align
12

·
--
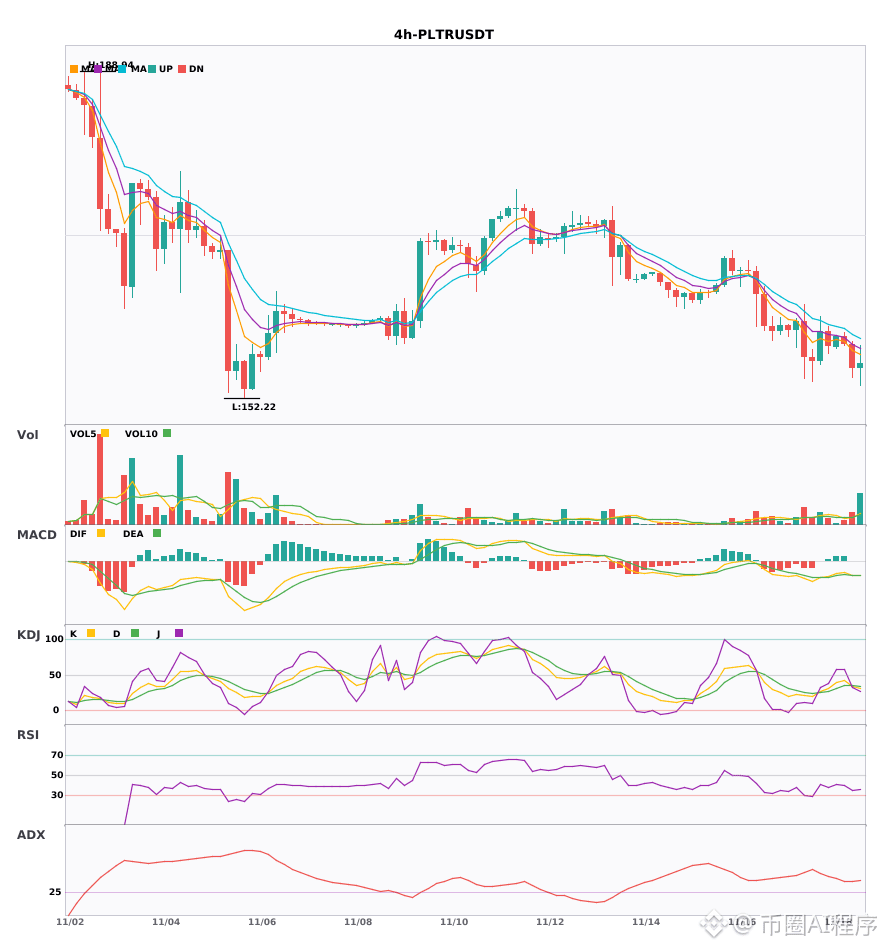
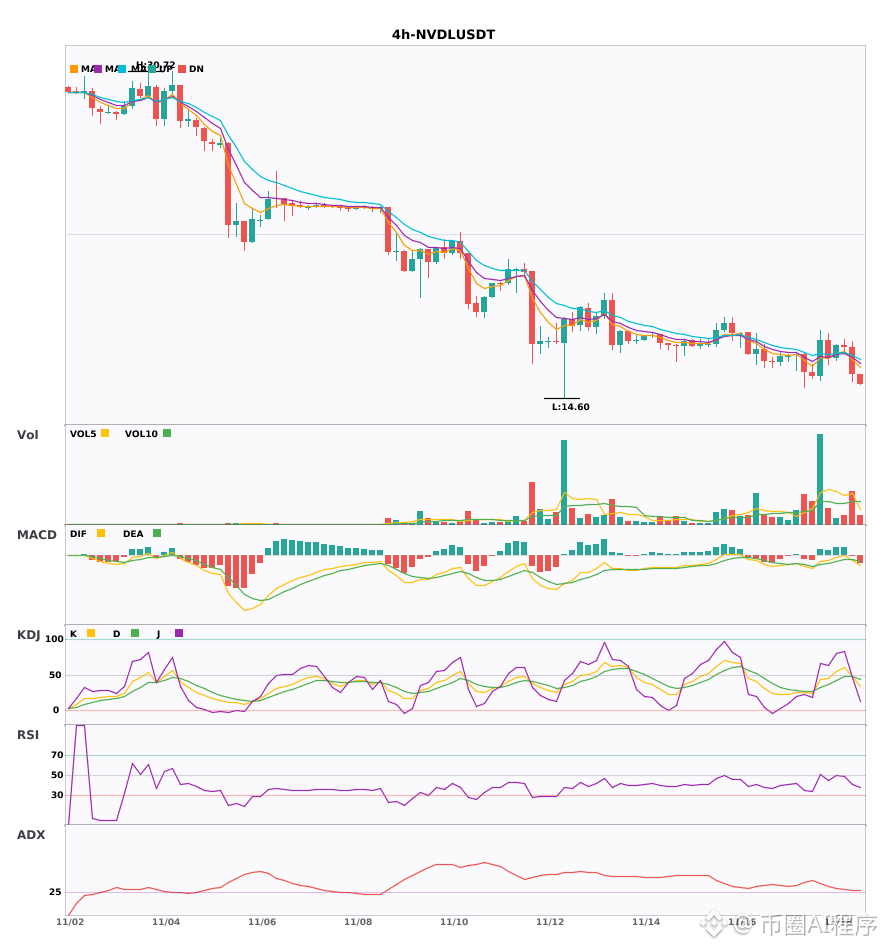
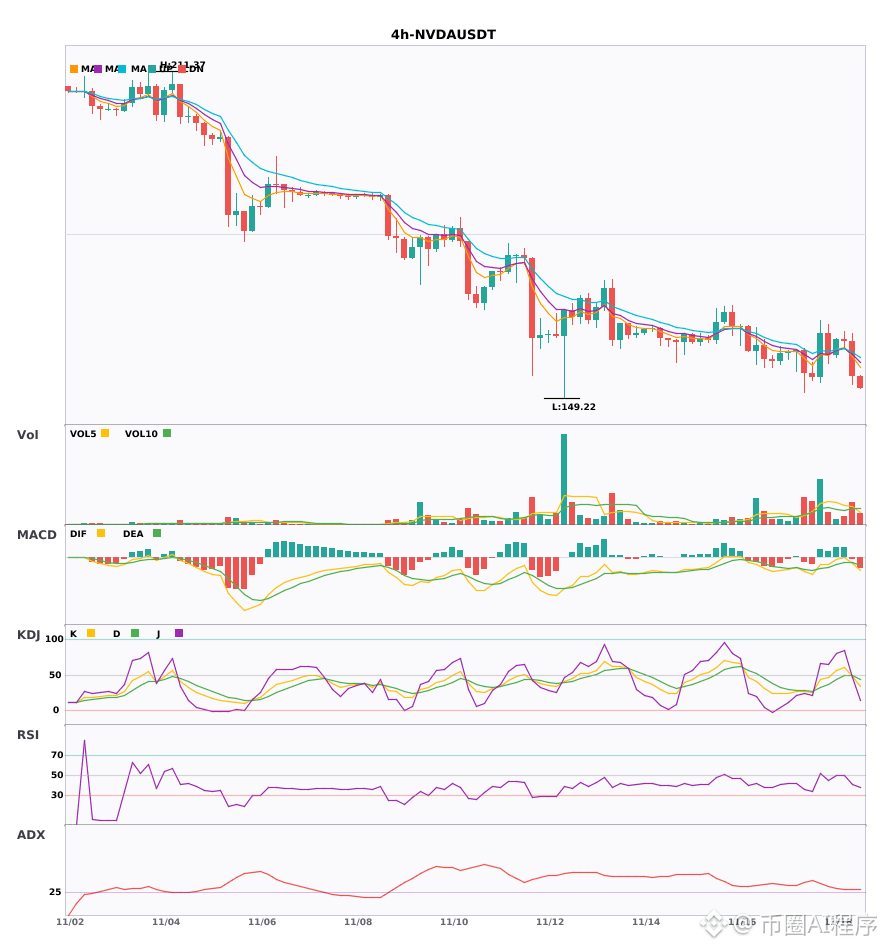
$PLTR/$NVDL/$NVDA 4-hour short signal emerged; daily bearish trend confirmed 🔥
════════════════════
🟢 $PLTR 4-hour bearish signal
⚠️Technical analysis: The 4-hour MACD has formed a death cross below zero with rising volume and is moving downward. The moving averages are bearishly aligned and diverging downward. The KDJ has formed a death cross but is not yet oversold. Combined with confirmation from the daily bearish trend, the short-term outlook is bearish.
════════════════════
🟢 $NVDL 4-hour bearish signal
⚠️Technical analysis: 4-hour bearish signal, confirmed by the daily bearish trend! The MACD death cross comes with rising volume; the moving averages are bearishly aligned and diverging downward. The KDJ has formed a death cross but is not oversold, and trading volume is increasing moderately. Short-term short position.
════════════════════
🟢 $NVDA 4-hour bearish signal
⚠️Technical analysis: 4-hour entry + confirmation from the daily bearish trend! The MACD death cross is accelerating bearish momentum, the moving averages are bearishly aligned, and the KDJ has formed a death cross but is not oversold. Volume is normal.
════════════════════
🔔 Follow for first-hand market alerts 🔔
#多周期共振 #PLTR #NVDL #NVDA
📌 When trading, pay attention to whether the candlestick pattern aligns
$PLTR /$NVDL /$NVDA 4-hour short signal emerged; daily bearish trend confirmed 🔥
════════════════════
🟢 $PLTR 4-hour bearish signal
⚠️Technical analysis: The 4-hour MACD has formed a death cross below zero with rising volume and is moving downward. The moving averages are bearishly aligned and diverging downward. The KDJ has formed a death cross but is not yet oversold. Combined with confirmation from the daily bearish trend, the short-term outlook is bearish.
════════════════════
🟢 $NVDL 4-hour bearish signal
⚠️Technical analysis: 4-hour bearish signal, confirmed by the daily bearish trend! The MACD death cross comes with rising volume; the moving averages are bearishly aligned and diverging downward. The KDJ has formed a death cross but is not oversold, and trading volume is increasing moderately. Short-term short position.
════════════════════
🟢 $NVDA 4-hour bearish signal
⚠️Technical analysis: 4-hour entry + confirmation from the daily bearish trend! The MACD death cross is accelerating bearish momentum, the moving averages are bearishly aligned, and the KDJ has formed a death cross but is not oversold. Volume is normal.
════════════════════
🔔 Follow for first-hand market alerts 🔔
#多周期共振 #PLTR #NVDL #NVDA
📌 When trading, pay attention to whether the candlestick pattern aligns
════════════════════
🟢 $PLTR 4-hour bearish signal
⚠️Technical analysis: The 4-hour MACD has formed a death cross below zero with rising volume and is moving downward. The moving averages are bearishly aligned and diverging downward. The KDJ has formed a death cross but is not yet oversold. Combined with confirmation from the daily bearish trend, the short-term outlook is bearish.
════════════════════
🟢 $NVDL 4-hour bearish signal
⚠️Technical analysis: 4-hour bearish signal, confirmed by the daily bearish trend! The MACD death cross comes with rising volume; the moving averages are bearishly aligned and diverging downward. The KDJ has formed a death cross but is not oversold, and trading volume is increasing moderately. Short-term short position.
════════════════════
🟢 $NVDA 4-hour bearish signal
⚠️Technical analysis: 4-hour entry + confirmation from the daily bearish trend! The MACD death cross is accelerating bearish momentum, the moving averages are bearishly aligned, and the KDJ has formed a death cross but is not oversold. Volume is normal.
════════════════════
🔔 Follow for first-hand market alerts 🔔
#多周期共振 #PLTR #NVDL #NVDA
📌 When trading, pay attention to whether the candlestick pattern aligns
5

·
--
NVDL Binance TradFi Perpetual (traditional finance), closed at +5.82% over 5m at 05:25 on 2026-11-18 Beijing time. At the observation time of 05:25:01 on 2026-11-18 Beijing time, the current price was 16.99, 24h volume was 25.1448 million, above VWAP 16.1767, with volume at 11.4x. My view is simple: I wouldn’t treat it as a breakout before confirmation, but strong support makes it worth keeping an eye on.
Can it hold VWAP 16.1767 on a pullback, and can volume remain elevated after expanding to 11.4x? Don’t just look at whether it moved; look at whether it held its ground afterward.
Note: This is a TradFi perpetual, with higher liquidity and gap risks outside trading hours.
#NVDL #Unusual Move Alert
NVDL Binance TradFi Perpetual (traditional finance), closed at +5.82% over 5m at 05:25 on 2026-11-18 Beijing time. At the observation time of 05:25:01 on 2026-11-18 Beijing time, the current price was 16.99, 24h volume was 25.1448 million, above VWAP 16.1767, with volume at 11.4x. My view is simple: I wouldn’t treat it as a breakout before confirmation, but strong support makes it worth keeping an eye on.
Can it hold VWAP 16.1767 on a pullback, and can volume remain elevated after expanding to 11.4x? Don’t just look at whether it moved; look at whether it held its ground afterward.
Note: This is a TradFi perpetual, with higher liquidity and gap risks outside trading hours.
#NVDL #Unusual Move Alert
Can it hold VWAP 16.1767 on a pullback, and can volume remain elevated after expanding to 11.4x? Don’t just look at whether it moved; look at whether it held its ground afterward.
Note: This is a TradFi perpetual, with higher liquidity and gap risks outside trading hours.
#NVDL #Unusual Move Alert
2

·
--
📊 Real-time monitoring of unusual movements across Binance-listed coins
Covering unusual long-side movements, short-side movements, and sudden wick movements
🛠 Custom services available · Seeking partners
📈 NVDLUSDT steady rise alert
Trading pair: $NVDLUSDT (perpetual contract)
90-minute increase: 8.12% 📈
Current price: 16.92000000 USDT
Funding rate: 0.0299%
Detected at: 2026-11-18 05:20:13
Previous unusual surge: 2026-11-13 01:42:09 (123.6 hours ago)
📊 Trading volume changes
1h volume / 24h average: 2.86x ➡️
1h volume: 0.254 × 10 million USDT
24h volume: 2.130 × 10 million USDT
📊 Open interest changes
Change in contract open interest: 1.10x 📈
Current contract open interest: 0.187 × 10 million USDT
Contract open interest 1h ago: 0.170 × 10 million USDT
⚖️ Long/short ratio
Current long/short ratio / 1h ago: 1.0100x 📈
Current large-trader position long/short ratio: 1.03
Large-trader position long/short ratio 1h ago: 1.02
⏱ First unusual surge in two days
First unusual surge in three days
#NVDL #USDT #合约 #UnusualMovementMonitoring
📊 Real-time monitoring of unusual movements across Binance-listed coins
Covering unusual long-side movements, short-side movements, and sudden wick movements
🛠 Custom services available · Seeking partners
📈 NVDLUSDT steady rise alert
Trading pair: $NVDLUSDT (perpetual contract)
90-minute increase: 8.12% 📈
Current price: 16.92000000 USDT
Funding rate: 0.0299%
Detected at: 2026-11-18 05:20:13
Previous unusual surge: 2026-11-13 01:42:09 (123.6 hours ago)
📊 Trading volume changes
1h volume / 24h average: 2.86x ➡️
1h volume: 0.254 × 10 million USDT
24h volume: 2.130 × 10 million USDT
📊 Open interest changes
Change in contract open interest: 1.10x 📈
Current contract open interest: 0.187 × 10 million USDT
Contract open interest 1h ago: 0.170 × 10 million USDT
⚖️ Long/short ratio
Current long/short ratio / 1h ago: 1.0100x 📈
Current large-trader position long/short ratio: 1.03
Large-trader position long/short ratio 1h ago: 1.02
⏱ First unusual surge in two days
First unusual surge in three days
#NVDL #USDT #合约 #UnusualMovementMonitoring
Covering unusual long-side movements, short-side movements, and sudden wick movements
🛠 Custom services available · Seeking partners
📈 NVDLUSDT steady rise alert
Trading pair: $NVDLUSDT (perpetual contract)
90-minute increase: 8.12% 📈
Current price: 16.92000000 USDT
Funding rate: 0.0299%
Detected at: 2026-11-18 05:20:13
Previous unusual surge: 2026-11-13 01:42:09 (123.6 hours ago)
📊 Trading volume changes
1h volume / 24h average: 2.86x ➡️
1h volume: 0.254 × 10 million USDT
24h volume: 2.130 × 10 million USDT
📊 Open interest changes
Change in contract open interest: 1.10x 📈
Current contract open interest: 0.187 × 10 million USDT
Contract open interest 1h ago: 0.170 × 10 million USDT
⚖️ Long/short ratio
Current long/short ratio / 1h ago: 1.0100x 📈
Current large-trader position long/short ratio: 1.03
Large-trader position long/short ratio 1h ago: 1.02
⏱ First unusual surge in two days
First unusual surge in three days
#NVDL #USDT #合约 #UnusualMovementMonitoring
20
·
--
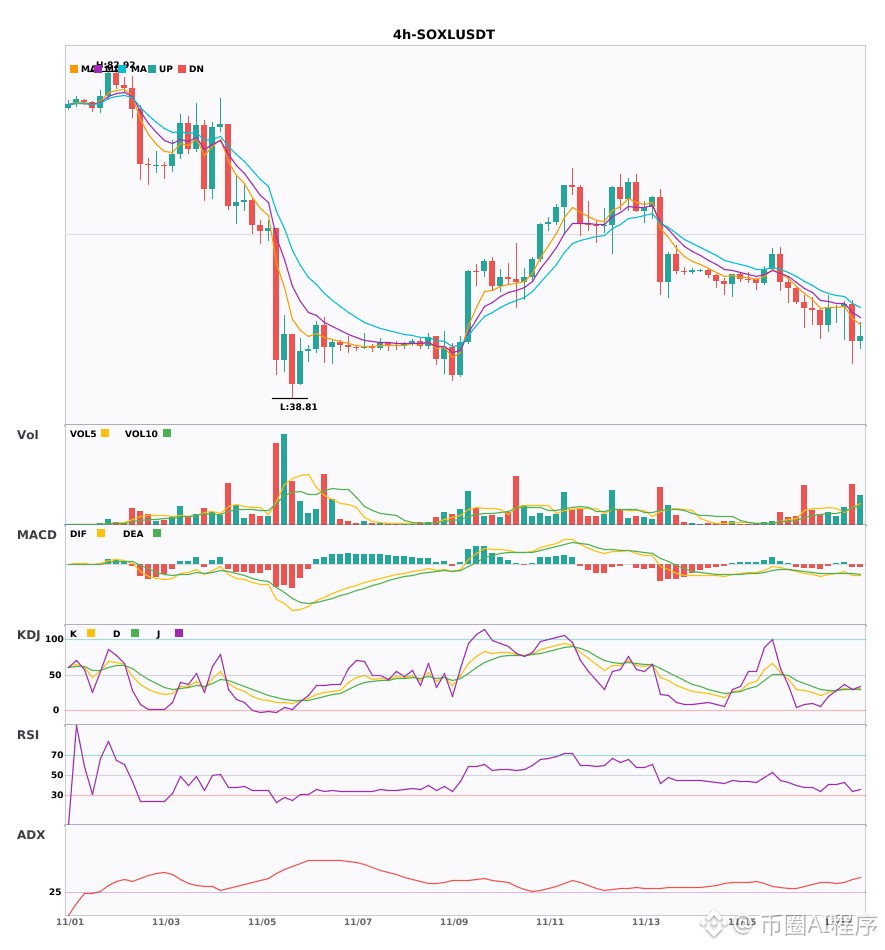
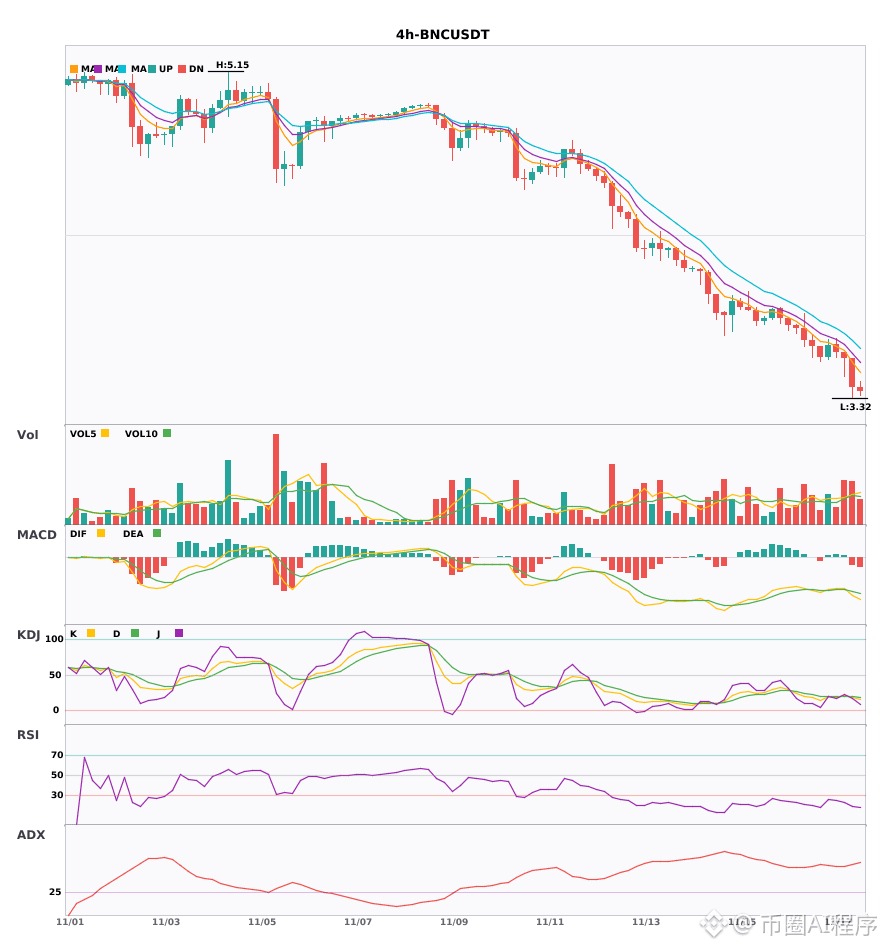
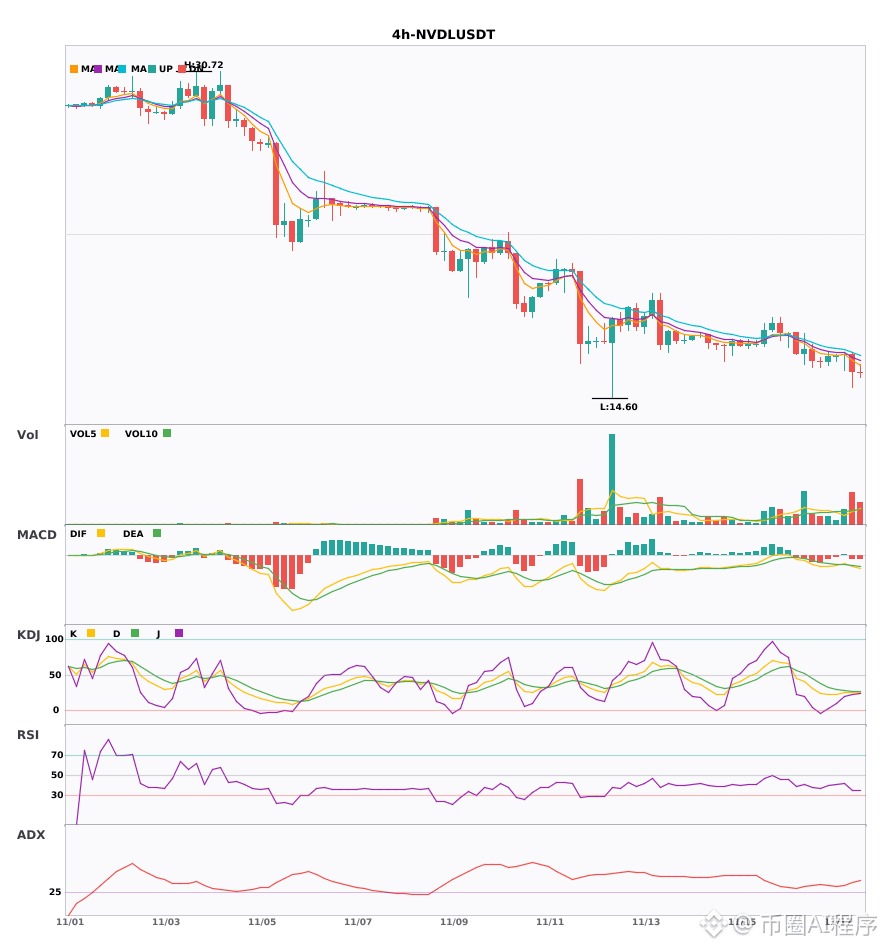
$SOXL $BNC $NVDL 4-hour bears are emerging, and the daily-chart bearish trend is confirmed 🔥
════════════════════
🟢 $SOXL 4-hour bearish signal
⚠️Technical analysis: Bearish confluence across multiple timeframes: 4-hour entry + confirmation from the daily bearish trend. MACD bearish crossover with expanding green bars; moving averages bearishly aligned and trending down; KDJ bearish crossover, not yet oversold; volume up 2.4x. Short-term outlook is bearish.
════════════════════
🟢 $BNC 4-hour bearish signal
⚠️Technical analysis: Daily + 4-hour bearish confluence confirmed, with multiple timeframes aligned to the downside. 4-hour MACD bearish crossover on rising volume, with green bars continuing to expand; moving averages bearishly aligned and diverging downward; KDJ bearish crossover and not yet in oversold territory; volume up 1.7x. Short-term outlook is bearish.
════════════════════
🟢 $NVDL 4-hour bearish signal
⚠️Technical analysis: Bearish confluence across multiple timeframes: 4-hour entry; MACD bearish crossover below zero, accelerating the downtrend; moving averages bearishly aligned and trending down; weak K crossing below D; daily bearish confluence confirmed; volume up 2.2x.
════════════════════
🔔 Follow for first-hand updates on unusual market movements 🔔
#多周期共振 #SOXL #BNC #NVDL
📌 When trading, check whether the candlestick pattern meets the criteria.
$SOXL $BNC $NVDL 4-hour bears are emerging, and the daily-chart bearish trend is confirmed 🔥
════════════════════
🟢 $SOXL 4-hour bearish signal
⚠️Technical analysis: Bearish confluence across multiple timeframes: 4-hour entry + confirmation from the daily bearish trend. MACD bearish crossover with expanding green bars; moving averages bearishly aligned and trending down; KDJ bearish crossover, not yet oversold; volume up 2.4x. Short-term outlook is bearish.
════════════════════
🟢 $BNC 4-hour bearish signal
⚠️Technical analysis: Daily + 4-hour bearish confluence confirmed, with multiple timeframes aligned to the downside. 4-hour MACD bearish crossover on rising volume, with green bars continuing to expand; moving averages bearishly aligned and diverging downward; KDJ bearish crossover and not yet in oversold territory; volume up 1.7x. Short-term outlook is bearish.
════════════════════
🟢 $NVDL 4-hour bearish signal
⚠️Technical analysis: Bearish confluence across multiple timeframes: 4-hour entry; MACD bearish crossover below zero, accelerating the downtrend; moving averages bearishly aligned and trending down; weak K crossing below D; daily bearish confluence confirmed; volume up 2.2x.
════════════════════
🔔 Follow for first-hand updates on unusual market movements 🔔
#多周期共振 #SOXL #BNC #NVDL
📌 When trading, check whether the candlestick pattern meets the criteria.
════════════════════
🟢 $SOXL 4-hour bearish signal
⚠️Technical analysis: Bearish confluence across multiple timeframes: 4-hour entry + confirmation from the daily bearish trend. MACD bearish crossover with expanding green bars; moving averages bearishly aligned and trending down; KDJ bearish crossover, not yet oversold; volume up 2.4x. Short-term outlook is bearish.
════════════════════
🟢 $BNC 4-hour bearish signal
⚠️Technical analysis: Daily + 4-hour bearish confluence confirmed, with multiple timeframes aligned to the downside. 4-hour MACD bearish crossover on rising volume, with green bars continuing to expand; moving averages bearishly aligned and diverging downward; KDJ bearish crossover and not yet in oversold territory; volume up 1.7x. Short-term outlook is bearish.
════════════════════
🟢 $NVDL 4-hour bearish signal
⚠️Technical analysis: Bearish confluence across multiple timeframes: 4-hour entry; MACD bearish crossover below zero, accelerating the downtrend; moving averages bearishly aligned and trending down; weak K crossing below D; daily bearish confluence confirmed; volume up 2.2x.
════════════════════
🔔 Follow for first-hand updates on unusual market movements 🔔
#多周期共振 #SOXL #BNC #NVDL
📌 When trading, check whether the candlestick pattern meets the criteria.
22
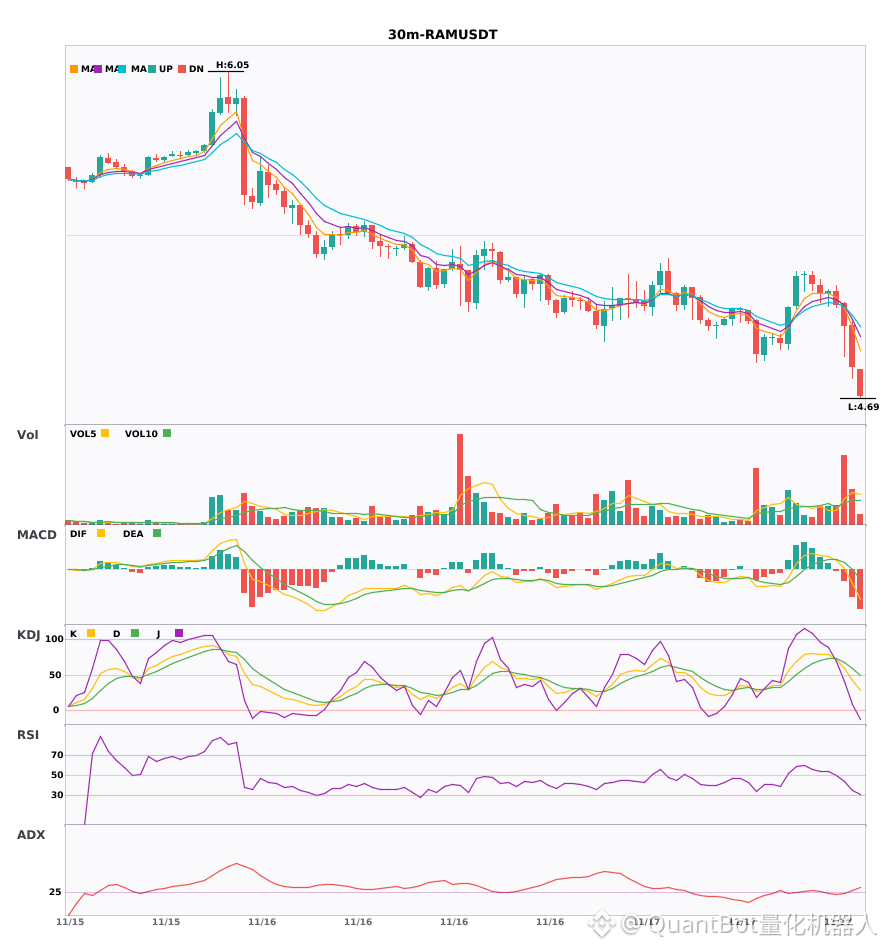
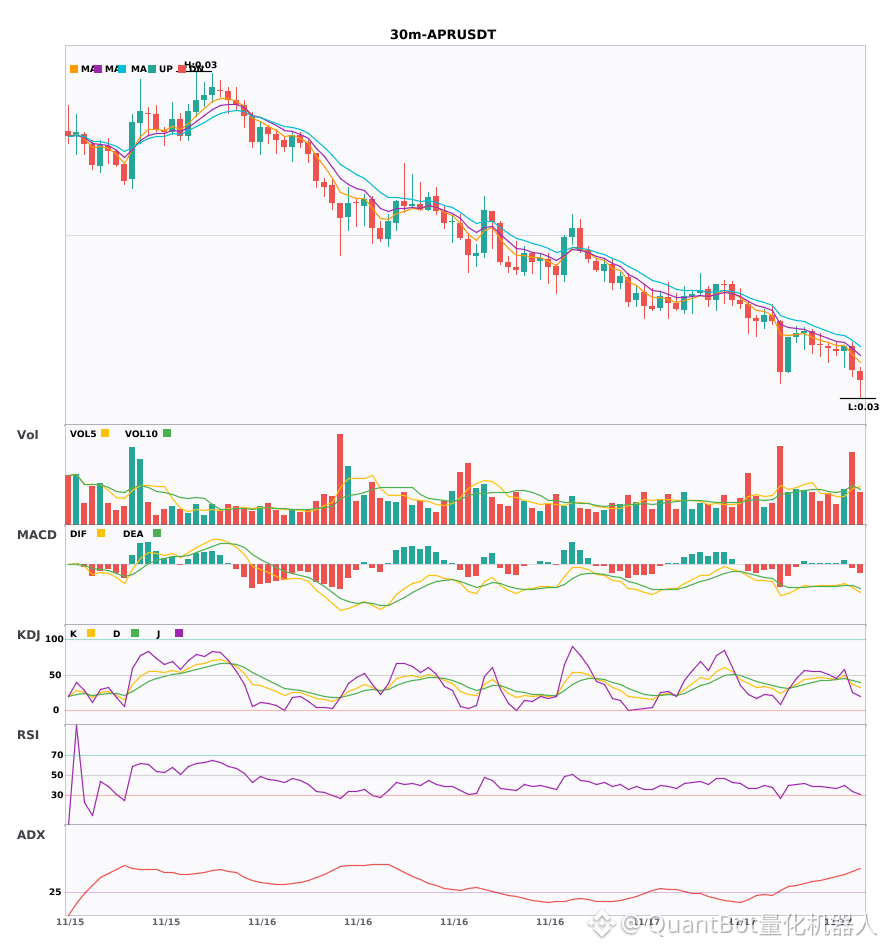
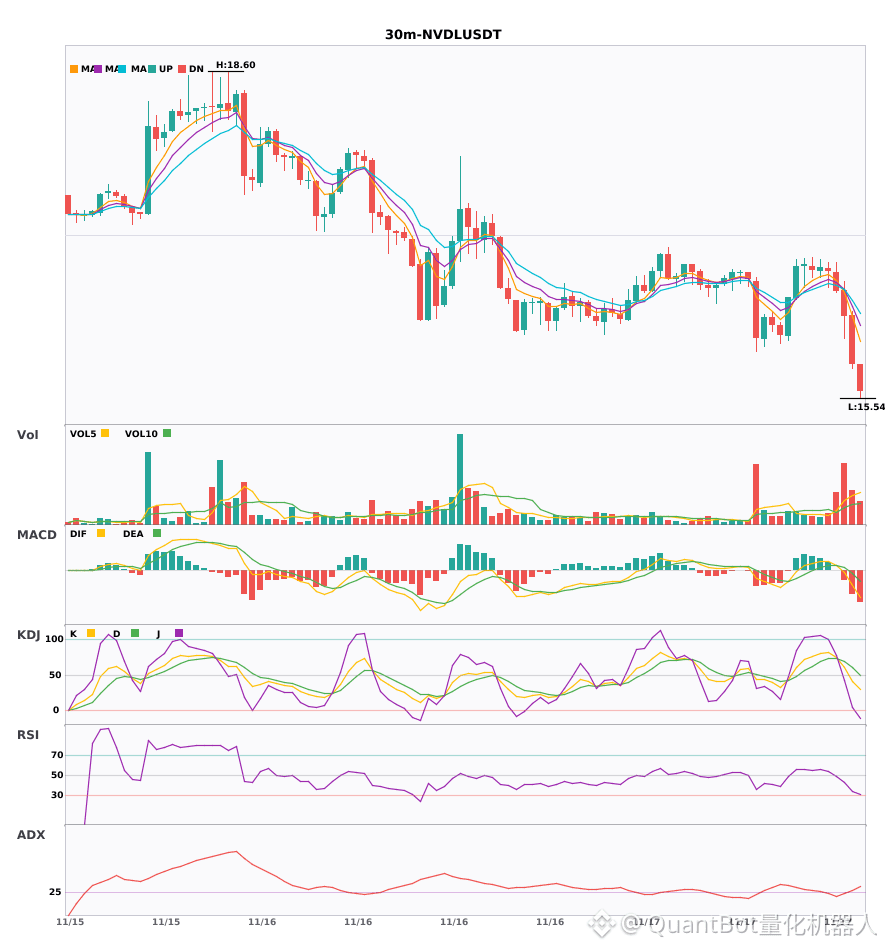
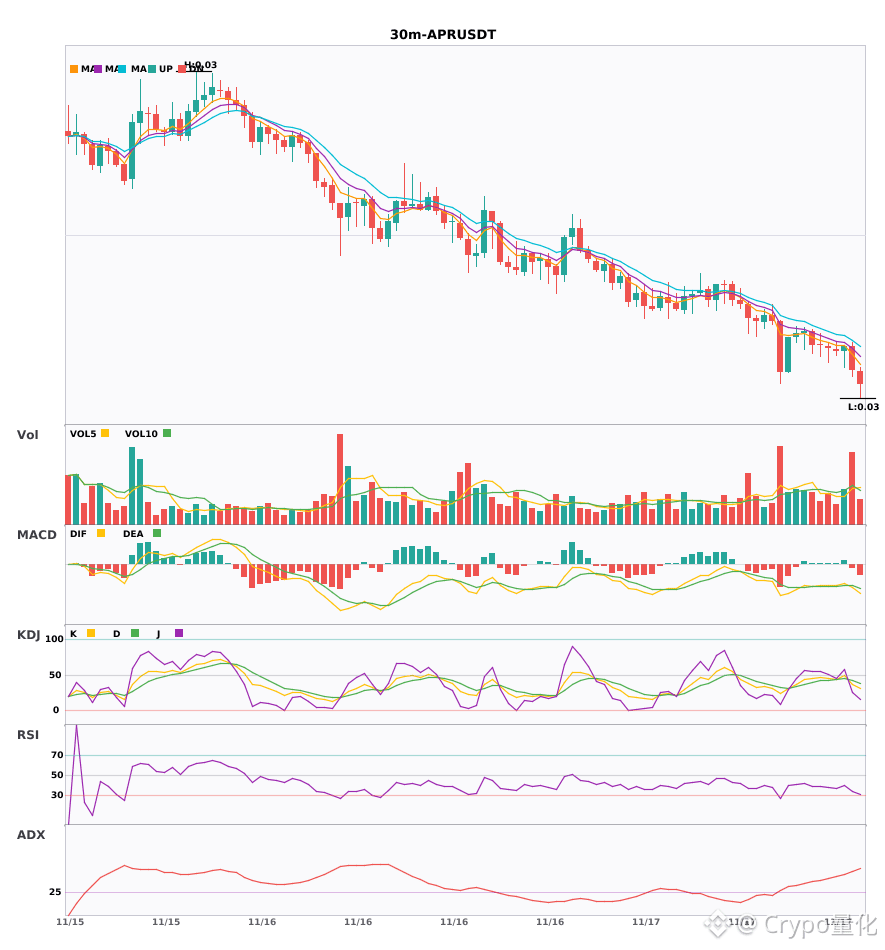
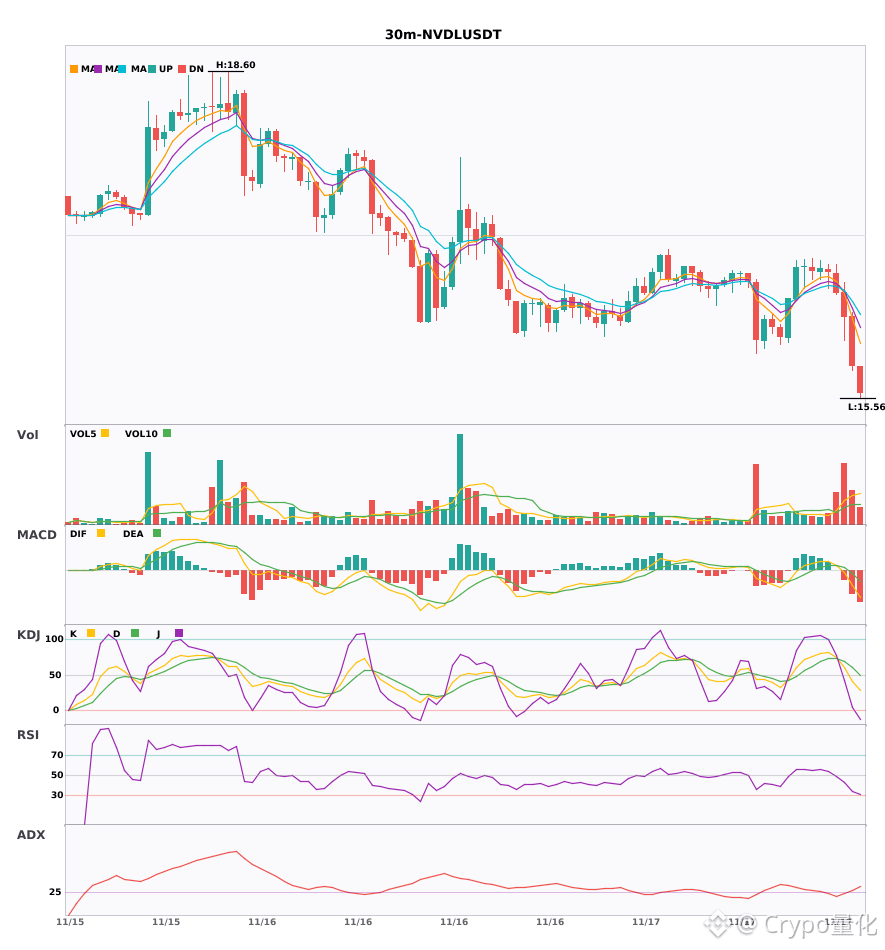
30-minute timeframe short signals for three coins: $RAM/$APR/$NVDL
📉 $RAM | 30-minute Short Signal
━━━━━━━━━━━━━━━━━━
Technical Analysis: ADX(30) shows an emerging trend, presenting an opportunity to enter; MACD DIF crosses below the zero line, turning bearish; EMA5/8/13 are in bearish alignment; trading volume increases 3.1x.
Price Change: -3.3700%
📉 $APR | 30-minute Short Signal
━━━━━━━━━━━━━━━━━━
Technical Analysis: ADX(52) indicates extremely strong trend momentum; beware of an overheated pullback; MACD bearish cross below zero, with strengthening bearish momentum; EMA5<8<13 are in bearish alignment; KDJ bearish cross (K36.7/D42.4) signals a short-term bearish bias; volume increases 1.8x.
Price Change: -1.2900%
📌 Market Update: MyShell (SHELL) airdrop continues: Binance announced its second HODLer Airdrop. Users with a history of BNB Simple Earn subscriptions can receive SHELL, and SHELL locked products offer annualized returns of up to 29.9%.
📉 $NVDL | 30-minute Short Signal
━━━━━━━━━━━━━━━━━━
Technical Analysis: ADX(25) indicates a developing trend suitable for participation; MACD DIF breaks below the zero line, turning bearish; EMA5/8 bearish cross; KDJ bearish cross (K60.2/D69.1) signals a bearish outlook; volume increases 3.5x.
Price Change: -1.3900%
━━━━━━━━━━━━━━━━━━
#技术分析 #RAM #APR #NVDL
📌 The above content is for reference only and does not constitute investment advice
30-minute timeframe short signals for three coins: $RAM /$APR /$NVDL
📉 $RAM | 30-minute Short Signal
━━━━━━━━━━━━━━━━━━
Technical Analysis: ADX(30) shows an emerging trend, presenting an opportunity to enter; MACD DIF crosses below the zero line, turning bearish; EMA5/8/13 are in bearish alignment; trading volume increases 3.1x.
Price Change: -3.3700%
📉 $APR | 30-minute Short Signal
━━━━━━━━━━━━━━━━━━
Technical Analysis: ADX(52) indicates extremely strong trend momentum; beware of an overheated pullback; MACD bearish cross below zero, with strengthening bearish momentum; EMA5<8<13 are in bearish alignment; KDJ bearish cross (K36.7/D42.4) signals a short-term bearish bias; volume increases 1.8x.
Price Change: -1.2900%
📌 Market Update: MyShell (SHELL) airdrop continues: Binance announced its second HODLer Airdrop. Users with a history of BNB Simple Earn subscriptions can receive SHELL, and SHELL locked products offer annualized returns of up to 29.9%.
📉 $NVDL | 30-minute Short Signal
━━━━━━━━━━━━━━━━━━
Technical Analysis: ADX(25) indicates a developing trend suitable for participation; MACD DIF breaks below the zero line, turning bearish; EMA5/8 bearish cross; KDJ bearish cross (K60.2/D69.1) signals a bearish outlook; volume increases 3.5x.
Price Change: -1.3900%
━━━━━━━━━━━━━━━━━━
#技术分析 #RAM #APR #NVDL
📌 The above content is for reference only and does not constitute investment advice
📉 $RAM | 30-minute Short Signal
━━━━━━━━━━━━━━━━━━
Technical Analysis: ADX(30) shows an emerging trend, presenting an opportunity to enter; MACD DIF crosses below the zero line, turning bearish; EMA5/8/13 are in bearish alignment; trading volume increases 3.1x.
Price Change: -3.3700%
📉 $APR | 30-minute Short Signal
━━━━━━━━━━━━━━━━━━
Technical Analysis: ADX(52) indicates extremely strong trend momentum; beware of an overheated pullback; MACD bearish cross below zero, with strengthening bearish momentum; EMA5<8<13 are in bearish alignment; KDJ bearish cross (K36.7/D42.4) signals a short-term bearish bias; volume increases 1.8x.
Price Change: -1.2900%
📌 Market Update: MyShell (SHELL) airdrop continues: Binance announced its second HODLer Airdrop. Users with a history of BNB Simple Earn subscriptions can receive SHELL, and SHELL locked products offer annualized returns of up to 29.9%.
📉 $NVDL | 30-minute Short Signal
━━━━━━━━━━━━━━━━━━
Technical Analysis: ADX(25) indicates a developing trend suitable for participation; MACD DIF breaks below the zero line, turning bearish; EMA5/8 bearish cross; KDJ bearish cross (K60.2/D69.1) signals a bearish outlook; volume increases 3.5x.
Price Change: -1.3900%
━━━━━━━━━━━━━━━━━━
#技术分析 #RAM #APR #NVDL
📌 The above content is for reference only and does not constitute investment advice
12
·
--
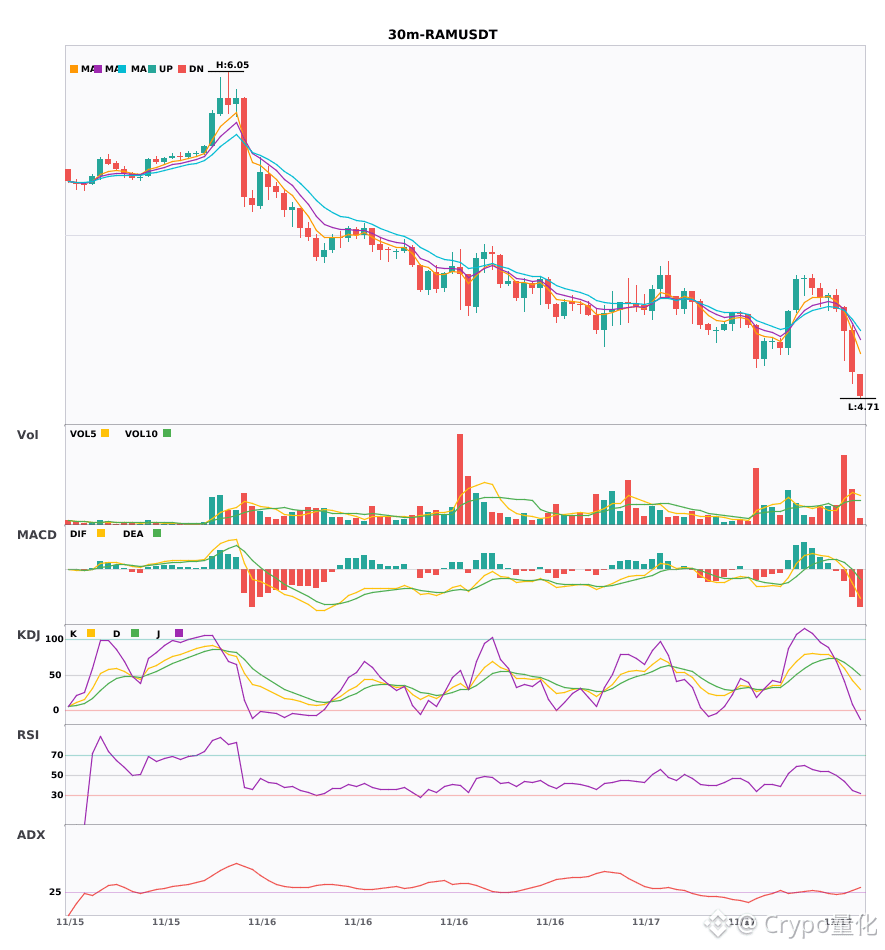
$RAM $APR $NVDL 30-minute short-signal warning—watch out for this drop 🔥
════════════════════
🟢 $RAM 30-minute short signal
⚠️Technical analysis: The trend is taking shape, offering an opportunity to go short. MACD green bars are expanding below the zero line, moving averages are bearishly aligned and diverging downward, and trading volume is up 3.1×.
════════════════════
🟢 $APR 30-minute short signal
⚠️Technical analysis: ADX is at 52, indicating a strong trend—beware of overheating. A bearish MACD crossover below zero is accelerating the downtrend; moving averages are bearishly aligned; the KDJ death cross signals a short-term bearish outlook. Volume is up 1.8×.
📢Market update: MyShell (SHELL) airdrop continues: Binance announced the second round of HODLer airdrops. Eligible users can receive SHELL based on a retrospective snapshot of their BNB Simple Earn holdings. Locked products offer up to 29.9% annualized yield.
════════════════════
🟢 $NVDL 30-minute short signal
⚠️Technical analysis: The ADX trend is just starting, so you can follow it. MACD breaking below the zero line is bearish; EMA5 crossing below EMA8 signals short-term weakness. The KDJ death cross has K crossing below D, though it remains relatively high. Volume has surged 3.5×.
════════════════════
🔔 Follow for the latest market moves 🔔
#技术分析 #RAM #APR #NVDL
📌 When trading, watch whether the candlestick pattern confirms the signal
$RAM $APR $NVDL 30-minute short-signal warning—watch out for this drop 🔥
════════════════════
🟢 $RAM 30-minute short signal
⚠️Technical analysis: The trend is taking shape, offering an opportunity to go short. MACD green bars are expanding below the zero line, moving averages are bearishly aligned and diverging downward, and trading volume is up 3.1×.
════════════════════
🟢 $APR 30-minute short signal
⚠️Technical analysis: ADX is at 52, indicating a strong trend—beware of overheating. A bearish MACD crossover below zero is accelerating the downtrend; moving averages are bearishly aligned; the KDJ death cross signals a short-term bearish outlook. Volume is up 1.8×.
📢Market update: MyShell (SHELL) airdrop continues: Binance announced the second round of HODLer airdrops. Eligible users can receive SHELL based on a retrospective snapshot of their BNB Simple Earn holdings. Locked products offer up to 29.9% annualized yield.
════════════════════
🟢 $NVDL 30-minute short signal
⚠️Technical analysis: The ADX trend is just starting, so you can follow it. MACD breaking below the zero line is bearish; EMA5 crossing below EMA8 signals short-term weakness. The KDJ death cross has K crossing below D, though it remains relatively high. Volume has surged 3.5×.
════════════════════
🔔 Follow for the latest market moves 🔔
#技术分析 #RAM #APR #NVDL
📌 When trading, watch whether the candlestick pattern confirms the signal
════════════════════
🟢 $RAM 30-minute short signal
⚠️Technical analysis: The trend is taking shape, offering an opportunity to go short. MACD green bars are expanding below the zero line, moving averages are bearishly aligned and diverging downward, and trading volume is up 3.1×.
════════════════════
🟢 $APR 30-minute short signal
⚠️Technical analysis: ADX is at 52, indicating a strong trend—beware of overheating. A bearish MACD crossover below zero is accelerating the downtrend; moving averages are bearishly aligned; the KDJ death cross signals a short-term bearish outlook. Volume is up 1.8×.
📢Market update: MyShell (SHELL) airdrop continues: Binance announced the second round of HODLer airdrops. Eligible users can receive SHELL based on a retrospective snapshot of their BNB Simple Earn holdings. Locked products offer up to 29.9% annualized yield.
════════════════════
🟢 $NVDL 30-minute short signal
⚠️Technical analysis: The ADX trend is just starting, so you can follow it. MACD breaking below the zero line is bearish; EMA5 crossing below EMA8 signals short-term weakness. The KDJ death cross has K crossing below D, though it remains relatively high. Volume has surged 3.5×.
════════════════════
🔔 Follow for the latest market moves 🔔
#技术分析 #RAM #APR #NVDL
📌 When trading, watch whether the candlestick pattern confirms the signal
14
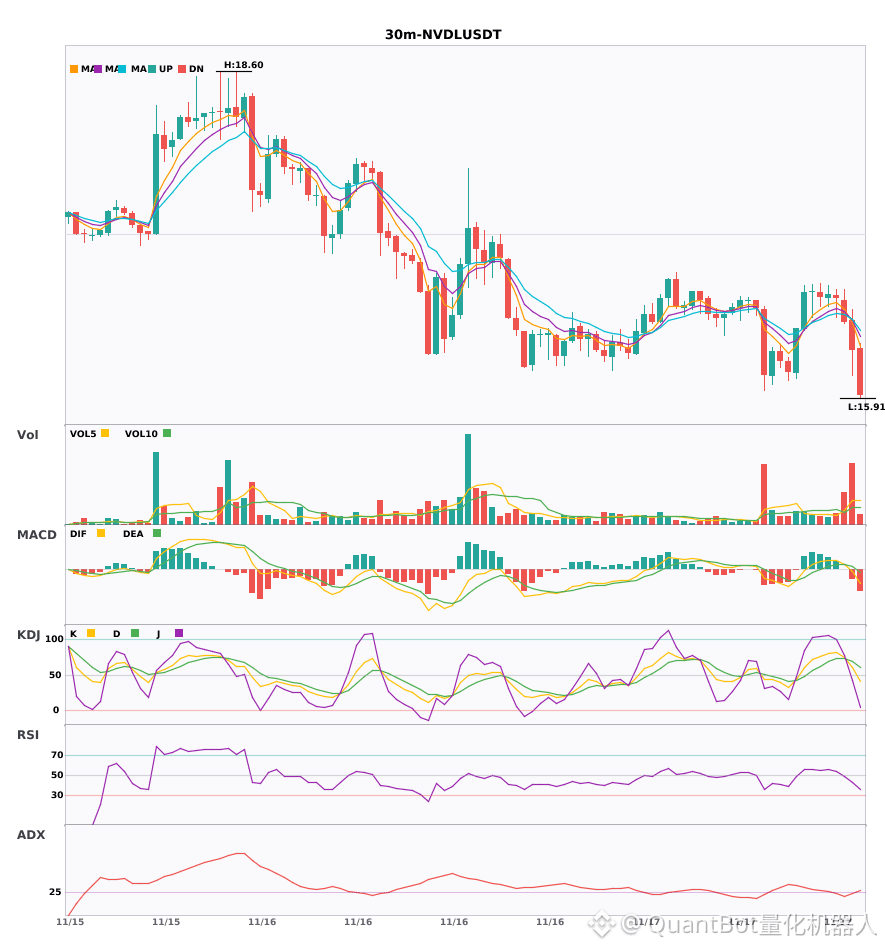
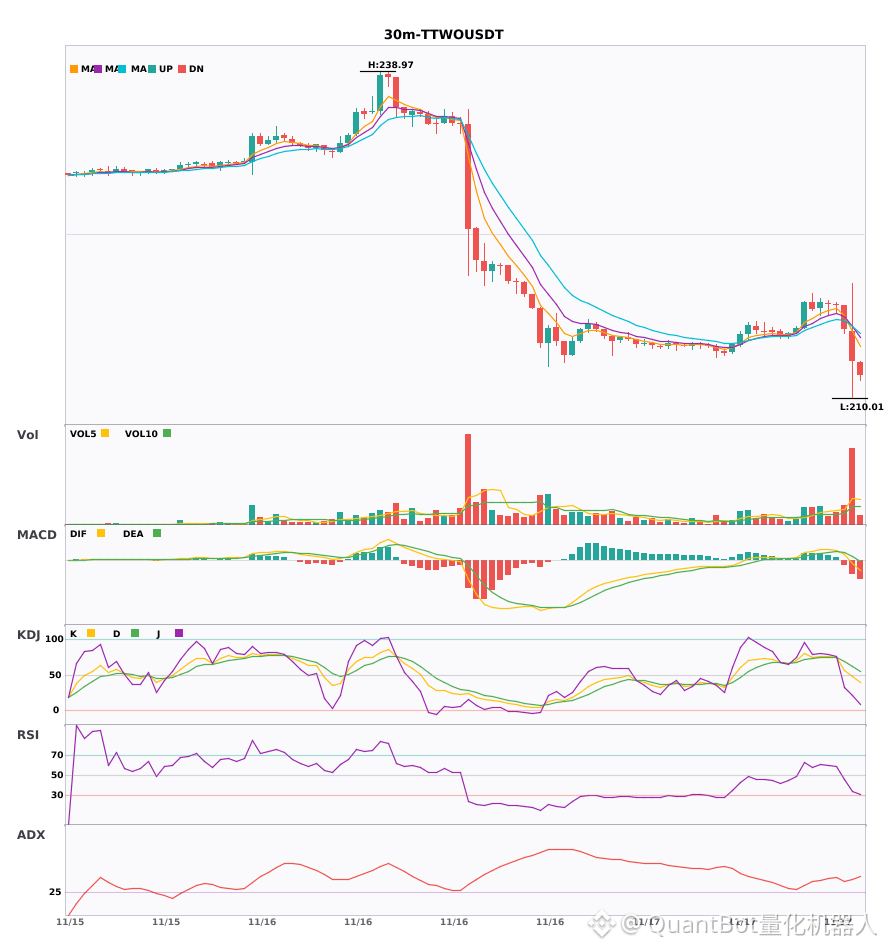
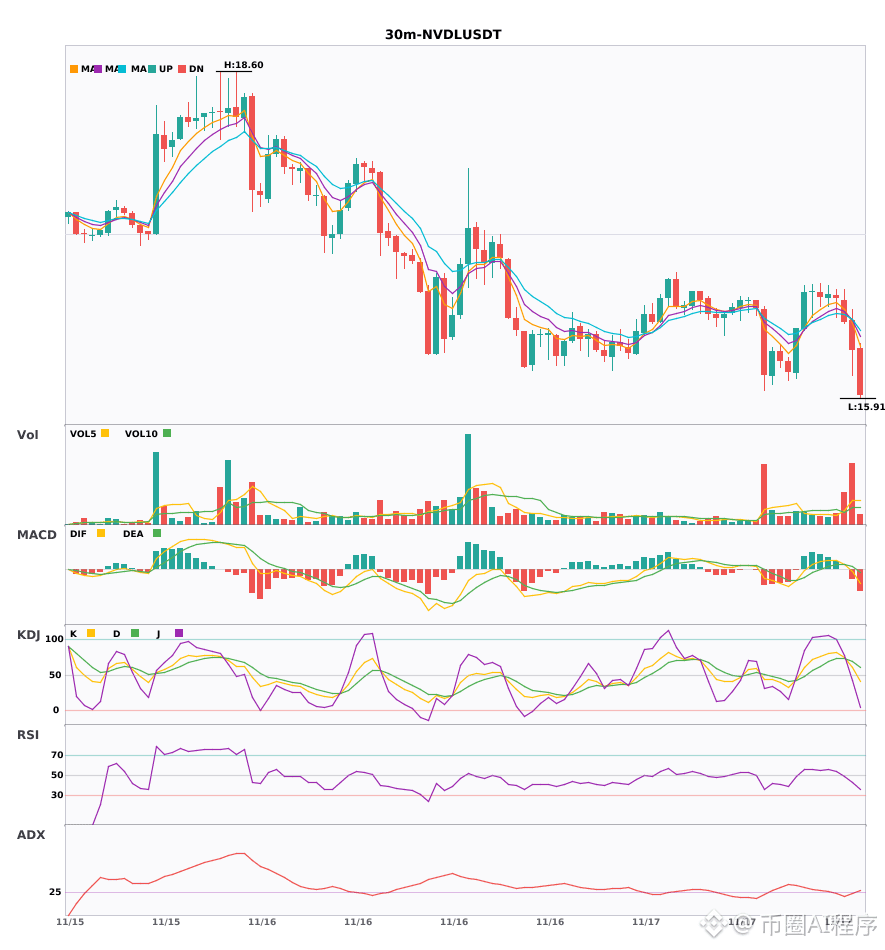
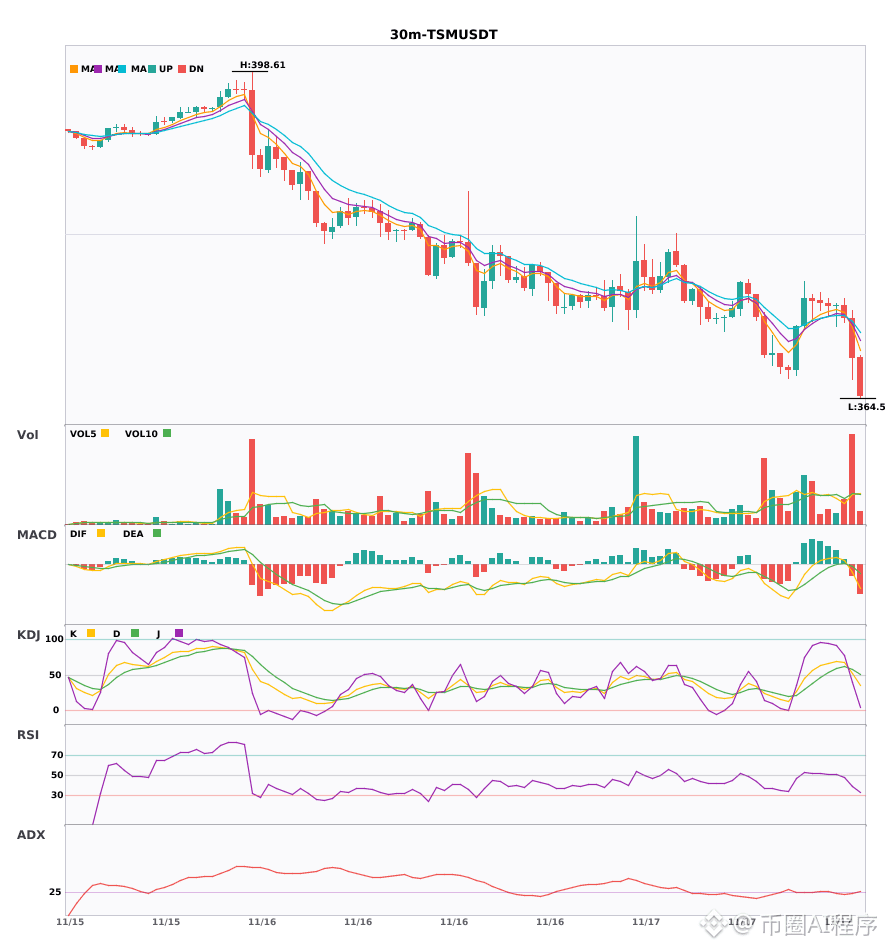
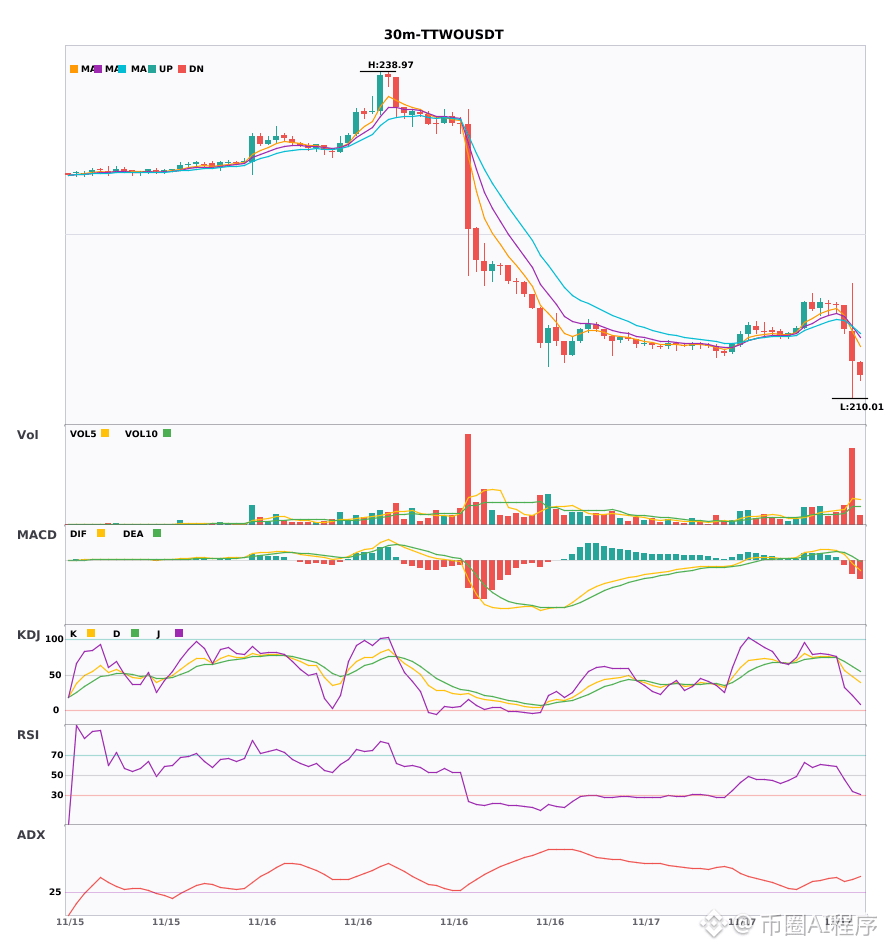
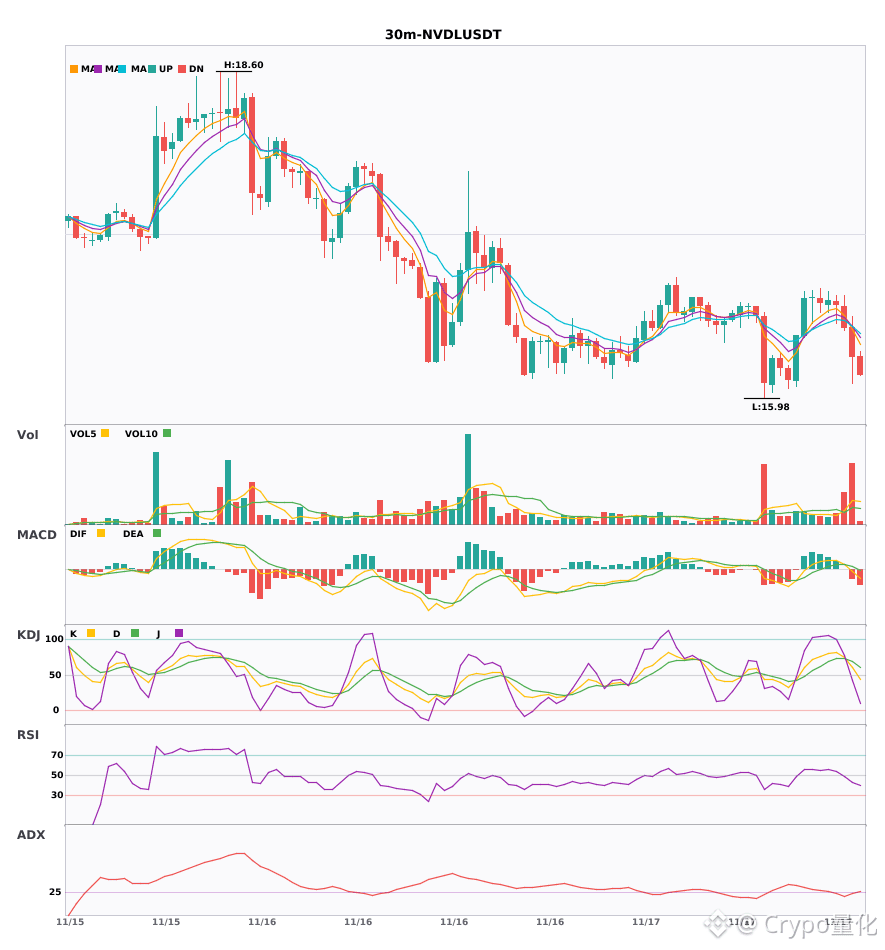
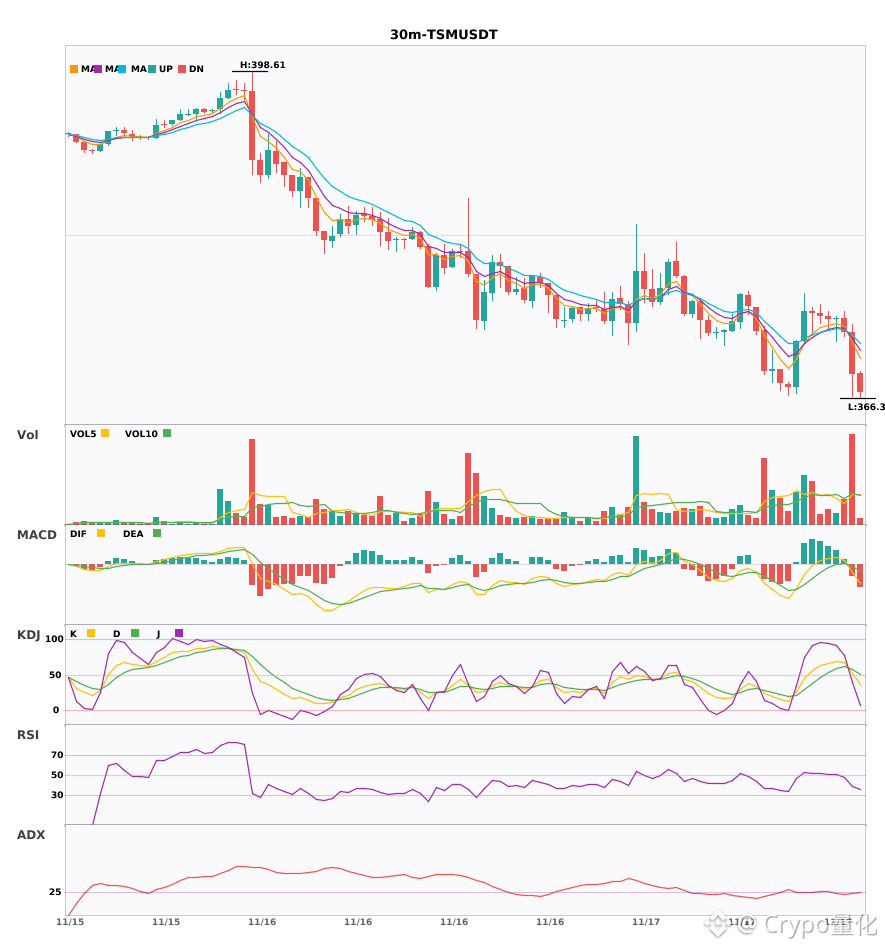
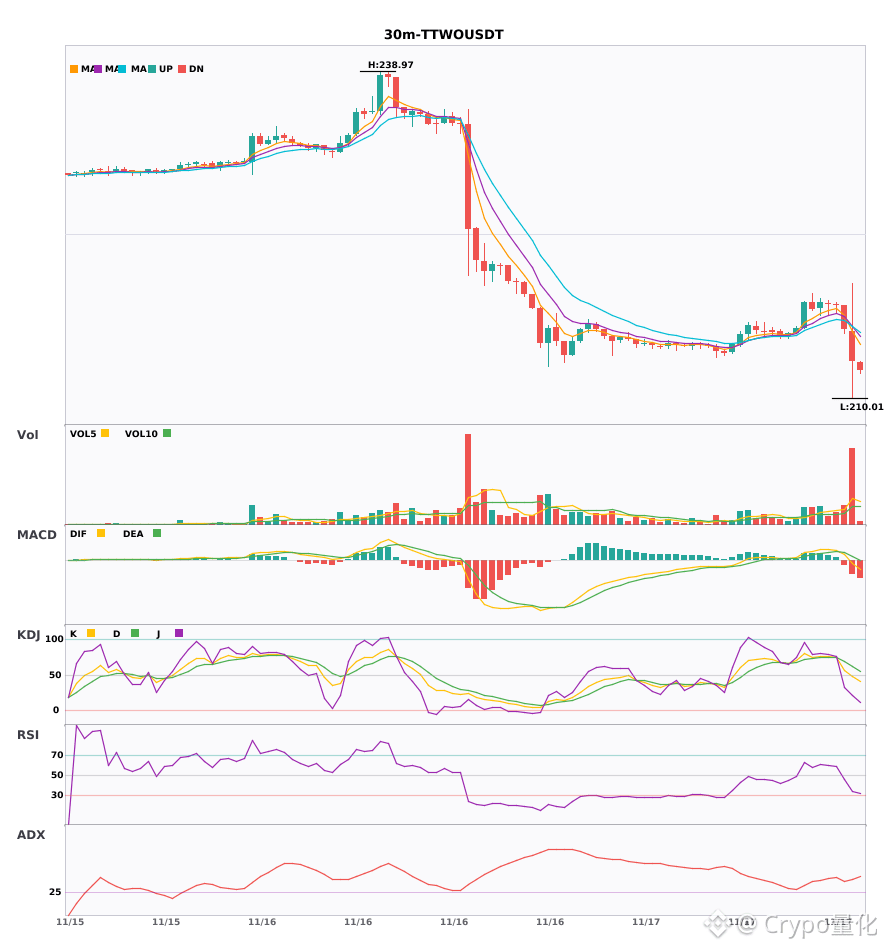
30-minute bearish signals triggered simultaneously: $NVDL/$TSM/$TTWO
📉 $NVDL | 30-minute bearish signal
━━━━━━━━━━━━━━━━━━
Technical analysis: ADX(25) indicates the trend is established and may be traded. MACD-DIF broke below the zero line, turning the trend bearish; EMA5 crossed below EMA8, signaling a short-term bearish shift; KDJ death cross (K60.2/D69.1), short-term outlook is bearish; volume increased 3.5-fold.
Price change: -1.3900%
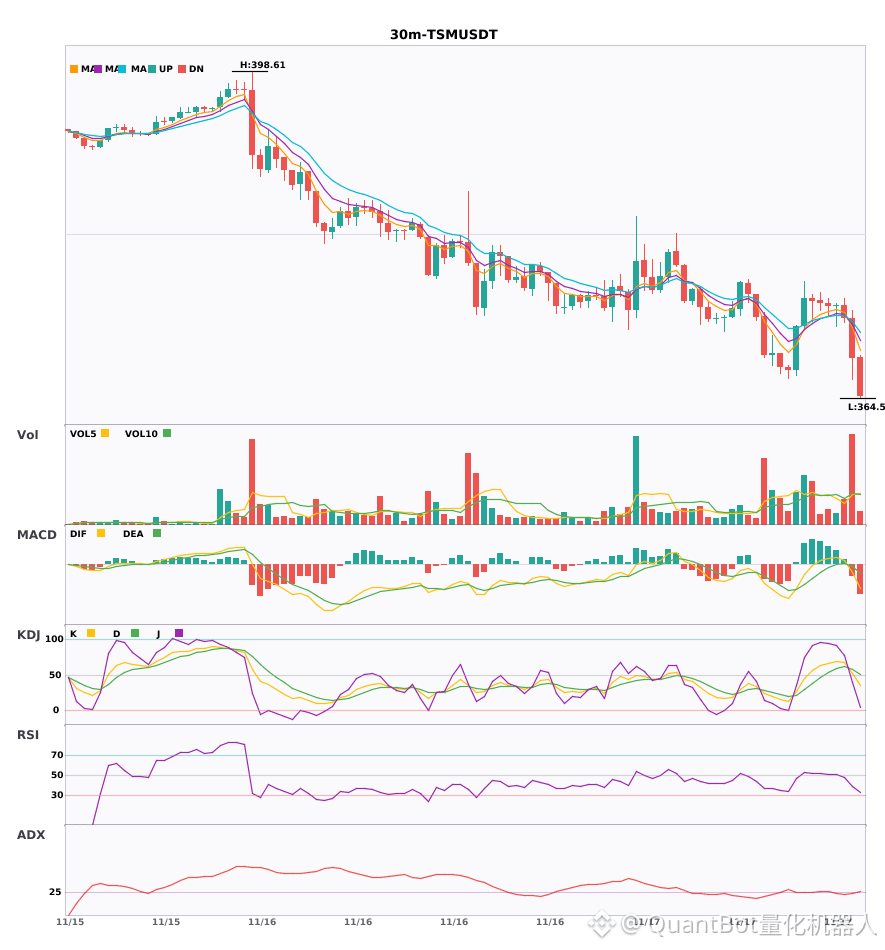
📉 $TSM | 30-minute bearish signal
━━━━━━━━━━━━━━━━━━
Technical analysis: ADX(26) indicates the trend is established and may be traded; MACD death cross below zero; EMA5 crossed below EMA8, signaling a short-term bearish shift; KDJ death cross K51.8/D58.1; volume increased 2.8-fold.
Price change: -1.1100%
📉 $TTWO | 30-minute bearish signal
━━━━━━━━━━━━━━━━━━
Technical analysis: ADX(44) reflects significant trend strength, MACD DIF breaking below the zero line confirms the bearish reversal, EMA5 crossing below EMA8 forms a short-term bearish signal, and volume increasing 4.1-fold confirms momentum.
Price change: -1.3100%
━━━━━━━━━━━━━━━━━━
#技术分析 #NVDL #TSM #TTWO
📌 The above content is for reference only and does not constitute investment advice
30-minute bearish signals triggered simultaneously: $NVDL /$TSM /$TTWO
📉 $NVDL | 30-minute bearish signal
━━━━━━━━━━━━━━━━━━
Technical analysis: ADX(25) indicates the trend is established and may be traded. MACD-DIF broke below the zero line, turning the trend bearish; EMA5 crossed below EMA8, signaling a short-term bearish shift; KDJ death cross (K60.2/D69.1), short-term outlook is bearish; volume increased 3.5-fold.
Price change: -1.3900%
📉 $TSM | 30-minute bearish signal
━━━━━━━━━━━━━━━━━━
Technical analysis: ADX(26) indicates the trend is established and may be traded; MACD death cross below zero; EMA5 crossed below EMA8, signaling a short-term bearish shift; KDJ death cross K51.8/D58.1; volume increased 2.8-fold.
Price change: -1.1100%
📉 $TTWO | 30-minute bearish signal
━━━━━━━━━━━━━━━━━━
Technical analysis: ADX(44) reflects significant trend strength, MACD DIF breaking below the zero line confirms the bearish reversal, EMA5 crossing below EMA8 forms a short-term bearish signal, and volume increasing 4.1-fold confirms momentum.
Price change: -1.3100%
━━━━━━━━━━━━━━━━━━
#技术分析 #NVDL #TSM #TTWO
📌 The above content is for reference only and does not constitute investment advice
📉 $NVDL | 30-minute bearish signal
━━━━━━━━━━━━━━━━━━
Technical analysis: ADX(25) indicates the trend is established and may be traded. MACD-DIF broke below the zero line, turning the trend bearish; EMA5 crossed below EMA8, signaling a short-term bearish shift; KDJ death cross (K60.2/D69.1), short-term outlook is bearish; volume increased 3.5-fold.
Price change: -1.3900%
📉 $TSM | 30-minute bearish signal
━━━━━━━━━━━━━━━━━━
Technical analysis: ADX(26) indicates the trend is established and may be traded; MACD death cross below zero; EMA5 crossed below EMA8, signaling a short-term bearish shift; KDJ death cross K51.8/D58.1; volume increased 2.8-fold.
Price change: -1.1100%
📉 $TTWO | 30-minute bearish signal
━━━━━━━━━━━━━━━━━━
Technical analysis: ADX(44) reflects significant trend strength, MACD DIF breaking below the zero line confirms the bearish reversal, EMA5 crossing below EMA8 forms a short-term bearish signal, and volume increasing 4.1-fold confirms momentum.
Price change: -1.3100%
━━━━━━━━━━━━━━━━━━
#技术分析 #NVDL #TSM #TTWO
📌 The above content is for reference only and does not constitute investment advice
13
·
--
3 coins in bearish alignment; trends from 30 minutes to 4 hours are all bearish 🔥
════════════════════
🟢 $NVDL 30-minute short signal
⚠️ Technical analysis: The 4-hour and 30-minute bearish alignment is confirmed. MACD has fallen below the zero line, turning bearish; the moving averages have formed a bearish crossover and are diverging downward. KDJ has formed a bearish crossover but is not oversold. Volume has surged 3.5x, confirming the bearish trend.
════════════════════
🟢 $TSM 30-minute short signal
⚠️ Technical analysis: The 4-hour bearish trend and 30-minute entry are aligned! MACD's bearish crossover below zero is accelerating; the moving averages have just formed a bearish crossover. K has crossed below D, but is not oversold. Trading volume has surged 2.8x.
════════════════════
🟢 $TTWO 30-minute short signal
⚠️ Technical analysis: The 4-hour bearish trend and 30-minute alignment are confirmed. On the 30-minute chart, MACD has formed a bearish crossover below the zero line, with volume surging (4.1x). The moving averages are diverging downward in a bearish formation. Trade in the direction of the trend.
════════════════════
🔔 Follow for firsthand market alerts 🔔
#多周期共振 #NVDL #TSM #TTWO
📌 When trading, pay attention to whether the candlestick pattern confirms the setup.
3 coins in bearish alignment; trends from 30 minutes to 4 hours are all bearish 🔥
════════════════════
🟢 $NVDL 30-minute short signal
⚠️ Technical analysis: The 4-hour and 30-minute bearish alignment is confirmed. MACD has fallen below the zero line, turning bearish; the moving averages have formed a bearish crossover and are diverging downward. KDJ has formed a bearish crossover but is not oversold. Volume has surged 3.5x, confirming the bearish trend.
════════════════════
🟢 $TSM 30-minute short signal
⚠️ Technical analysis: The 4-hour bearish trend and 30-minute entry are aligned! MACD's bearish crossover below zero is accelerating; the moving averages have just formed a bearish crossover. K has crossed below D, but is not oversold. Trading volume has surged 2.8x.
════════════════════
🟢 $TTWO 30-minute short signal
⚠️ Technical analysis: The 4-hour bearish trend and 30-minute alignment are confirmed. On the 30-minute chart, MACD has formed a bearish crossover below the zero line, with volume surging (4.1x). The moving averages are diverging downward in a bearish formation. Trade in the direction of the trend.
════════════════════
🔔 Follow for firsthand market alerts 🔔
#多周期共振 #NVDL #TSM #TTWO
📌 When trading, pay attention to whether the candlestick pattern confirms the setup.
════════════════════
🟢 $NVDL 30-minute short signal
⚠️ Technical analysis: The 4-hour and 30-minute bearish alignment is confirmed. MACD has fallen below the zero line, turning bearish; the moving averages have formed a bearish crossover and are diverging downward. KDJ has formed a bearish crossover but is not oversold. Volume has surged 3.5x, confirming the bearish trend.
════════════════════
🟢 $TSM 30-minute short signal
⚠️ Technical analysis: The 4-hour bearish trend and 30-minute entry are aligned! MACD's bearish crossover below zero is accelerating; the moving averages have just formed a bearish crossover. K has crossed below D, but is not oversold. Trading volume has surged 2.8x.
════════════════════
🟢 $TTWO 30-minute short signal
⚠️ Technical analysis: The 4-hour bearish trend and 30-minute alignment are confirmed. On the 30-minute chart, MACD has formed a bearish crossover below the zero line, with volume surging (4.1x). The moving averages are diverging downward in a bearish formation. Trade in the direction of the trend.
════════════════════
🔔 Follow for firsthand market alerts 🔔
#多周期共振 #NVDL #TSM #TTWO
📌 When trading, pay attention to whether the candlestick pattern confirms the setup.
3
·
--
$NVDL $TSM $TTWO 30 minutes have turned bearish, bearish signals are breaking out together 🔥
════════════════════
🟢 $NVDL 30-minute bearish signal
⚠️ Technicals: ADX trend has just started, can enter | MACD has fallen below the zero axis and turned bearish | Moving averages have just formed a death cross, short-term bias is bearish | KDJ death cross, bearish | Volume exploded 3.5x
════════════════════
🟢 $TSM 30-minute bearish signal
⚠️ Technicals: ADX trend has just formed, can participate; MACD death cross, bearish acceleration; EMA5 crosses below EMA8 and turns bearish; KDJ death cross, bearish; volume exploded 2.8x.
════════════════════
🟢 $TTWO 30-minute bearish signal
⚠️ Technicals: ADX 44 trend is very strong, but MACD DIF has fallen below the zero axis and turned bearish, moving averages have just formed a death cross and short-term weakness is emerging, volume increased 4.1x, pay attention
════════════════════
🔔 Follow to get the first-hand market moves 🔔
#技术分析 #NVDL #TSM #TTWO
📌 When trading, pay attention to whether the candlestick pattern matches
$NVDL $TSM $TTWO 30 minutes have turned bearish, bearish signals are breaking out together 🔥
════════════════════
🟢 $NVDL 30-minute bearish signal
⚠️ Technicals: ADX trend has just started, can enter | MACD has fallen below the zero axis and turned bearish | Moving averages have just formed a death cross, short-term bias is bearish | KDJ death cross, bearish | Volume exploded 3.5x
════════════════════
🟢 $TSM 30-minute bearish signal
⚠️ Technicals: ADX trend has just formed, can participate; MACD death cross, bearish acceleration; EMA5 crosses below EMA8 and turns bearish; KDJ death cross, bearish; volume exploded 2.8x.
════════════════════
🟢 $TTWO 30-minute bearish signal
⚠️ Technicals: ADX 44 trend is very strong, but MACD DIF has fallen below the zero axis and turned bearish, moving averages have just formed a death cross and short-term weakness is emerging, volume increased 4.1x, pay attention
════════════════════
🔔 Follow to get the first-hand market moves 🔔
#技术分析 #NVDL #TSM #TTWO
📌 When trading, pay attention to whether the candlestick pattern matches
════════════════════
🟢 $NVDL 30-minute bearish signal
⚠️ Technicals: ADX trend has just started, can enter | MACD has fallen below the zero axis and turned bearish | Moving averages have just formed a death cross, short-term bias is bearish | KDJ death cross, bearish | Volume exploded 3.5x
════════════════════
🟢 $TSM 30-minute bearish signal
⚠️ Technicals: ADX trend has just formed, can participate; MACD death cross, bearish acceleration; EMA5 crosses below EMA8 and turns bearish; KDJ death cross, bearish; volume exploded 2.8x.
════════════════════
🟢 $TTWO 30-minute bearish signal
⚠️ Technicals: ADX 44 trend is very strong, but MACD DIF has fallen below the zero axis and turned bearish, moving averages have just formed a death cross and short-term weakness is emerging, volume increased 4.1x, pay attention
════════════════════
🔔 Follow to get the first-hand market moves 🔔
#技术分析 #NVDL #TSM #TTWO
📌 When trading, pay attention to whether the candlestick pattern matches
22
·
--
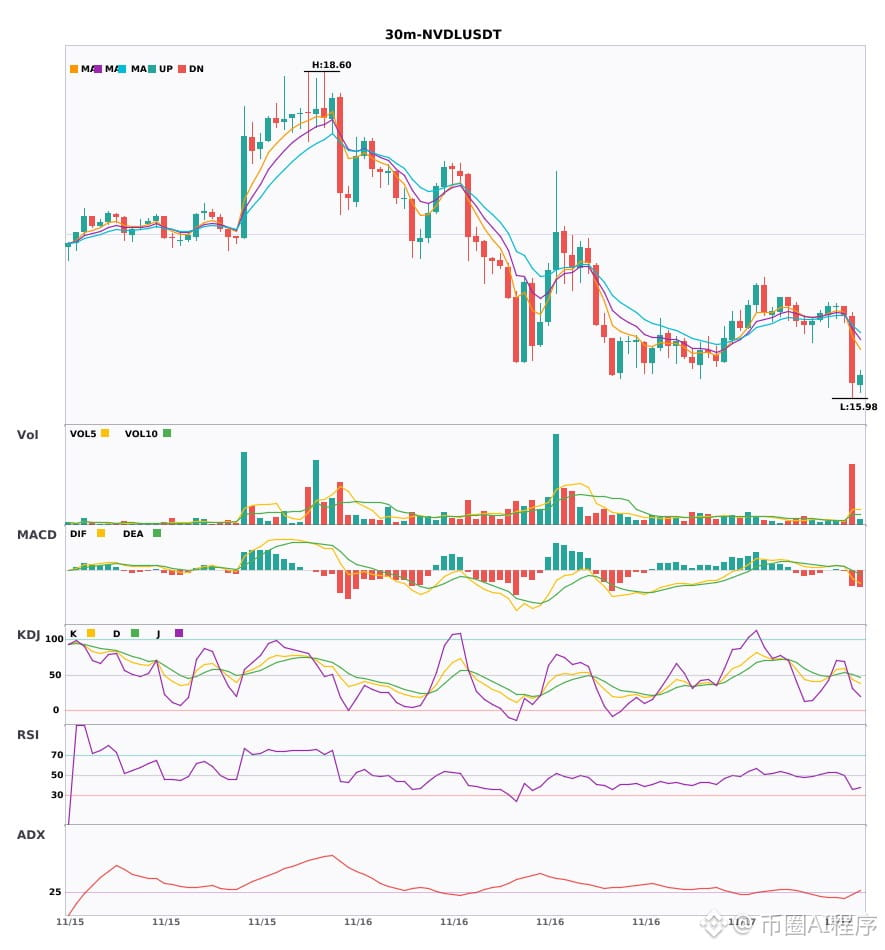
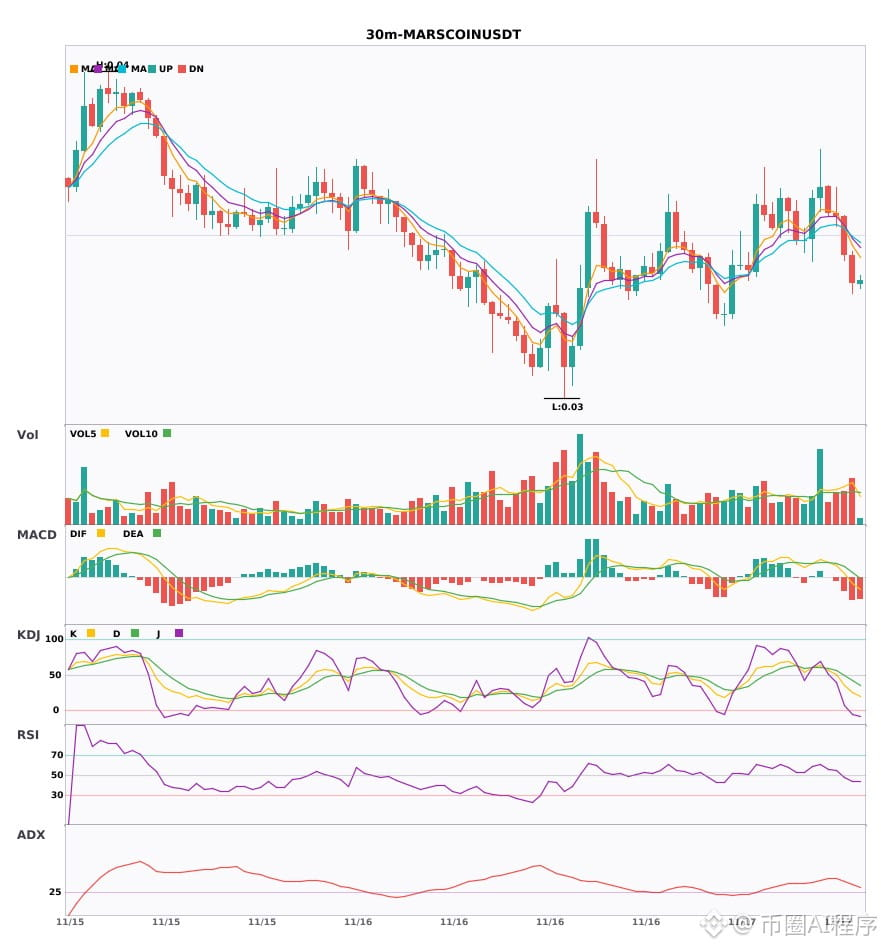
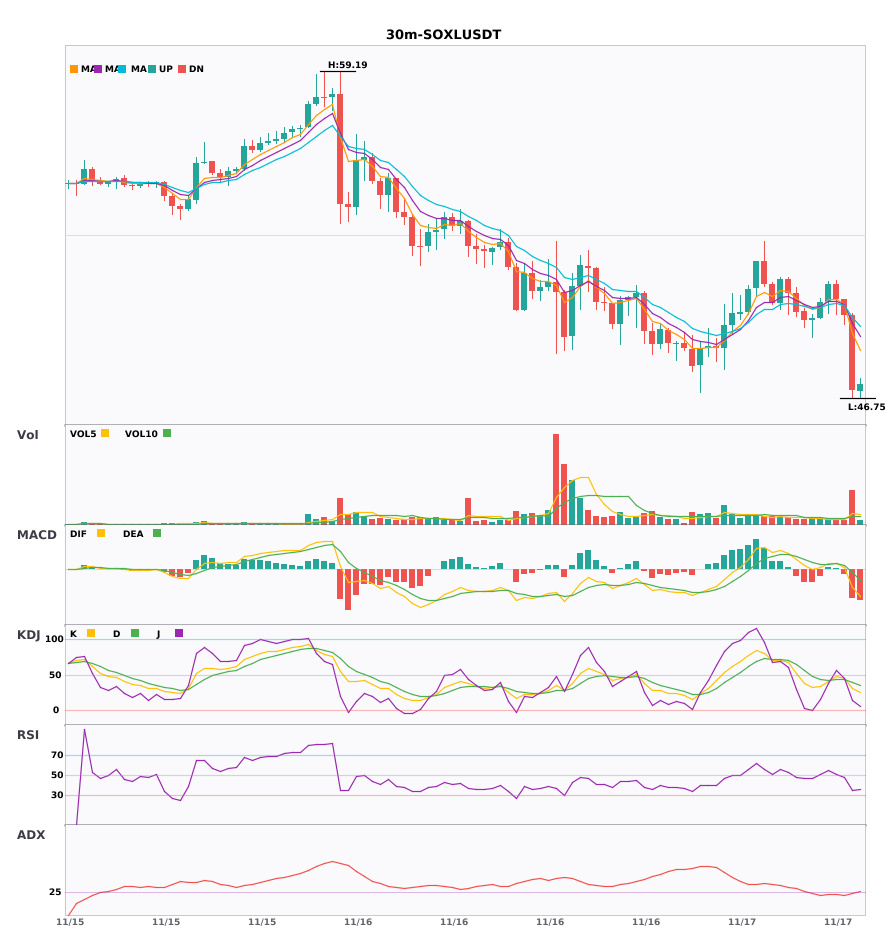
$NVDL / $MARSCOIN / $SOXL 30-minute bearish signals emerge; 4-hour bearish trend confirmed🔥
════════════════════
🟢 $NVDL 30-minute bearish signal
⚠️Technical analysis: 4-hour bearish + 30-minute confluence points down: MACD breaks below zero and turns bearish, moving averages have just formed a bearish alignment, KDJ has a death cross but is not yet oversold, and volume is up 6x.
════════════════════
🟢 $MARSCOIN 30-minute bearish signal
⚠️Technical analysis: 30-minute + 4-hour bearish confluence confirmed: MACD breaks below zero on increased volume, moving averages are bearishly aligned and diverging, KDJ is weak, and bears are in control.
════════════════════
🟢 $SOXL 30-minute bearish signal
⚠️Technical analysis: Multi-timeframe confluence: 4-hour bearish trend + confirmed 30-minute entry signal. MACD death cross breaks below zero and turns bearish, moving averages are bearishly aligned and diverging downward, KDJ has a death cross but is not oversold, and volume is up 3.9x—favoring the bearish trend.
════════════════════
🔔 Follow for first-hand market alerts 🔔
#多周期共振 #NVDL #MARSCOIN #SOXL
📌 When trading, pay attention to whether the candlestick pattern aligns.
$NVDL / $MARSCOIN / $SOXL 30-minute bearish signals emerge; 4-hour bearish trend confirmed🔥
════════════════════
🟢 $NVDL 30-minute bearish signal
⚠️Technical analysis: 4-hour bearish + 30-minute confluence points down: MACD breaks below zero and turns bearish, moving averages have just formed a bearish alignment, KDJ has a death cross but is not yet oversold, and volume is up 6x.
════════════════════
🟢 $MARSCOIN 30-minute bearish signal
⚠️Technical analysis: 30-minute + 4-hour bearish confluence confirmed: MACD breaks below zero on increased volume, moving averages are bearishly aligned and diverging, KDJ is weak, and bears are in control.
════════════════════
🟢 $SOXL 30-minute bearish signal
⚠️Technical analysis: Multi-timeframe confluence: 4-hour bearish trend + confirmed 30-minute entry signal. MACD death cross breaks below zero and turns bearish, moving averages are bearishly aligned and diverging downward, KDJ has a death cross but is not oversold, and volume is up 3.9x—favoring the bearish trend.
════════════════════
🔔 Follow for first-hand market alerts 🔔
#多周期共振 #NVDL #MARSCOIN #SOXL
📌 When trading, pay attention to whether the candlestick pattern aligns.
════════════════════
🟢 $NVDL 30-minute bearish signal
⚠️Technical analysis: 4-hour bearish + 30-minute confluence points down: MACD breaks below zero and turns bearish, moving averages have just formed a bearish alignment, KDJ has a death cross but is not yet oversold, and volume is up 6x.
════════════════════
🟢 $MARSCOIN 30-minute bearish signal
⚠️Technical analysis: 30-minute + 4-hour bearish confluence confirmed: MACD breaks below zero on increased volume, moving averages are bearishly aligned and diverging, KDJ is weak, and bears are in control.
════════════════════
🟢 $SOXL 30-minute bearish signal
⚠️Technical analysis: Multi-timeframe confluence: 4-hour bearish trend + confirmed 30-minute entry signal. MACD death cross breaks below zero and turns bearish, moving averages are bearishly aligned and diverging downward, KDJ has a death cross but is not oversold, and volume is up 3.9x—favoring the bearish trend.
════════════════════
🔔 Follow for first-hand market alerts 🔔
#多周期共振 #NVDL #MARSCOIN #SOXL
📌 When trading, pay attention to whether the candlestick pattern aligns.
65
·
--
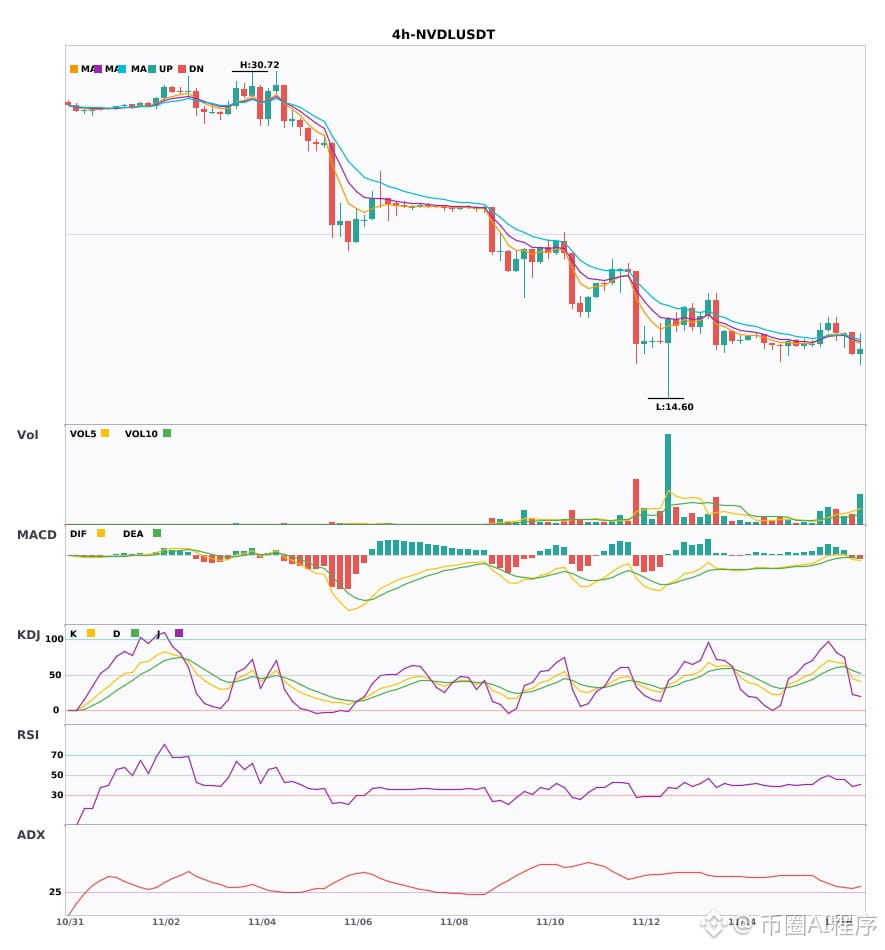
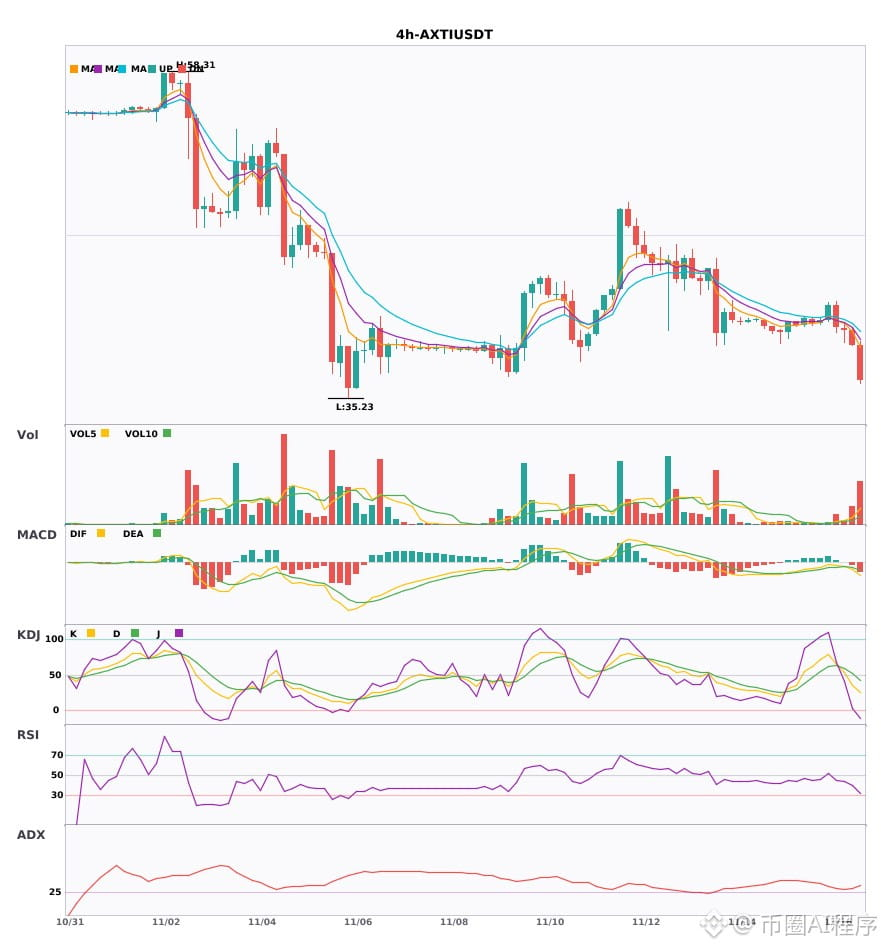
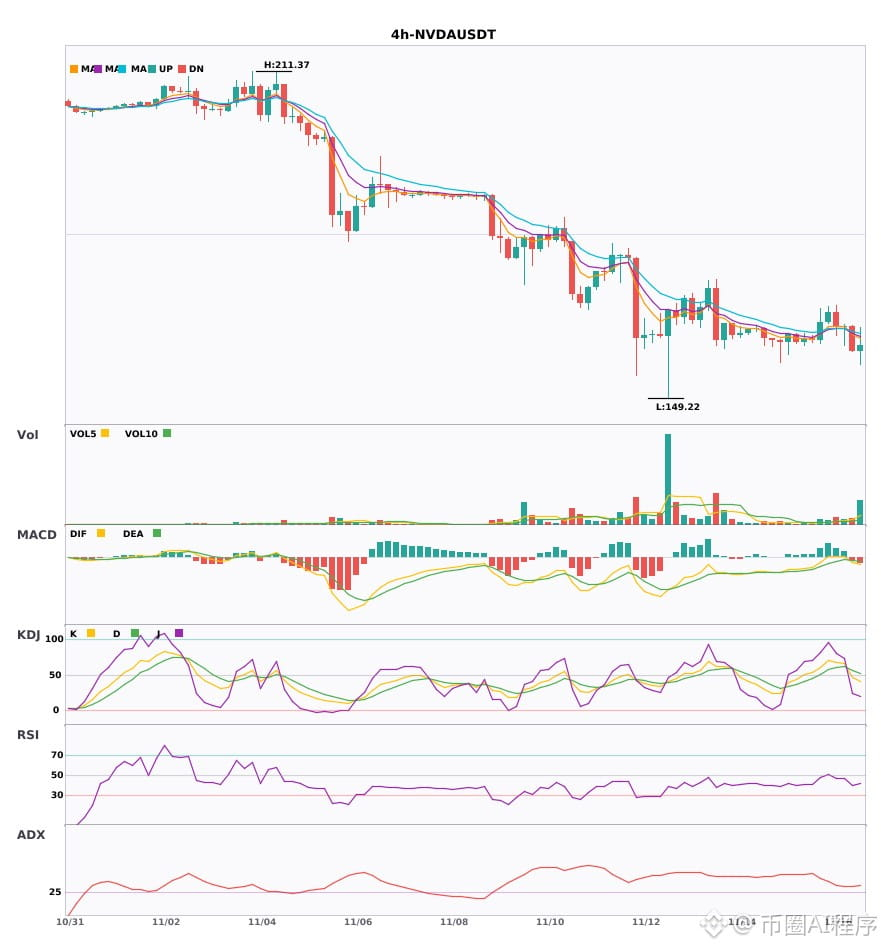
$NVDL/$AXTI/$NVDA : Both the 4-hour and daily charts are bearish, with confluence signaling a downward turn 🔥
════════════════════
🟢 $NVDL 4-hour bearish signal
⚠️Technical analysis: Entry on a 4-hour bearish signal, confirmed by bearish confluence on the daily chart! MACD bearish crossover with expanding green bars, moving averages crossing bearishly, KDJ bearish crossover but not yet oversold, normal volume
════════════════════
🟢 $AXTI 4-hour bearish signal
⚠️Technical analysis: Entry on a 4-hour short signal; MACD bearish crossover below zero on rising volume, with bearish momentum accelerating; moving averages aligned bearishly and diverging downward; trading volume surging to 3.8x. Bearish confluence confirmed on the daily chart as well—multiple timeframes align for a short.
════════════════════
🟢 $NVDA 4-hour bearish signal
⚠️Technical analysis: The daily and 4-hour charts are bearish in confluence! The 4-hour MACD bearish crossover has expanding green bars, moving averages are bearishly aligned, KDJ bearish crossover but not yet oversold, volume up 1.7x
════════════════════
🔔 Follow for real-time market updates 🔔
#多周期共振 #NVDL #AXTI #NVDA
📌 When trading, pay attention to whether the candlestick pattern confirms
$NVDL /$AXTI /$NVDA : Both the 4-hour and daily charts are bearish, with confluence signaling a downward turn 🔥
════════════════════
🟢 $NVDL 4-hour bearish signal
⚠️Technical analysis: Entry on a 4-hour bearish signal, confirmed by bearish confluence on the daily chart! MACD bearish crossover with expanding green bars, moving averages crossing bearishly, KDJ bearish crossover but not yet oversold, normal volume
════════════════════
🟢 $AXTI 4-hour bearish signal
⚠️Technical analysis: Entry on a 4-hour short signal; MACD bearish crossover below zero on rising volume, with bearish momentum accelerating; moving averages aligned bearishly and diverging downward; trading volume surging to 3.8x. Bearish confluence confirmed on the daily chart as well—multiple timeframes align for a short.
════════════════════
🟢 $NVDA 4-hour bearish signal
⚠️Technical analysis: The daily and 4-hour charts are bearish in confluence! The 4-hour MACD bearish crossover has expanding green bars, moving averages are bearishly aligned, KDJ bearish crossover but not yet oversold, volume up 1.7x
════════════════════
🔔 Follow for real-time market updates 🔔
#多周期共振 #NVDL #AXTI #NVDA
📌 When trading, pay attention to whether the candlestick pattern confirms
════════════════════
🟢 $NVDL 4-hour bearish signal
⚠️Technical analysis: Entry on a 4-hour bearish signal, confirmed by bearish confluence on the daily chart! MACD bearish crossover with expanding green bars, moving averages crossing bearishly, KDJ bearish crossover but not yet oversold, normal volume
════════════════════
🟢 $AXTI 4-hour bearish signal
⚠️Technical analysis: Entry on a 4-hour short signal; MACD bearish crossover below zero on rising volume, with bearish momentum accelerating; moving averages aligned bearishly and diverging downward; trading volume surging to 3.8x. Bearish confluence confirmed on the daily chart as well—multiple timeframes align for a short.
════════════════════
🟢 $NVDA 4-hour bearish signal
⚠️Technical analysis: The daily and 4-hour charts are bearish in confluence! The 4-hour MACD bearish crossover has expanding green bars, moving averages are bearishly aligned, KDJ bearish crossover but not yet oversold, volume up 1.7x
════════════════════
🔔 Follow for real-time market updates 🔔
#多周期共振 #NVDL #AXTI #NVDA
📌 When trading, pay attention to whether the candlestick pattern confirms
6
·
--
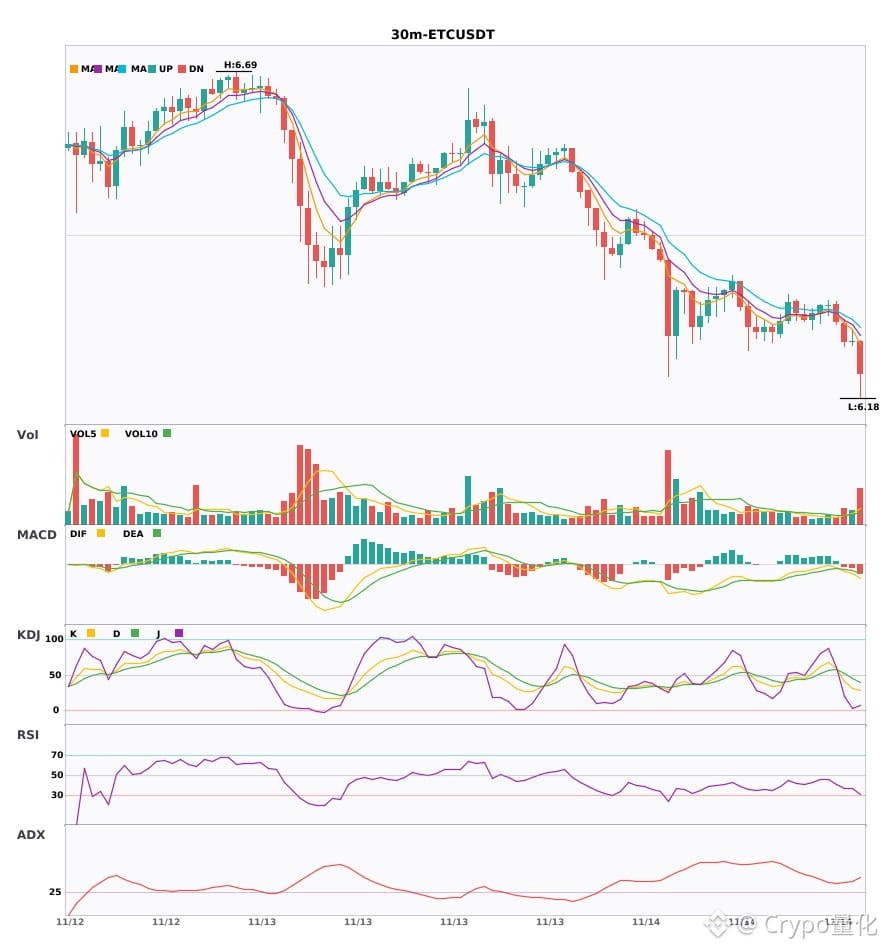
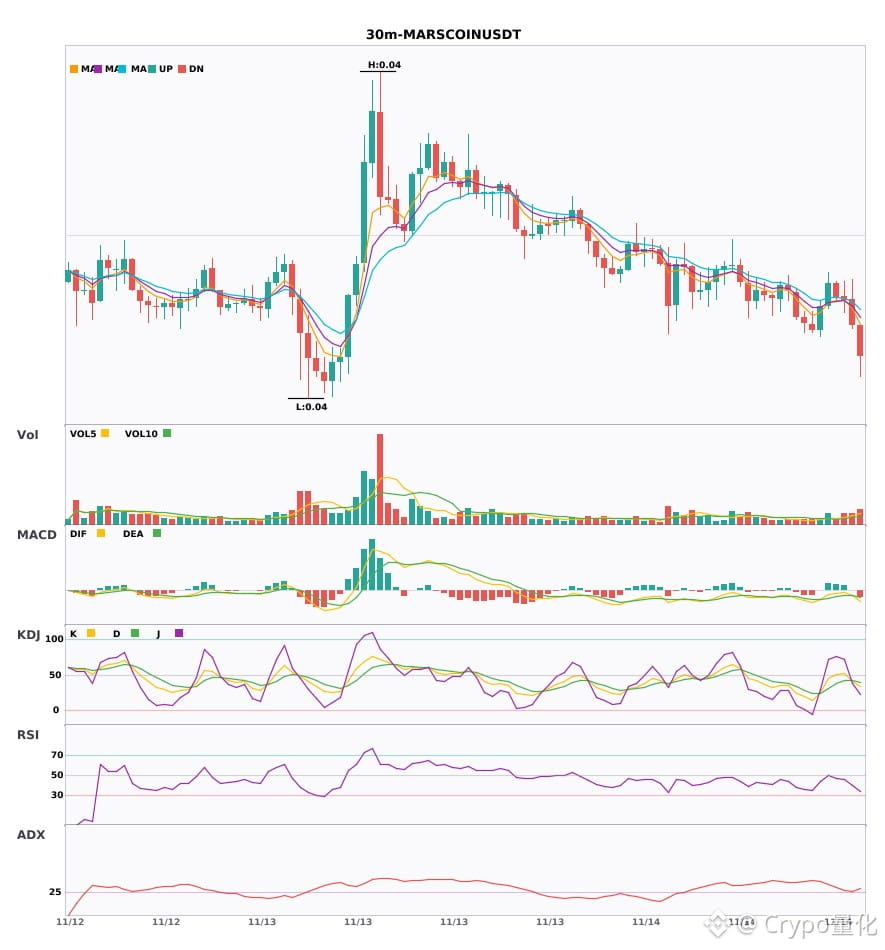
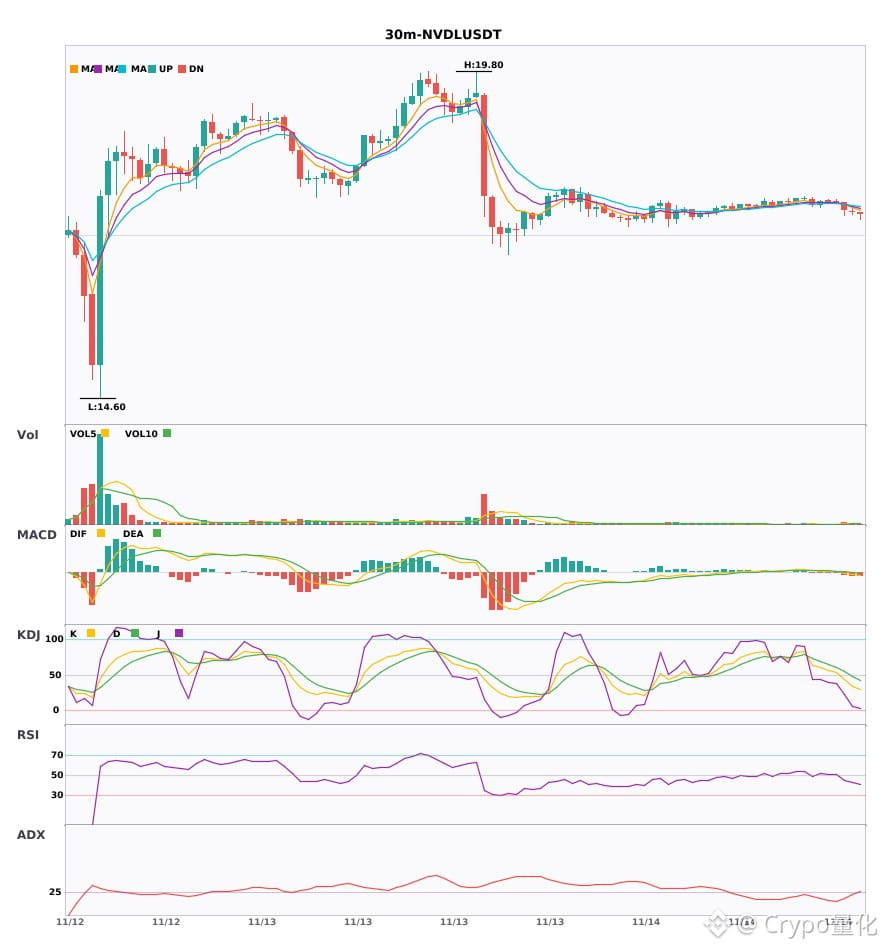
$ETC $MARSCOIN $NVDL 30-minute weakness across the board—watch out for a pullback 🔥
════════════════════
🟢 $ETC 30-minute bearish signal
⚠️ Technicals: ADX 32, trend is quite strong; MACD bearish crossover below zero with rising volume; moving averages diverging bearishly; KDJ bearish crossover, K 41.6, D 52.1; volume up 1.7x. Short-term outlook is bearish.
════════════════════
🟢 $MARSCOIN 30-minute bearish signal
⚠️ Technicals: ADX 26, trend is just forming; MACD bearish crossover accelerating downward; EMA5 crossed below 8, turning bearish short term; KDJ bearish crossover, bearish outlook; volume up 1.7x.
════════════════════
🟢 $NVDL 30-minute bearish signal
⚠️ Technicals: ADX trend is just starting, so there may be an opportunity to participate | MACD bearish momentum is strengthening | Moving averages are in bearish alignment | KDJ is weak, with K 34 below D 48 | Volume surged 2.9x
════════════════════
🔔 Follow to get real-time market alerts 🔔
#技术分析 #ETC #MARSCOIN #NVDL
📌 When trading, watch whether the candlestick pattern confirms the signal
$ETC $MARSCOIN $NVDL 30-minute weakness across the board—watch out for a pullback 🔥
════════════════════
🟢 $ETC 30-minute bearish signal
⚠️ Technicals: ADX 32, trend is quite strong; MACD bearish crossover below zero with rising volume; moving averages diverging bearishly; KDJ bearish crossover, K 41.6, D 52.1; volume up 1.7x. Short-term outlook is bearish.
════════════════════
🟢 $MARSCOIN 30-minute bearish signal
⚠️ Technicals: ADX 26, trend is just forming; MACD bearish crossover accelerating downward; EMA5 crossed below 8, turning bearish short term; KDJ bearish crossover, bearish outlook; volume up 1.7x.
════════════════════
🟢 $NVDL 30-minute bearish signal
⚠️ Technicals: ADX trend is just starting, so there may be an opportunity to participate | MACD bearish momentum is strengthening | Moving averages are in bearish alignment | KDJ is weak, with K 34 below D 48 | Volume surged 2.9x
════════════════════
🔔 Follow to get real-time market alerts 🔔
#技术分析 #ETC #MARSCOIN #NVDL
📌 When trading, watch whether the candlestick pattern confirms the signal
════════════════════
🟢 $ETC 30-minute bearish signal
⚠️ Technicals: ADX 32, trend is quite strong; MACD bearish crossover below zero with rising volume; moving averages diverging bearishly; KDJ bearish crossover, K 41.6, D 52.1; volume up 1.7x. Short-term outlook is bearish.
════════════════════
🟢 $MARSCOIN 30-minute bearish signal
⚠️ Technicals: ADX 26, trend is just forming; MACD bearish crossover accelerating downward; EMA5 crossed below 8, turning bearish short term; KDJ bearish crossover, bearish outlook; volume up 1.7x.
════════════════════
🟢 $NVDL 30-minute bearish signal
⚠️ Technicals: ADX trend is just starting, so there may be an opportunity to participate | MACD bearish momentum is strengthening | Moving averages are in bearish alignment | KDJ is weak, with K 34 below D 48 | Volume surged 2.9x
════════════════════
🔔 Follow to get real-time market alerts 🔔
#技术分析 #ETC #MARSCOIN #NVDL
📌 When trading, watch whether the candlestick pattern confirms the signal
50

·
--
Bearish
🔴 $NVDL This +15% pop is a bear-market rally, not a reversal: Supertrend remains red at 21.17, the EMA(99) at 24.61 still slopes down, and the staircase of lower highs from 28.38 is untouched while price stalls right under the EMA(25) at 19.82 and the 19.79 session high. RSI(6) at 57.84 shows the bounce burned its easy fuel without reclaiming trend, so the 19.60-19.80 supply test is a fade — and the 14.60 capitulation wick is a fresh reminder of how fast this 2x wrapper unwinds.
Trade Setup
Entry: 19.60 - 19.80
Stop-Loss: 20.290
Targets: 18.60 - 17.05 - 14.30
Trade smart, protect your capital, and always manage your own risk. Personal analysis only not financial advice.
#NVDL #NVDLUSDT #CryptoSignals #BinanceSquare #WhatWillDriveCryptoandStocks’NextRebound?
{future}(NVDLUSDT)
🔴 $NVDL This +15% pop is a bear-market rally, not a reversal: Supertrend remains red at 21.17, the EMA(99) at 24.61 still slopes down, and the staircase of lower highs from 28.38 is untouched while price stalls right under the EMA(25) at 19.82 and the 19.79 session high. RSI(6) at 57.84 shows the bounce burned its easy fuel without reclaiming trend, so the 19.60-19.80 supply test is a fade — and the 14.60 capitulation wick is a fresh reminder of how fast this 2x wrapper unwinds.
Trade Setup
Entry: 19.60 - 19.80
Stop-Loss: 20.290
Targets: 18.60 - 17.05 - 14.30
Trade smart, protect your capital, and always manage your own risk. Personal analysis only not financial advice.
#NVDL #NVDLUSDT #CryptoSignals #BinanceSquare #WhatWillDriveCryptoandStocks’NextRebound?
Trade Setup
Entry: 19.60 - 19.80
Stop-Loss: 20.290
Targets: 18.60 - 17.05 - 14.30
Trade smart, protect your capital, and always manage your own risk. Personal analysis only not financial advice.
#NVDL #NVDLUSDT #CryptoSignals #BinanceSquare #WhatWillDriveCryptoandStocks’NextRebound?
1
195
·
--
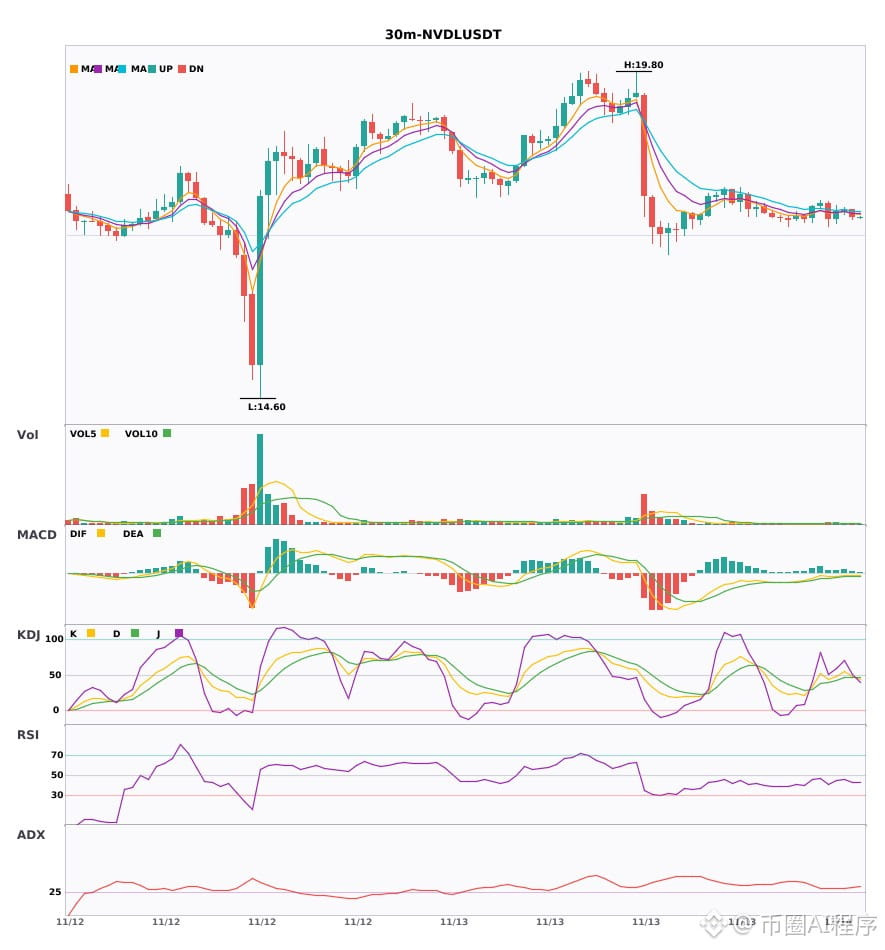
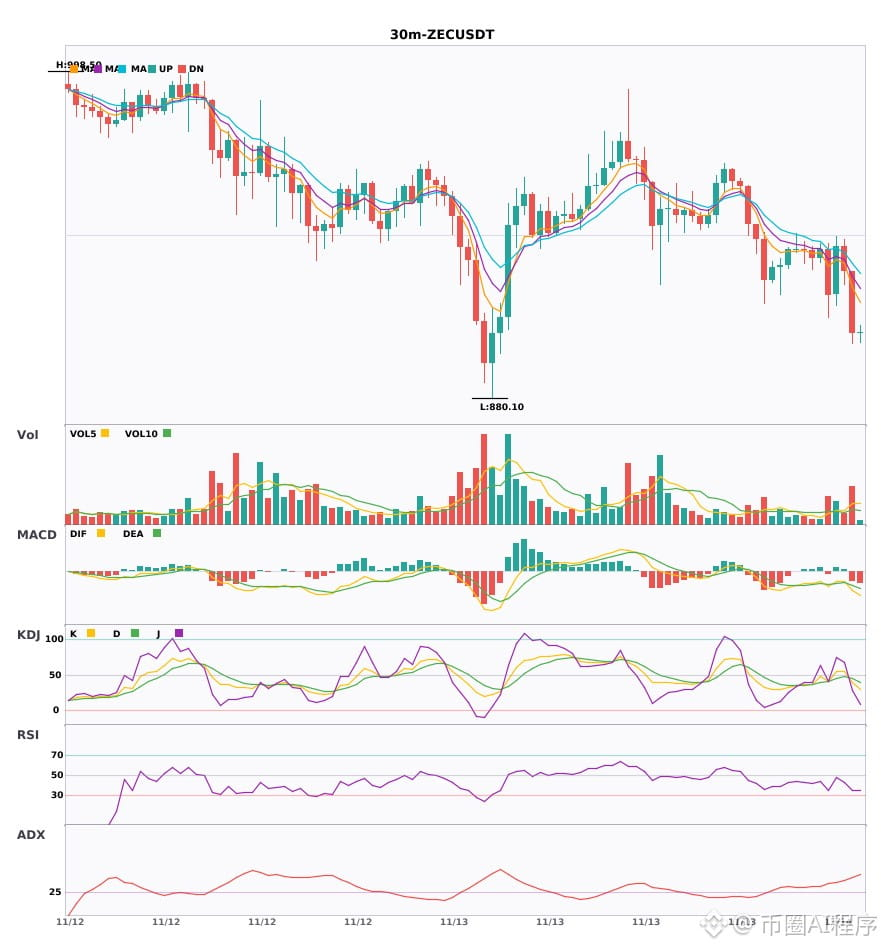
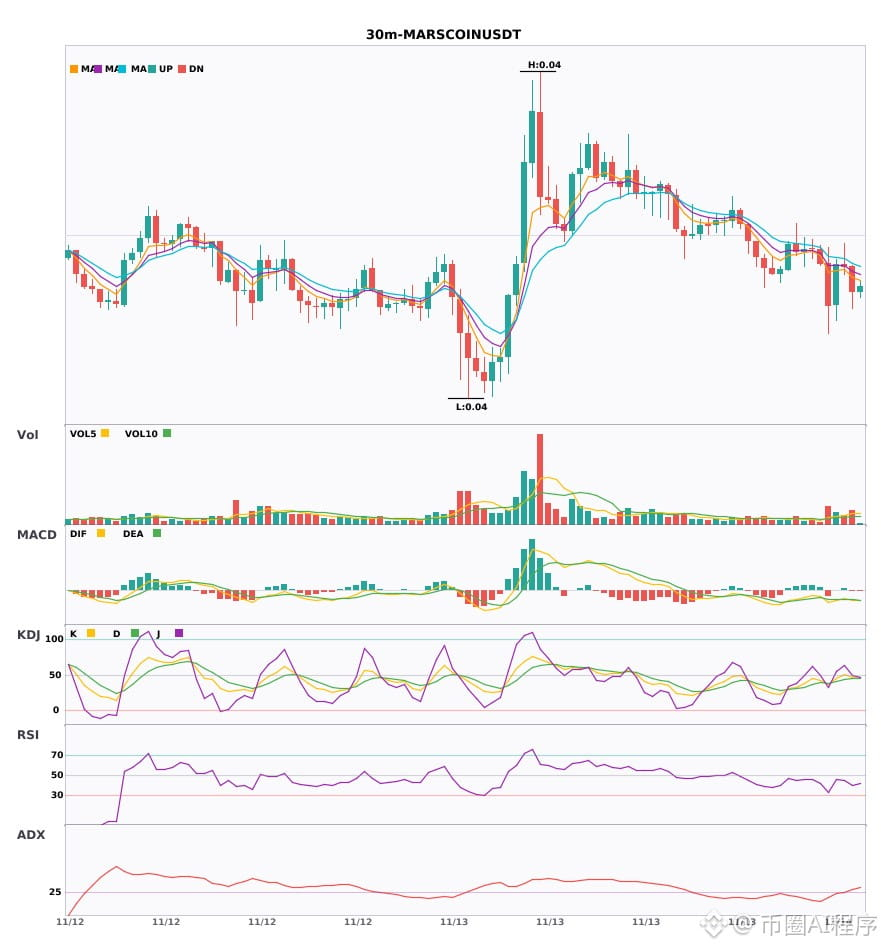
$NVDL $ZEC $MARSCOIN 30-minute KDJ death cross moving downward; 4-hour bearish trend confirmed 🔥
════════════════════
🟢 $NVDL 30-minute bearish signal
⚠️Technical analysis: 4-hour bearish trend + 30-minute entry confirmation in confluence. EMA5 crossed below EMA8, just forming a death cross and turning bearish. KDJ is weak, with K crossing below D but not yet oversold. Volume increased 1.6x.
════════════════════
🟢 $ZEC 30-minute bearish signal
⚠️Technical analysis: Multiple timeframes align bearishly! 4-hour bearish trend + 30-minute confirmation in the same direction. MACD death cross below zero with rising volume; moving averages are bearishly aligned and pointing down. KDJ death cross, not yet oversold. Volume surged 2.5x.
════════════════════
🟢 $MARSCOIN 30-minute bearish signal
⚠️Technical analysis: Multiple timeframes align for a short: 4-hour bearish trend confirmed; 30-minute MACD death cross below zero with accelerating volume; moving averages are bearishly aligned and diverging downward; KDJ is weak; trading volume increased 1.7x.
════════════════════
🔔 Follow to get the latest market movements 🔔
#多周期共振 #NVDL #ZEC #MARSCOIN
📌 When trading, watch whether the candlestick pattern confirms the signal
$NVDL $ZEC $MARSCOIN 30-minute KDJ death cross moving downward; 4-hour bearish trend confirmed 🔥
════════════════════
🟢 $NVDL 30-minute bearish signal
⚠️Technical analysis: 4-hour bearish trend + 30-minute entry confirmation in confluence. EMA5 crossed below EMA8, just forming a death cross and turning bearish. KDJ is weak, with K crossing below D but not yet oversold. Volume increased 1.6x.
════════════════════
🟢 $ZEC 30-minute bearish signal
⚠️Technical analysis: Multiple timeframes align bearishly! 4-hour bearish trend + 30-minute confirmation in the same direction. MACD death cross below zero with rising volume; moving averages are bearishly aligned and pointing down. KDJ death cross, not yet oversold. Volume surged 2.5x.
════════════════════
🟢 $MARSCOIN 30-minute bearish signal
⚠️Technical analysis: Multiple timeframes align for a short: 4-hour bearish trend confirmed; 30-minute MACD death cross below zero with accelerating volume; moving averages are bearishly aligned and diverging downward; KDJ is weak; trading volume increased 1.7x.
════════════════════
🔔 Follow to get the latest market movements 🔔
#多周期共振 #NVDL #ZEC #MARSCOIN
📌 When trading, watch whether the candlestick pattern confirms the signal
════════════════════
🟢 $NVDL 30-minute bearish signal
⚠️Technical analysis: 4-hour bearish trend + 30-minute entry confirmation in confluence. EMA5 crossed below EMA8, just forming a death cross and turning bearish. KDJ is weak, with K crossing below D but not yet oversold. Volume increased 1.6x.
════════════════════
🟢 $ZEC 30-minute bearish signal
⚠️Technical analysis: Multiple timeframes align bearishly! 4-hour bearish trend + 30-minute confirmation in the same direction. MACD death cross below zero with rising volume; moving averages are bearishly aligned and pointing down. KDJ death cross, not yet oversold. Volume surged 2.5x.
════════════════════
🟢 $MARSCOIN 30-minute bearish signal
⚠️Technical analysis: Multiple timeframes align for a short: 4-hour bearish trend confirmed; 30-minute MACD death cross below zero with accelerating volume; moving averages are bearishly aligned and diverging downward; KDJ is weak; trading volume increased 1.7x.
════════════════════
🔔 Follow to get the latest market movements 🔔
#多周期共振 #NVDL #ZEC #MARSCOIN
📌 When trading, watch whether the candlestick pattern confirms the signal
40
·
--
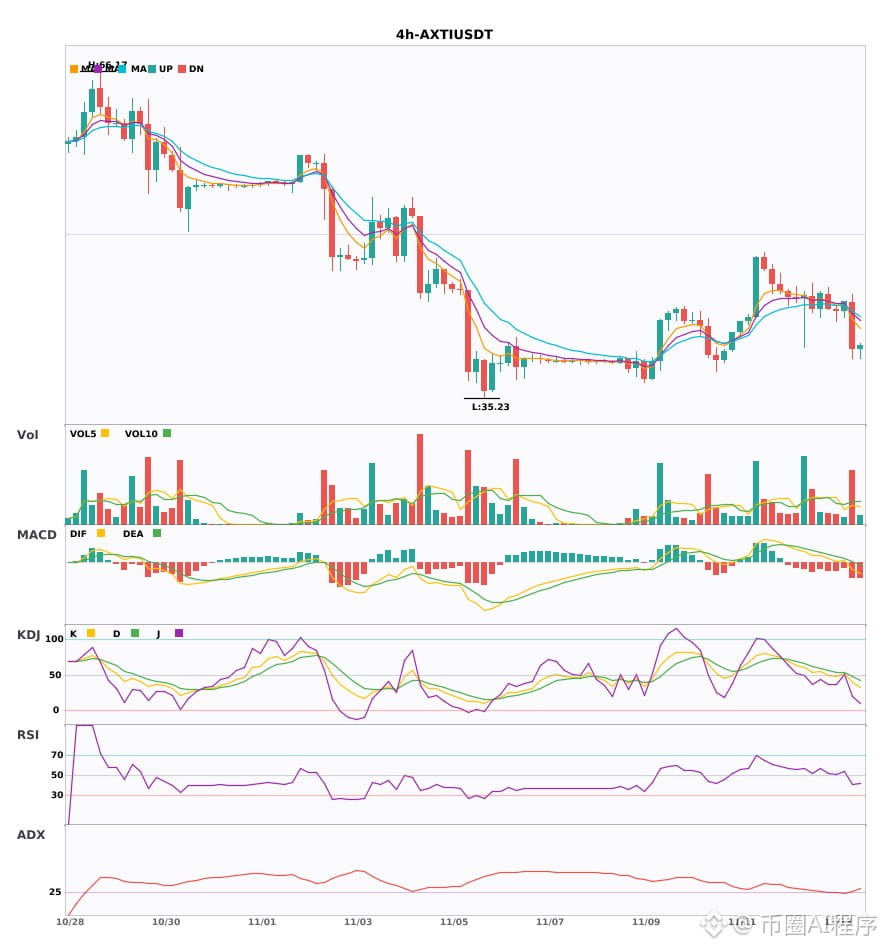
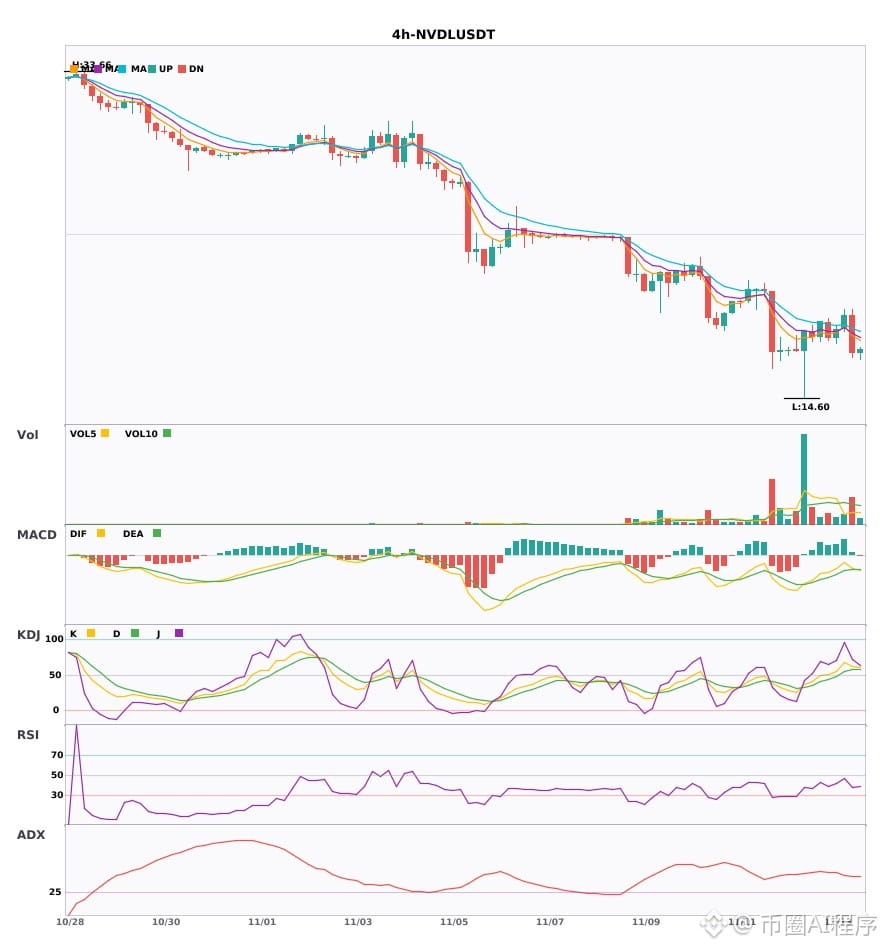
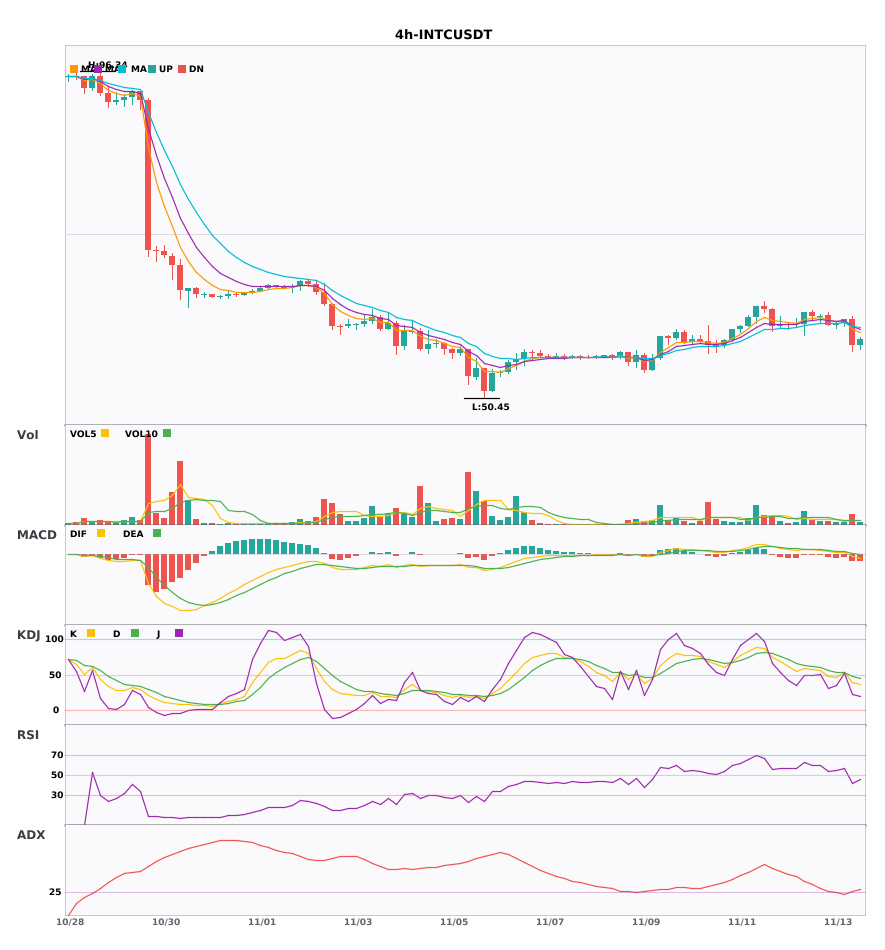
Three coins: dual bearish confluence on the 4-hour and daily charts, with the trend pointing consistently downward 🔥
════════════════════
🟢 $AXTI 4-hour Bearish Signal
⚠️Technical Analysis: Multi-timeframe confluence confirms a short position! Daily bearish trend + 4-hour confluence in the same direction. MACD breaks below the zero line with increasing volume, moving averages are bearishly aligned and pointing down, and KDJ shows a weak death cross without being oversold. Volume is up 2.3x.
════════════════════
🟢 $NVDL 4-hour Bearish Signal
⚠️Technical Analysis: EMA5 crosses below EMA8 on the 4-hour chart, signaling a short entry; the daily bearish confluence confirms it! Although KDJ's K line crosses above D, favoring bulls, this does not change the bearish trend. Volume is at a normal 1.3x.
════════════════════
🟢 $INTC 4-hour Bearish Signal
⚠️Technical Analysis: Bearish signal on the 4-hour chart, confirmed by daily bearish confluence! MACD forms a death cross and breaks below the zero line, moving averages form a death cross and diverge downward, and KDJ remains weak. Volume is up 2.1x.
════════════════════
🔔 Follow for first-hand market alerts 🔔
#多周期共振 #AXTI #NVDL #INTC
📌 When trading, pay attention to whether the candlestick patterns align
Three coins: dual bearish confluence on the 4-hour and daily charts, with the trend pointing consistently downward 🔥
════════════════════
🟢 $AXTI 4-hour Bearish Signal
⚠️Technical Analysis: Multi-timeframe confluence confirms a short position! Daily bearish trend + 4-hour confluence in the same direction. MACD breaks below the zero line with increasing volume, moving averages are bearishly aligned and pointing down, and KDJ shows a weak death cross without being oversold. Volume is up 2.3x.
════════════════════
🟢 $NVDL 4-hour Bearish Signal
⚠️Technical Analysis: EMA5 crosses below EMA8 on the 4-hour chart, signaling a short entry; the daily bearish confluence confirms it! Although KDJ's K line crosses above D, favoring bulls, this does not change the bearish trend. Volume is at a normal 1.3x.
════════════════════
🟢 $INTC 4-hour Bearish Signal
⚠️Technical Analysis: Bearish signal on the 4-hour chart, confirmed by daily bearish confluence! MACD forms a death cross and breaks below the zero line, moving averages form a death cross and diverge downward, and KDJ remains weak. Volume is up 2.1x.
════════════════════
🔔 Follow for first-hand market alerts 🔔
#多周期共振 #AXTI #NVDL #INTC
📌 When trading, pay attention to whether the candlestick patterns align
════════════════════
🟢 $AXTI 4-hour Bearish Signal
⚠️Technical Analysis: Multi-timeframe confluence confirms a short position! Daily bearish trend + 4-hour confluence in the same direction. MACD breaks below the zero line with increasing volume, moving averages are bearishly aligned and pointing down, and KDJ shows a weak death cross without being oversold. Volume is up 2.3x.
════════════════════
🟢 $NVDL 4-hour Bearish Signal
⚠️Technical Analysis: EMA5 crosses below EMA8 on the 4-hour chart, signaling a short entry; the daily bearish confluence confirms it! Although KDJ's K line crosses above D, favoring bulls, this does not change the bearish trend. Volume is at a normal 1.3x.
════════════════════
🟢 $INTC 4-hour Bearish Signal
⚠️Technical Analysis: Bearish signal on the 4-hour chart, confirmed by daily bearish confluence! MACD forms a death cross and breaks below the zero line, moving averages form a death cross and diverge downward, and KDJ remains weak. Volume is up 2.1x.
════════════════════
🔔 Follow for first-hand market alerts 🔔
#多周期共振 #AXTI #NVDL #INTC
📌 When trading, pay attention to whether the candlestick patterns align
10

·
--
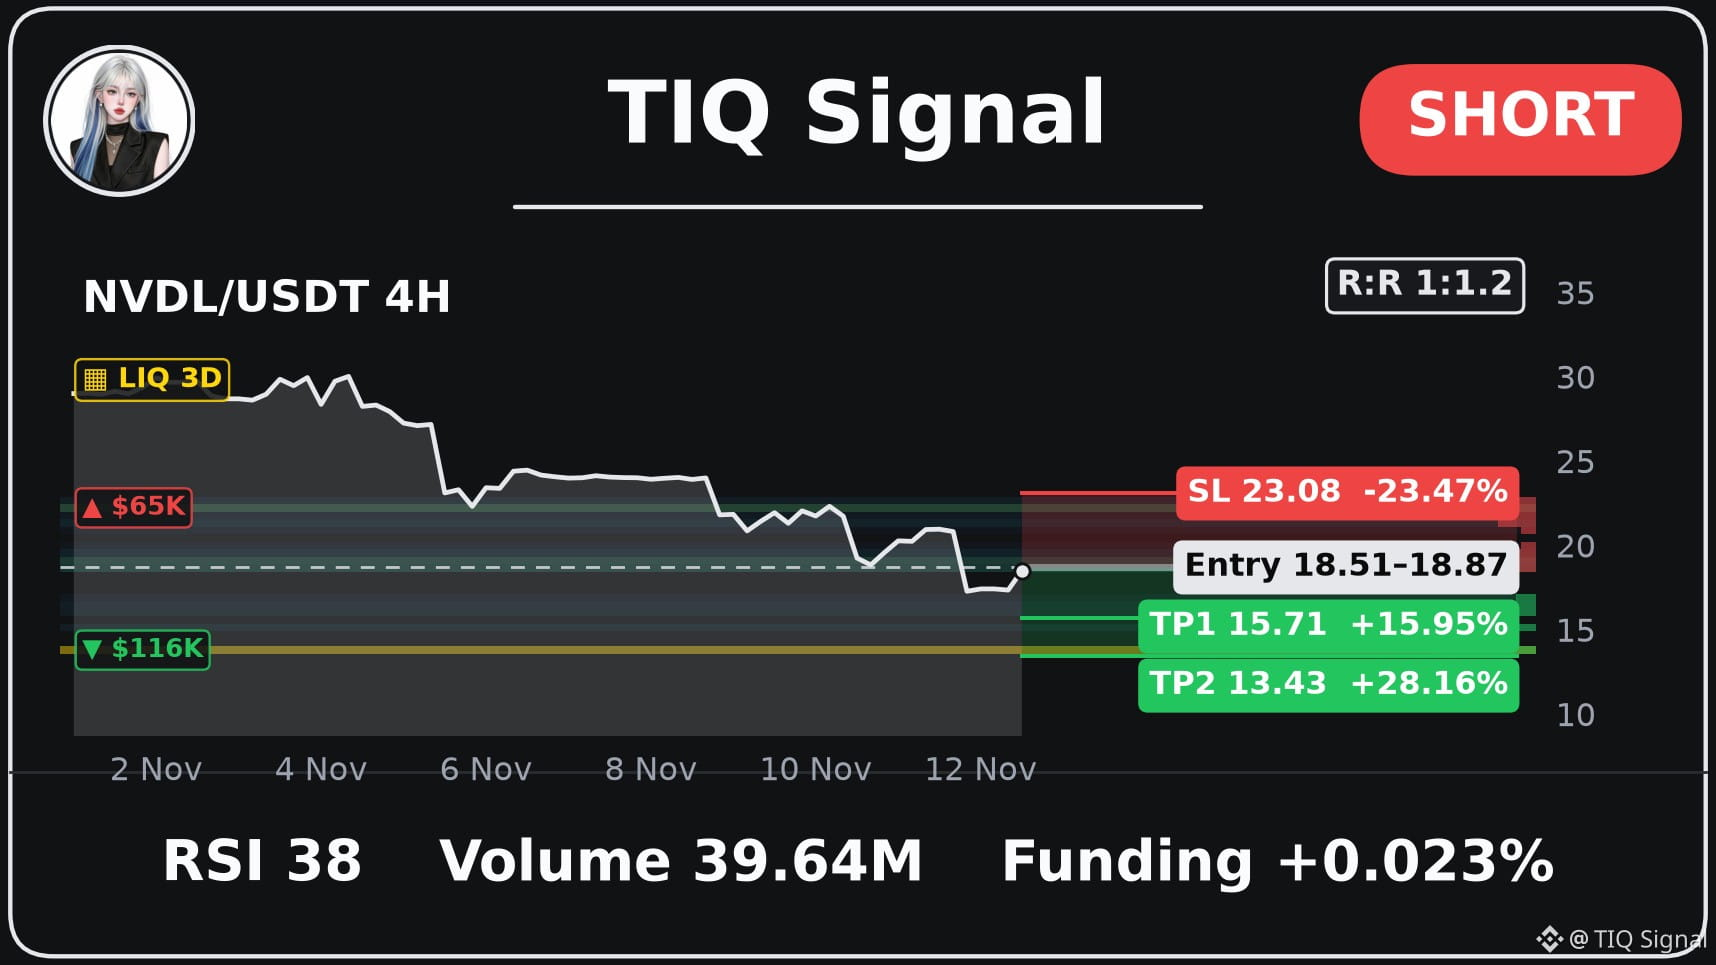
$NVDL ran a bit hard, might need a breather 😮💨
Momentum leaning bearish on the 4H.
Short: 18.87 - 18.51
TP: 15.71 - 13.43 - 9.92
SL: 23.08 (risk ~23.5%)
#NVDL
⚠️ This signal is based on technical indicators and is not investment advice. Always set a stop-loss and manage your own risk.
$NVDL ran a bit hard, might need a breather 😮💨
Momentum leaning bearish on the 4H.
Short: 18.87 - 18.51
TP: 15.71 - 13.43 - 9.92
SL: 23.08 (risk ~23.5%)
#NVDL
⚠️ This signal is based on technical indicators and is not investment advice. Always set a stop-loss and manage your own risk.
Momentum leaning bearish on the 4H.
Short: 18.87 - 18.51
TP: 15.71 - 13.43 - 9.92
SL: 23.08 (risk ~23.5%)
#NVDL
⚠️ This signal is based on technical indicators and is not investment advice. Always set a stop-loss and manage your own risk.
6

·
--
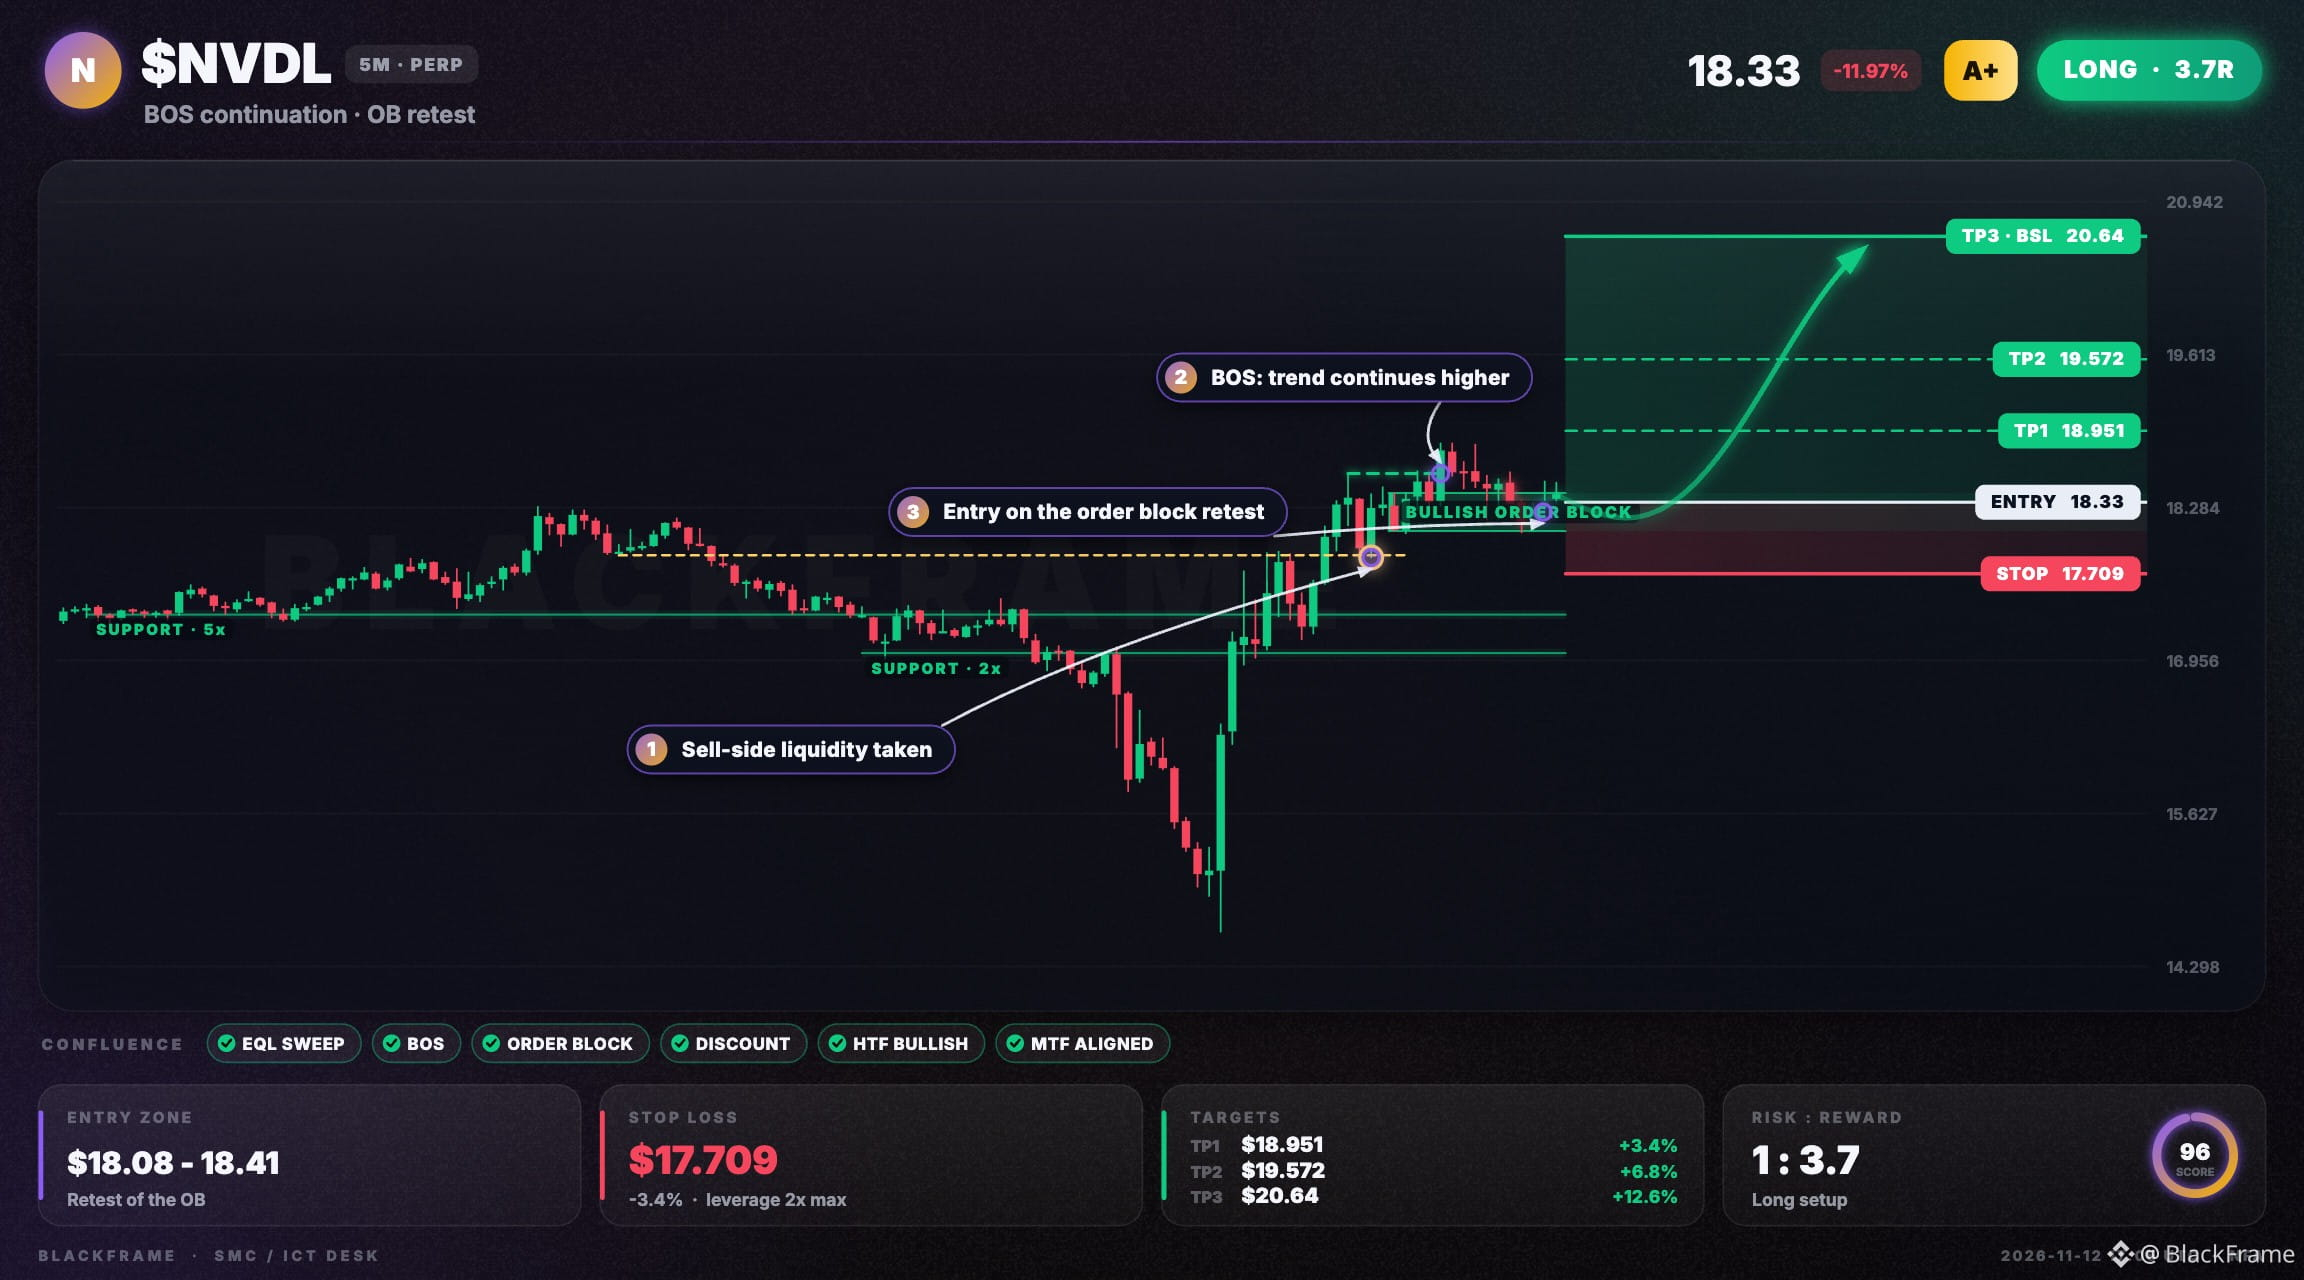
🚀 $NVDL bullish order flow intact
LONG · 5M
Entry: $18.33 - $18.41
TP1: $18.951
TP2: $19.572
TP3: $20.64
SL: $17.709
Sell-side liquidity below the equal lows was swept and price closed back inside. Structure continues higher with a fresh BOS on the 5M. Entry is the first retest of the fresh bullish order block in discount, targeting buy-side liquidity above.
#NVDL #TradingSignals · NFA
🚀 $NVDL bullish order flow intact
LONG · 5M
Entry: $18.33 - $18.41
TP1: $18.951
TP2: $19.572
TP3: $20.64
SL: $17.709
Sell-side liquidity below the equal lows was swept and price closed back inside. Structure continues higher with a fresh BOS on the 5M. Entry is the first retest of the fresh bullish order block in discount, targeting buy-side liquidity above.
#NVDL #TradingSignals · NFA
LONG · 5M
Entry: $18.33 - $18.41
TP1: $18.951
TP2: $19.572
TP3: $20.64
SL: $17.709
Sell-side liquidity below the equal lows was swept and price closed back inside. Structure continues higher with a fresh BOS on the 5M. Entry is the first retest of the fresh bullish order block in discount, targeting buy-side liquidity above.
#NVDL #TradingSignals · NFA
28
·
--
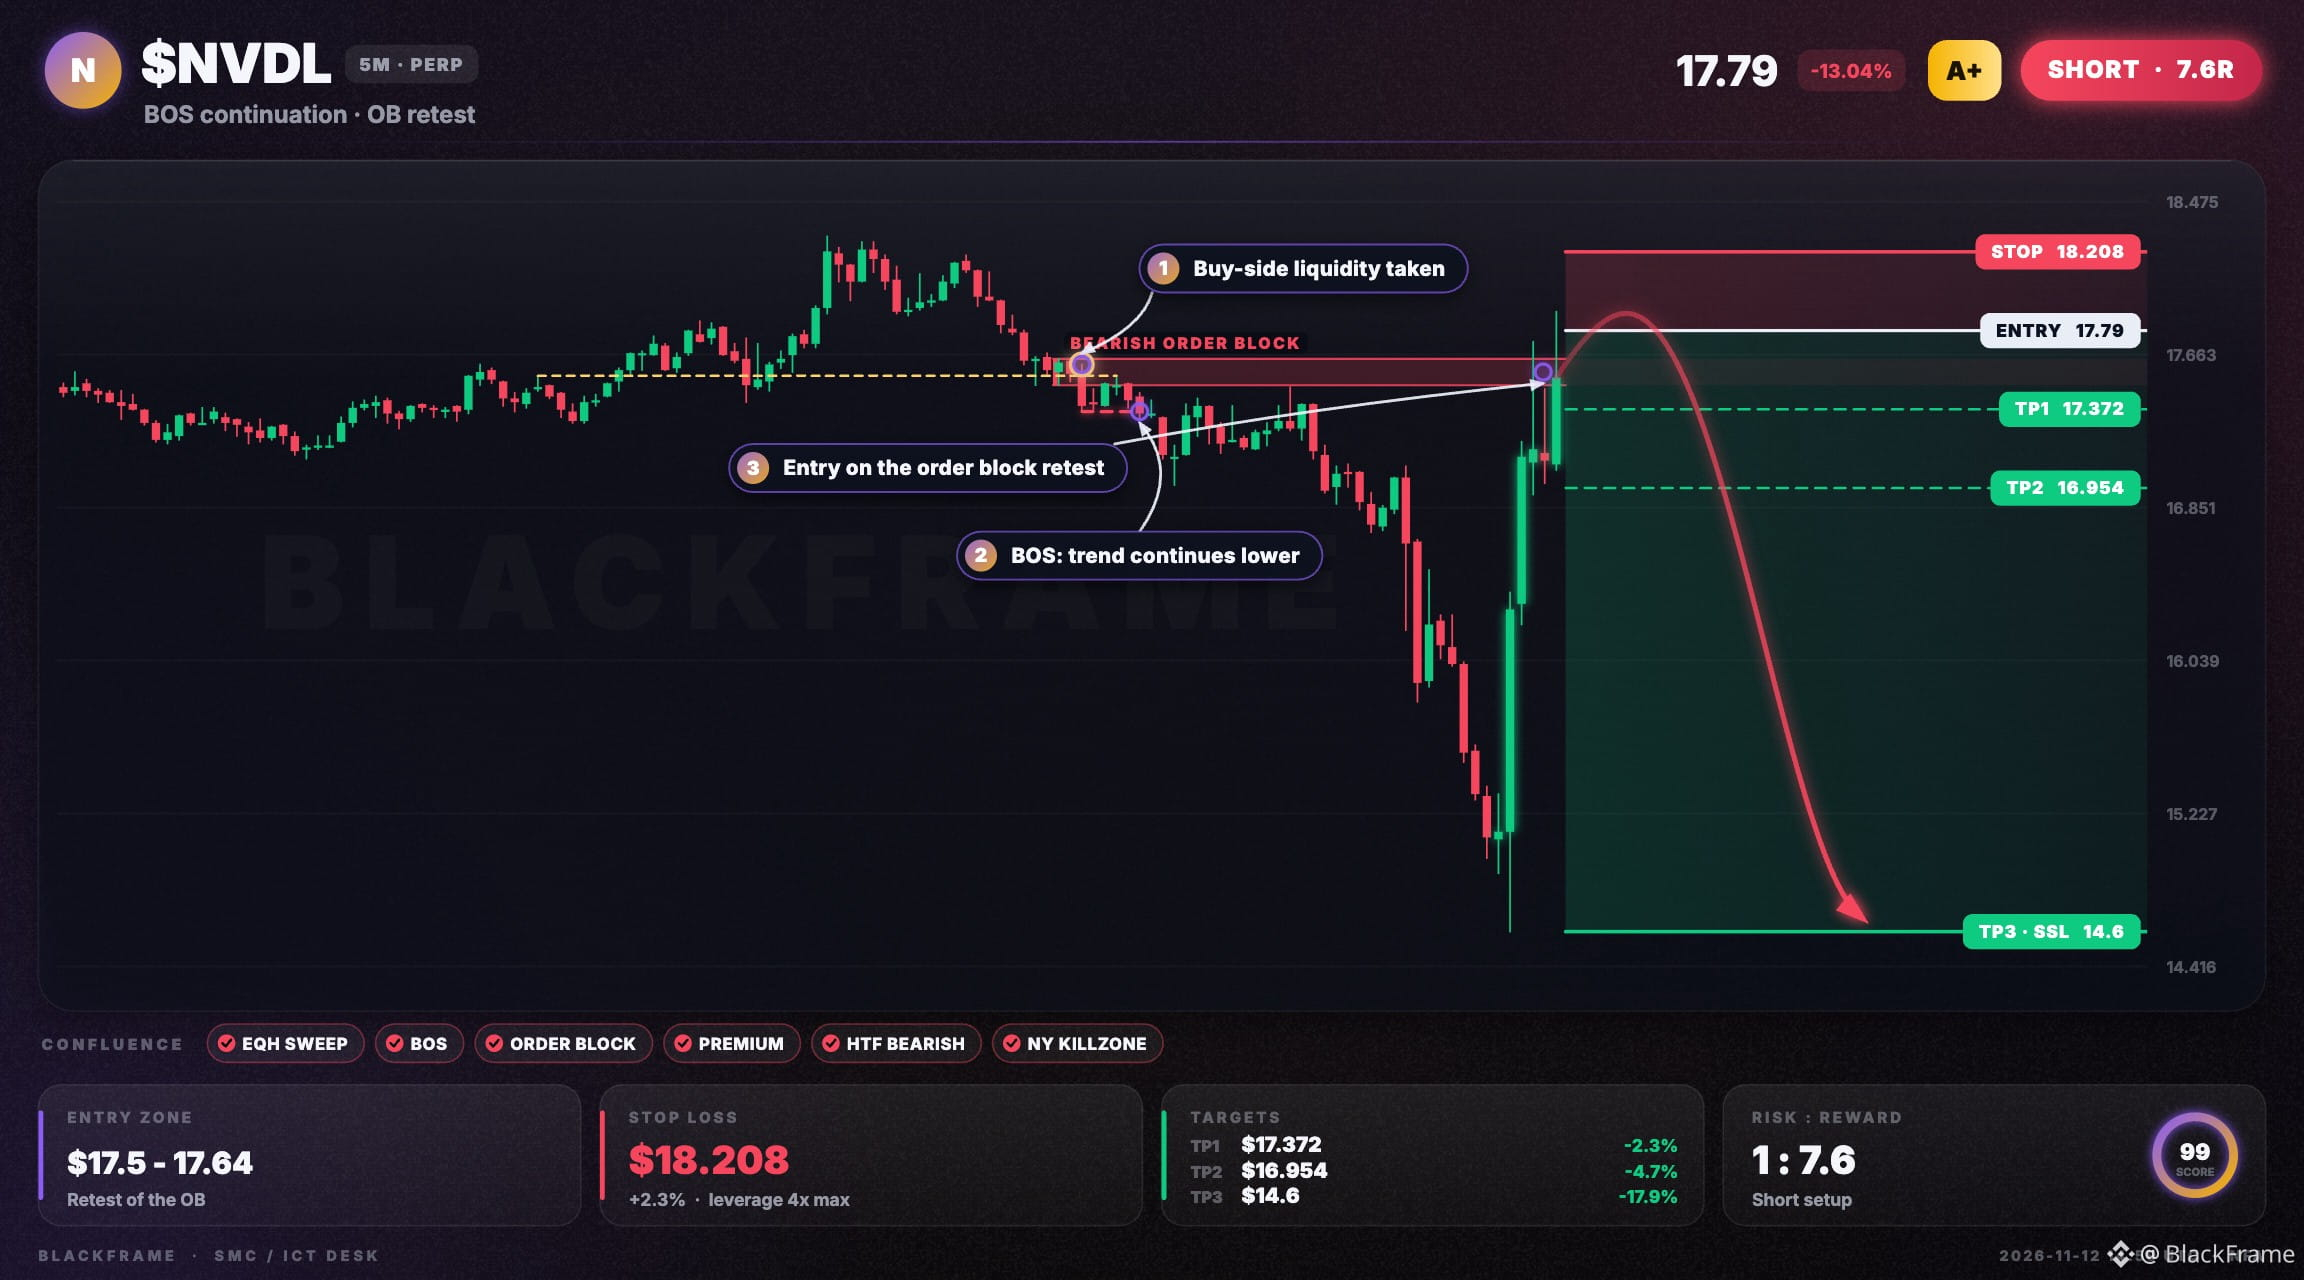
⚡ $NVDL hits fresh low, sell side active
SHORT · 5M
Entry: $17.5 - $17.79
TP1: $17.372
TP2: $16.954
TP3: $14.6
SL: $18.208
Liquidity sweep took buy-side at $17.55, BOS on 5M confirms downtrend. A fresh bearish order block retest offers entry at $17.79 with stop at $18.208. Target is sell‑side liquidity at $14.6.
#NVDL #SMC · NFA
⚡ $NVDL hits fresh low, sell side active
SHORT · 5M
Entry: $17.5 - $17.79
TP1: $17.372
TP2: $16.954
TP3: $14.6
SL: $18.208
Liquidity sweep took buy-side at $17.55, BOS on 5M confirms downtrend. A fresh bearish order block retest offers entry at $17.79 with stop at $18.208. Target is sell‑side liquidity at $14.6.
#NVDL #SMC · NFA
SHORT · 5M
Entry: $17.5 - $17.79
TP1: $17.372
TP2: $16.954
TP3: $14.6
SL: $18.208
Liquidity sweep took buy-side at $17.55, BOS on 5M confirms downtrend. A fresh bearish order block retest offers entry at $17.79 with stop at $18.208. Target is sell‑side liquidity at $14.6.
#NVDL #SMC · NFA
1
54
Log in to explore more content
Join global crypto users on Binance Square
⚡️ Get latest and useful information about crypto.
💬 Trusted by the world’s largest crypto exchange.
👍 Discover real insights from verified creators.
Email / Phone number
Trending Topics
1
#IsAnthropic’s$1.5TMarketCapJustified?
16,869 views
113 Discussing
2
#BTCRemainsUnderPressureAfterHawkishFOMCMinutes
278,419 views
2,173 Discussing
3
#NvidiaBoardReportedlySplitOverHuang’sReturn
135,804 views
1,178 Discussing
4
#StrategySTRCPreferredSlips3.65%Below$100Par
9,452 views
88 Discussing
5
#MASToUpgradeSGDTestnetToSGDigitalLedger
28,299 views
299 Discussing
6
#CanGTA6'sLaunchLiftTTWOShares?
101,610 views
845 Discussing
7
#Solana2027RoadmapTargetsDoubleComputeCapacity
12,253 views
159 Discussing
8
#InjectiveTokenizedRealEstateMortgagesTop$1.5B
1,326 views
29 Discussing
9
#TetherMakesStrategicInvestmentInSCRYPT
9,341 views
116 Discussing
10
#CapitalGroupAdds1264500StrategyShares
36,853 views
250 Discussing