
MurtiTheTrader
682 Posts

MurtiTheTrader
 Square Verified
Report
Block User
US stocks, options flow and crypto. Data-driven daily market notes, no FOMO. Risk first, always. Not financial advice.

TradFi KOL
0 Following
172 Followers
58 Liked
1 Badges
Posts
Verified
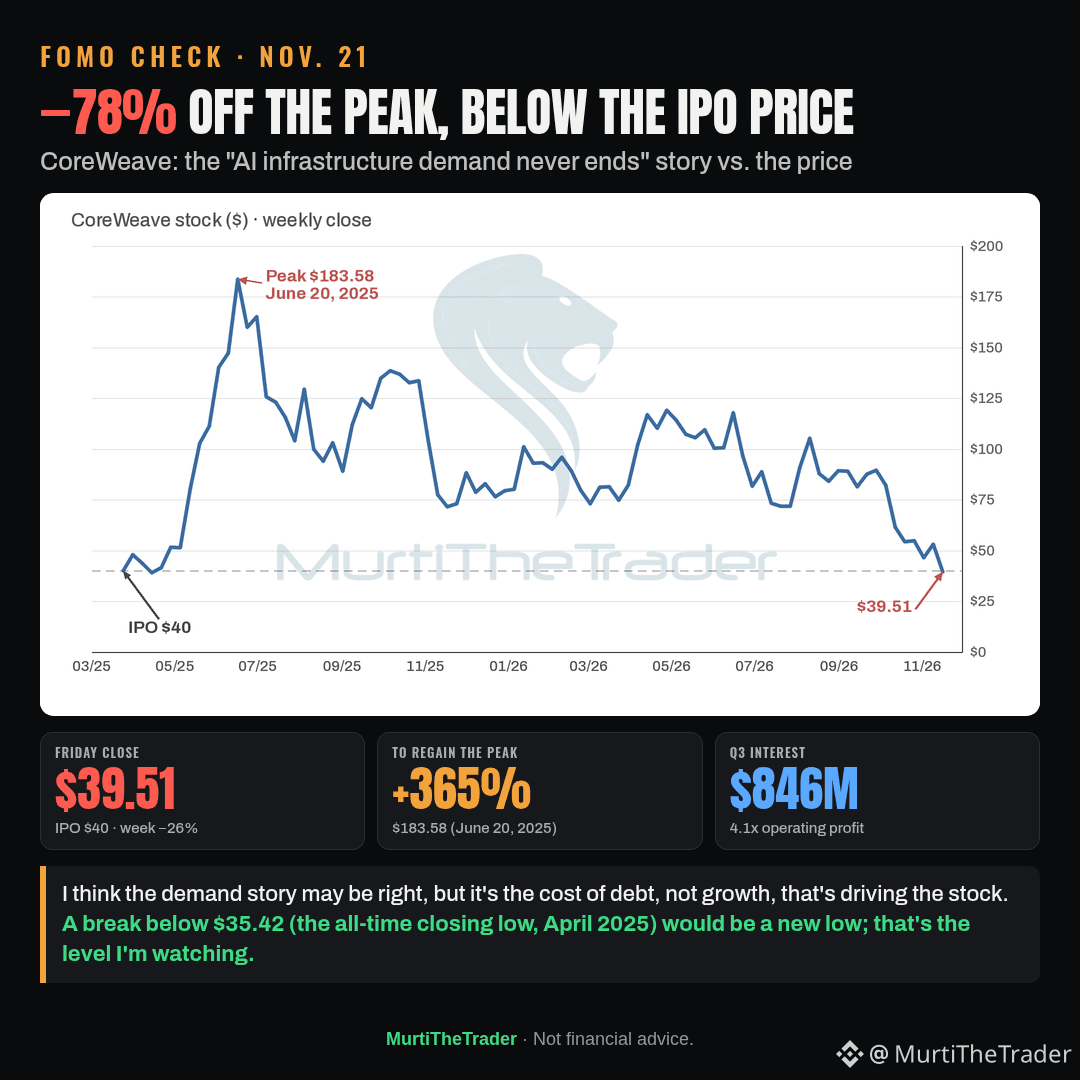
FOMO check: Everyone's saying "AI infrastructure demand never ends, buy the CoreWeave dip."
→ IPO at $40 on March 28, 2025; closing peak $183.58 on June 20, 2025
→ Q3 revenue +168%, net loss $709 million: interest expense $846 million, 4.1x operating profit
→ This week −26%, Friday −12% to $39.51: −78% from the peak, and below the IPO price for the first time since April 2025
I think the demand story may be right, but it's the cost of debt, not growth, that's driving the stock; the $35.42 low is on my radar.
#Stocks #AI
Watching: $CRWV $NVDA $QQQ
FOMO check: Everyone's saying "AI infrastructure demand never ends, buy the CoreWeave dip."
→ IPO at $40 on March 28, 2025; closing peak $183.58 on June 20, 2025
→ Q3 revenue +168%, net loss $709 million: interest expense $846 million, 4.1x operating profit
→ This week −26%, Friday −12% to $39.51: −78% from the peak, and below the IPO price for the first time since April 2025
I think the demand story may be right, but it's the cost of debt, not growth, that's driving the stock; the $35.42 low is on my radar.
#Stocks #AI
Watching: $CRWV $NVDA $QQQ
→ IPO at $40 on March 28, 2025; closing peak $183.58 on June 20, 2025
→ Q3 revenue +168%, net loss $709 million: interest expense $846 million, 4.1x operating profit
→ This week −26%, Friday −12% to $39.51: −78% from the peak, and below the IPO price for the first time since April 2025
I think the demand story may be right, but it's the cost of debt, not growth, that's driving the stock; the $35.42 low is on my radar.
#Stocks #AI
Watching: $CRWV $NVDA $QQQ
850
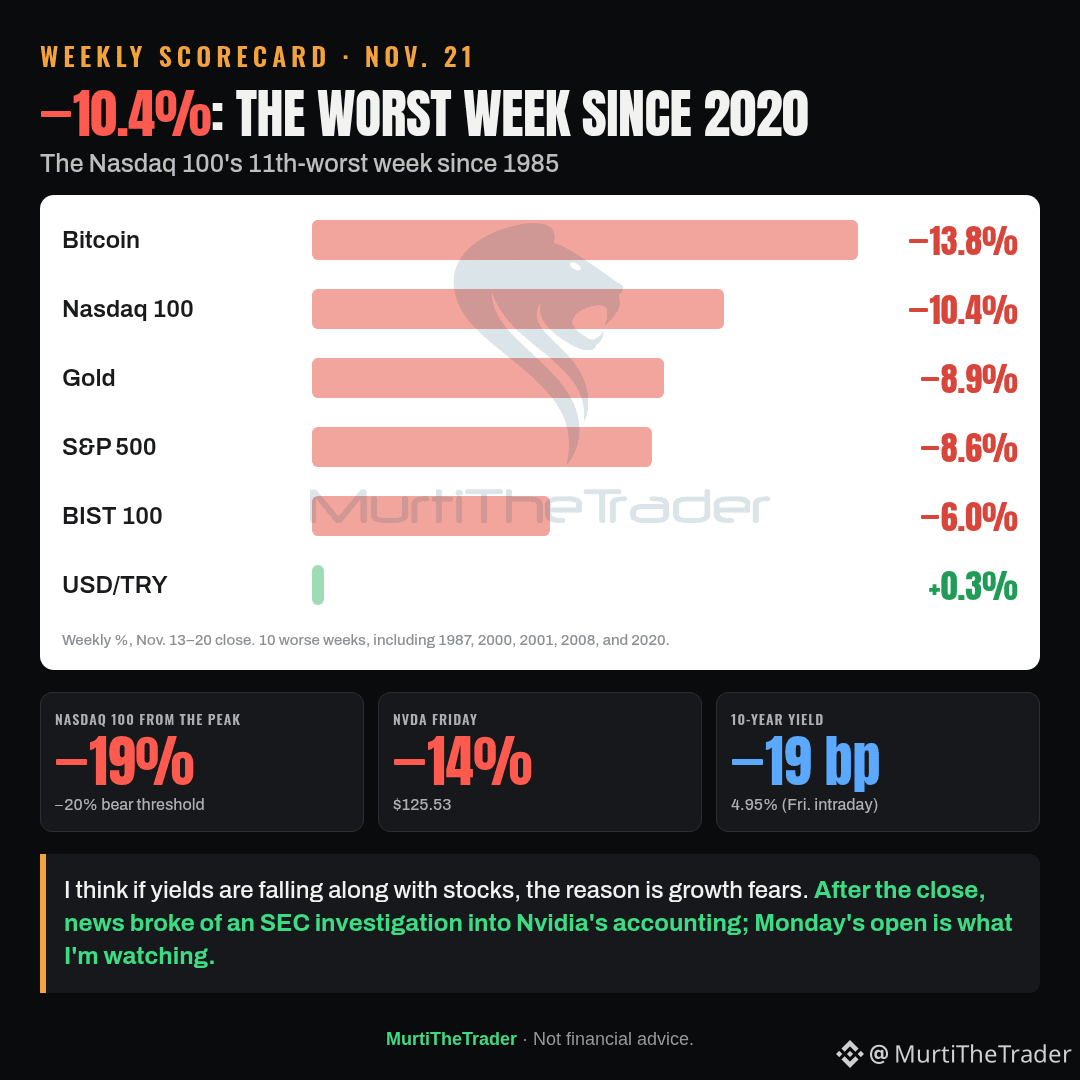
Weekly scorecard: the Nasdaq 100 had its worst week since March 2020, down 10.4%.
→ S&P 500 −8.6%, BIST 100 −6.0%, gold −8.9%, bitcoin −13.8%, USD/TRY +0.3%, the 10-year yield −19 bp
→ There have been 10 worse weeks since 1985, including 1987, the 2000 dot-com bust, 9/11, the 2008 crisis, and the 2020 pandemic
→ The Nasdaq 100 is 19% below its peak; Nvidia fell 14% on Friday, and after the close came news of an SEC accounting investigation
I think if yields are falling along with stocks, the reason is growth fears; the −20% threshold and Monday's Nvidia open are what I'm watching.
#Stocks #Economy #Bitcoin
Watching: $NVDA $QQQ $SPY
Weekly scorecard: the Nasdaq 100 had its worst week since March 2020, down 10.4%.
→ S&P 500 −8.6%, BIST 100 −6.0%, gold −8.9%, bitcoin −13.8%, USD/TRY +0.3%, the 10-year yield −19 bp
→ There have been 10 worse weeks since 1985, including 1987, the 2000 dot-com bust, 9/11, the 2008 crisis, and the 2020 pandemic
→ The Nasdaq 100 is 19% below its peak; Nvidia fell 14% on Friday, and after the close came news of an SEC accounting investigation
I think if yields are falling along with stocks, the reason is growth fears; the −20% threshold and Monday's Nvidia open are what I'm watching.
#Stocks #Economy #Bitcoin
Watching: $NVDA $QQQ $SPY
→ S&P 500 −8.6%, BIST 100 −6.0%, gold −8.9%, bitcoin −13.8%, USD/TRY +0.3%, the 10-year yield −19 bp
→ There have been 10 worse weeks since 1985, including 1987, the 2000 dot-com bust, 9/11, the 2008 crisis, and the 2020 pandemic
→ The Nasdaq 100 is 19% below its peak; Nvidia fell 14% on Friday, and after the close came news of an SEC accounting investigation
I think if yields are falling along with stocks, the reason is growth fears; the −20% threshold and Monday's Nvidia open are what I'm watching.
#Stocks #Economy #Bitcoin
Watching: $NVDA $QQQ $SPY
1
1
554
Partly True
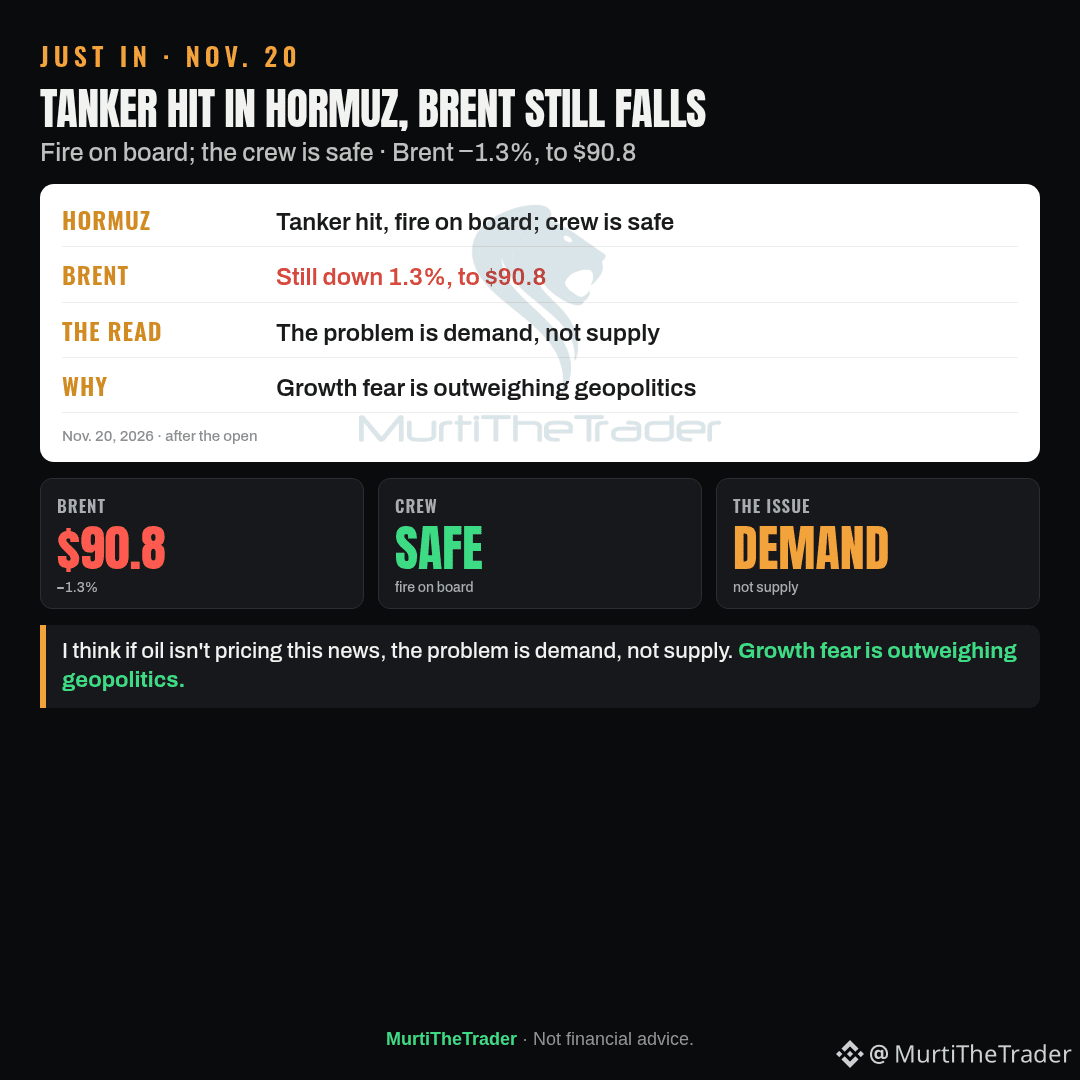
Just in: a tanker was hit in the Strait of Hormuz and caught fire; the crew is safe.
→ Brent is down 1.3% anyway, to $90.8
I think if oil isn't pricing this news, the problem is demand, not supply; growth fear is outweighing geopolitics.
#Stocks #Economy
Watching: $USO $XLE $XOM
Just in: a tanker was hit in the Strait of Hormuz and caught fire; the crew is safe.
→ Brent is down 1.3% anyway, to $90.8
I think if oil isn't pricing this news, the problem is demand, not supply; growth fear is outweighing geopolitics.
#Stocks #Economy
Watching: $USO $XLE $XOM
→ Brent is down 1.3% anyway, to $90.8
I think if oil isn't pricing this news, the problem is demand, not supply; growth fear is outweighing geopolitics.
#Stocks #Economy
Watching: $USO $XLE $XOM
1
519
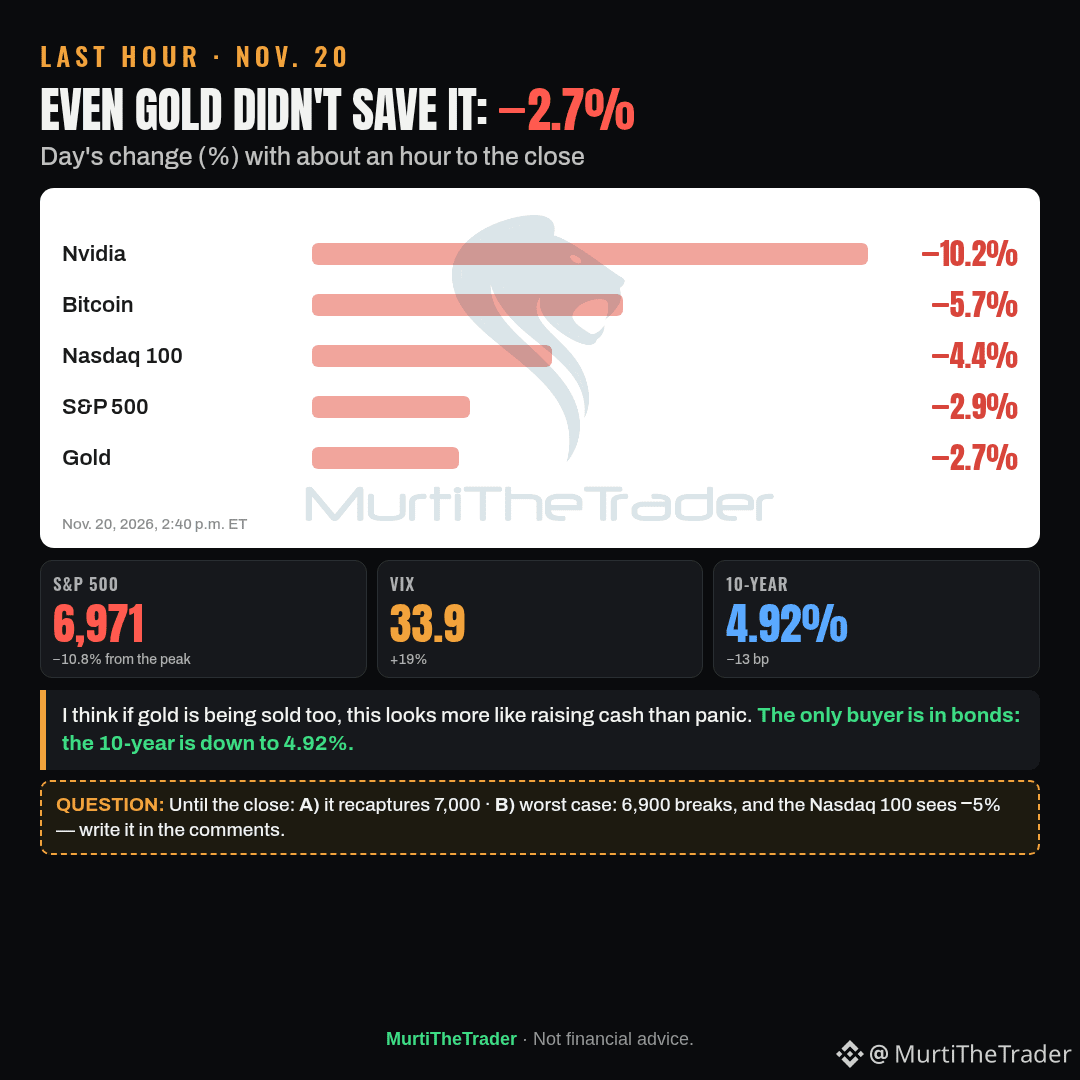
In the last hour: the S&P 500 is down 2.9% at 6,971, −10.8% from the Oct. 6 peak; the Nasdaq 100 −4.4%, VIX 33.9.
→ The chip selloff deepened into the close, Nvidia −10.2% to $131
→ Gold −2.7%, Bitcoin −5.7%; the only buyer is in bonds, the 10-year at 4.92% (−13 bp)
I think if gold is being sold too, this looks more like raising cash than panic.
Until the close: A) it recaptures 7,000 B) worst case: 6,900 breaks and the Nasdaq 100 sees −5% — write it in the comments.
#Stocks #Economy
Watching: $NVDA $SPY $QQQ
In the last hour: the S&P 500 is down 2.9% at 6,971, −10.8% from the Oct. 6 peak; the Nasdaq 100 −4.4%, VIX 33.9.
→ The chip selloff deepened into the close, Nvidia −10.2% to $131
→ Gold −2.7%, Bitcoin −5.7%; the only buyer is in bonds, the 10-year at 4.92% (−13 bp)
I think if gold is being sold too, this looks more like raising cash than panic.
Until the close: A) it recaptures 7,000 B) worst case: 6,900 breaks and the Nasdaq 100 sees −5% — write it in the comments.
#Stocks #Economy
Watching: $NVDA $SPY $QQQ
→ The chip selloff deepened into the close, Nvidia −10.2% to $131
→ Gold −2.7%, Bitcoin −5.7%; the only buyer is in bonds, the 10-year at 4.92% (−13 bp)
I think if gold is being sold too, this looks more like raising cash than panic.
Until the close: A) it recaptures 7,000 B) worst case: 6,900 breaks and the Nasdaq 100 sees −5% — write it in the comments.
#Stocks #Economy
Watching: $NVDA $SPY $QQQ
362
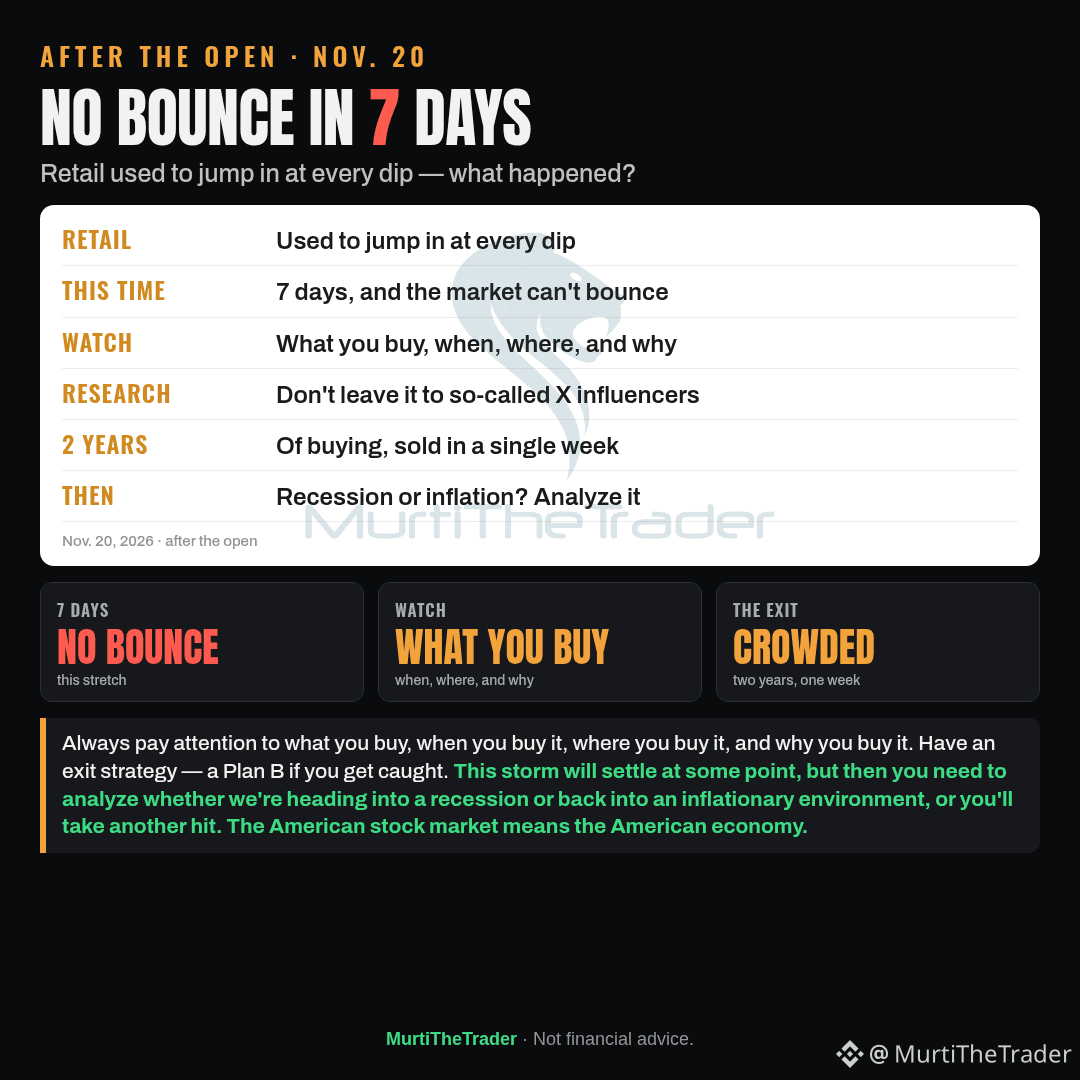
Retail used to jump in at every dip — what happened? This time the market hasn't been able to bounce for 7 days.
What's happened is their money ran out. They got stuck in the stocks they were led to believe would fly, that's what happened.
So always pay attention to what you buy, when you buy it, where you buy it, and why you buy it. Don't leave the research to so-called X influencers. What do they even know that they're telling you what to do? Some people can talk a good game, the numbers can look convincing in the moment, and you get FOMO. That's perfectly normal. Just develop an exit strategy for yourself next time. At least if you get caught, you'll have a Plan B.
90% of them have the same market history as you — you just don't realize it. The guys you call gurus started in the market at the same time as you. They're just the outgoing types who opened an account and took the opportunity. Otherwise they're no different from you. Always do your own research. Watch who you follow, and whether there's actually knowledge there or a stock being marketed.
As for the institutions and investors around the world: everyone has been buying for two years. Compress two years of slowly accumulated buying into one week of selling, and the market simply can't bounce — everyone is lined up at the exit. This storm will settle at some point, but then you need to analyze whether we're heading into a recession or back into an inflationary environment, or you'll take another hit. Unemployment is supposedly nonexistent, GDP is great, and then you look — companies are laying people off left and right, and suddenly unemployment is everywhere.
The American stock market means the American economy. Laugh off anyone who says it doesn't.
Cheers.
#Stocks #Economy
Watching: $NVDA $MU $AMD
Retail used to jump in at every dip — what happened? This time the market hasn't been able to bounce for 7 days.
What's happened is their money ran out. They got stuck in the stocks they were led to believe would fly, that's what happened.
So always pay attention to what you buy, when you buy it, where you buy it, and why you buy it. Don't leave the research to so-called X influencers. What do they even know that they're telling you what to do? Some people can talk a good game, the numbers can look convincing in the moment, and you get FOMO. That's perfectly normal. Just develop an exit strategy for yourself next time. At least if you get caught, you'll have a Plan B.
90% of them have the same market history as you — you just don't realize it. The guys you call gurus started in the market at the same time as you. They're just the outgoing types who opened an account and took the opportunity. Otherwise they're no different from you. Always do your own research. Watch who you follow, and whether there's actually knowledge there or a stock being marketed.
As for the institutions and investors around the world: everyone has been buying for two years. Compress two years of slowly accumulated buying into one week of selling, and the market simply can't bounce — everyone is lined up at the exit. This storm will settle at some point, but then you need to analyze whether we're heading into a recession or back into an inflationary environment, or you'll take another hit. Unemployment is supposedly nonexistent, GDP is great, and then you look — companies are laying people off left and right, and suddenly unemployment is everywhere.
The American stock market means the American economy. Laugh off anyone who says it doesn't.
Cheers.
#Stocks #Economy
Watching: $NVDA $MU $AMD
What's happened is their money ran out. They got stuck in the stocks they were led to believe would fly, that's what happened.
So always pay attention to what you buy, when you buy it, where you buy it, and why you buy it. Don't leave the research to so-called X influencers. What do they even know that they're telling you what to do? Some people can talk a good game, the numbers can look convincing in the moment, and you get FOMO. That's perfectly normal. Just develop an exit strategy for yourself next time. At least if you get caught, you'll have a Plan B.
90% of them have the same market history as you — you just don't realize it. The guys you call gurus started in the market at the same time as you. They're just the outgoing types who opened an account and took the opportunity. Otherwise they're no different from you. Always do your own research. Watch who you follow, and whether there's actually knowledge there or a stock being marketed.
As for the institutions and investors around the world: everyone has been buying for two years. Compress two years of slowly accumulated buying into one week of selling, and the market simply can't bounce — everyone is lined up at the exit. This storm will settle at some point, but then you need to analyze whether we're heading into a recession or back into an inflationary environment, or you'll take another hit. Unemployment is supposedly nonexistent, GDP is great, and then you look — companies are laying people off left and right, and suddenly unemployment is everywhere.
The American stock market means the American economy. Laugh off anyone who says it doesn't.
Cheers.
#Stocks #Economy
Watching: $NVDA $MU $AMD
2
4
3.4k
Verified
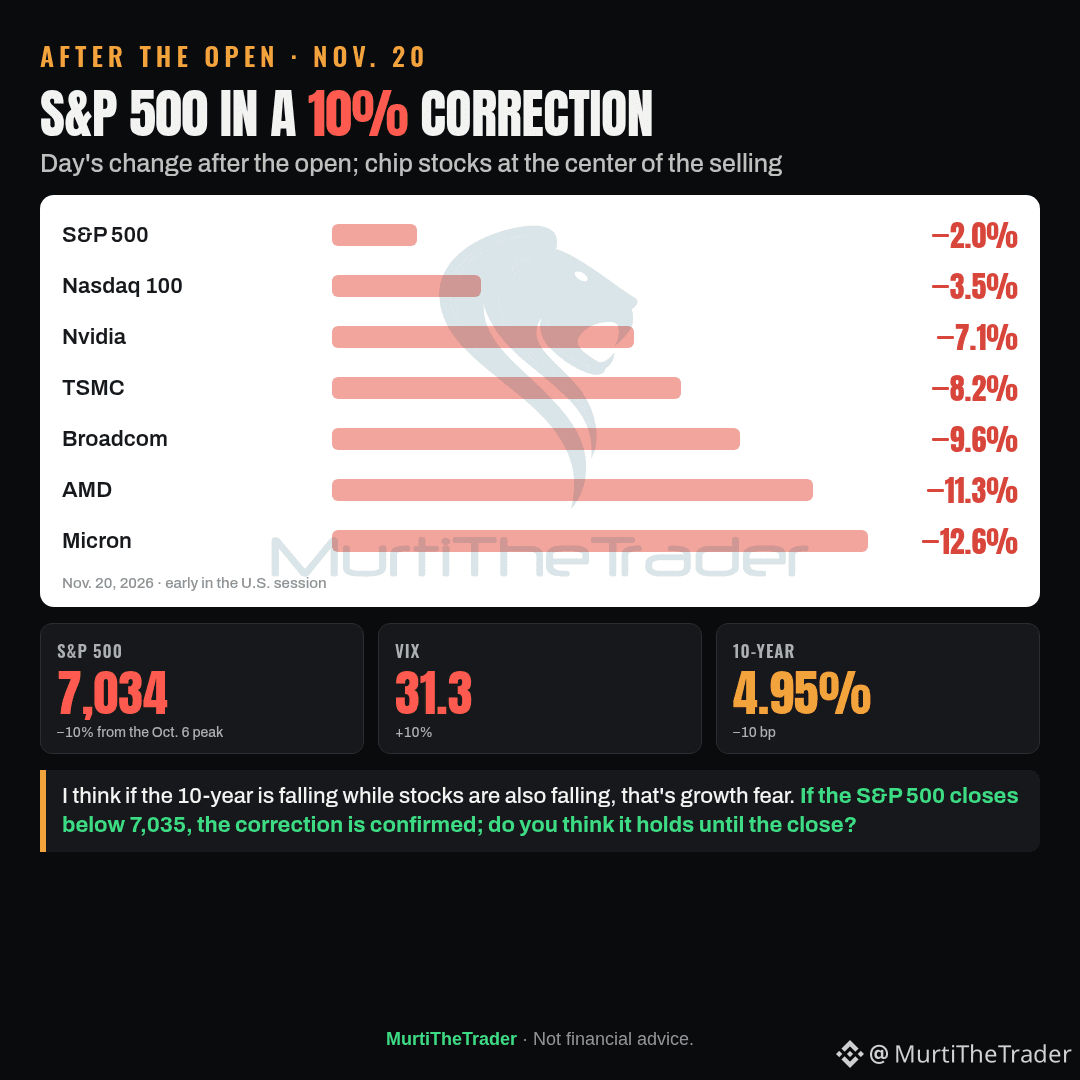
After the open: the S&P 500 is officially in a correction, −10% from the Oct. 6 peak, at 7,034 (−2.0%).
→ Pre-open futures were showing 7,120; the selloff deepened after the open, and the Nasdaq 100 is −3.5%
→ Sharp selling in chips: Micron −12.6%, AMD −11.3%, Broadcom −9.6%, Nvidia −7.1%
→ VIX 31.3, the 10-year at 4.95% (−10 bp)
I think if the 10-year is falling while stocks are also falling, that's growth fear. If the S&P 500 closes below 7,035, the correction is confirmed; do you think it holds until the close?
#Stocks #Economy
Watching: $MU $AMD $AVGO
After the open: the S&P 500 is officially in a correction, −10% from the Oct. 6 peak, at 7,034 (−2.0%).
→ Pre-open futures were showing 7,120; the selloff deepened after the open, and the Nasdaq 100 is −3.5%
→ Sharp selling in chips: Micron −12.6%, AMD −11.3%, Broadcom −9.6%, Nvidia −7.1%
→ VIX 31.3, the 10-year at 4.95% (−10 bp)
I think if the 10-year is falling while stocks are also falling, that's growth fear. If the S&P 500 closes below 7,035, the correction is confirmed; do you think it holds until the close?
#Stocks #Economy
Watching: $MU $AMD $AVGO
→ Pre-open futures were showing 7,120; the selloff deepened after the open, and the Nasdaq 100 is −3.5%
→ Sharp selling in chips: Micron −12.6%, AMD −11.3%, Broadcom −9.6%, Nvidia −7.1%
→ VIX 31.3, the 10-year at 4.95% (−10 bp)
I think if the 10-year is falling while stocks are also falling, that's growth fear. If the S&P 500 closes below 7,035, the correction is confirmed; do you think it holds until the close?
#Stocks #Economy
Watching: $MU $AMD $AVGO
1k
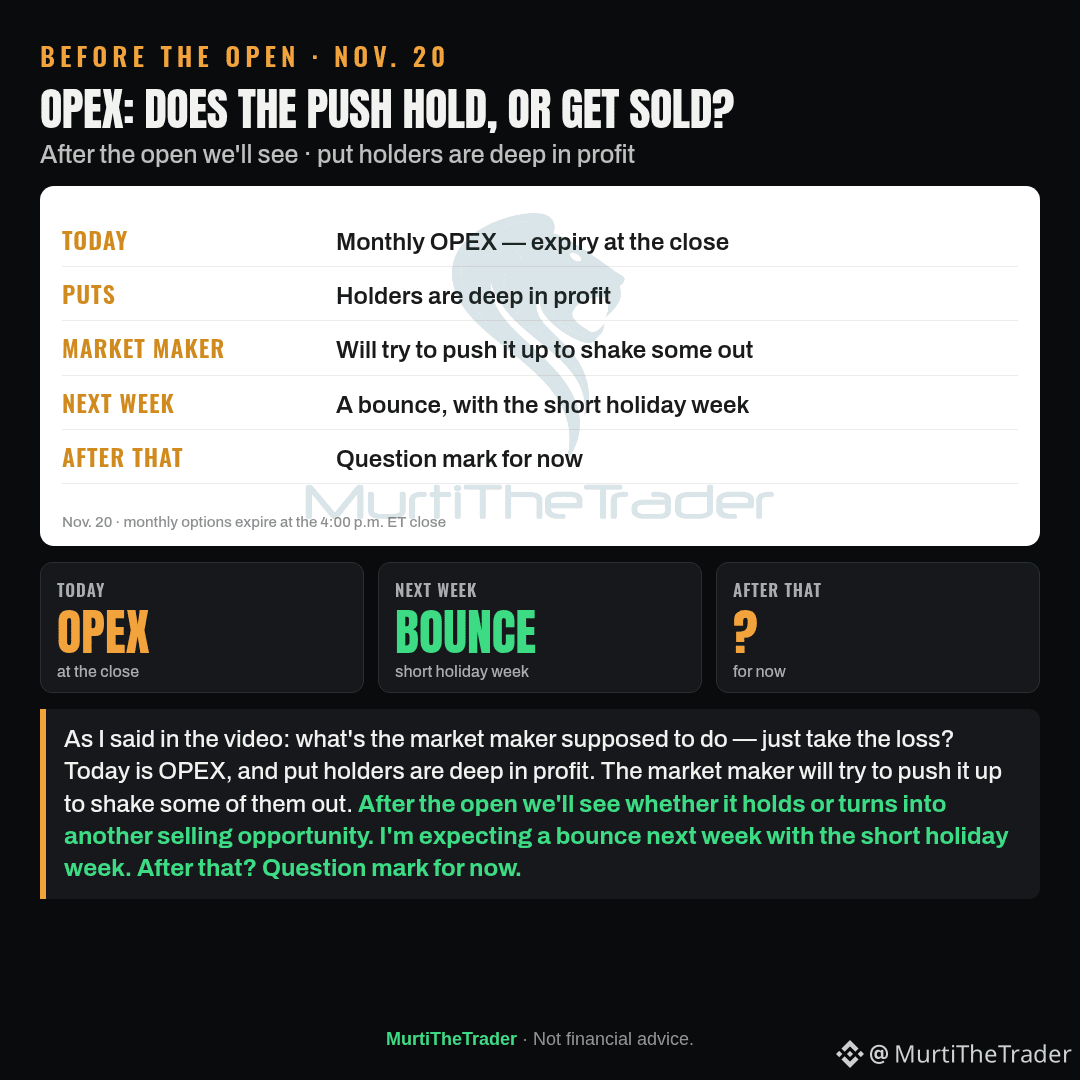
Before the open, as I said in the video: what's the market maker supposed to do — just take the loss? Today is OPEX. Put holders are deep in profit. The market maker will definitely try to push it up to shake some of them out. After the open we'll see whether it holds or turns into another selling opportunity. But I'm expecting a bounce next week with the short holiday week. After that?
Question mark for now.
#Stocks #Economy
Watching: $SPY $QQQ $IWM
Before the open, as I said in the video: what's the market maker supposed to do — just take the loss? Today is OPEX. Put holders are deep in profit. The market maker will definitely try to push it up to shake some of them out. After the open we'll see whether it holds or turns into another selling opportunity. But I'm expecting a bounce next week with the short holiday week. After that?
Question mark for now.
#Stocks #Economy
Watching: $SPY $QQQ $IWM
Question mark for now.
#Stocks #Economy
Watching: $SPY $QQQ $IWM
674
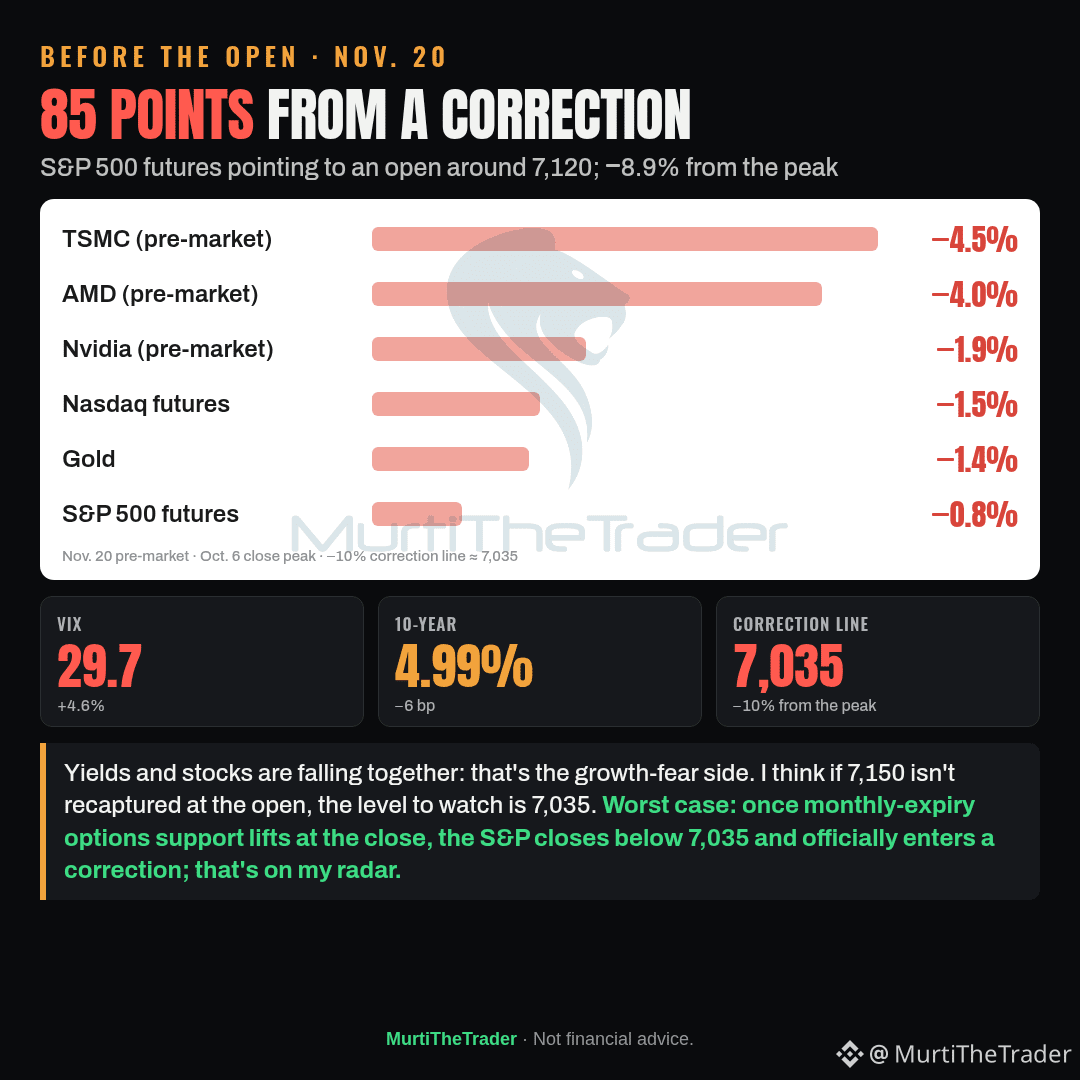
Before the open, S&P 500 futures were down 0.8%, pointing to an open around 7,120; that's −8.9% from the Oct. 6 peak, and 85 points from the −10% correction line.
→ Nasdaq futures −1.5%, VIX 29.7
→ Before the open, TSMC −4.5%, AMD −4.0% (yesterday −7.7%), Nvidia −1.9%
→ The 10-year at 4.99% (−6 bp), gold −1.4%; yields and stocks were both falling — that's the growth-fear side
I think if 7,150 isn't recaptured at the open, the level to watch is 7,035. Worst case: once monthly-expiry options support lifts at the close, the S&P closes below 7,035 and officially enters a correction; that's on my radar.
#Stocks #Economy
Watching: $TSM $AMD $NVDA
Before the open, S&P 500 futures were down 0.8%, pointing to an open around 7,120; that's −8.9% from the Oct. 6 peak, and 85 points from the −10% correction line.
→ Nasdaq futures −1.5%, VIX 29.7
→ Before the open, TSMC −4.5%, AMD −4.0% (yesterday −7.7%), Nvidia −1.9%
→ The 10-year at 4.99% (−6 bp), gold −1.4%; yields and stocks were both falling — that's the growth-fear side
I think if 7,150 isn't recaptured at the open, the level to watch is 7,035. Worst case: once monthly-expiry options support lifts at the close, the S&P closes below 7,035 and officially enters a correction; that's on my radar.
#Stocks #Economy
Watching: $TSM $AMD $NVDA
→ Nasdaq futures −1.5%, VIX 29.7
→ Before the open, TSMC −4.5%, AMD −4.0% (yesterday −7.7%), Nvidia −1.9%
→ The 10-year at 4.99% (−6 bp), gold −1.4%; yields and stocks were both falling — that's the growth-fear side
I think if 7,150 isn't recaptured at the open, the level to watch is 7,035. Worst case: once monthly-expiry options support lifts at the close, the S&P closes below 7,035 and officially enters a correction; that's on my radar.
#Stocks #Economy
Watching: $TSM $AMD $NVDA
449
Partly True
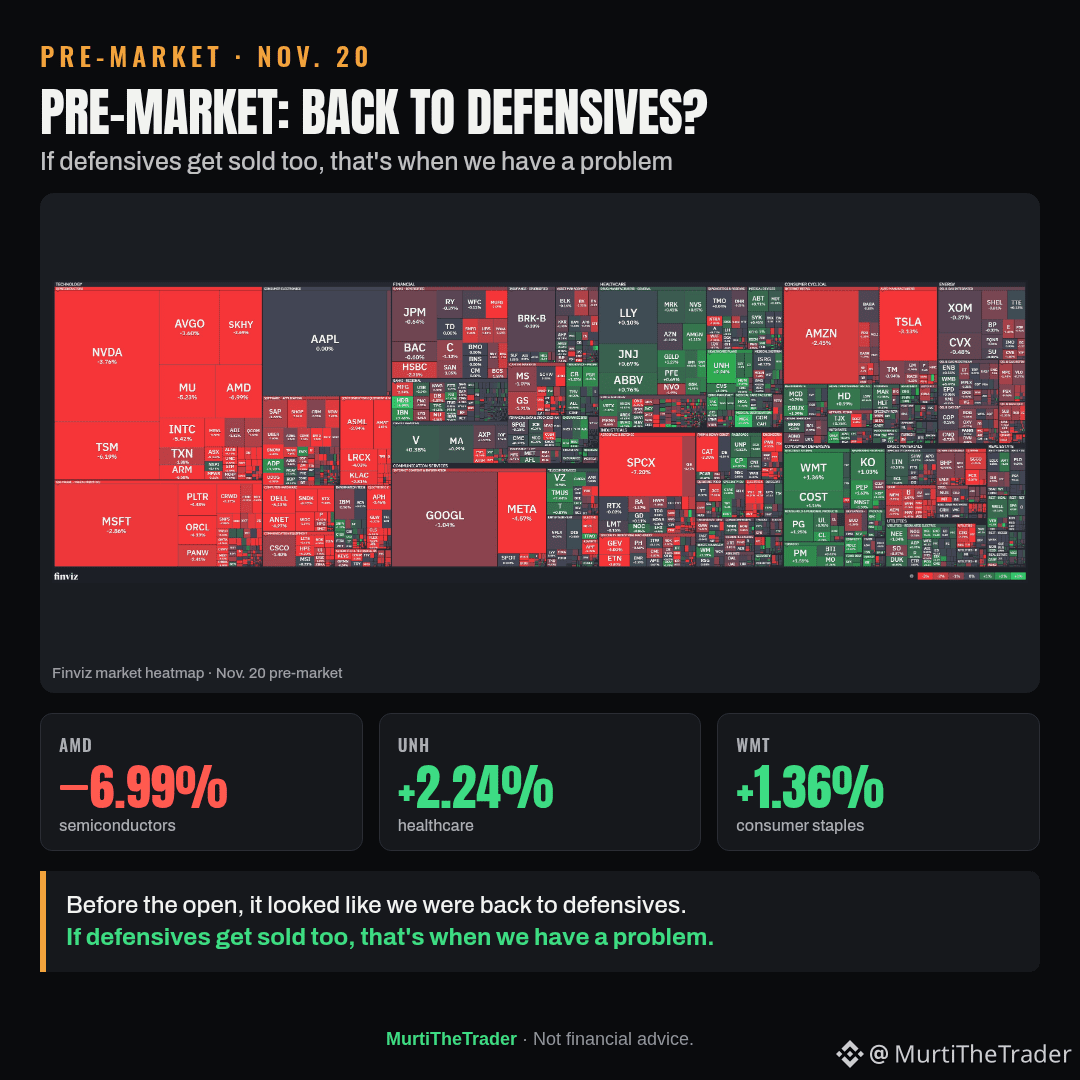
Before the open, it looked like we were back to defensives. If defensives get sold too, that's when we have a problem.
→ Semiconductors were sold (AMD −6.99%, TSM −6.19%, NVDA −3.76%) while staples and healthcare were bid (WMT +1.36%, KO +1.03%, UNH +2.24%).
Chart: Finviz, Nov. 20 pre-market.
#Stocks #Economy
Watching: $NVDA $KO $WMT
Before the open, it looked like we were back to defensives. If defensives get sold too, that's when we have a problem.
→ Semiconductors were sold (AMD −6.99%, TSM −6.19%, NVDA −3.76%) while staples and healthcare were bid (WMT +1.36%, KO +1.03%, UNH +2.24%).
Chart: Finviz, Nov. 20 pre-market.
#Stocks #Economy
Watching: $NVDA $KO $WMT
→ Semiconductors were sold (AMD −6.99%, TSM −6.19%, NVDA −3.76%) while staples and healthcare were bid (WMT +1.36%, KO +1.03%, UNH +2.24%).
Chart: Finviz, Nov. 20 pre-market.
#Stocks #Economy
Watching: $NVDA $KO $WMT
810
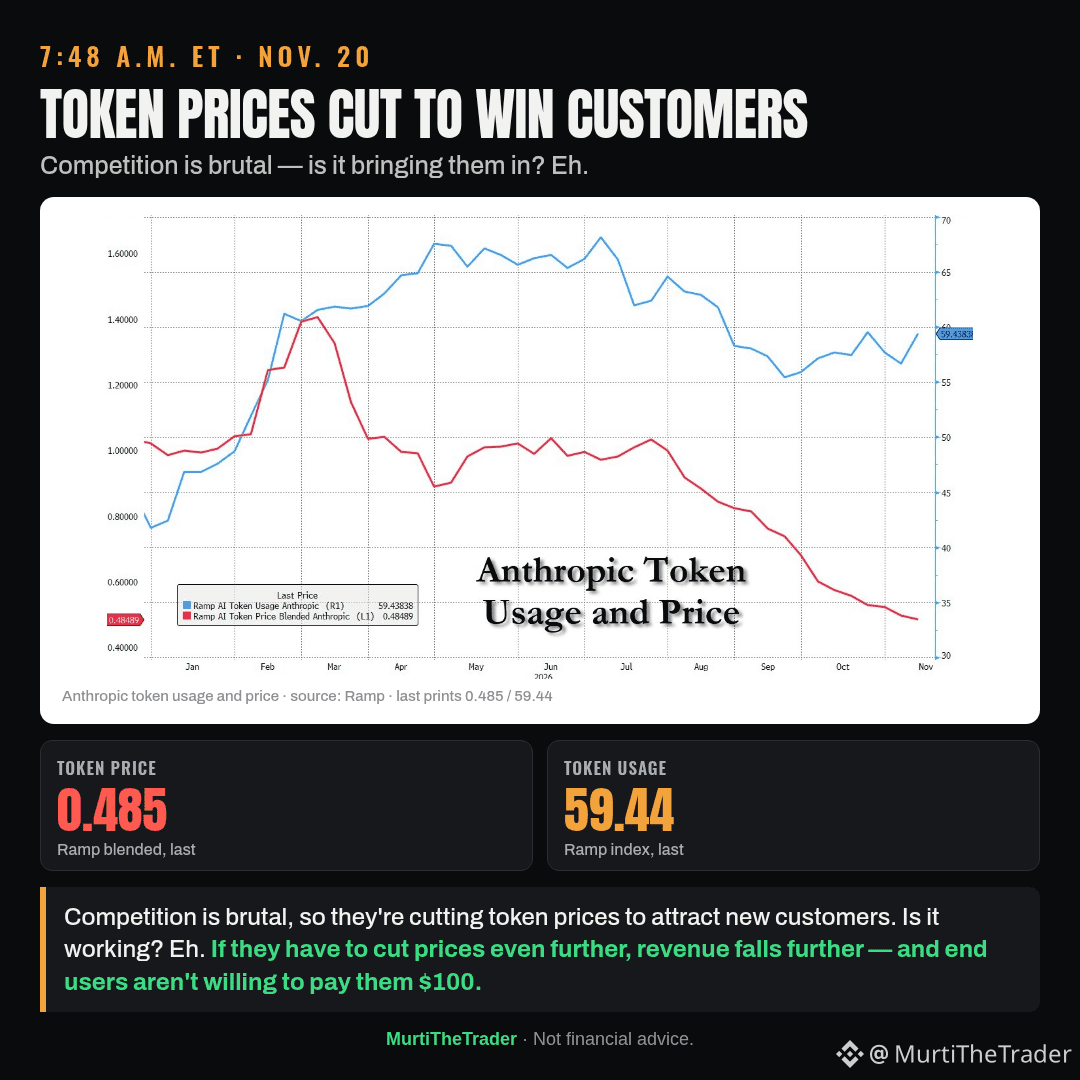
This is important — I covered exactly this in today's video. Competition is brutal, people don't have the money, so they're pulling token prices down to attract new customers. Is it working? Eh.
If they have to cut prices even further, revenue falls further. That's the biggest problem all these AI agents have right now. End users — us — aren't willing to pay them $100.
Chart: Ramp (Anthropic token usage and price).
#AI #Stocks
Watching: $MSFT $GOOGL $AMZN
This is important — I covered exactly this in today's video. Competition is brutal, people don't have the money, so they're pulling token prices down to attract new customers. Is it working? Eh.
If they have to cut prices even further, revenue falls further. That's the biggest problem all these AI agents have right now. End users — us — aren't willing to pay them $100.
Chart: Ramp (Anthropic token usage and price).
#AI #Stocks
Watching: $MSFT $GOOGL $AMZN
If they have to cut prices even further, revenue falls further. That's the biggest problem all these AI agents have right now. End users — us — aren't willing to pay them $100.
Chart: Ramp (Anthropic token usage and price).
#AI #Stocks
Watching: $MSFT $GOOGL $AMZN
236
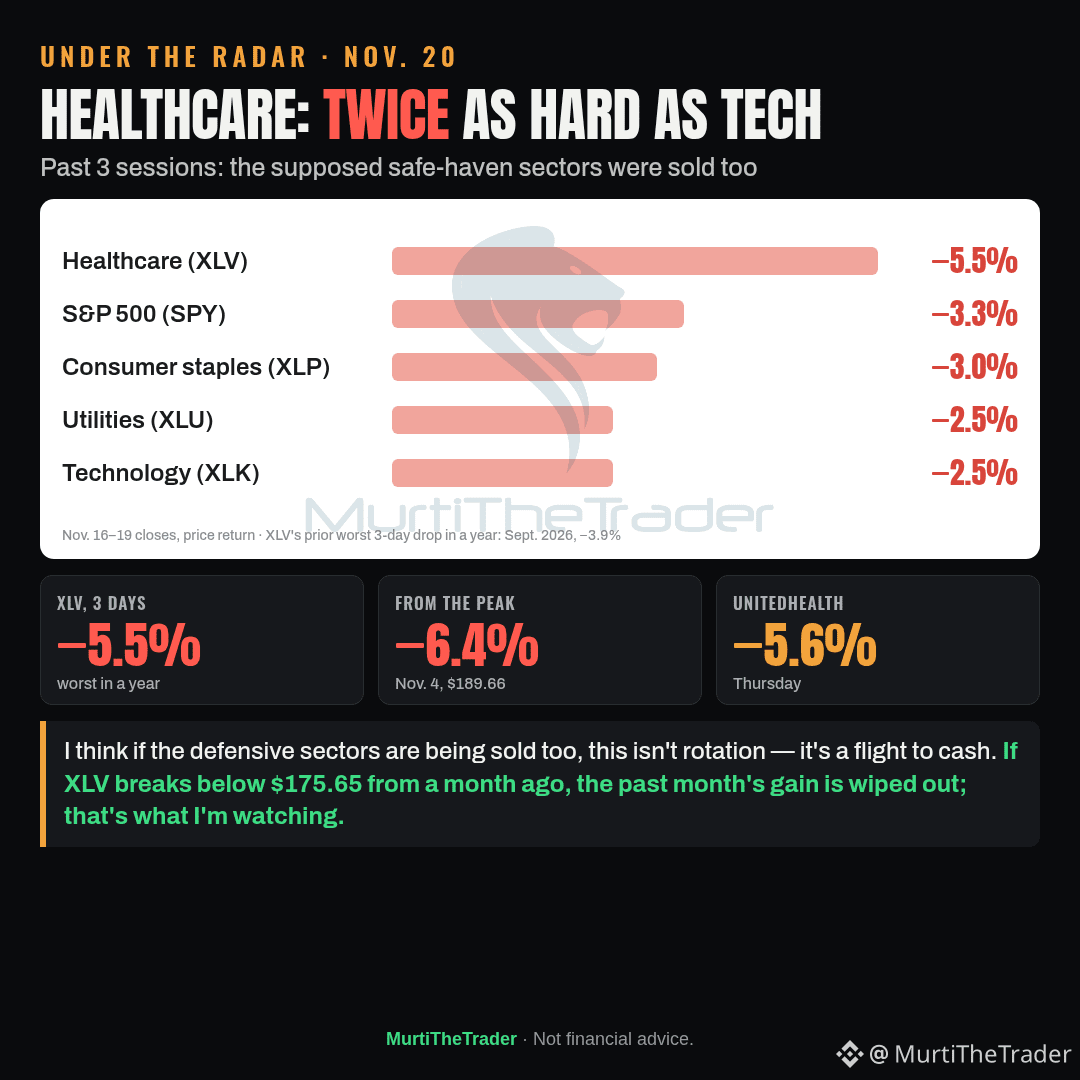
The one nobody's watching: over the past 3 days, healthcare — supposed to be a safe haven — fell twice as hard as tech.
→ The healthcare ETF XLV dropped 5.5% in 3 days, to $177.46, its worst 3-day decline in a year; the previous worst was −3.9% in September
→ Over the same 3 days, tech (XLK) fell 2.5%, the S&P 500 3.3%, consumer staples 3.0%, and utilities 2.5%
→ Yesterday UnitedHealth fell 5.6%, Merck 3.6%, and Eli Lilly 2.3%; XLV is down 6.4% from its Nov. 4 peak
I think if the defensive sectors are being sold too, this isn't rotation — it's a flight to cash. If XLV breaks below $175.65 from a month ago, the past month's gain is wiped out; that's what I'm watching.
#Stocks #Economy
Watching: $UNH $LLY $SPY
The one nobody's watching: over the past 3 days, healthcare — supposed to be a safe haven — fell twice as hard as tech.
→ The healthcare ETF XLV dropped 5.5% in 3 days, to $177.46, its worst 3-day decline in a year; the previous worst was −3.9% in September
→ Over the same 3 days, tech (XLK) fell 2.5%, the S&P 500 3.3%, consumer staples 3.0%, and utilities 2.5%
→ Yesterday UnitedHealth fell 5.6%, Merck 3.6%, and Eli Lilly 2.3%; XLV is down 6.4% from its Nov. 4 peak
I think if the defensive sectors are being sold too, this isn't rotation — it's a flight to cash. If XLV breaks below $175.65 from a month ago, the past month's gain is wiped out; that's what I'm watching.
#Stocks #Economy
Watching: $UNH $LLY $SPY
→ The healthcare ETF XLV dropped 5.5% in 3 days, to $177.46, its worst 3-day decline in a year; the previous worst was −3.9% in September
→ Over the same 3 days, tech (XLK) fell 2.5%, the S&P 500 3.3%, consumer staples 3.0%, and utilities 2.5%
→ Yesterday UnitedHealth fell 5.6%, Merck 3.6%, and Eli Lilly 2.3%; XLV is down 6.4% from its Nov. 4 peak
I think if the defensive sectors are being sold too, this isn't rotation — it's a flight to cash. If XLV breaks below $175.65 from a month ago, the past month's gain is wiped out; that's what I'm watching.
#Stocks #Economy
Watching: $UNH $LLY $SPY
165
Verified
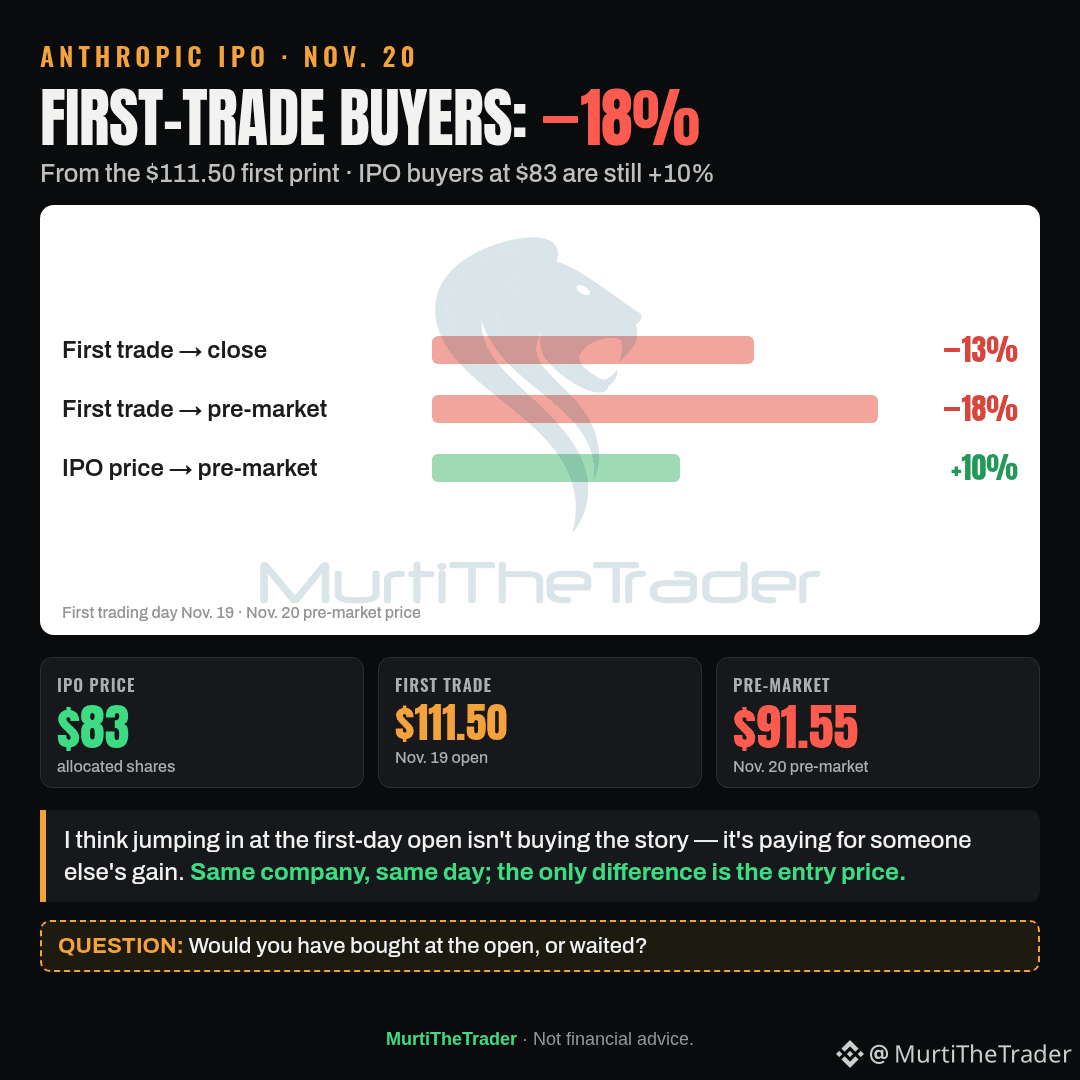
Everyone's talking about Anthropic's IPO. Here's what I'm looking at: the IPO price was $83, and the first trade was $111.50.
→ Anyone who bought at that first print was down 13% by the close ($97.17), and is down 18% in this morning's pre-market ($91.55)
→ Anyone who got the IPO price is still up 10%
I think jumping in at the first-day open isn't buying the story — it's paying for someone else's gain. Same company, same day; the only difference is the entry price.
Would you have bought at the open, or waited?
#Investing #AI #IPO
Watching: $NVDA $GOOGL $MSFT
Everyone's talking about Anthropic's IPO. Here's what I'm looking at: the IPO price was $83, and the first trade was $111.50.
→ Anyone who bought at that first print was down 13% by the close ($97.17), and is down 18% in this morning's pre-market ($91.55)
→ Anyone who got the IPO price is still up 10%
I think jumping in at the first-day open isn't buying the story — it's paying for someone else's gain. Same company, same day; the only difference is the entry price.
Would you have bought at the open, or waited?
#Investing #AI #IPO
Watching: $NVDA $GOOGL $MSFT
→ Anyone who bought at that first print was down 13% by the close ($97.17), and is down 18% in this morning's pre-market ($91.55)
→ Anyone who got the IPO price is still up 10%
I think jumping in at the first-day open isn't buying the story — it's paying for someone else's gain. Same company, same day; the only difference is the entry price.
Would you have bought at the open, or waited?
#Investing #AI #IPO
Watching: $NVDA $GOOGL $MSFT
3.1k
Verified
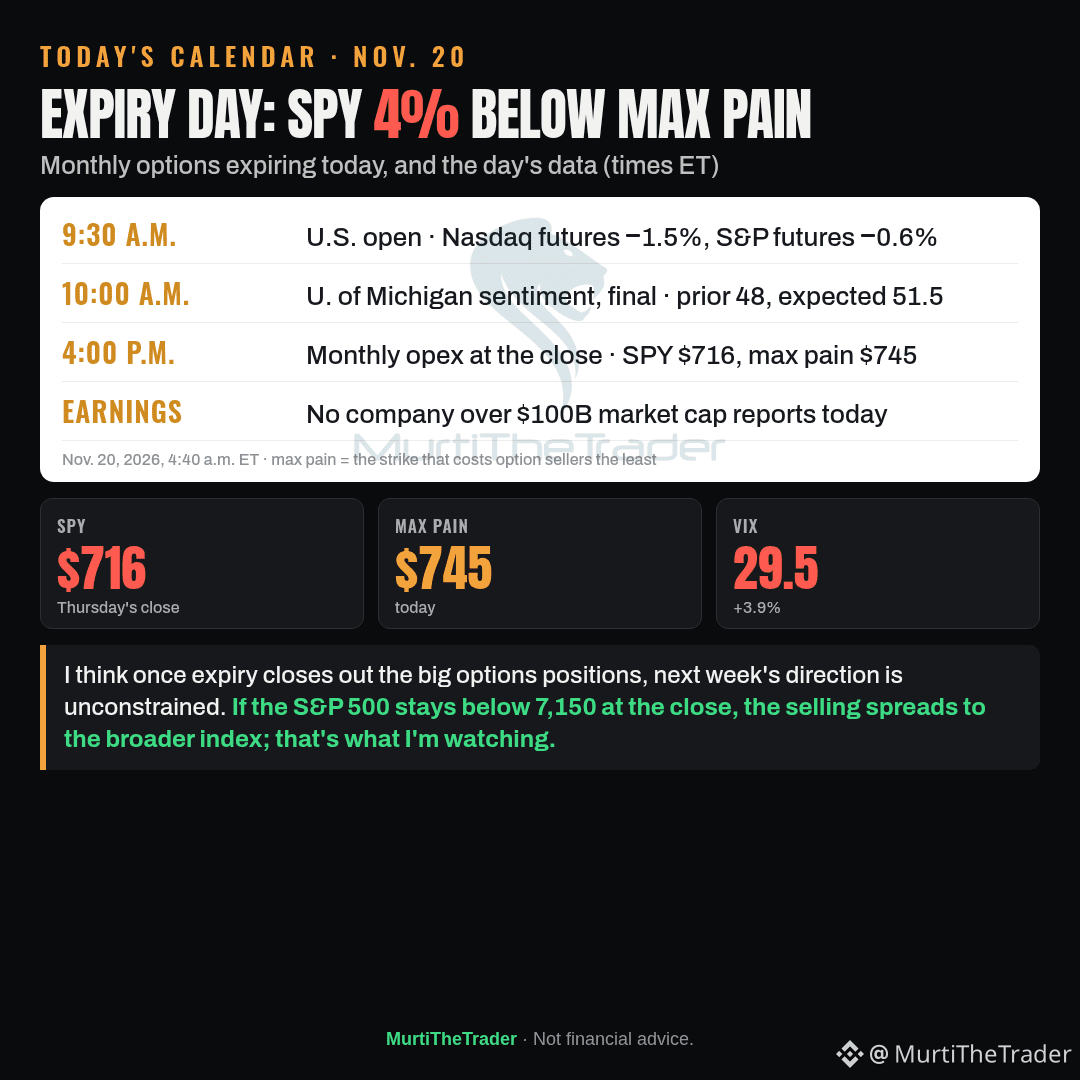
Today's calendar: the event I'm watching most isn't a data print — it's monthly options expiration at the close.
→ 9:30 a.m. ET · U.S. open; Nasdaq futures −1.5%, S&P futures −0.6%, VIX 29.5
→ 10:00 a.m. ET · University of Michigan consumer sentiment, final (prior 48, expected 51.5)
→ 4:00 p.m. ET · monthly opex at the close · SPY $716, max pain $745
→ No company over $100B market cap reports today
I think once expiry closes out the big options positions, next week's direction is unconstrained. If the S&P 500 stays below 7,150 at the close, the selling spreads to the broader index; that's what I'm watching.
#Stocks #Economy
Watching: $SPY $QQQ $IWM
Today's calendar: the event I'm watching most isn't a data print — it's monthly options expiration at the close.
→ 9:30 a.m. ET · U.S. open; Nasdaq futures −1.5%, S&P futures −0.6%, VIX 29.5
→ 10:00 a.m. ET · University of Michigan consumer sentiment, final (prior 48, expected 51.5)
→ 4:00 p.m. ET · monthly opex at the close · SPY $716, max pain $745
→ No company over $100B market cap reports today
I think once expiry closes out the big options positions, next week's direction is unconstrained. If the S&P 500 stays below 7,150 at the close, the selling spreads to the broader index; that's what I'm watching.
#Stocks #Economy
Watching: $SPY $QQQ $IWM
→ 9:30 a.m. ET · U.S. open; Nasdaq futures −1.5%, S&P futures −0.6%, VIX 29.5
→ 10:00 a.m. ET · University of Michigan consumer sentiment, final (prior 48, expected 51.5)
→ 4:00 p.m. ET · monthly opex at the close · SPY $716, max pain $745
→ No company over $100B market cap reports today
I think once expiry closes out the big options positions, next week's direction is unconstrained. If the S&P 500 stays below 7,150 at the close, the selling spreads to the broader index; that's what I'm watching.
#Stocks #Economy
Watching: $SPY $QQQ $IWM
3
1
1.5k
Partly True
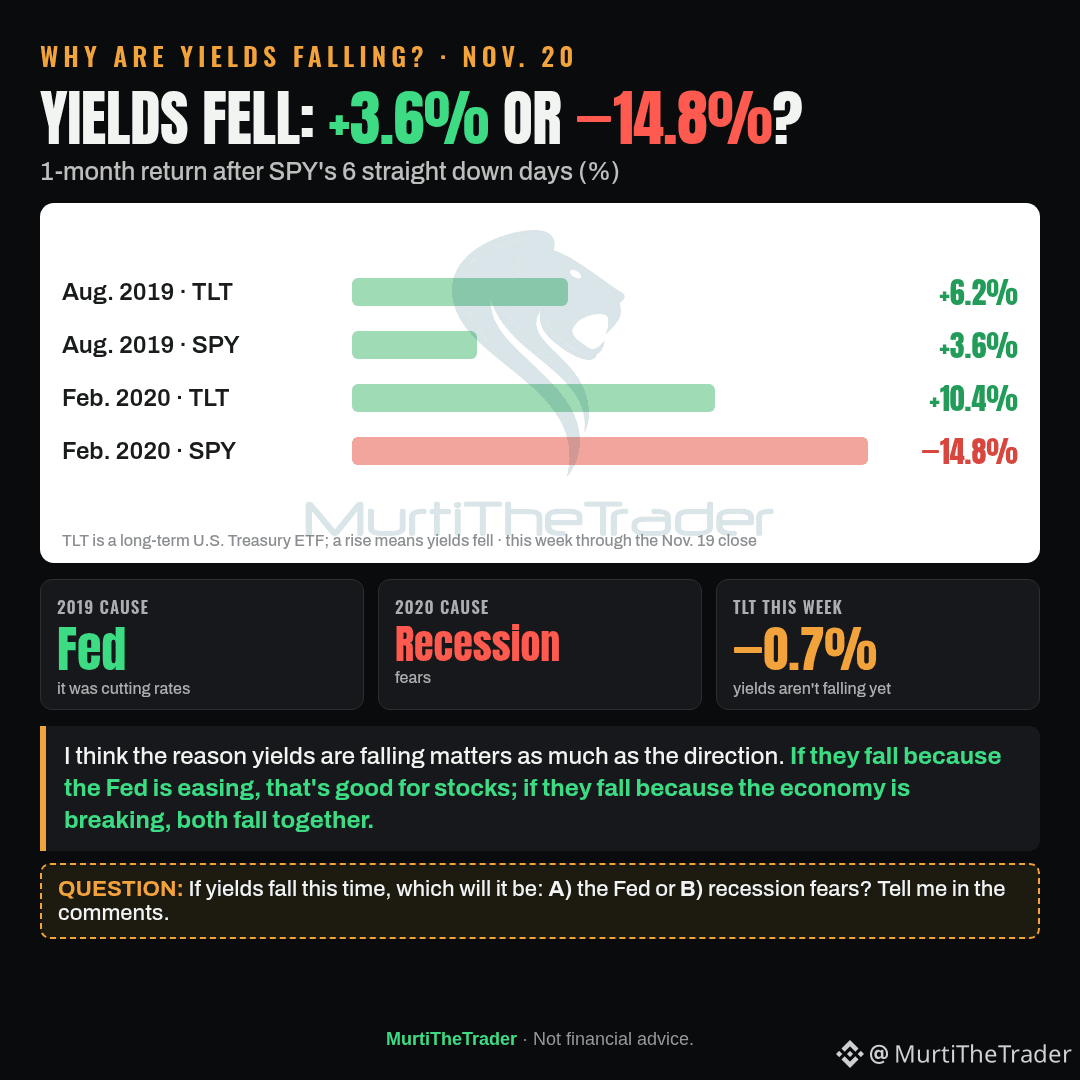
Before celebrating falling yields, one question: why are they falling?
→ August 2019: the long-term Treasury ETF TLT rose 6.2% in a month (yields fell hard), and SPY rose 3.6%. The reason was a Fed rate cut
→ February 2020: TLT rose 10.4% (yields fell even harder), and SPY fell 14.8%. The reason was recession fears
→ Over the past six sessions, SPY is down 5.8%, TLT is down 0.7%; yields aren't falling yet
I think if yields fall because the Fed is easing, that's good for stocks; if they fall because the economy is breaking, both fall together.
If yields fall this time, which will it be: the Fed or recession fears?
#Economy #Stocks
Watching: $SPY $QQQ $IWM
Before celebrating falling yields, one question: why are they falling?
→ August 2019: the long-term Treasury ETF TLT rose 6.2% in a month (yields fell hard), and SPY rose 3.6%. The reason was a Fed rate cut
→ February 2020: TLT rose 10.4% (yields fell even harder), and SPY fell 14.8%. The reason was recession fears
→ Over the past six sessions, SPY is down 5.8%, TLT is down 0.7%; yields aren't falling yet
I think if yields fall because the Fed is easing, that's good for stocks; if they fall because the economy is breaking, both fall together.
If yields fall this time, which will it be: the Fed or recession fears?
#Economy #Stocks
Watching: $SPY $QQQ $IWM
→ August 2019: the long-term Treasury ETF TLT rose 6.2% in a month (yields fell hard), and SPY rose 3.6%. The reason was a Fed rate cut
→ February 2020: TLT rose 10.4% (yields fell even harder), and SPY fell 14.8%. The reason was recession fears
→ Over the past six sessions, SPY is down 5.8%, TLT is down 0.7%; yields aren't falling yet
I think if yields fall because the Fed is easing, that's good for stocks; if they fall because the economy is breaking, both fall together.
If yields fall this time, which will it be: the Fed or recession fears?
#Economy #Stocks
Watching: $SPY $QQQ $IWM
1
1.3k
Partly True
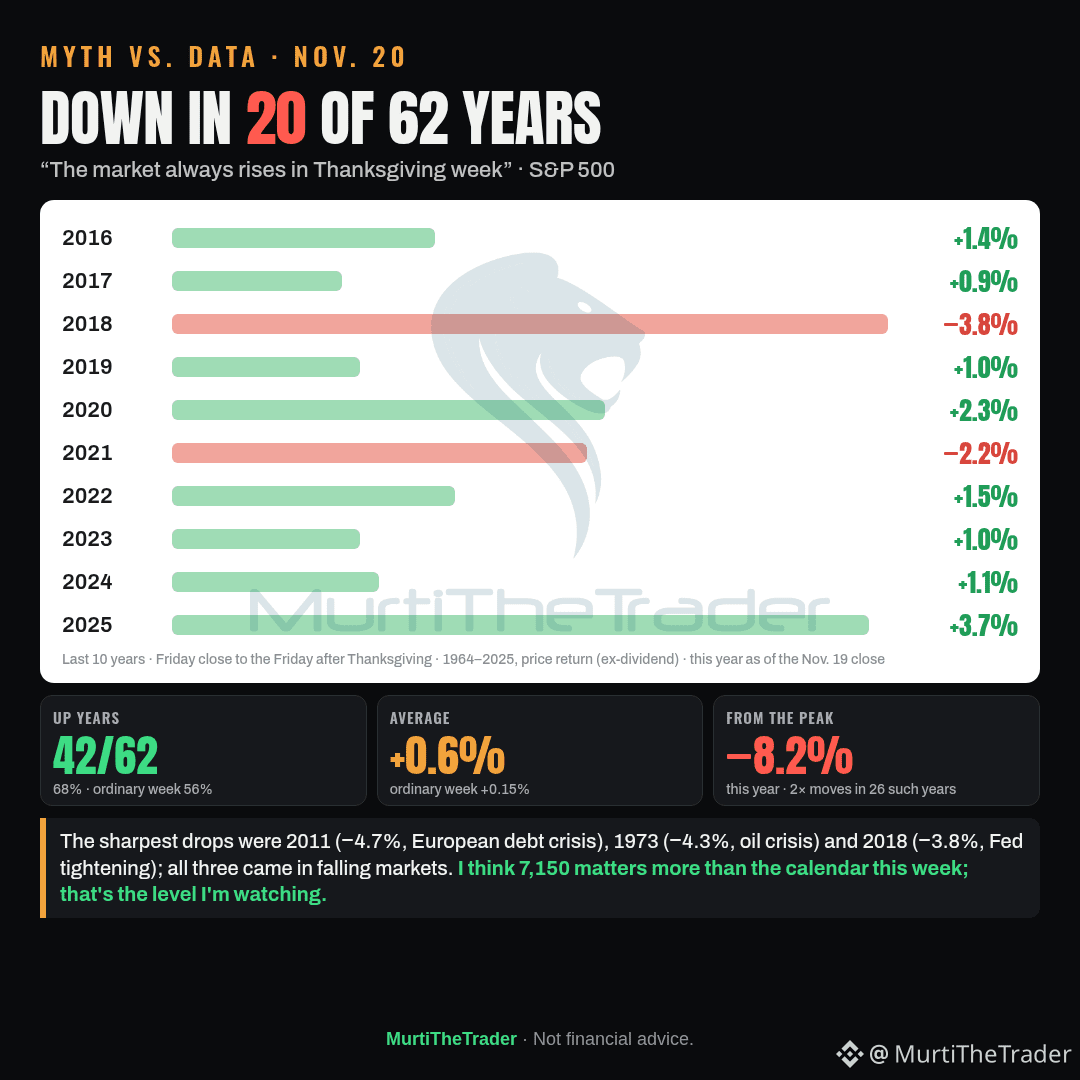
Myth vs. data: "The market always rises in Thanksgiving week." In 20 of the past 62 years, it fell.
→ 1964–2025: the S&P 500 was up in 42 of those weeks (68%), averaging +0.6%, vs. 56% and +0.15% in an ordinary week
→ The sharpest drops: 2011 (−4.7%, European debt crisis), 1973 (−4.3%, oil crisis), 2018 (−3.8%, Fed tightening); all three came in falling markets
→ This year the S&P is entering the week −8.2% from its peak; in 26 such years the week was up 16 times, but the moves were twice as sharp
I think 7,150 matters more than the calendar this week; that's the level I'm watching.
#Stocks #Economy
Watching: $SPY $QQQ $IWM
Myth vs. data: "The market always rises in Thanksgiving week." In 20 of the past 62 years, it fell.
→ 1964–2025: the S&P 500 was up in 42 of those weeks (68%), averaging +0.6%, vs. 56% and +0.15% in an ordinary week
→ The sharpest drops: 2011 (−4.7%, European debt crisis), 1973 (−4.3%, oil crisis), 2018 (−3.8%, Fed tightening); all three came in falling markets
→ This year the S&P is entering the week −8.2% from its peak; in 26 such years the week was up 16 times, but the moves were twice as sharp
I think 7,150 matters more than the calendar this week; that's the level I'm watching.
#Stocks #Economy
Watching: $SPY $QQQ $IWM
→ 1964–2025: the S&P 500 was up in 42 of those weeks (68%), averaging +0.6%, vs. 56% and +0.15% in an ordinary week
→ The sharpest drops: 2011 (−4.7%, European debt crisis), 1973 (−4.3%, oil crisis), 2018 (−3.8%, Fed tightening); all three came in falling markets
→ This year the S&P is entering the week −8.2% from its peak; in 26 such years the week was up 16 times, but the moves were twice as sharp
I think 7,150 matters more than the calendar this week; that's the level I'm watching.
#Stocks #Economy
Watching: $SPY $QQQ $IWM
1.1k
Verified
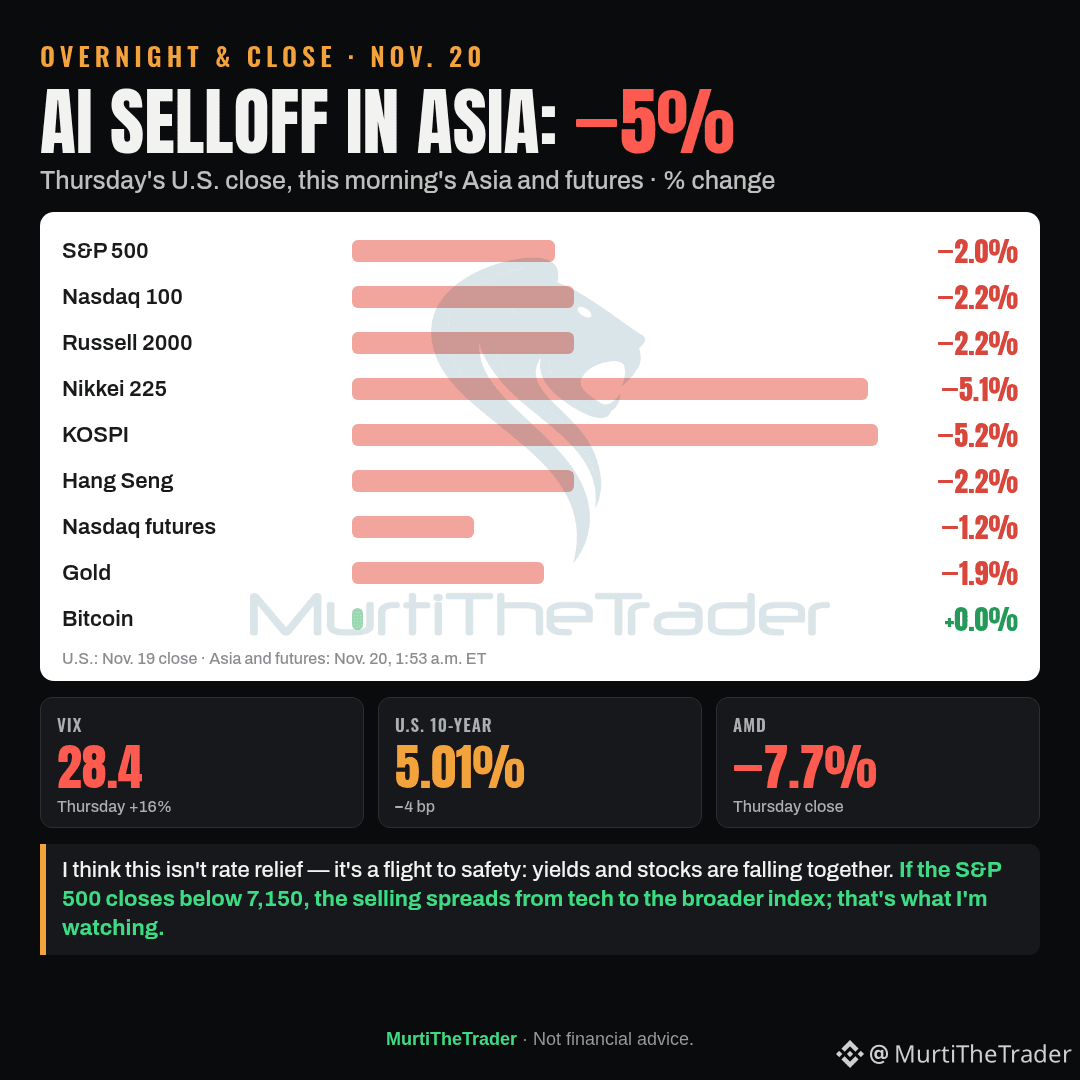
Overnight & close: Wall Street's AI selloff hit Asia twice as hard; the Nikkei fell 5.1% and the KOSPI 5.2%.
→ Thursday: S&P 500 −2.0% (7,176), Nasdaq 100 −2.2%, AMD −7.7%, Nvidia −3.3%
→ Overnight: Hang Seng −2.2%, Nasdaq futures −1.2%, S&P futures −0.6%
→ The 10-year yield dropped 4 bp to 5.01%, but stocks fell too; VIX 28.4, gold −1.9%
I think this isn't rate relief — it's a flight to safety. If the S&P 500 closes below 7,150, the selling spreads from tech to the broader index; that's what I'm watching.
#Stocks #AI
Watching: $NVDA $AMD $SPY
Overnight & close: Wall Street's AI selloff hit Asia twice as hard; the Nikkei fell 5.1% and the KOSPI 5.2%.
→ Thursday: S&P 500 −2.0% (7,176), Nasdaq 100 −2.2%, AMD −7.7%, Nvidia −3.3%
→ Overnight: Hang Seng −2.2%, Nasdaq futures −1.2%, S&P futures −0.6%
→ The 10-year yield dropped 4 bp to 5.01%, but stocks fell too; VIX 28.4, gold −1.9%
I think this isn't rate relief — it's a flight to safety. If the S&P 500 closes below 7,150, the selling spreads from tech to the broader index; that's what I'm watching.
#Stocks #AI
Watching: $NVDA $AMD $SPY
→ Thursday: S&P 500 −2.0% (7,176), Nasdaq 100 −2.2%, AMD −7.7%, Nvidia −3.3%
→ Overnight: Hang Seng −2.2%, Nasdaq futures −1.2%, S&P futures −0.6%
→ The 10-year yield dropped 4 bp to 5.01%, but stocks fell too; VIX 28.4, gold −1.9%
I think this isn't rate relief — it's a flight to safety. If the S&P 500 closes below 7,150, the selling spreads from tech to the broader index; that's what I'm watching.
#Stocks #AI
Watching: $NVDA $AMD $SPY
1
1k
Partly True
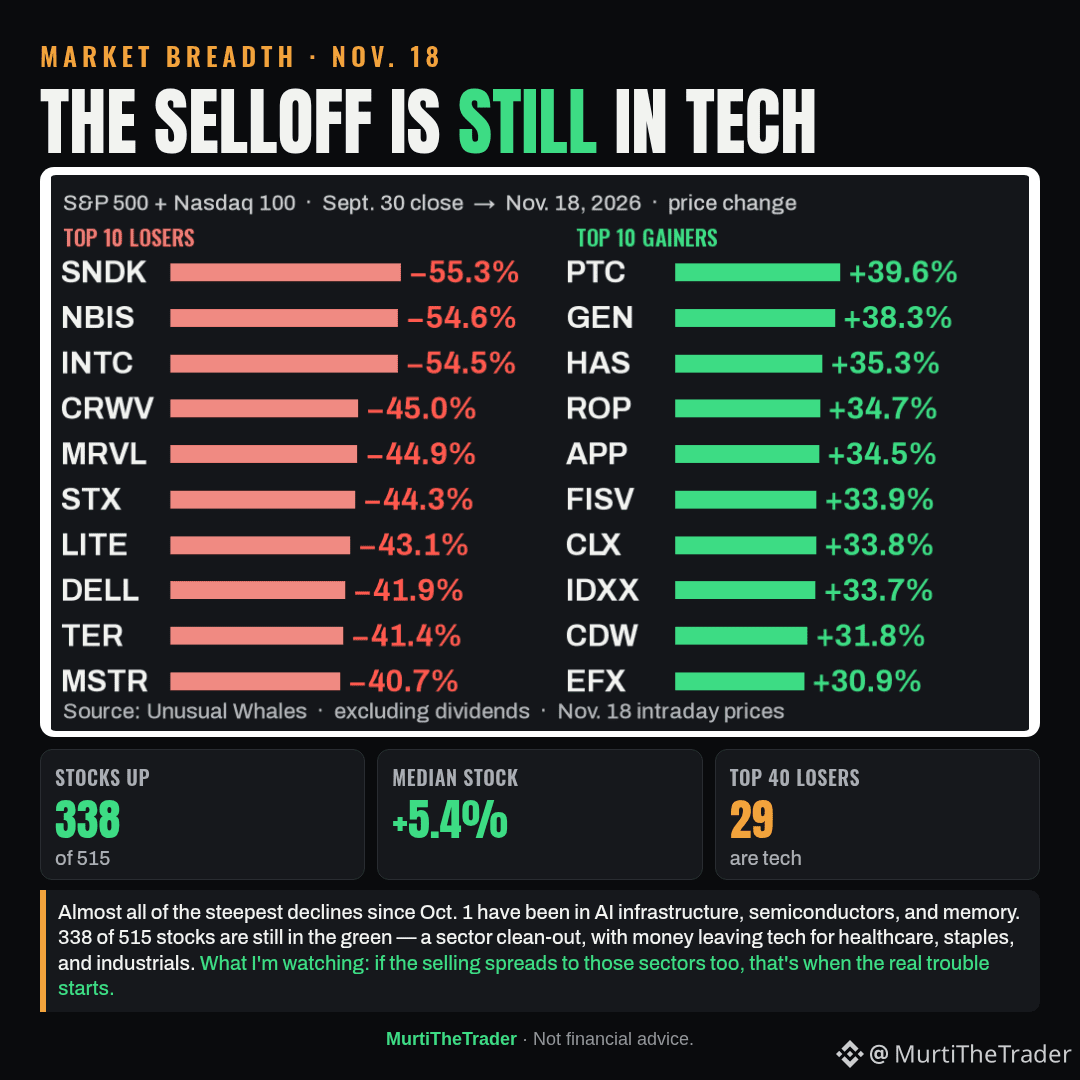
Through Nov. 18, the selloff was still concentrated in tech: almost all of the steepest declines since Oct. 1 have been in AI infrastructure, semiconductors, and memory.
338 of 515 stocks in the S&P 500 and Nasdaq 100 were still in the green — a sector clean-out, with the broader market still standing. Money is leaving tech for healthcare, staples, and industrials. Sandisk, Nebius, and Intel are each down about 55%.
What I'm watching: if the selling spreads to those sectors too, that's when the real trouble starts.
#Stocks #AI
Watching: $SNDK $NBIS $INTC
Through Nov. 18, the selloff was still concentrated in tech: almost all of the steepest declines since Oct. 1 have been in AI infrastructure, semiconductors, and memory.
338 of 515 stocks in the S&P 500 and Nasdaq 100 were still in the green — a sector clean-out, with the broader market still standing. Money is leaving tech for healthcare, staples, and industrials. Sandisk, Nebius, and Intel are each down about 55%.
What I'm watching: if the selling spreads to those sectors too, that's when the real trouble starts.
#Stocks #AI
Watching: $SNDK $NBIS $INTC
338 of 515 stocks in the S&P 500 and Nasdaq 100 were still in the green — a sector clean-out, with the broader market still standing. Money is leaving tech for healthcare, staples, and industrials. Sandisk, Nebius, and Intel are each down about 55%.
What I'm watching: if the selling spreads to those sectors too, that's when the real trouble starts.
#Stocks #AI
Watching: $SNDK $NBIS $INTC
1
1
2.7k
Verified
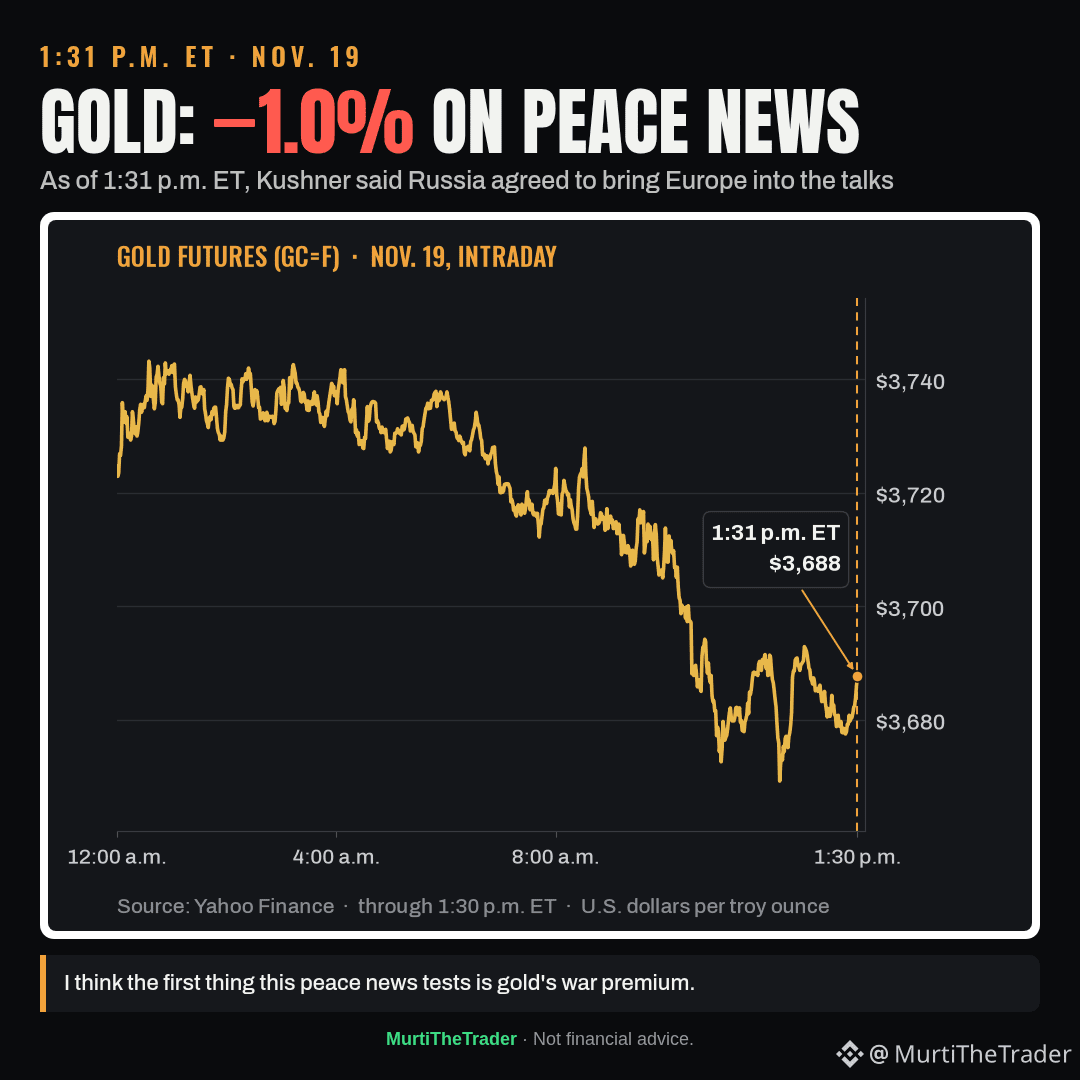
As of 1:31 p.m. ET, Jared Kushner said Russia agreed to bring Europe into the talks, and that NATO Article 5-style security guarantees for Ukraine were being discussed.
→ Gold was down 1.0% on the day, at $3,688
I think the first thing this peace news tests is gold's war premium.
#Gold #Economy
Watching: $GLD $GDX $IAU
As of 1:31 p.m. ET, Jared Kushner said Russia agreed to bring Europe into the talks, and that NATO Article 5-style security guarantees for Ukraine were being discussed.
→ Gold was down 1.0% on the day, at $3,688
I think the first thing this peace news tests is gold's war premium.
#Gold #Economy
Watching: $GLD $GDX $IAU
→ Gold was down 1.0% on the day, at $3,688
I think the first thing this peace news tests is gold's war premium.
#Gold #Economy
Watching: $GLD $GDX $IAU
579
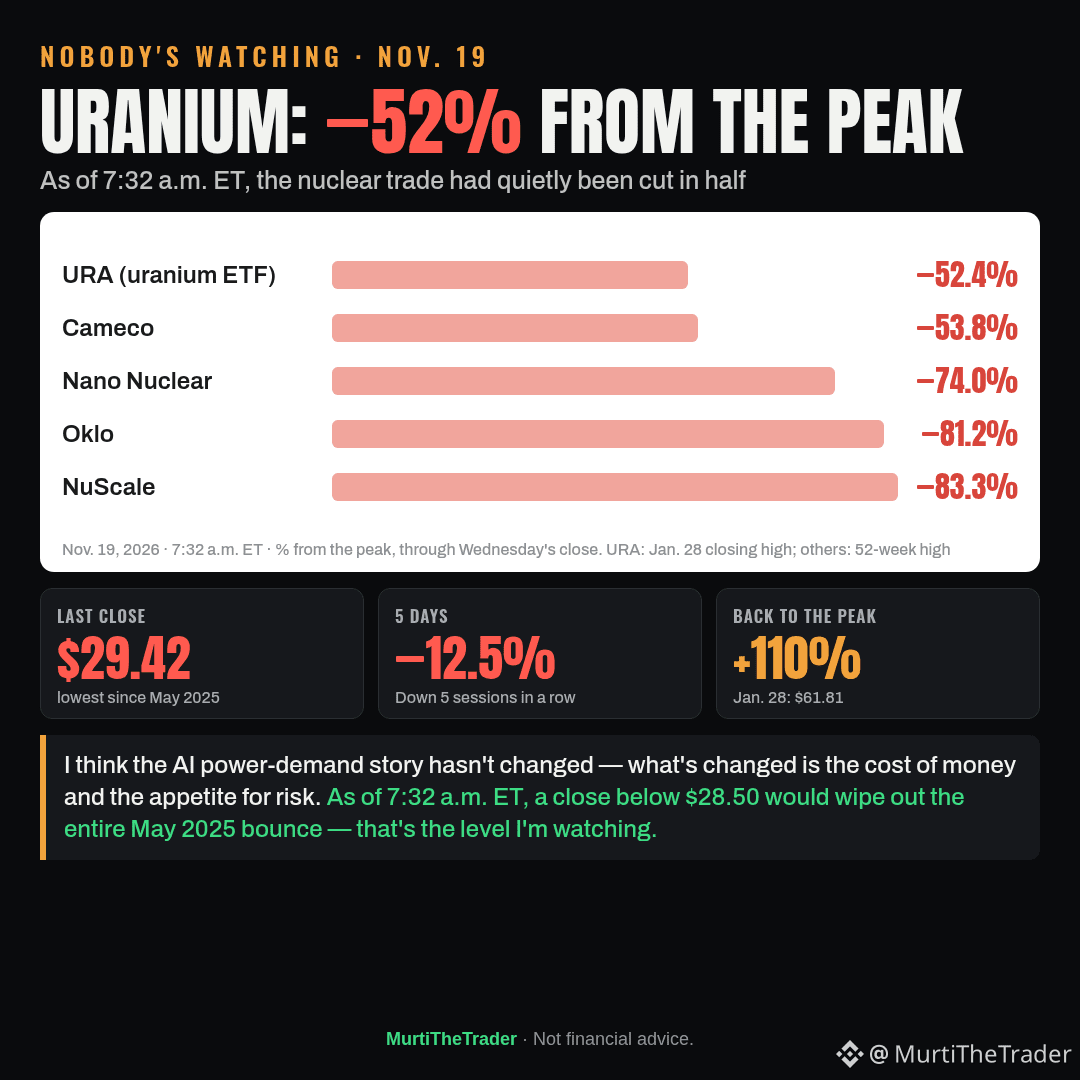
What nobody was watching, as of 7:32 a.m. ET: the uranium ETF (URA) had just posted its lowest close since May 2025, at $29.42 on Wednesday — 52% below the Jan. 28 peak.
→ Down 5 sessions in a row, down 12.5% in 5 days (the 1-year average daily move is 2.6%)
→ The nuclear trade's biggest names: Cameco was down 16% in a week and at a year-to-date low, Oklo −81% from its peak, NuScale −83%
→ It would take a 110% rally to get back to the peak
I think the AI power-demand story hasn't changed — what's changed is the cost of money and the appetite for risk. As of 7:32 a.m. ET, a close below $28.50 would wipe out the entire May 2025 bounce — that's the level I'm watching.
#Stocks #AI
Watching: $OKLO $SMR $URNM
What nobody was watching, as of 7:32 a.m. ET: the uranium ETF (URA) had just posted its lowest close since May 2025, at $29.42 on Wednesday — 52% below the Jan. 28 peak.
→ Down 5 sessions in a row, down 12.5% in 5 days (the 1-year average daily move is 2.6%)
→ The nuclear trade's biggest names: Cameco was down 16% in a week and at a year-to-date low, Oklo −81% from its peak, NuScale −83%
→ It would take a 110% rally to get back to the peak
I think the AI power-demand story hasn't changed — what's changed is the cost of money and the appetite for risk. As of 7:32 a.m. ET, a close below $28.50 would wipe out the entire May 2025 bounce — that's the level I'm watching.
#Stocks #AI
Watching: $OKLO $SMR $URNM
→ Down 5 sessions in a row, down 12.5% in 5 days (the 1-year average daily move is 2.6%)
→ The nuclear trade's biggest names: Cameco was down 16% in a week and at a year-to-date low, Oklo −81% from its peak, NuScale −83%
→ It would take a 110% rally to get back to the peak
I think the AI power-demand story hasn't changed — what's changed is the cost of money and the appetite for risk. As of 7:32 a.m. ET, a close below $28.50 would wipe out the entire May 2025 bounce — that's the level I'm watching.
#Stocks #AI
Watching: $OKLO $SMR $URNM
155
Verified
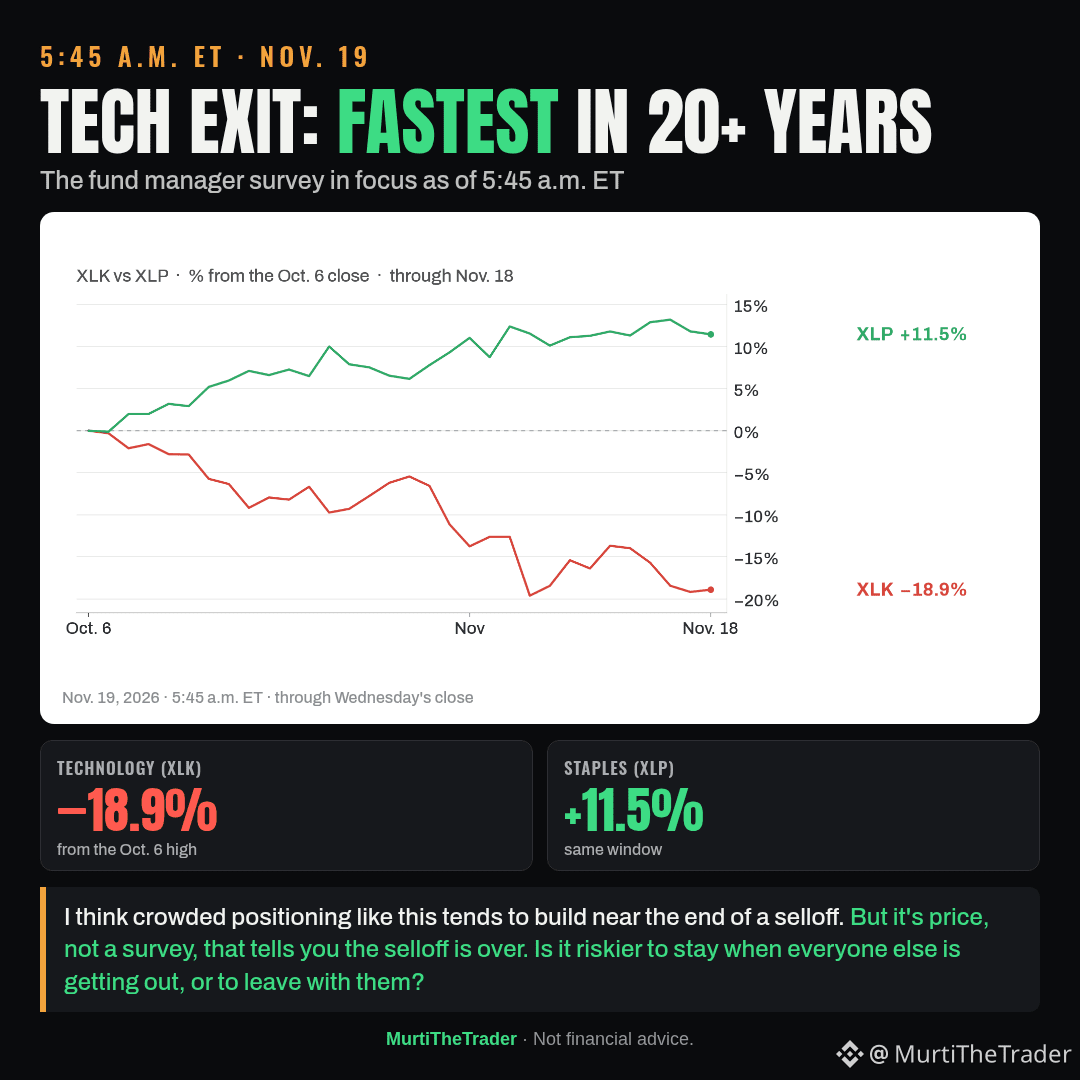
As of 5:45 a.m. ET, the survey everyone was talking about showed fund managers exiting tech at the fastest pace in more than 20 years.
The prices make that less surprising: from the Oct. 6 peak through Wednesday's close, the technology sector ETF (XLK) is down 18.9%, while the consumer staples ETF (XLP) is up 11.5%.
I think crowded positioning like this tends to build near the end of a selloff — but it's price, not a survey, that tells you the selloff is over. Is it riskier to stay when everyone else is getting out, or to leave with them?
#Stocks #Economy
Watching: $QQQ $SPY $SMH
As of 5:45 a.m. ET, the survey everyone was talking about showed fund managers exiting tech at the fastest pace in more than 20 years.
The prices make that less surprising: from the Oct. 6 peak through Wednesday's close, the technology sector ETF (XLK) is down 18.9%, while the consumer staples ETF (XLP) is up 11.5%.
I think crowded positioning like this tends to build near the end of a selloff — but it's price, not a survey, that tells you the selloff is over. Is it riskier to stay when everyone else is getting out, or to leave with them?
#Stocks #Economy
Watching: $QQQ $SPY $SMH
The prices make that less surprising: from the Oct. 6 peak through Wednesday's close, the technology sector ETF (XLK) is down 18.9%, while the consumer staples ETF (XLP) is up 11.5%.
I think crowded positioning like this tends to build near the end of a selloff — but it's price, not a survey, that tells you the selloff is over. Is it riskier to stay when everyone else is getting out, or to leave with them?
#Stocks #Economy
Watching: $QQQ $SPY $SMH
1.5k
Log in to explore more content
Join global crypto users on Binance Square
⚡️ Get latest and useful information about crypto.
💬 Trusted by the world’s largest crypto exchange.
👍 Discover real insights from verified creators.
Email / Phone number
Trending Topics
CanBTCReboundAfterFallingBelow60K?
355,715 views
1,482 Discussing
Bitcoin News | Bitcoin Falls Below $60,000 for the First Time Since July as IBIT Posts Record $541 Million Outflow
Binance News
·52 Likes
·98.3k views
GlobalStocksFaceLongestLosingStreakSince2023
117,251 views
1,055 Discussing
BlackRockIBITPostsRecord$541MSingleDayOutflow
551 views
14 Discussing