
#gold
gold
25.1M views
65,622 Discussing
Hot
Latest

·
--
Article
🥇 Gold (XAUUSD) Market Analysis: Bulls Push Higher, But Resistance Is Near!$XAU $BTC
{spot}(XAUTUSDT)
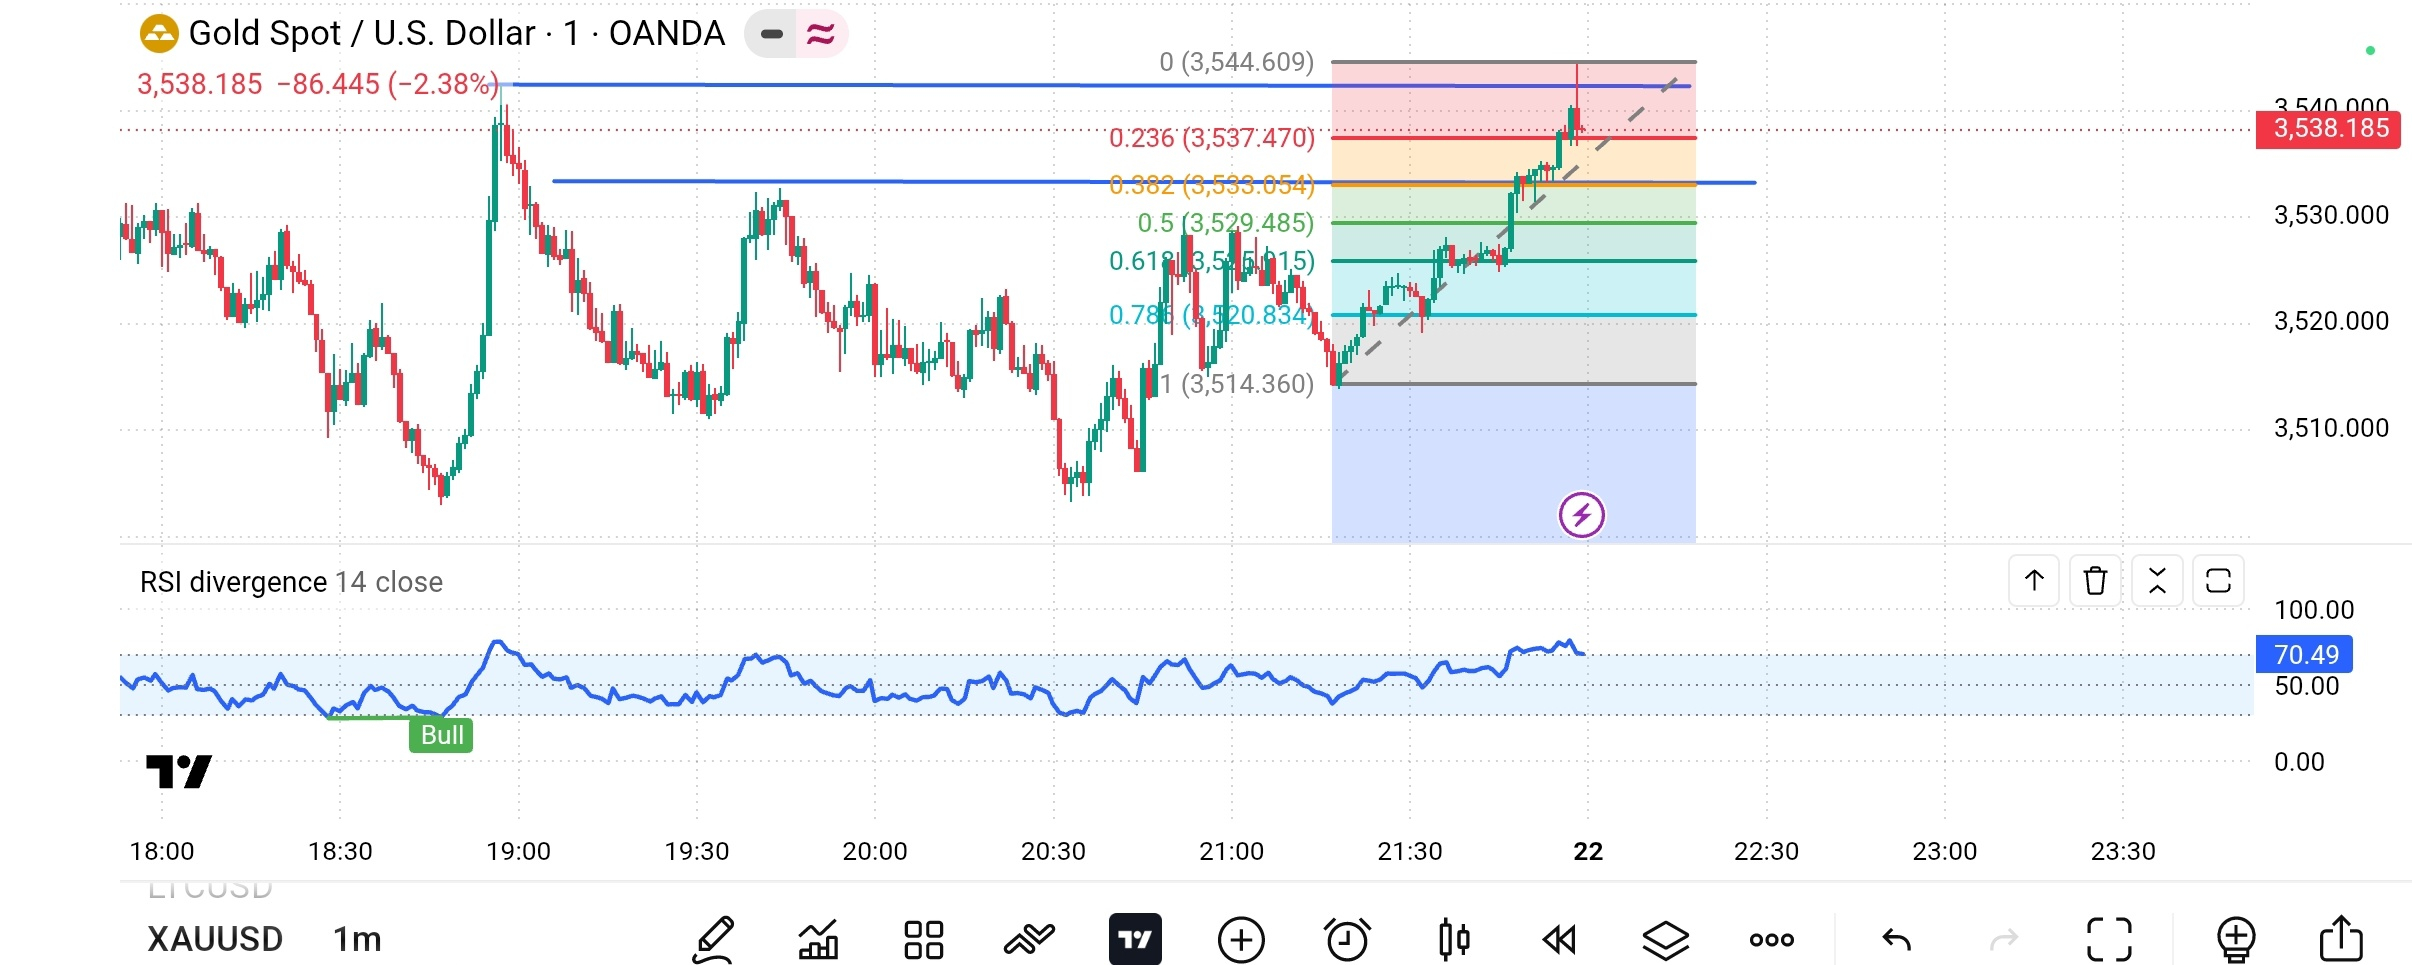
Gold has shown strong bullish momentum on the 1-minute chart, with buyers pushing the price toward the $3,540 resistance zone. However, the latest price action suggests that traders should remain cautious as the market approaches an important technical level.
📊 Technical Analysis
The chart shows a short-term upward move from around $3,514 toward the $3,540–$3,545 resistance area. Fibonacci retracement levels provide useful reference points for monitoring potential support and resistance.
🔹 Key Resistance: $3,540–$3,545
🔹 Immediate Support: $3,533
🔹 Additional Support: $3,529 and $3,525
🔹 Major Short-Term Support: $3,514
📈 RSI Indicator
The RSI is near 70, indicating strong bullish momentum but also suggesting that the market may be approaching overbought conditions. A pullback or consolidation is possible, although an elevated RSI alone does not confirm a reversal.
🚀 What Could Happen Next?
Bullish Scenario: If gold breaks above the $3,545 resistance area and holds above it, buyers may attempt to push the price higher.
Bearish Scenario: If price fails to break resistance, sellers may trigger a pullback toward $3,533 or $3,529.
Sideways Scenario: Gold may consolidate near the resistance zone before choosing its next direction.
💡 My Trading Perspective
The current chart shows bullish short-term momentum, but chasing a strong upward candle can be risky. Watching the resistance breakout, candle closes, and retests may provide a clearer picture of the next move.
⚠️ Risk Management: This analysis is based on a 1-minute chart and is intended for educational purposes only. Short-term price movements can be unpredictable. Always manage risk carefully and never rely on a single indicator.
What do you think? Will Gold break above $3,545, or will sellers push the price lower? Share your analysis in the comments!
#Gold #XAUUSD #GoldAnalysis #TechnicalAnalysis #TradingView #Binance #CryptoTrading #PriceAction
🥇 Gold (XAUUSD) Market Analysis: Bulls Push Higher, But Resistance Is Near!
$XAU $BTC
Gold has shown strong bullish momentum on the 1-minute chart, with buyers pushing the price toward the $3,540 resistance zone. However, the latest price action suggests that traders should remain cautious as the market approaches an important technical level.
📊 Technical Analysis
The chart shows a short-term upward move from around $3,514 toward the $3,540–$3,545 resistance area. Fibonacci retracement levels provide useful reference points for monitoring potential support and resistance.
🔹 Key Resistance: $3,540–$3,545
🔹 Immediate Support: $3,533
🔹 Additional Support: $3,529 and $3,525
🔹 Major Short-Term Support: $3,514
📈 RSI Indicator
The RSI is near 70, indicating strong bullish momentum but also suggesting that the market may be approaching overbought conditions. A pullback or consolidation is possible, although an elevated RSI alone does not confirm a reversal.
🚀 What Could Happen Next?
Bullish Scenario: If gold breaks above the $3,545 resistance area and holds above it, buyers may attempt to push the price higher.
Bearish Scenario: If price fails to break resistance, sellers may trigger a pullback toward $3,533 or $3,529.
Sideways Scenario: Gold may consolidate near the resistance zone before choosing its next direction.
💡 My Trading Perspective
The current chart shows bullish short-term momentum, but chasing a strong upward candle can be risky. Watching the resistance breakout, candle closes, and retests may provide a clearer picture of the next move.
⚠️ Risk Management: This analysis is based on a 1-minute chart and is intended for educational purposes only. Short-term price movements can be unpredictable. Always manage risk carefully and never rely on a single indicator.
What do you think? Will Gold break above $3,545, or will sellers push the price lower? Share your analysis in the comments!
#Gold #XAUUSD #GoldAnalysis #TechnicalAnalysis #TradingView #Binance #CryptoTrading #PriceAction
Gold has shown strong bullish momentum on the 1-minute chart, with buyers pushing the price toward the $3,540 resistance zone. However, the latest price action suggests that traders should remain cautious as the market approaches an important technical level.
📊 Technical Analysis
The chart shows a short-term upward move from around $3,514 toward the $3,540–$3,545 resistance area. Fibonacci retracement levels provide useful reference points for monitoring potential support and resistance.
🔹 Key Resistance: $3,540–$3,545
🔹 Immediate Support: $3,533
🔹 Additional Support: $3,529 and $3,525
🔹 Major Short-Term Support: $3,514
📈 RSI Indicator
The RSI is near 70, indicating strong bullish momentum but also suggesting that the market may be approaching overbought conditions. A pullback or consolidation is possible, although an elevated RSI alone does not confirm a reversal.
🚀 What Could Happen Next?
Bullish Scenario: If gold breaks above the $3,545 resistance area and holds above it, buyers may attempt to push the price higher.
Bearish Scenario: If price fails to break resistance, sellers may trigger a pullback toward $3,533 or $3,529.
Sideways Scenario: Gold may consolidate near the resistance zone before choosing its next direction.
💡 My Trading Perspective
The current chart shows bullish short-term momentum, but chasing a strong upward candle can be risky. Watching the resistance breakout, candle closes, and retests may provide a clearer picture of the next move.
⚠️ Risk Management: This analysis is based on a 1-minute chart and is intended for educational purposes only. Short-term price movements can be unpredictable. Always manage risk carefully and never rely on a single indicator.
What do you think? Will Gold break above $3,545, or will sellers push the price lower? Share your analysis in the comments!
#Gold #XAUUSD #GoldAnalysis #TechnicalAnalysis #TradingView #Binance #CryptoTrading #PriceAction
479

·
--
Bullish
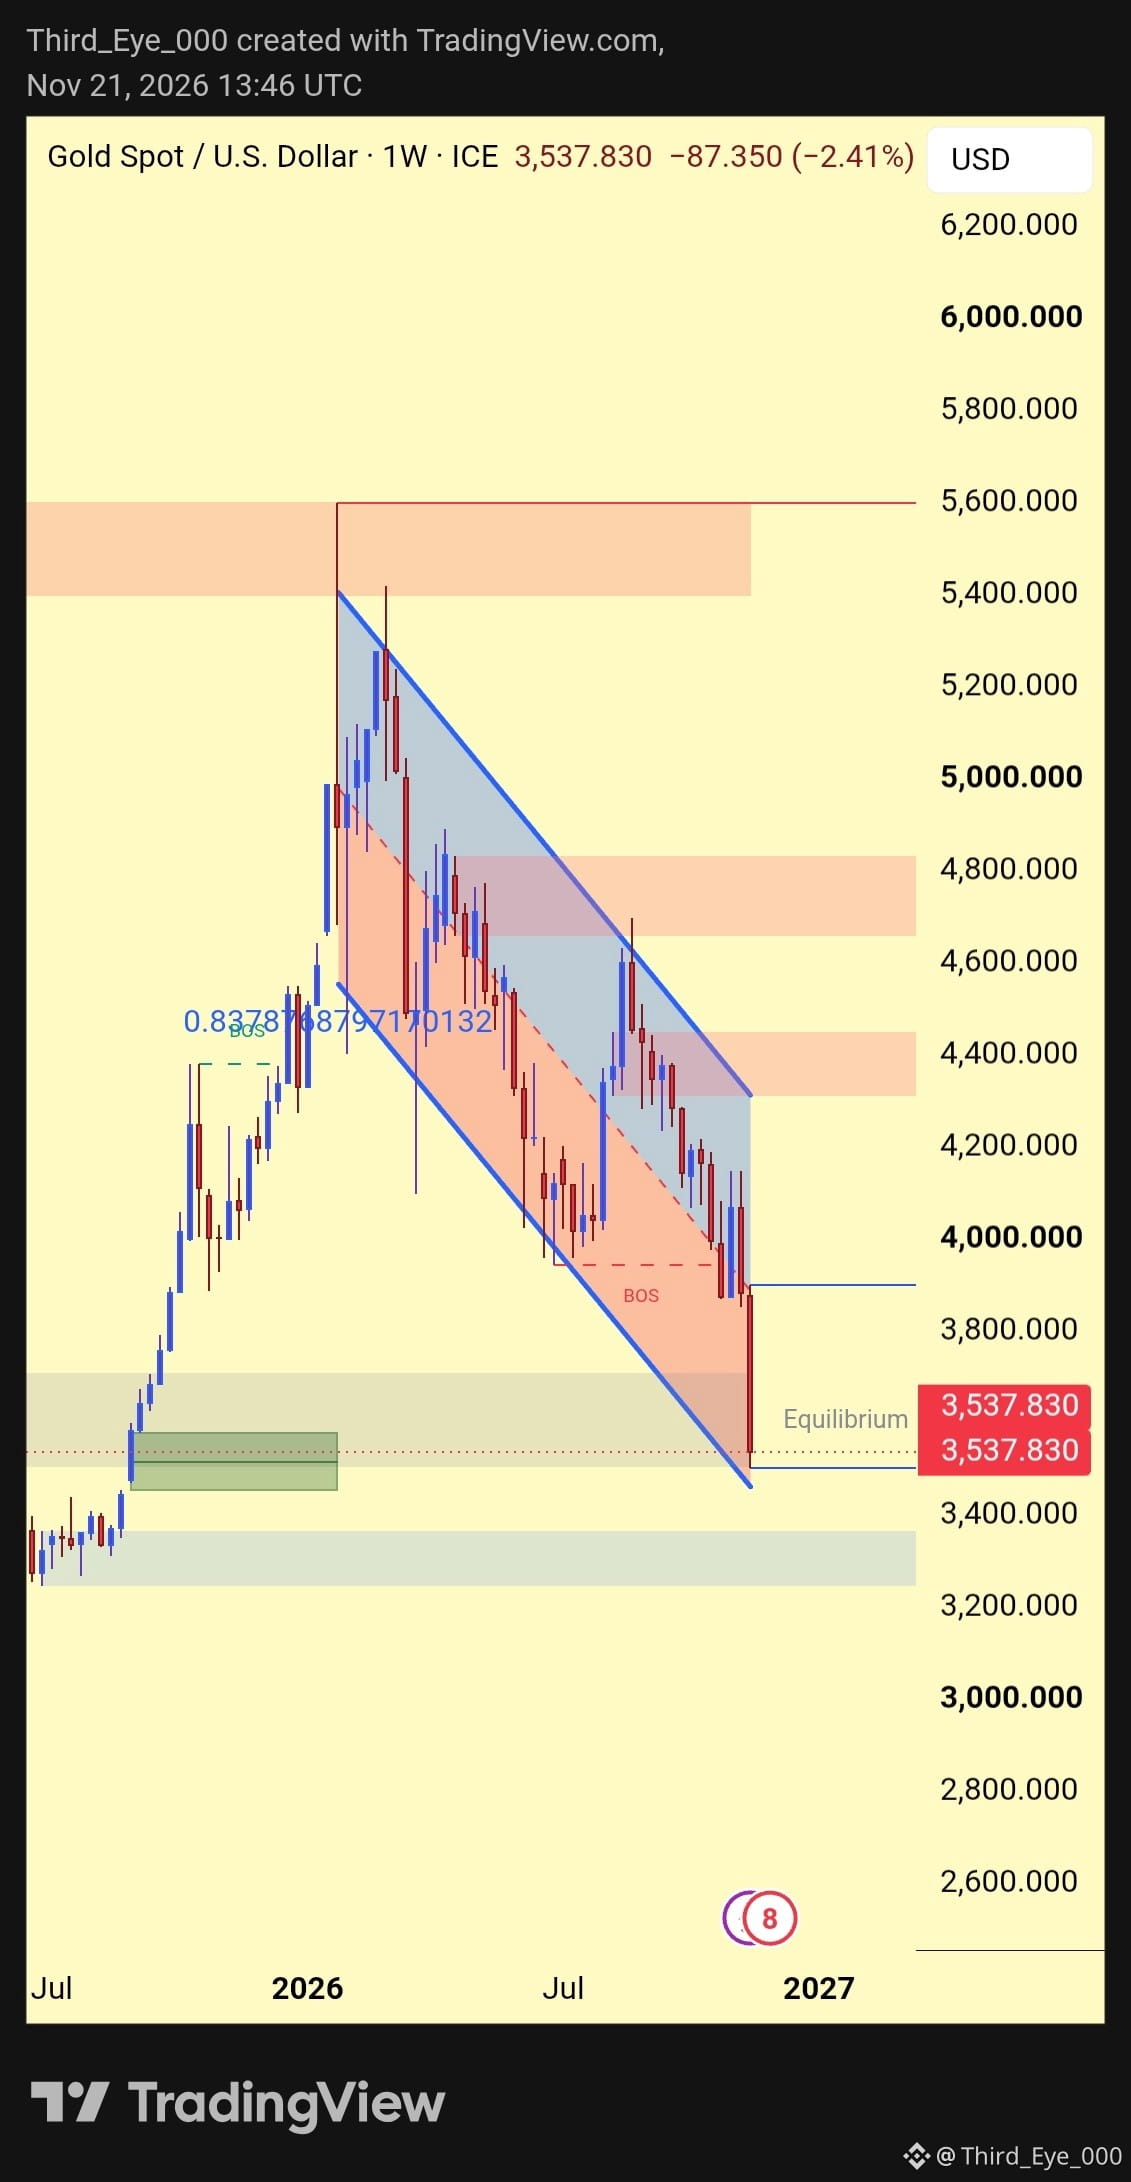
#GOLD is getting crushed, but the bigger picture is getting interesting. 👀
Price is approaching a major demand zone while the long-term downtrend channel is nearing its lower boundary.
The fear is loud. The opportunity might be louder.
If this zone holds, gold could be preparing for a serious reversal. If it breaks, we get a deeper discount.
Either way, I'm watching closely. 👁️🟡
$XAUT || $PAXG || $XAU
{spot}(PAXGUSDT)
{spot}(XAUTUSDT)
{future}(XAUUSDT)
#GOLD is getting crushed, but the bigger picture is getting interesting. 👀
Price is approaching a major demand zone while the long-term downtrend channel is nearing its lower boundary.
The fear is loud. The opportunity might be louder.
If this zone holds, gold could be preparing for a serious reversal. If it breaks, we get a deeper discount.
Either way, I'm watching closely. 👁️🟡
$XAUT || $PAXG || $XAU
Price is approaching a major demand zone while the long-term downtrend channel is nearing its lower boundary.
The fear is loud. The opportunity might be louder.
If this zone holds, gold could be preparing for a serious reversal. If it breaks, we get a deeper discount.
Either way, I'm watching closely. 👁️🟡
$XAUT || $PAXG || $XAU
803

·
--

Article
🚨 2008 FINANCIAL CRISIS: IS HISTORY ABOUT TO REPEAT ITSELF?GOLD INVESTORS, PAY ATTENTION! 🥇
In 2008, gold started falling before the stock market experienced its worst crash. After dropping around 30%, gold bottomed in October, while stocks continued falling until March 2009, with the S&P 500 losing nearly 60%.
From its 2008 bottom to its 2011 peak, gold surged approximately 166%, nearly doubling its previous 2008 high, while the S&P 500 remained well below its 2007 peak.
I believe the next financial crisis could be much worse, and gold's eventual upside could be even greater.
Just like in 2008, gold is falling first. But this time, stocks could face an even deeper decline. Even after gold reverses and starts climbing again, stocks may continue falling.
Gold could reach new all-time highs while stocks remain far below their previous peaks.
Gold investors could see one of the biggest opportunities since 2008.
Most people see a market crash. I see an opportunity that might come only once in 20 years.
So, selling your car to buy gold? 😂🥇
What do you think? Is gold preparing for another historic rally?
#Gold #XAUUSD #FinancialCrisis2026 #MarketCrash
DYOR. This is a market opinion, not financial advice.
{future}(XAUUSDT)
{alpha}(560x6a708ead771238919d85930b5a0f10454e1c331a)
🚨 2008 FINANCIAL CRISIS: IS HISTORY ABOUT TO REPEAT ITSELF?
GOLD INVESTORS, PAY ATTENTION! 🥇
In 2008, gold started falling before the stock market experienced its worst crash. After dropping around 30%, gold bottomed in October, while stocks continued falling until March 2009, with the S&P 500 losing nearly 60%.
From its 2008 bottom to its 2011 peak, gold surged approximately 166%, nearly doubling its previous 2008 high, while the S&P 500 remained well below its 2007 peak.
I believe the next financial crisis could be much worse, and gold's eventual upside could be even greater.
Just like in 2008, gold is falling first. But this time, stocks could face an even deeper decline. Even after gold reverses and starts climbing again, stocks may continue falling.
Gold could reach new all-time highs while stocks remain far below their previous peaks.
Gold investors could see one of the biggest opportunities since 2008.
Most people see a market crash. I see an opportunity that might come only once in 20 years.
So, selling your car to buy gold? 😂🥇
What do you think? Is gold preparing for another historic rally?
#Gold #XAUUSD #FinancialCrisis2026 #MarketCrash
DYOR. This is a market opinion, not financial advice.
In 2008, gold started falling before the stock market experienced its worst crash. After dropping around 30%, gold bottomed in October, while stocks continued falling until March 2009, with the S&P 500 losing nearly 60%.
From its 2008 bottom to its 2011 peak, gold surged approximately 166%, nearly doubling its previous 2008 high, while the S&P 500 remained well below its 2007 peak.
I believe the next financial crisis could be much worse, and gold's eventual upside could be even greater.
Just like in 2008, gold is falling first. But this time, stocks could face an even deeper decline. Even after gold reverses and starts climbing again, stocks may continue falling.
Gold could reach new all-time highs while stocks remain far below their previous peaks.
Gold investors could see one of the biggest opportunities since 2008.
Most people see a market crash. I see an opportunity that might come only once in 20 years.
So, selling your car to buy gold? 😂🥇
What do you think? Is gold preparing for another historic rally?
#Gold #XAUUSD #FinancialCrisis2026 #MarketCrash
DYOR. This is a market opinion, not financial advice.
536


·
--
Bearish
$XAUT USDT is attempting a recovery, but the bulls still have an important battle ahead!
Gold is trading around 3,522.99, down 1.53% over the day. The 15-minute chart shows a sharp sell-off from the 3,539 area, followed by a strong bounce after price hit 3,492.82.
Buyers have stepped in, and the recovery is gaining attention. But I don't want to call this a full reversal just yet. The market needs to reclaim resistance and prove that buyers can hold their ground.
Key levels I'm watching:
Resistance 1: $3,525–$3,532
Resistance 2: $3,540
Upside target: $3,550
Support 1: $3,511
Support 2: $3,500
Major support: $3,492.82
Bullish scenario:
If XAUTUSDT holds above $3,511 and breaks through $3,532, another move toward $3,540 and potentially $3,550 could follow.
Bearish scenario:
If buyers lose $3,511, selling pressure could return toward $3,500. A break below $3,492.82 would seriously weaken the recovery.
My view: The bounce is encouraging, but confirmation matters more than excitement. I want to see a clean resistance breakout before trusting the next upside move.
Don't chase green candles. Keep your stop loss disciplined and protect your capital.
The big question: Can Gold reclaim $3,532, or are sellers preparing another rejection?
{spot}(XAUTUSDT)
#GOLD
#CanBTCReboundAfterFallingBelow60K? #GlobalStocksFaceLongestLosingStreakSince2023 #TwentyOneCapitalAdds172.25BTC #BNBDropsBelow540USDTWith8.46%DailyDecline
$XAUT USDT is attempting a recovery, but the bulls still have an important battle ahead!
Gold is trading around 3,522.99, down 1.53% over the day. The 15-minute chart shows a sharp sell-off from the 3,539 area, followed by a strong bounce after price hit 3,492.82.
Buyers have stepped in, and the recovery is gaining attention. But I don't want to call this a full reversal just yet. The market needs to reclaim resistance and prove that buyers can hold their ground.
Key levels I'm watching:
Resistance 1: $3,525–$3,532
Resistance 2: $3,540
Upside target: $3,550
Support 1: $3,511
Support 2: $3,500
Major support: $3,492.82
Bullish scenario:
If XAUTUSDT holds above $3,511 and breaks through $3,532, another move toward $3,540 and potentially $3,550 could follow.
Bearish scenario:
If buyers lose $3,511, selling pressure could return toward $3,500. A break below $3,492.82 would seriously weaken the recovery.
My view: The bounce is encouraging, but confirmation matters more than excitement. I want to see a clean resistance breakout before trusting the next upside move.
Don't chase green candles. Keep your stop loss disciplined and protect your capital.
The big question: Can Gold reclaim $3,532, or are sellers preparing another rejection?
#GOLD
#CanBTCReboundAfterFallingBelow60K? #GlobalStocksFaceLongestLosingStreakSince2023 #TwentyOneCapitalAdds172.25BTC #BNBDropsBelow540USDTWith8.46%DailyDecline
Gold is trading around 3,522.99, down 1.53% over the day. The 15-minute chart shows a sharp sell-off from the 3,539 area, followed by a strong bounce after price hit 3,492.82.
Buyers have stepped in, and the recovery is gaining attention. But I don't want to call this a full reversal just yet. The market needs to reclaim resistance and prove that buyers can hold their ground.
Key levels I'm watching:
Resistance 1: $3,525–$3,532
Resistance 2: $3,540
Upside target: $3,550
Support 1: $3,511
Support 2: $3,500
Major support: $3,492.82
Bullish scenario:
If XAUTUSDT holds above $3,511 and breaks through $3,532, another move toward $3,540 and potentially $3,550 could follow.
Bearish scenario:
If buyers lose $3,511, selling pressure could return toward $3,500. A break below $3,492.82 would seriously weaken the recovery.
My view: The bounce is encouraging, but confirmation matters more than excitement. I want to see a clean resistance breakout before trusting the next upside move.
Don't chase green candles. Keep your stop loss disciplined and protect your capital.
The big question: Can Gold reclaim $3,532, or are sellers preparing another rejection?
#GOLD
#CanBTCReboundAfterFallingBelow60K? #GlobalStocksFaceLongestLosingStreakSince2023 #TwentyOneCapitalAdds172.25BTC #BNBDropsBelow540USDTWith8.46%DailyDecline


Xing về bờ:
Tàu cũng nhẹ rồi, giờ quay lên là vừa rồi
1
284

I’m watching #GOLD closely here!
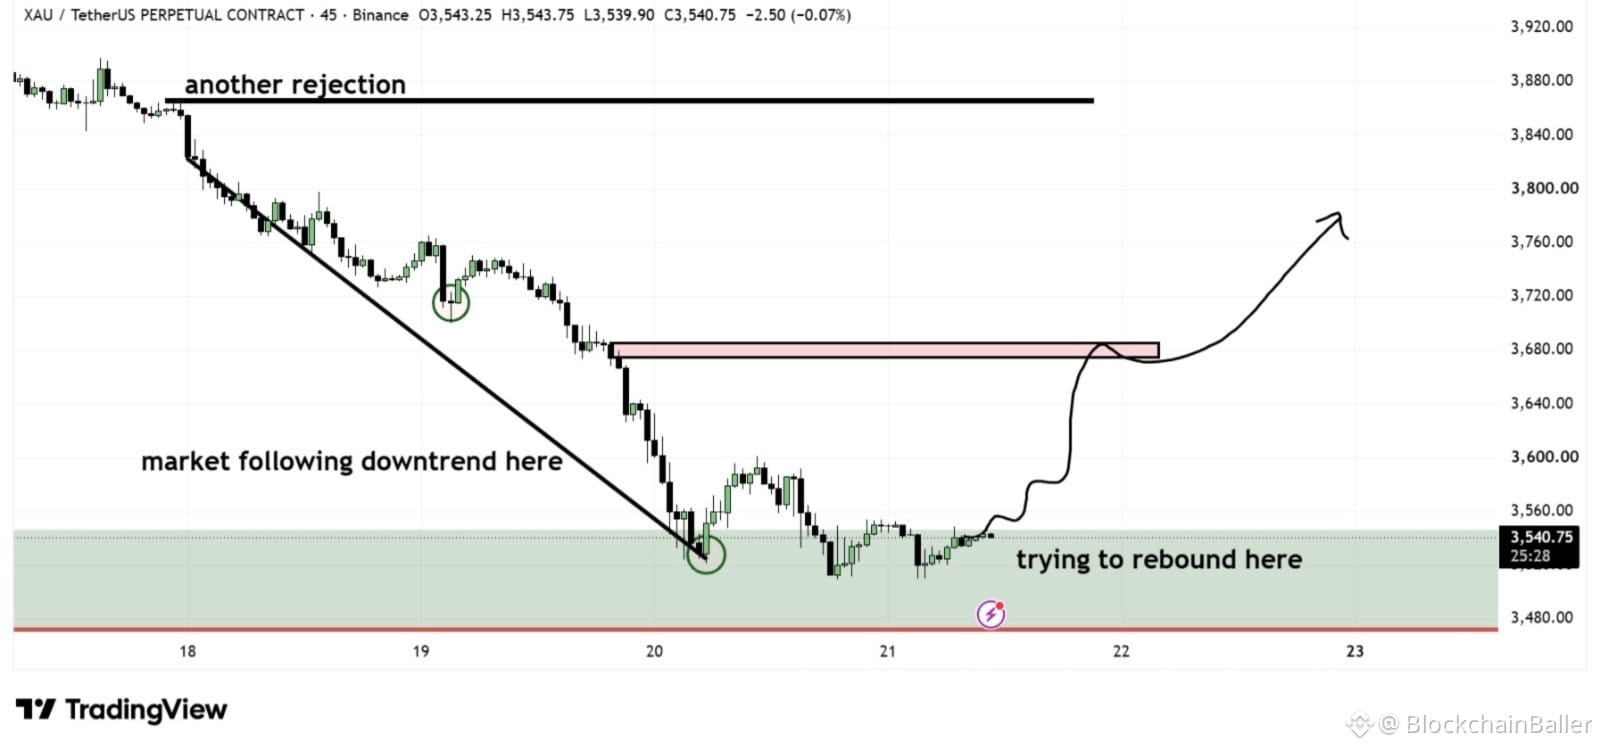
After a strong downtrend $XAU , I’m starting to see signs of a possible recovery.
Price is trying to bounce from the $3,500 area. If buyers keep pushing, I’m looking for a move toward $3,680 and then $3,760.
I want to see a clean breakout before getting too bullish.
Could this be the start of a strong recovery?
I’m watching #GOLD closely here!
After a strong downtrend $XAU , I’m starting to see signs of a possible recovery.
Price is trying to bounce from the $3,500 area. If buyers keep pushing, I’m looking for a move toward $3,680 and then $3,760.
I want to see a clean breakout before getting too bullish.
Could this be the start of a strong recovery?
After a strong downtrend $XAU , I’m starting to see signs of a possible recovery.
Price is trying to bounce from the $3,500 area. If buyers keep pushing, I’m looking for a move toward $3,680 and then $3,760.
I want to see a clean breakout before getting too bullish.
Could this be the start of a strong recovery?
4
2.6k

Verified
#GOLD at a Turning Point – Can Bulls Reclaim Control?
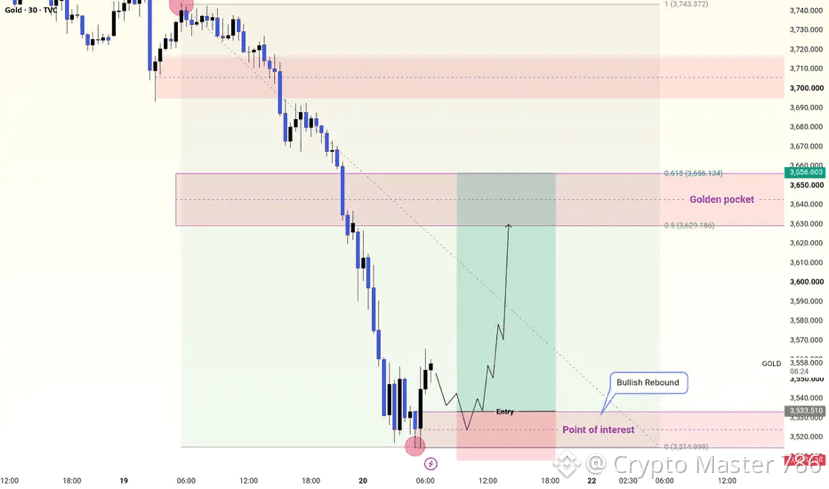
$XAU is testing a critical demand zone near $3,515–$3,535. A confirmed bullish rebound could open the door toward $3,629–$3,656.
What do you expect, traders?? Strong recovery or another drop???
#GOLD at a Turning Point – Can Bulls Reclaim Control?
$XAU is testing a critical demand zone near $3,515–$3,535. A confirmed bullish rebound could open the door toward $3,629–$3,656.
What do you expect, traders?? Strong recovery or another drop???
$XAU is testing a critical demand zone near $3,515–$3,535. A confirmed bullish rebound could open the door toward $3,629–$3,656.
What do you expect, traders?? Strong recovery or another drop???
BullishBeacon_Ug:
gold will never get back to $4000, before the $2500
4
1
7
10.9k

·
--
Picture this: you park your capital in the ultimate safe haven to sleep better at night, only to watch it suffer its sharpest collapse in almost a year.
Few things hurt more than buying a hedge that suddenly behaves like a leveraged trade just when macro volatility strikes.
Here is what happened behind the scenes. Spot gold tumbled below $3,550/oz, marking a 14-month low and setting up its worst week in eight months. The trigger was a classic liquidity squeeze: hawkish Fed minutes reignited rate hike fears, driving the US dollar to a 19-month high. When Treasury yields offer high risk-free returns, non-yielding assets lose their shine, and institutional desks dump their gold positions simply to cover margin calls elsewhere.
We saw this exact pattern back during the March 2020 liquidity shock. Whenever cash suddenly becomes king, everything gets sold off indiscriminately. The ripples hit tokenized gold like $PAXG instantly, while reminding crypto traders why $BTC often catches collateral damage during global dollar surges before capital rotates back into $USDT.
Do you think hard assets bounce back quickly here, or does the dollar keep crushing everything in its path?
#MacroEconomics #Gold #CryptoMarkets
Picture this: you park your capital in the ultimate safe haven to sleep better at night, only to watch it suffer its sharpest collapse in almost a year.
Few things hurt more than buying a hedge that suddenly behaves like a leveraged trade just when macro volatility strikes.
Here is what happened behind the scenes. Spot gold tumbled below $3,550/oz, marking a 14-month low and setting up its worst week in eight months. The trigger was a classic liquidity squeeze: hawkish Fed minutes reignited rate hike fears, driving the US dollar to a 19-month high. When Treasury yields offer high risk-free returns, non-yielding assets lose their shine, and institutional desks dump their gold positions simply to cover margin calls elsewhere.
We saw this exact pattern back during the March 2020 liquidity shock. Whenever cash suddenly becomes king, everything gets sold off indiscriminately. The ripples hit tokenized gold like $PAXG instantly, while reminding crypto traders why $BTC often catches collateral damage during global dollar surges before capital rotates back into $USDT.
Do you think hard assets bounce back quickly here, or does the dollar keep crushing everything in its path?
#MacroEconomics #Gold #CryptoMarkets
Few things hurt more than buying a hedge that suddenly behaves like a leveraged trade just when macro volatility strikes.
Here is what happened behind the scenes. Spot gold tumbled below $3,550/oz, marking a 14-month low and setting up its worst week in eight months. The trigger was a classic liquidity squeeze: hawkish Fed minutes reignited rate hike fears, driving the US dollar to a 19-month high. When Treasury yields offer high risk-free returns, non-yielding assets lose their shine, and institutional desks dump their gold positions simply to cover margin calls elsewhere.
We saw this exact pattern back during the March 2020 liquidity shock. Whenever cash suddenly becomes king, everything gets sold off indiscriminately. The ripples hit tokenized gold like $PAXG instantly, while reminding crypto traders why $BTC often catches collateral damage during global dollar surges before capital rotates back into $USDT.
Do you think hard assets bounce back quickly here, or does the dollar keep crushing everything in its path?
#MacroEconomics #Gold #CryptoMarkets

262

·
--
Bullish
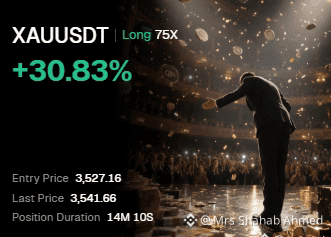
📈 GOLD $XAUT — BULLISH POSITION
I'm keeping a bullish view on $XAUT at current levels.
🎯 Entry Zone: $3,527
🔑 Key Weekly Level: $3,500 — an important area to watch for the next move.
I'll share further insights with the group if requested.
⚠️ High-risk trade. Always manage your risk. NFA.
#GOLD #XAUT #XAUTUSDT #Bullish
$XAUT
{spot}(XAUTUSDT)
📈 GOLD $XAUT — BULLISH POSITION
I'm keeping a bullish view on $XAUT at current levels.
🎯 Entry Zone: $3,527
🔑 Key Weekly Level: $3,500 — an important area to watch for the next move.
I'll share further insights with the group if requested.
⚠️ High-risk trade. Always manage your risk. NFA.
#GOLD #XAUT #XAUTUSDT #Bullish
$XAUT
I'm keeping a bullish view on $XAUT at current levels.
🎯 Entry Zone: $3,527
🔑 Key Weekly Level: $3,500 — an important area to watch for the next move.
I'll share further insights with the group if requested.
⚠️ High-risk trade. Always manage your risk. NFA.
#GOLD #XAUT #XAUTUSDT #Bullish
$XAUT
201

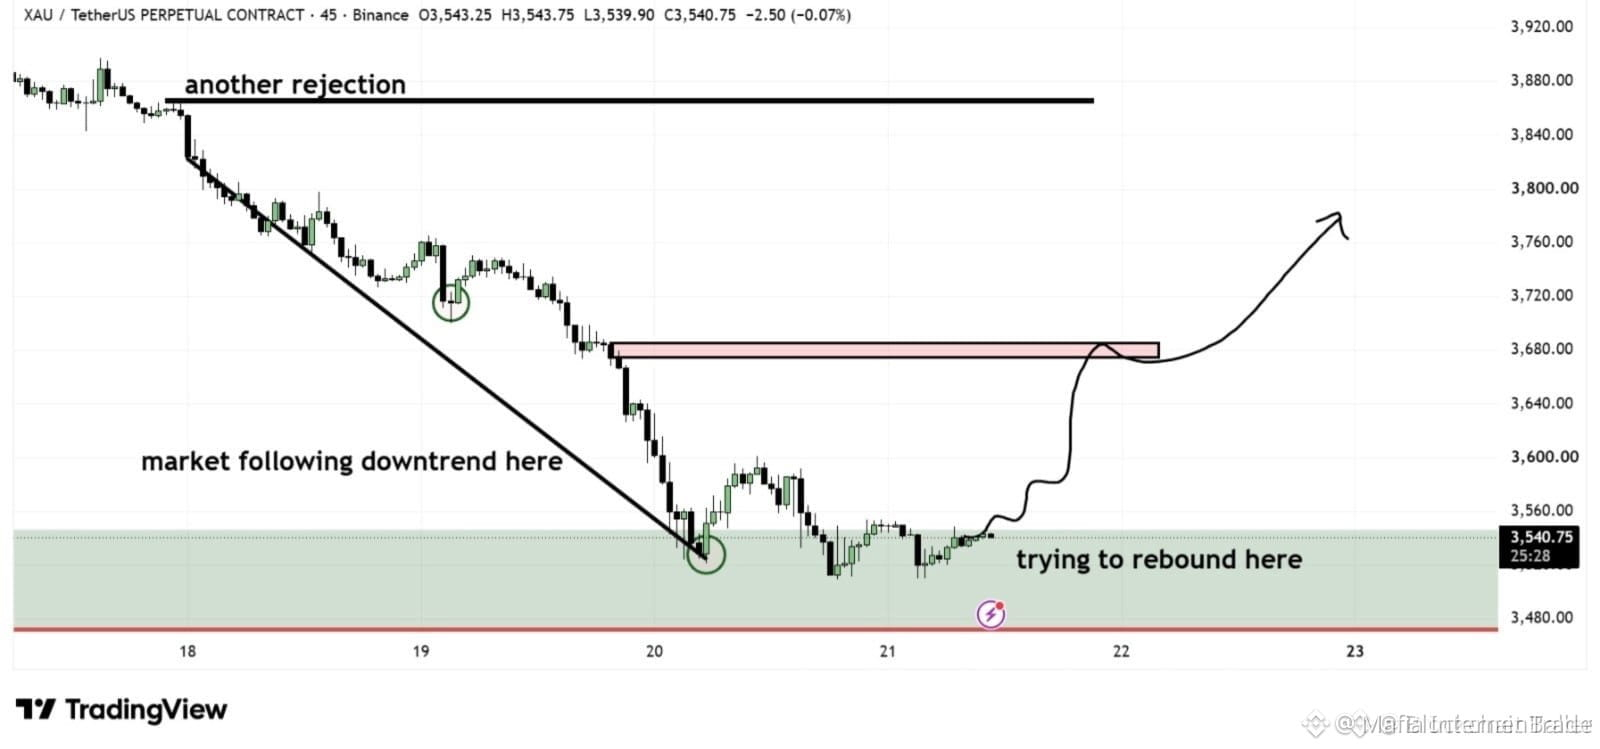
🚨 $XAU TESTING THE 3,500 FLOOR AFTER A BRUTAL DOWNTREND! 📉
Entry: 3,500 ⚡
Target: 3,680 🚀
Sellers have dominated the tape for weeks, but $XAU is finally attempting to catch a bid around the crucial 3,500 psychological floor. 📊 Momentum indicators are cooling off as buyers step in to defend this structural pivot against relentless downward pressure. ⚡
Before turning aggressively bullish, I need to see a decisive volume expansion break through the 3,680 resistance zone to confirm institutional accumulation. 💡 If that reclaim holds, the path toward 3,760 opens up cleanly for momentum swing participants. 🤔
⚠️ Not financial advice. Always manage your risk. 🛡️
🏷️ #XAU #Gold #Breakout #Trading
🔥 💎
🚨 $XAU TESTING THE 3,500 FLOOR AFTER A BRUTAL DOWNTREND! 📉
Entry: 3,500 ⚡
Target: 3,680 🚀
Sellers have dominated the tape for weeks, but $XAU is finally attempting to catch a bid around the crucial 3,500 psychological floor. 📊 Momentum indicators are cooling off as buyers step in to defend this structural pivot against relentless downward pressure. ⚡
Before turning aggressively bullish, I need to see a decisive volume expansion break through the 3,680 resistance zone to confirm institutional accumulation. 💡 If that reclaim holds, the path toward 3,760 opens up cleanly for momentum swing participants. 🤔
⚠️ Not financial advice. Always manage your risk. 🛡️
🏷️ #XAU #Gold #Breakout #Trading
🔥 💎
Entry: 3,500 ⚡
Target: 3,680 🚀
Sellers have dominated the tape for weeks, but $XAU is finally attempting to catch a bid around the crucial 3,500 psychological floor. 📊 Momentum indicators are cooling off as buyers step in to defend this structural pivot against relentless downward pressure. ⚡
Before turning aggressively bullish, I need to see a decisive volume expansion break through the 3,680 resistance zone to confirm institutional accumulation. 💡 If that reclaim holds, the path toward 3,760 opens up cleanly for momentum swing participants. 🤔
⚠️ Not financial advice. Always manage your risk. 🛡️
🏷️ #XAU #Gold #Breakout #Trading
🔥 💎
25

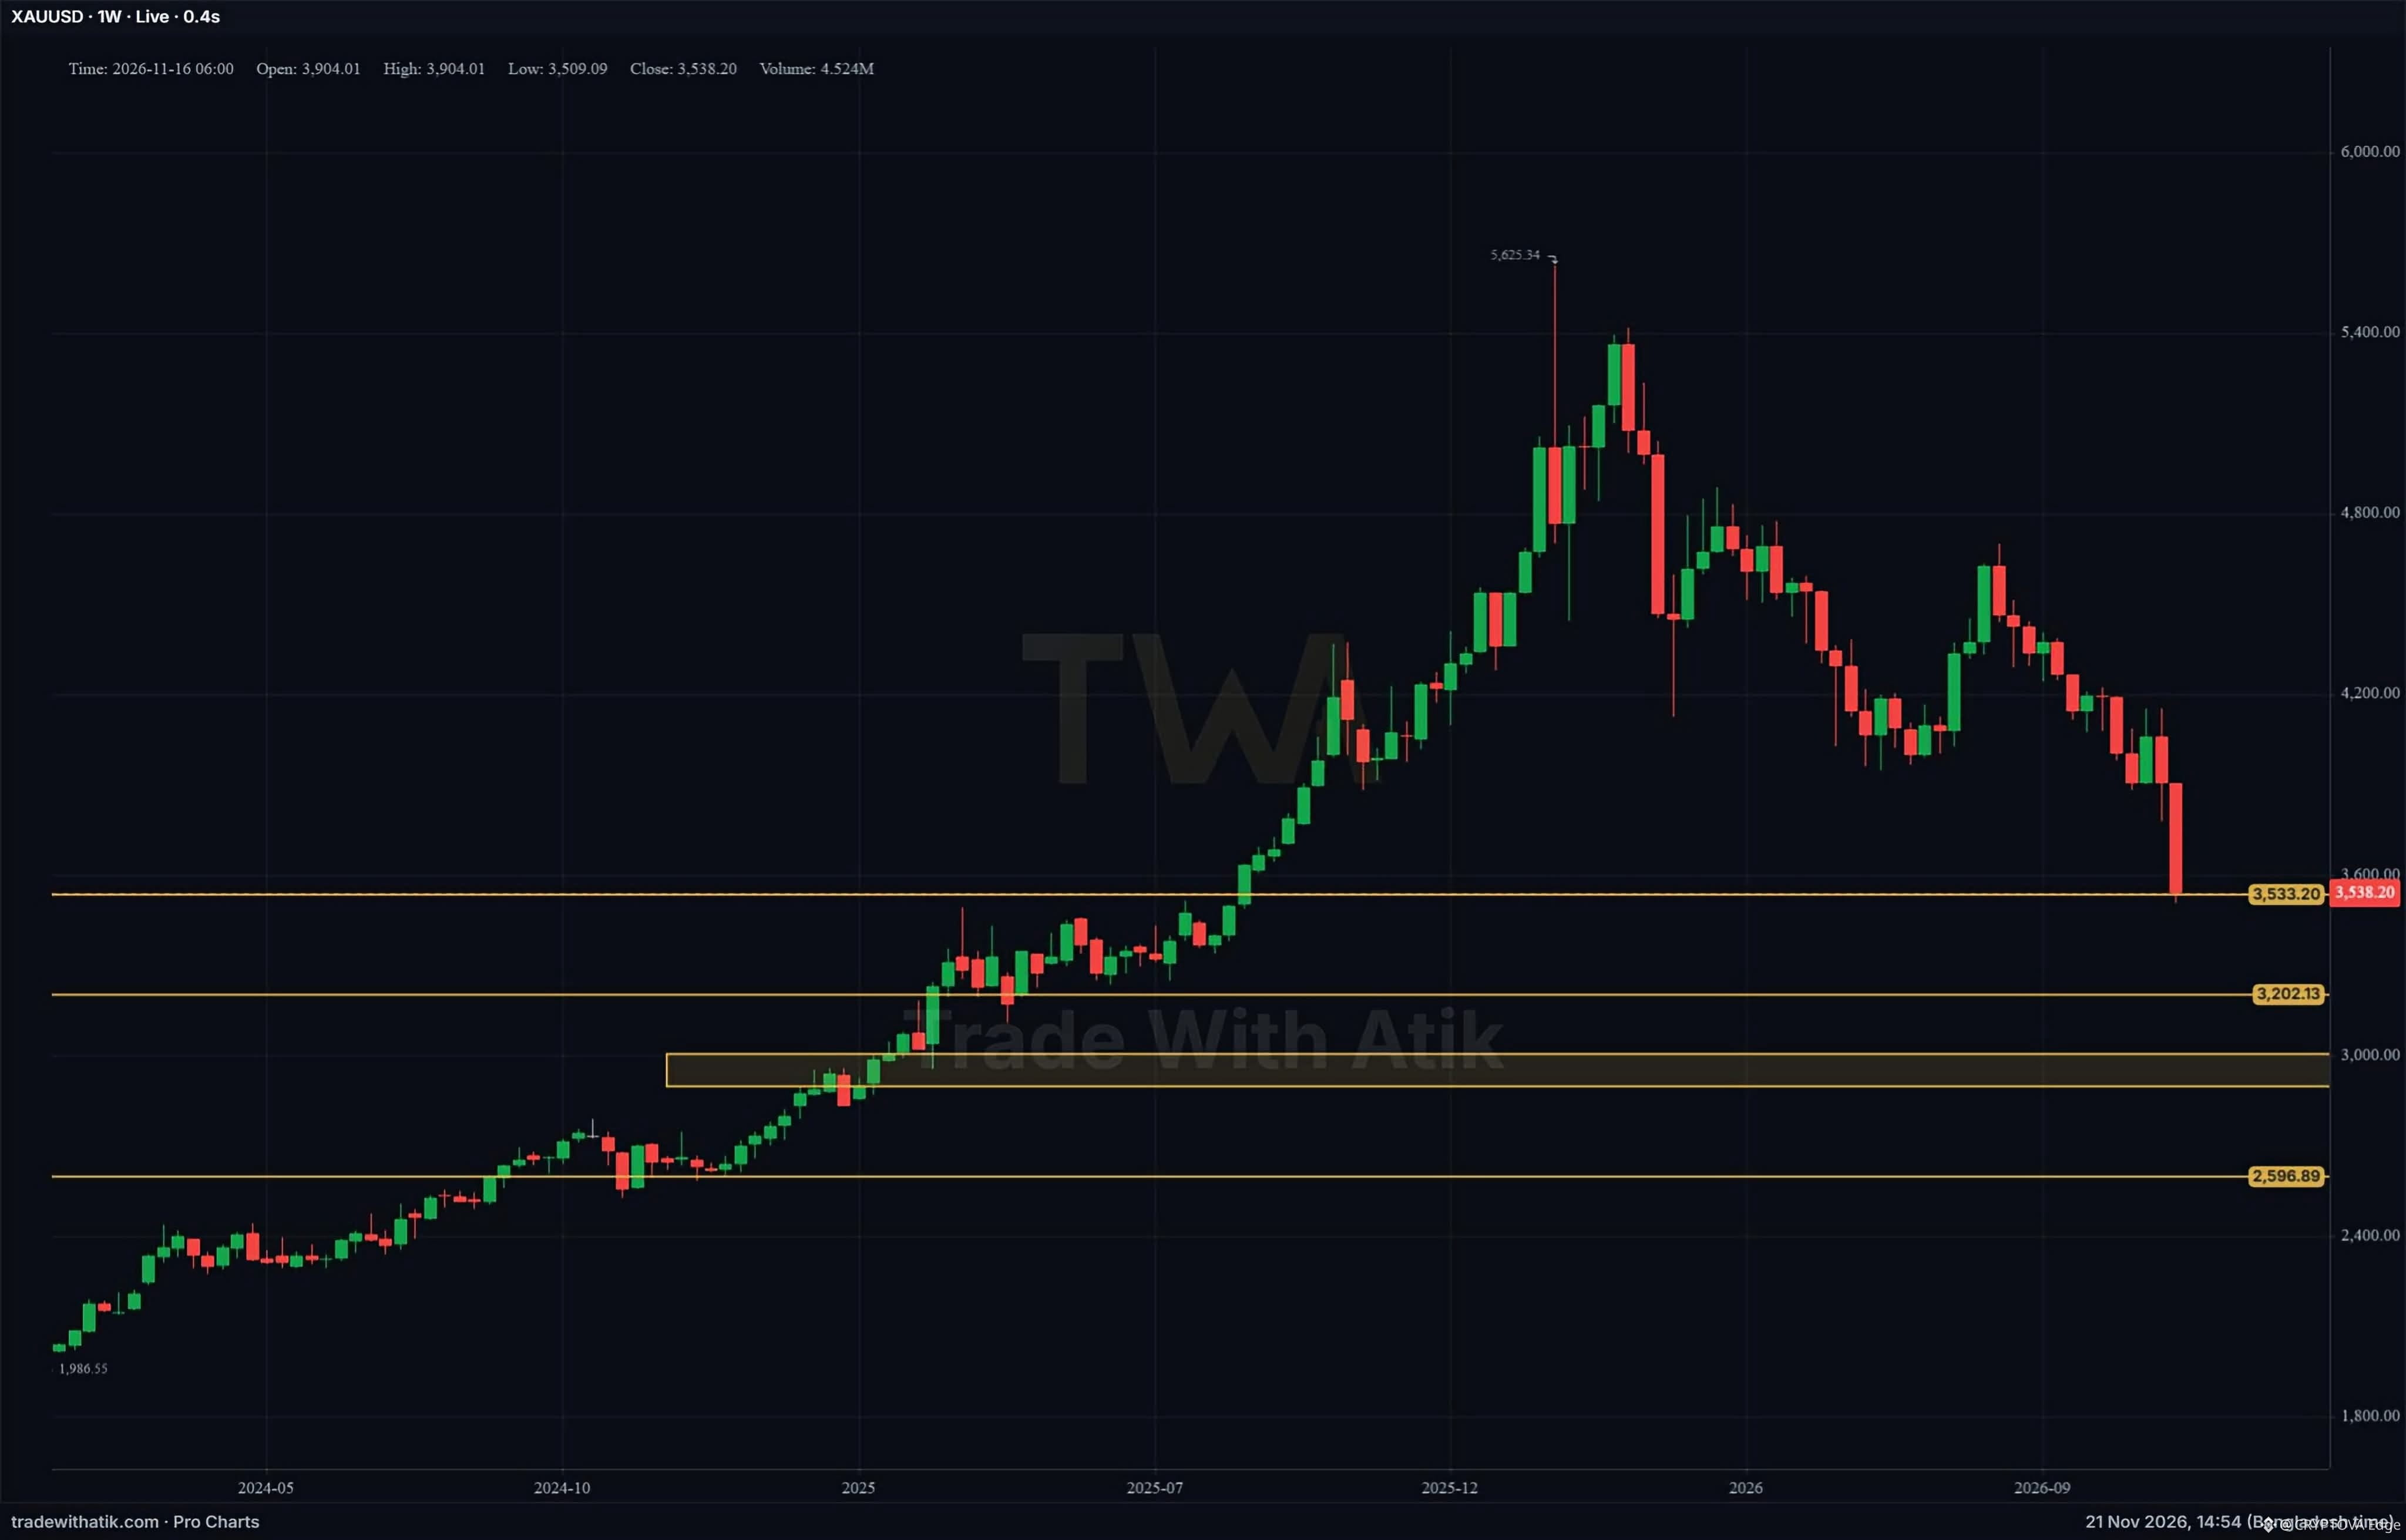
GOLD Long-Term Investment Strategy 🟡
If you are planning to invest in Gold for the long term, you can start building your position smartly from now.
However, instead of investing your entire capital at once, divide your investment capital into 4 parts and invest gradually.
Investment Plan:
1st Part: Start investing at the current price.
2nd Part: Invest if Gold drops toward $3,200.
3rd Part: Invest in the $2,900–$3,000 zone.
4th Part: Keep the remaining capital in reserve. If Gold drops further or the trend changes, invest based on market conditions.
Remember, nobody can predict the exact market bottom. That's why accumulating Gold gradually instead of investing all your capital at once is a smarter investment strategy.
Plan your investment with a 5–6 year long-term vision. Don't panic over short-term price movements. Stay patient and stick to your investment plan.
Patience and Capital Management are the keys to successful long-term investing. 🟡📈
#Gold #GoldInvestment #LongTermInvestment #estmentStrategy
GOLD Long-Term Investment Strategy 🟡
If you are planning to invest in Gold for the long term, you can start building your position smartly from now.
However, instead of investing your entire capital at once, divide your investment capital into 4 parts and invest gradually.
Investment Plan:
1st Part: Start investing at the current price.
2nd Part: Invest if Gold drops toward $3,200.
3rd Part: Invest in the $2,900–$3,000 zone.
4th Part: Keep the remaining capital in reserve. If Gold drops further or the trend changes, invest based on market conditions.
Remember, nobody can predict the exact market bottom. That's why accumulating Gold gradually instead of investing all your capital at once is a smarter investment strategy.
Plan your investment with a 5–6 year long-term vision. Don't panic over short-term price movements. Stay patient and stick to your investment plan.
Patience and Capital Management are the keys to successful long-term investing. 🟡📈
#Gold #GoldInvestment #LongTermInvestment #estmentStrategy
If you are planning to invest in Gold for the long term, you can start building your position smartly from now.
However, instead of investing your entire capital at once, divide your investment capital into 4 parts and invest gradually.
Investment Plan:
1st Part: Start investing at the current price.
2nd Part: Invest if Gold drops toward $3,200.
3rd Part: Invest in the $2,900–$3,000 zone.
4th Part: Keep the remaining capital in reserve. If Gold drops further or the trend changes, invest based on market conditions.
Remember, nobody can predict the exact market bottom. That's why accumulating Gold gradually instead of investing all your capital at once is a smarter investment strategy.
Plan your investment with a 5–6 year long-term vision. Don't panic over short-term price movements. Stay patient and stick to your investment plan.
Patience and Capital Management are the keys to successful long-term investing. 🟡📈
#Gold #GoldInvestment #LongTermInvestment #estmentStrategy
2
125

·
--
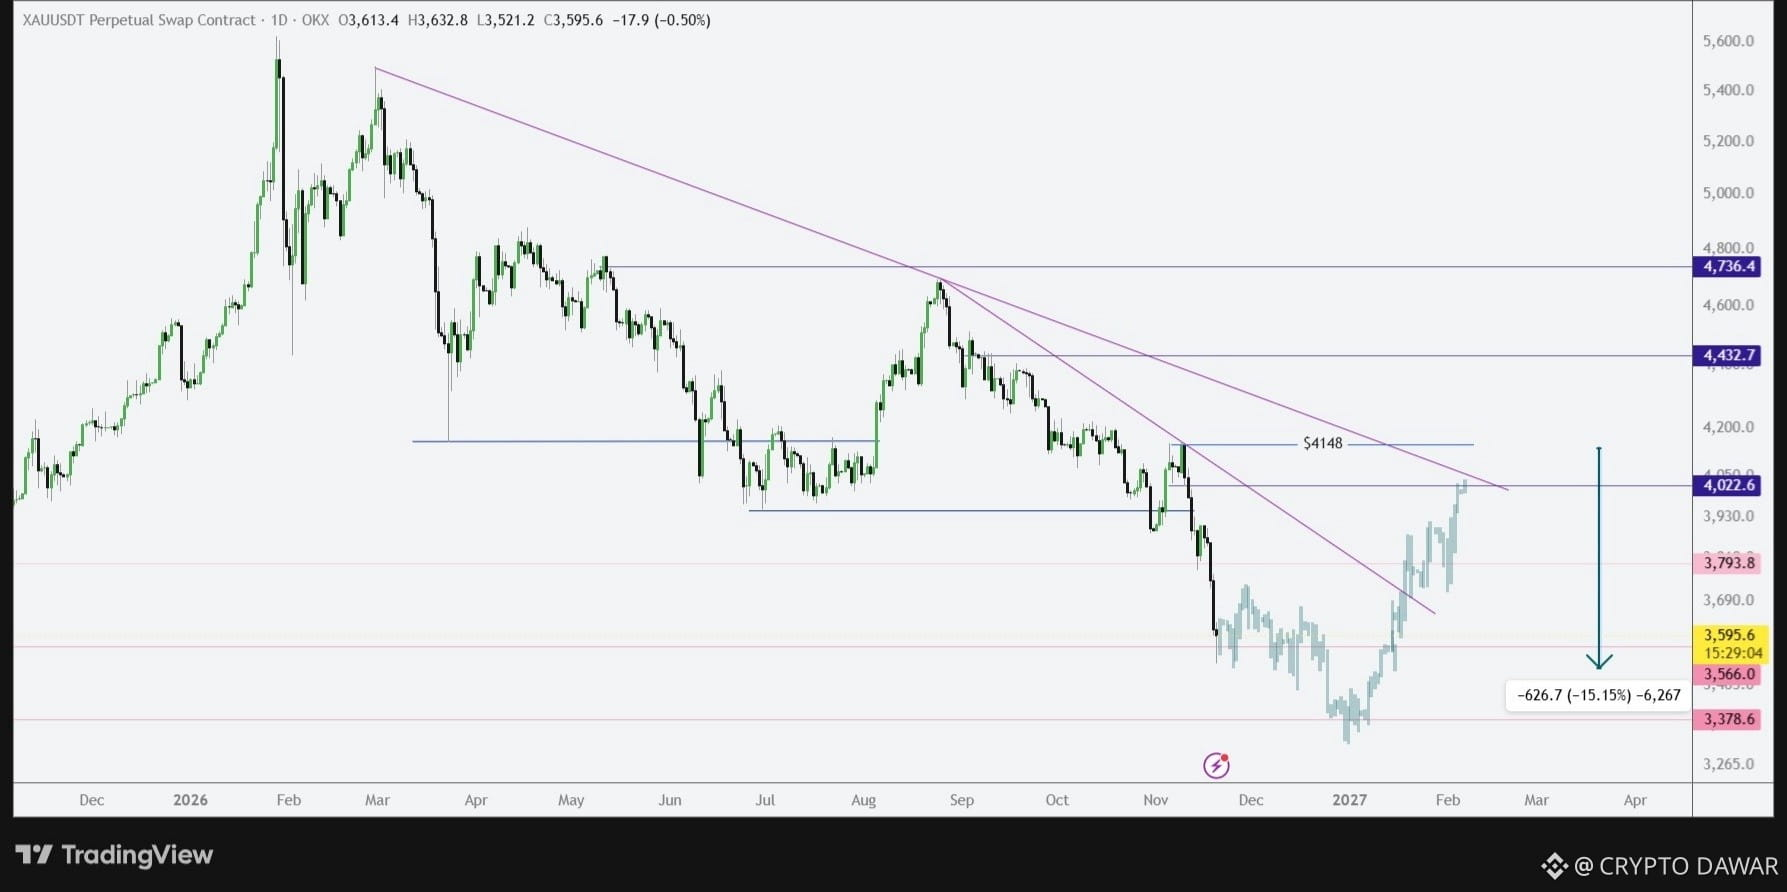
#GOLD Analysis- 👀
As I mentioned, the correction wasn't over yet, and price dropped another 15% or so.😄
Both of our entries have been filled, and I expect a recovery from here. Make sure to reduce your risk at the average entry price and place an additional order one level lower, around 3,378.😀
$XAUT
{future}(XAUTUSDT)
$PAXG
{spot}(PAXGUSDT)
#NvidiaBoardReportedlySplitOverHuang’sReturn #CanGTA6'sLaunchLiftTTWOShares? #CryptoDawar #BlackRockBitcoinETFRecordsLargestDailyOutflow
#GOLD Analysis- 👀
As I mentioned, the correction wasn't over yet, and price dropped another 15% or so.😄
Both of our entries have been filled, and I expect a recovery from here. Make sure to reduce your risk at the average entry price and place an additional order one level lower, around 3,378.😀
$XAUT
$PAXG
#NvidiaBoardReportedlySplitOverHuang’sReturn #CanGTA6'sLaunchLiftTTWOShares? #CryptoDawar #BlackRockBitcoinETFRecordsLargestDailyOutflow
As I mentioned, the correction wasn't over yet, and price dropped another 15% or so.😄
Both of our entries have been filled, and I expect a recovery from here. Make sure to reduce your risk at the average entry price and place an additional order one level lower, around 3,378.😀
$XAUT
$PAXG
#NvidiaBoardReportedlySplitOverHuang’sReturn #CanGTA6'sLaunchLiftTTWOShares? #CryptoDawar #BlackRockBitcoinETFRecordsLargestDailyOutflow
Square-Creator-a7f1b97d08259fa7f97b:
obrigado !
4
2
1.9k

·
--
Bullish
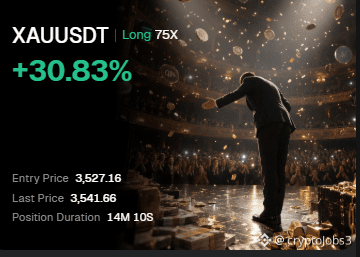
I'm long on Gold $XAUT here 📈
Entry: 3,527
Following my weekly outlook card: $3,500 is the big level.
More details in the group, on request.
High risk, NFA
#GOLD
Bullish $XAUT
{future}(XAUTUSDT)
I'm long on Gold $XAUT here 📈
Entry: 3,527
Following my weekly outlook card: $3,500 is the big level.
More details in the group, on request.
High risk, NFA
#GOLD
Bullish $XAUT
Entry: 3,527
Following my weekly outlook card: $3,500 is the big level.
More details in the group, on request.
High risk, NFA
#GOLD
Bullish $XAUT
1
3
1.8k
·
--
Disputed
cryptoJobs3
·
--
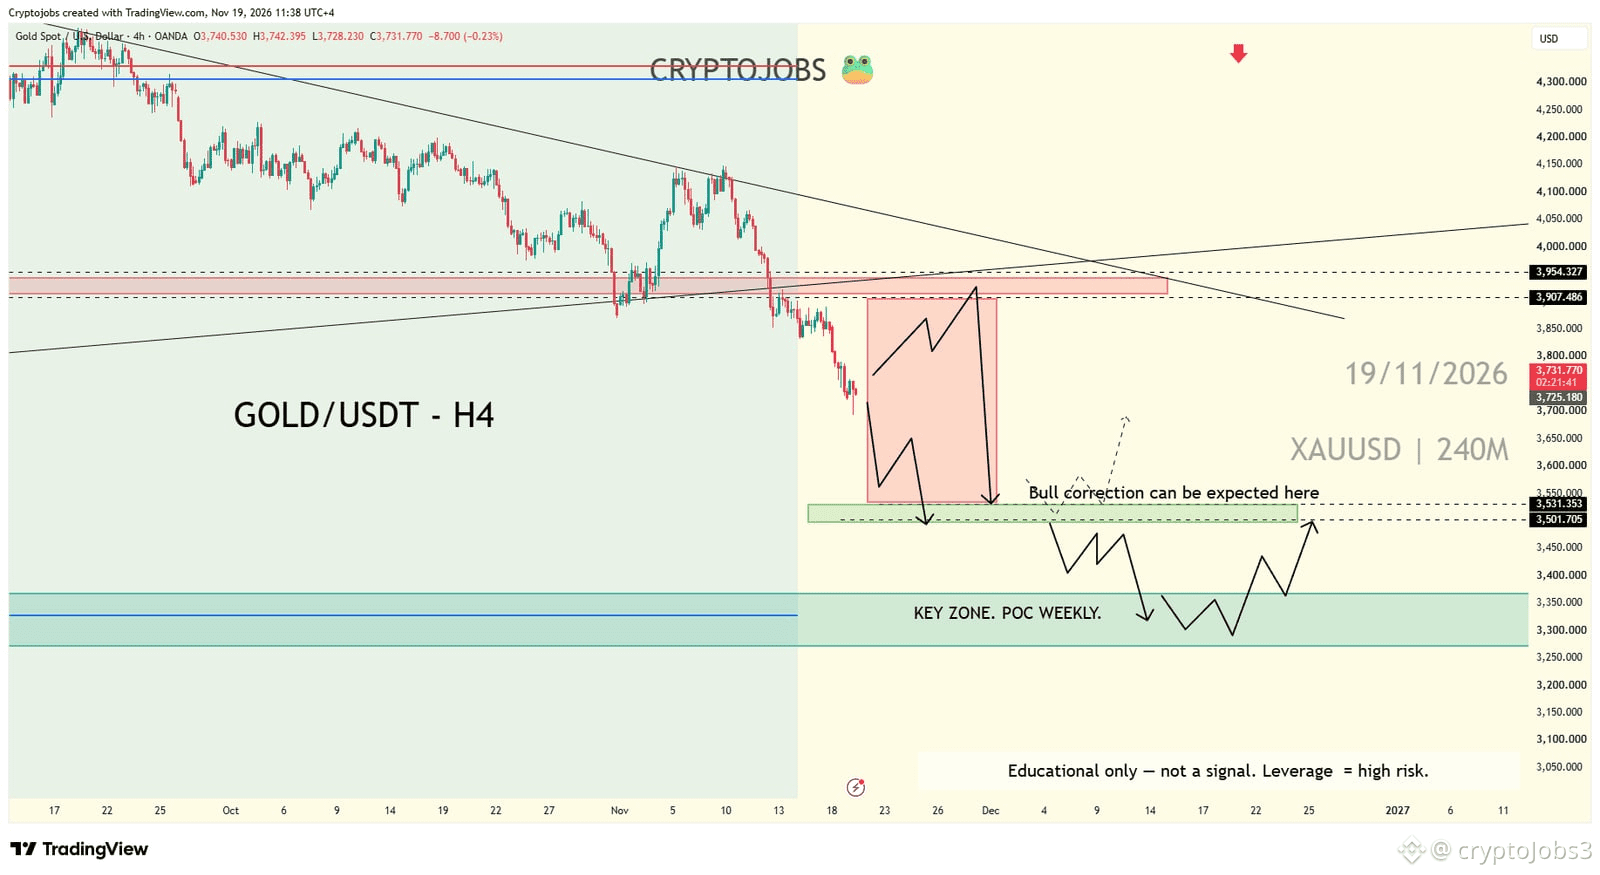
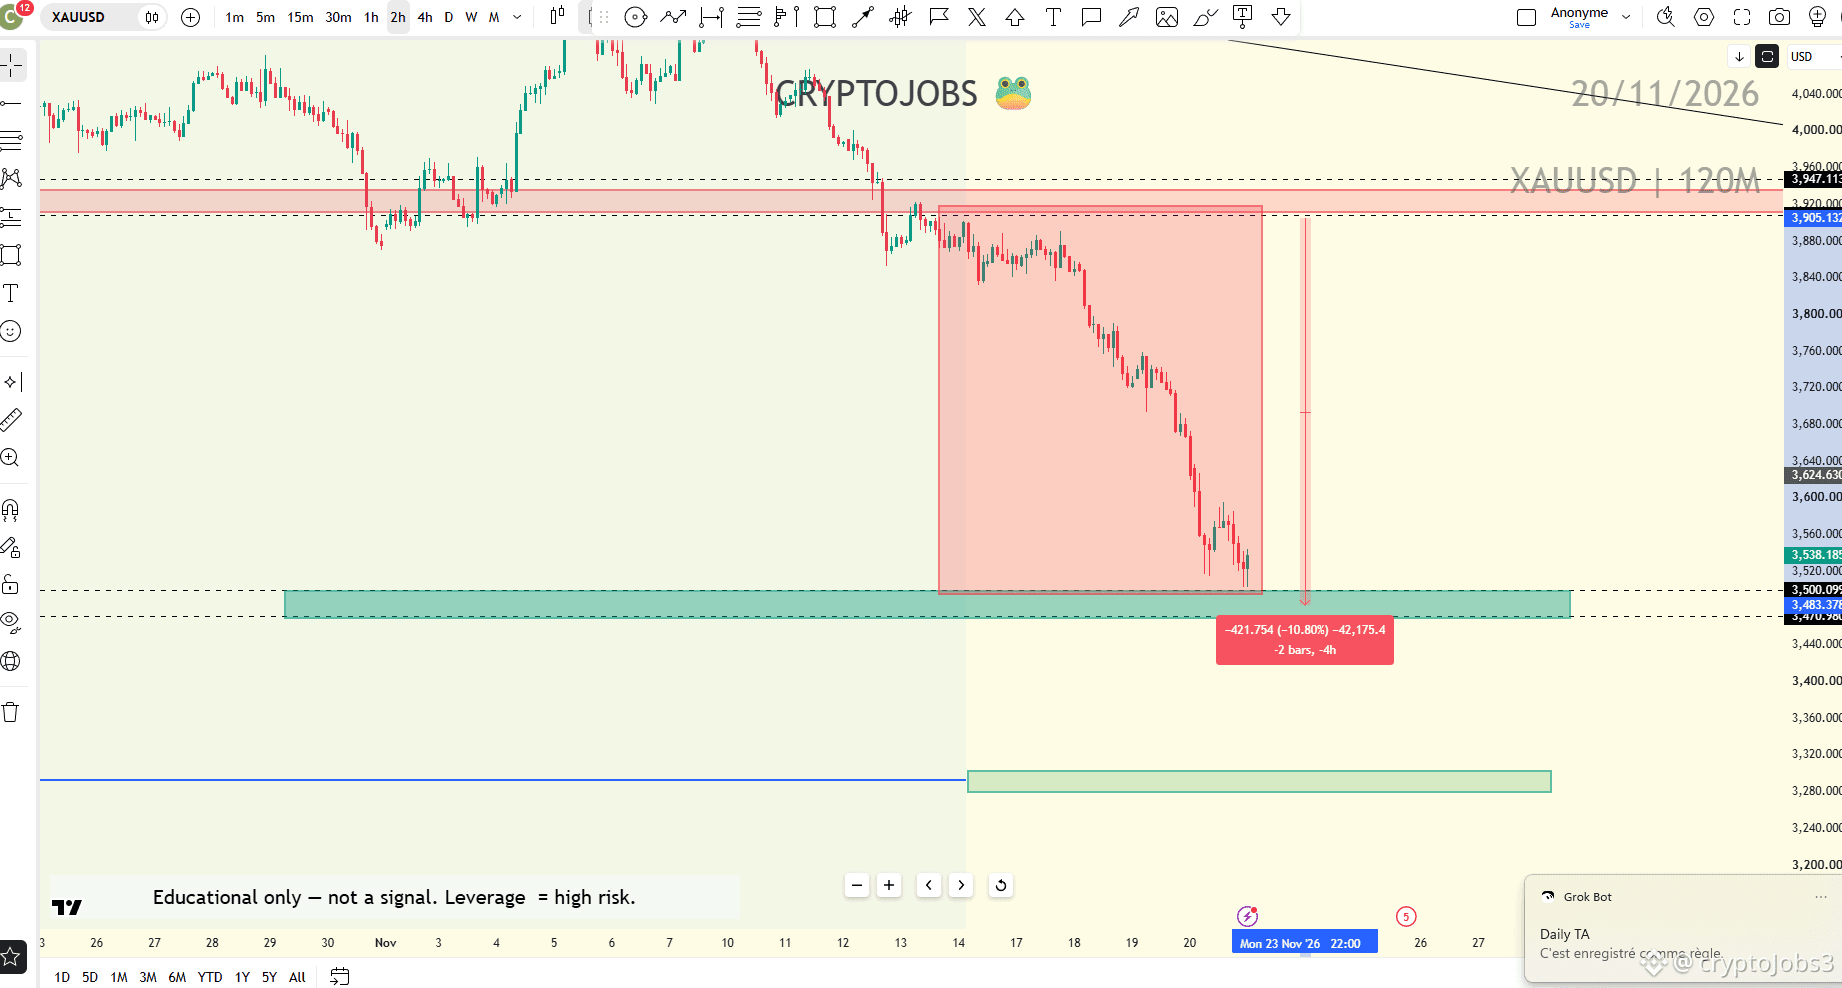
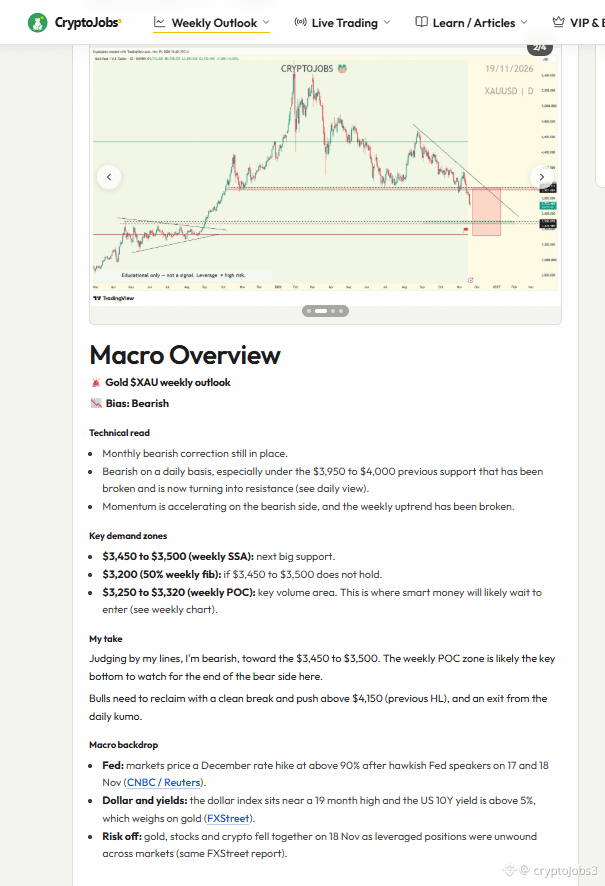
🚨 Gold $XAU weekly outlook
📉 Monthly bearish correction still in place, and the weekly uptrend has been broken.
Daily is bearish under $3,950 to $4,000. That old support is now resistance.
Next big support: $3,450 to $3,500 (weekly SSA).
If it does not hold: $3,200 (50% weekly fib).
Weekly POC: $3,250 to $3,320, the key volume area.
Bulls need a clean break above $4,150 (previous HL) and an exit from the daily kumo.
Join my free group for the next updates. [Pin post]
#GOLD #XAU $XAUT
📉 Monthly bearish correction still in place, and the weekly uptrend has been broken.
Daily is bearish under $3,950 to $4,000. That old support is now resistance.
Next big support: $3,450 to $3,500 (weekly SSA).
If it does not hold: $3,200 (50% weekly fib).
Weekly POC: $3,250 to $3,320, the key volume area.
Bulls need a clean break above $4,150 (previous HL) and an exit from the daily kumo.
Join my free group for the next updates. [Pin post]
#GOLD #XAU $XAUT
1
2
1.4k

·
--
🚨 GOLD CRASHES 3% — WORST WEEK IN EIGHT MONTHS!
Gold prices faced a major decline on Friday, November 20, 2026.
📉 Here are the key facts:
🥇 Spot gold fell around 3% to $3,514.08 per ounce.
📊 Gold lost approximately 9.4% during the week.
🌍 This marked its steepest weekly decline in eight months.
WHY IS GOLD FALLING?
1️⃣ A stronger US dollar.
2️⃣ Expectations of higher US interest rates.
3️⃣ Persistent inflation concerns.
4️⃣ Investors selling assets during market uncertainty.
WHAT HAPPENS NEXT?
Gold investors will be watching US Federal Reserve decisions and global economic developments closely.
💬 YOUR OPINION MATTERS!
Do you think gold can recover, or could prices fall further?
Share your thoughts below! 👇
#Gold #GoldPrice #XAUUSDTMACRO #MarketNews #Economy #reuters #BinanceSquare
🚨 GOLD CRASHES 3% — WORST WEEK IN EIGHT MONTHS!
Gold prices faced a major decline on Friday, November 20, 2026.
📉 Here are the key facts:
🥇 Spot gold fell around 3% to $3,514.08 per ounce.
📊 Gold lost approximately 9.4% during the week.
🌍 This marked its steepest weekly decline in eight months.
WHY IS GOLD FALLING?
1️⃣ A stronger US dollar.
2️⃣ Expectations of higher US interest rates.
3️⃣ Persistent inflation concerns.
4️⃣ Investors selling assets during market uncertainty.
WHAT HAPPENS NEXT?
Gold investors will be watching US Federal Reserve decisions and global economic developments closely.
💬 YOUR OPINION MATTERS!
Do you think gold can recover, or could prices fall further?
Share your thoughts below! 👇
#Gold #GoldPrice #XAUUSDTMACRO #MarketNews #Economy #reuters #BinanceSquare
Gold prices faced a major decline on Friday, November 20, 2026.
📉 Here are the key facts:
🥇 Spot gold fell around 3% to $3,514.08 per ounce.
📊 Gold lost approximately 9.4% during the week.
🌍 This marked its steepest weekly decline in eight months.
WHY IS GOLD FALLING?
1️⃣ A stronger US dollar.
2️⃣ Expectations of higher US interest rates.
3️⃣ Persistent inflation concerns.
4️⃣ Investors selling assets during market uncertainty.
WHAT HAPPENS NEXT?
Gold investors will be watching US Federal Reserve decisions and global economic developments closely.
💬 YOUR OPINION MATTERS!
Do you think gold can recover, or could prices fall further?
Share your thoughts below! 👇
#Gold #GoldPrice #XAUUSDTMACRO #MarketNews #Economy #reuters #BinanceSquare

228


·
--
Gold and Silver’s rally turned into a $15 trillion wipeout.
Silver traded under $30 per ounce in April 2025, then surged to an all‑time high of $122 by late January 2026 – a more‑than‑4× rise.
Gold moved from under $3,000/oz in April 2025 to a peak of $5,600 in late January 2026.
Since those peaks, the market rout pushed gold below $3,550 and silver below $42, erasing roughly $15 trillion in combined market value.
Gold’s price dropped about 37% to $3,500, an 8% weekly decline – its worst performance in eight months, while silver fell 65% in the same period.
Bitcoin mirrored the trend, falling from $81,000 earlier this month to $55,000 on Saturday.
Despite the rout, central banks kept buying: 321 tonnes accumulated in Q3 – 42% more than a year earlier and the strongest quarterly total since Q4 2024.
Year‑to‑date purchases reached 675 tonnes, 6% above the same period in 2025, with China and Poland among the top buyers.
The decline coincides with a stronger US dollar, rising Treasury yields and a market‑priced ~90% probability of a December Fed rate hike, prompting forced selling to cover losses elsewhere.
What does this tell you about the resilience of traditional safe‑haven assets in today’s liquidity crunch?
#Gold #Silver #Investing #MacroEconomy
Gold and Silver’s rally turned into a $15 trillion wipeout.
Silver traded under $30 per ounce in April 2025, then surged to an all‑time high of $122 by late January 2026 – a more‑than‑4× rise.
Gold moved from under $3,000/oz in April 2025 to a peak of $5,600 in late January 2026.
Since those peaks, the market rout pushed gold below $3,550 and silver below $42, erasing roughly $15 trillion in combined market value.
Gold’s price dropped about 37% to $3,500, an 8% weekly decline – its worst performance in eight months, while silver fell 65% in the same period.
Bitcoin mirrored the trend, falling from $81,000 earlier this month to $55,000 on Saturday.
Despite the rout, central banks kept buying: 321 tonnes accumulated in Q3 – 42% more than a year earlier and the strongest quarterly total since Q4 2024.
Year‑to‑date purchases reached 675 tonnes, 6% above the same period in 2025, with China and Poland among the top buyers.
The decline coincides with a stronger US dollar, rising Treasury yields and a market‑priced ~90% probability of a December Fed rate hike, prompting forced selling to cover losses elsewhere.
What does this tell you about the resilience of traditional safe‑haven assets in today’s liquidity crunch?
#Gold #Silver #Investing #MacroEconomy
Silver traded under $30 per ounce in April 2025, then surged to an all‑time high of $122 by late January 2026 – a more‑than‑4× rise.
Gold moved from under $3,000/oz in April 2025 to a peak of $5,600 in late January 2026.
Since those peaks, the market rout pushed gold below $3,550 and silver below $42, erasing roughly $15 trillion in combined market value.
Gold’s price dropped about 37% to $3,500, an 8% weekly decline – its worst performance in eight months, while silver fell 65% in the same period.
Bitcoin mirrored the trend, falling from $81,000 earlier this month to $55,000 on Saturday.
Despite the rout, central banks kept buying: 321 tonnes accumulated in Q3 – 42% more than a year earlier and the strongest quarterly total since Q4 2024.
Year‑to‑date purchases reached 675 tonnes, 6% above the same period in 2025, with China and Poland among the top buyers.
The decline coincides with a stronger US dollar, rising Treasury yields and a market‑priced ~90% probability of a December Fed rate hike, prompting forced selling to cover losses elsewhere.
What does this tell you about the resilience of traditional safe‑haven assets in today’s liquidity crunch?
#Gold #Silver #Investing #MacroEconomy

8

☕️ Chai in hand & GOLD flying! XAUUSD 2324 -> 2420 🚀
$XAUT
Entry 3'546.44 | SL 3'510.10 | Target 3'610.20
{spot}(XAUTUSDT)
Double Bottom Breakout Confirmed!
$XAUT
Are you buying GOLD today? 👇
$GOLD.US
#XAUUSD #GOLD #BinanceSquare
☕️ Chai in hand & GOLD flying! XAUUSD 2324 -> 2420 🚀
$XAUT
Entry 3'546.44 | SL 3'510.10 | Target 3'610.20
Double Bottom Breakout Confirmed!
$XAUT
Are you buying GOLD today? 👇
$GOLD.US
#XAUUSD #GOLD #BinanceSquare
$XAUT
Entry 3'546.44 | SL 3'510.10 | Target 3'610.20
Double Bottom Breakout Confirmed!
$XAUT
Are you buying GOLD today? 👇
$GOLD.US
#XAUUSD #GOLD #BinanceSquare

1
19

·
--
Bearish
#GOLD Opening Short....
long unbelievable bearish now lost momentum completely candles going red now plus percentage closed
Short it soon
$XAUT $XAU $PAXG
{future}(PAXGUSDT)
{future}(XAUUSDT)
{future}(XAUTUSDT)
#GOLD Opening Short....
long unbelievable bearish now lost momentum completely candles going red now plus percentage closed
Short it soon
$XAUT $XAU $PAXG
long unbelievable bearish now lost momentum completely candles going red now plus percentage closed
Short it soon
$XAUT $XAU $PAXG
4

·
--
Partly True

Article
WHY IS GOLD CRASHING? THE FED, STRONG DOLLAR AND THE $3,500 BATTLEGold is going through a serious correction, and the latest market data suggests that this is more than ordinary profit booking.
On November 20, gold touched an intraday low of $3,513.54 per ounce, while spot prices were reported at $3,576.09, down 1.3% in one Reuters market snapshot.
Gold is now heading towards its worst weekly performance in eight months, with an approximately 8% weekly decline.
But what is actually driving this selloff?
Let's break down the bigger picture.
1. The Federal Reserve has become the biggest problem for gold
One of the strongest reasons behind the current decline is changing expectations around US monetary policy.
Markets are increasingly expecting another interest-rate hike in December.
According to Reuters, traders were pricing in a 99.3% probability of a 25-basis-point rate increase.
This changes the investment equation.
Gold does not generate interest. When investors expect higher interest rates, bonds and other yield-generating assets become more attractive.
This creates additional selling pressure on gold.
2. The US Dollar is strengthening
The dollar has become another major headwind.
The US Dollar Index has been trading around its highest levels in approximately 19 months.
Since gold is priced internationally in dollars, a stronger dollar makes bullion more expensive for international buyers.
This can reduce demand and put additional pressure on prices.
The combination of a stronger dollar and hawkish Fed expectations is particularly negative for gold.
3. AI stock selloff is creating forced liquidation
There is another important factor that many traders might overlook.
The recent weakness in technology and AI-related stocks has increased volatility across global markets.
Some investors are selling profitable positions in other assets to cover losses and raise liquidity.
Gold is also getting caught in this selling pressure.
Normally, gold benefits from stock-market uncertainty. But during forced liquidation, even traditional safe-haven assets can decline.
This is one reason the current correction looks unusually aggressive.
4. Treasury yields remain an important factor
US Treasury yields have remained elevated around the 5% region.
Although the 10-year yield briefly slipped below 5% on Friday amid demand for government bonds, the broader interest-rate environment remains challenging for gold.
The important indicator here is real yields.
If real yields continue increasing, investors may prefer interest-bearing assets over gold.
5. Is institutional demand disappearing?
Not necessarily.
The current decline should not automatically be interpreted as the end of gold's long-term investment story.
Central-bank purchases, reserve diversification and investment demand remain important structural factors.
However, long-term demand cannot prevent short-term corrections when monetary policy expectations change rapidly.
The key distinction is between short-term market positioning and long-term fundamental demand.
6. Important price levels to watch
The recent intraday low around $3,513 is an important reference point.
Here are the areas I would monitor:
$3,500–$3,515: Recent low and psychological support zone.
$3,400: Potential downside observation area.
$3,300–$3,400: A deeper support region highlighted by market analysts.
$3,800: Important recovery area.
$3,900: A stronger bullish recovery would need to establish itself above this region.
These are observation zones, not guaranteed support or resistance levels.
A sustained breakdown below the recent low could extend the bearish structure.
On the other hand, a weaker dollar and declining real yields could create conditions for a recovery.
7. What happens next?
I see three possible scenarios.
Bearish scenario:
If the Federal Reserve maintains its hawkish position, the dollar remains strong and gold fails to recover broken levels, further downside remains possible.
Recovery scenario:
If inflation data starts cooling, rate-hike expectations decline and the dollar weakens, gold could experience a meaningful recovery.
Consolidation scenario:
If economic signals remain mixed, gold could consolidate while investors wait for fresh inflation data and Federal Reserve communication.
My Final View
I think the most important thing to understand is that gold is currently facing a monetary-policy problem.
The combination of higher-rate expectations, dollar strength and forced liquidation is outweighing safe-haven demand.
But I would not call this the complete breakdown of gold's long-term investment case.
For traders, the priority should be watching how price reacts around the recent lows rather than blindly buying because gold looks cheap.
A strong recovery in gold needs confirmation from both macroeconomic conditions and price action.
The real question is not simply how much further gold can fall. It is when the economic conditions that supported its previous rally will return.
What do you think: Is this the beginning of a deeper bearish trend, or is the market preparing for a major recovery?
#Gold #XAUUSD #FederalReserve
WHY IS GOLD CRASHING? THE FED, STRONG DOLLAR AND THE $3,500 BATTLE
Gold is going through a serious correction, and the latest market data suggests that this is more than ordinary profit booking.
On November 20, gold touched an intraday low of $3,513.54 per ounce, while spot prices were reported at $3,576.09, down 1.3% in one Reuters market snapshot.
Gold is now heading towards its worst weekly performance in eight months, with an approximately 8% weekly decline.
But what is actually driving this selloff?
Let's break down the bigger picture.
1. The Federal Reserve has become the biggest problem for gold
One of the strongest reasons behind the current decline is changing expectations around US monetary policy.
Markets are increasingly expecting another interest-rate hike in December.
According to Reuters, traders were pricing in a 99.3% probability of a 25-basis-point rate increase.
This changes the investment equation.
Gold does not generate interest. When investors expect higher interest rates, bonds and other yield-generating assets become more attractive.
This creates additional selling pressure on gold.
2. The US Dollar is strengthening
The dollar has become another major headwind.
The US Dollar Index has been trading around its highest levels in approximately 19 months.
Since gold is priced internationally in dollars, a stronger dollar makes bullion more expensive for international buyers.
This can reduce demand and put additional pressure on prices.
The combination of a stronger dollar and hawkish Fed expectations is particularly negative for gold.
3. AI stock selloff is creating forced liquidation
There is another important factor that many traders might overlook.
The recent weakness in technology and AI-related stocks has increased volatility across global markets.
Some investors are selling profitable positions in other assets to cover losses and raise liquidity.
Gold is also getting caught in this selling pressure.
Normally, gold benefits from stock-market uncertainty. But during forced liquidation, even traditional safe-haven assets can decline.
This is one reason the current correction looks unusually aggressive.
4. Treasury yields remain an important factor
US Treasury yields have remained elevated around the 5% region.
Although the 10-year yield briefly slipped below 5% on Friday amid demand for government bonds, the broader interest-rate environment remains challenging for gold.
The important indicator here is real yields.
If real yields continue increasing, investors may prefer interest-bearing assets over gold.
5. Is institutional demand disappearing?
Not necessarily.
The current decline should not automatically be interpreted as the end of gold's long-term investment story.
Central-bank purchases, reserve diversification and investment demand remain important structural factors.
However, long-term demand cannot prevent short-term corrections when monetary policy expectations change rapidly.
The key distinction is between short-term market positioning and long-term fundamental demand.
6. Important price levels to watch
The recent intraday low around $3,513 is an important reference point.
Here are the areas I would monitor:
$3,500–$3,515: Recent low and psychological support zone.
$3,400: Potential downside observation area.
$3,300–$3,400: A deeper support region highlighted by market analysts.
$3,800: Important recovery area.
$3,900: A stronger bullish recovery would need to establish itself above this region.
These are observation zones, not guaranteed support or resistance levels.
A sustained breakdown below the recent low could extend the bearish structure.
On the other hand, a weaker dollar and declining real yields could create conditions for a recovery.
7. What happens next?
I see three possible scenarios.
Bearish scenario:
If the Federal Reserve maintains its hawkish position, the dollar remains strong and gold fails to recover broken levels, further downside remains possible.
Recovery scenario:
If inflation data starts cooling, rate-hike expectations decline and the dollar weakens, gold could experience a meaningful recovery.
Consolidation scenario:
If economic signals remain mixed, gold could consolidate while investors wait for fresh inflation data and Federal Reserve communication.
My Final View
I think the most important thing to understand is that gold is currently facing a monetary-policy problem.
The combination of higher-rate expectations, dollar strength and forced liquidation is outweighing safe-haven demand.
But I would not call this the complete breakdown of gold's long-term investment case.
For traders, the priority should be watching how price reacts around the recent lows rather than blindly buying because gold looks cheap.
A strong recovery in gold needs confirmation from both macroeconomic conditions and price action.
The real question is not simply how much further gold can fall. It is when the economic conditions that supported its previous rally will return.
What do you think: Is this the beginning of a deeper bearish trend, or is the market preparing for a major recovery?
#Gold #XAUUSD #FederalReserve
On November 20, gold touched an intraday low of $3,513.54 per ounce, while spot prices were reported at $3,576.09, down 1.3% in one Reuters market snapshot.
Gold is now heading towards its worst weekly performance in eight months, with an approximately 8% weekly decline.
But what is actually driving this selloff?
Let's break down the bigger picture.
1. The Federal Reserve has become the biggest problem for gold
One of the strongest reasons behind the current decline is changing expectations around US monetary policy.
Markets are increasingly expecting another interest-rate hike in December.
According to Reuters, traders were pricing in a 99.3% probability of a 25-basis-point rate increase.
This changes the investment equation.
Gold does not generate interest. When investors expect higher interest rates, bonds and other yield-generating assets become more attractive.
This creates additional selling pressure on gold.
2. The US Dollar is strengthening
The dollar has become another major headwind.
The US Dollar Index has been trading around its highest levels in approximately 19 months.
Since gold is priced internationally in dollars, a stronger dollar makes bullion more expensive for international buyers.
This can reduce demand and put additional pressure on prices.
The combination of a stronger dollar and hawkish Fed expectations is particularly negative for gold.
3. AI stock selloff is creating forced liquidation
There is another important factor that many traders might overlook.
The recent weakness in technology and AI-related stocks has increased volatility across global markets.
Some investors are selling profitable positions in other assets to cover losses and raise liquidity.
Gold is also getting caught in this selling pressure.
Normally, gold benefits from stock-market uncertainty. But during forced liquidation, even traditional safe-haven assets can decline.
This is one reason the current correction looks unusually aggressive.
4. Treasury yields remain an important factor
US Treasury yields have remained elevated around the 5% region.
Although the 10-year yield briefly slipped below 5% on Friday amid demand for government bonds, the broader interest-rate environment remains challenging for gold.
The important indicator here is real yields.
If real yields continue increasing, investors may prefer interest-bearing assets over gold.
5. Is institutional demand disappearing?
Not necessarily.
The current decline should not automatically be interpreted as the end of gold's long-term investment story.
Central-bank purchases, reserve diversification and investment demand remain important structural factors.
However, long-term demand cannot prevent short-term corrections when monetary policy expectations change rapidly.
The key distinction is between short-term market positioning and long-term fundamental demand.
6. Important price levels to watch
The recent intraday low around $3,513 is an important reference point.
Here are the areas I would monitor:
$3,500–$3,515: Recent low and psychological support zone.
$3,400: Potential downside observation area.
$3,300–$3,400: A deeper support region highlighted by market analysts.
$3,800: Important recovery area.
$3,900: A stronger bullish recovery would need to establish itself above this region.
These are observation zones, not guaranteed support or resistance levels.
A sustained breakdown below the recent low could extend the bearish structure.
On the other hand, a weaker dollar and declining real yields could create conditions for a recovery.
7. What happens next?
I see three possible scenarios.
Bearish scenario:
If the Federal Reserve maintains its hawkish position, the dollar remains strong and gold fails to recover broken levels, further downside remains possible.
Recovery scenario:
If inflation data starts cooling, rate-hike expectations decline and the dollar weakens, gold could experience a meaningful recovery.
Consolidation scenario:
If economic signals remain mixed, gold could consolidate while investors wait for fresh inflation data and Federal Reserve communication.
My Final View
I think the most important thing to understand is that gold is currently facing a monetary-policy problem.
The combination of higher-rate expectations, dollar strength and forced liquidation is outweighing safe-haven demand.
But I would not call this the complete breakdown of gold's long-term investment case.
For traders, the priority should be watching how price reacts around the recent lows rather than blindly buying because gold looks cheap.
A strong recovery in gold needs confirmation from both macroeconomic conditions and price action.
The real question is not simply how much further gold can fall. It is when the economic conditions that supported its previous rally will return.
What do you think: Is this the beginning of a deeper bearish trend, or is the market preparing for a major recovery?
#Gold #XAUUSD #FederalReserve
1
1.2k

·
--
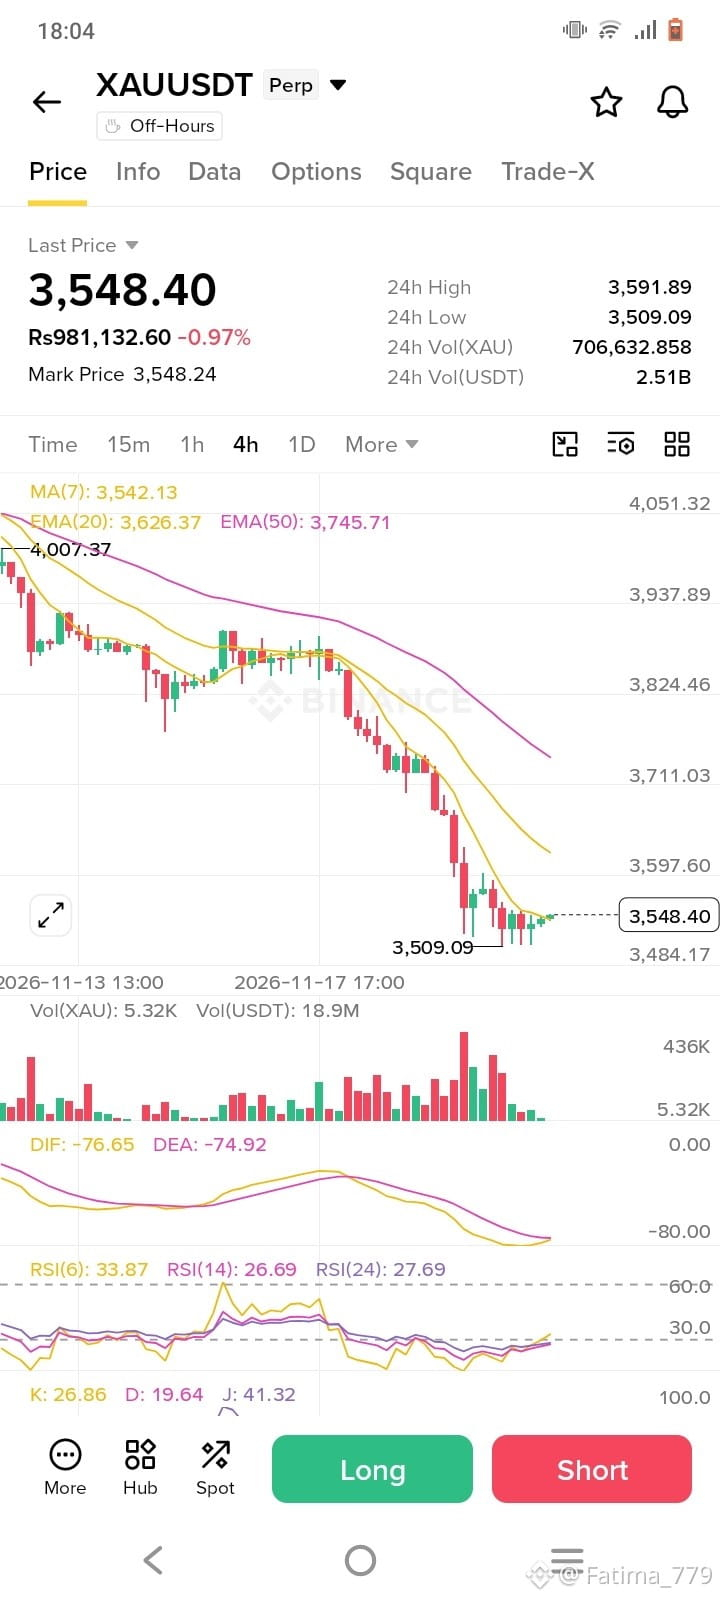
🚨 GOLD ($XAU USDT): Bearish Pressure Is Still Dominating!
Gold is trading around 3,548, and the 4H chart is showing clear selling pressure.
📉 Price remains below EMA 20 (3,626) and EMA 50 (3,745), keeping the overall trend bearish.
👀 Key levels to watch:
- Support: 3,509 – 3,484
- Resistance: 3,597 – 3,626
RSI is deeply oversold, while MACD remains in negative territory. A short-term relief bounce is possible, but that doesn't confirm a trend reversal.
My view: I would avoid chasing either direction here. Watch how price reacts around 3,509 support and wait for confirmation.
What's next for Gold?
🔴 More downside or 🟢 a strong recovery?
#XAUUSDT #GOLD #Trading #TechnicalAnalysis
{future}(XAUUSDT)
🚨 GOLD ($XAU USDT): Bearish Pressure Is Still Dominating!
Gold is trading around 3,548, and the 4H chart is showing clear selling pressure.
📉 Price remains below EMA 20 (3,626) and EMA 50 (3,745), keeping the overall trend bearish.
👀 Key levels to watch:
- Support: 3,509 – 3,484
- Resistance: 3,597 – 3,626
RSI is deeply oversold, while MACD remains in negative territory. A short-term relief bounce is possible, but that doesn't confirm a trend reversal.
My view: I would avoid chasing either direction here. Watch how price reacts around 3,509 support and wait for confirmation.
What's next for Gold?
🔴 More downside or 🟢 a strong recovery?
#XAUUSDT #GOLD #Trading #TechnicalAnalysis
Gold is trading around 3,548, and the 4H chart is showing clear selling pressure.
📉 Price remains below EMA 20 (3,626) and EMA 50 (3,745), keeping the overall trend bearish.
👀 Key levels to watch:
- Support: 3,509 – 3,484
- Resistance: 3,597 – 3,626
RSI is deeply oversold, while MACD remains in negative territory. A short-term relief bounce is possible, but that doesn't confirm a trend reversal.
My view: I would avoid chasing either direction here. Watch how price reacts around 3,509 support and wait for confirmation.
What's next for Gold?
🔴 More downside or 🟢 a strong recovery?
#XAUUSDT #GOLD #Trading #TechnicalAnalysis
1
66
Log in to explore more content
Join global crypto users on Binance Square
⚡️ Get latest and useful information about crypto.
💬 Trusted by the world’s largest crypto exchange.
👍 Discover real insights from verified creators.
Email / Phone number
Trending Topics
1
#BitcoinFallsBelow$57KToTwoYearLow
5,626 views
44 Discussing
2
#NvidiaLoses$2.7TrillionInMonthAndAHalf
1,183 views
48 Discussing
3
#CanBTCReboundAfterFallingBelow60K?
550,336 views
2,384 Discussing
4
#GlobalStocksFaceLongestLosingStreakSince2023
189,131 views
1,651 Discussing
5
#BlackRockIBITPostsRecord$541MSingleDayOutflow
15,733 views
57 Discussing
6
#AnthropicPlungesTowardIPOPriceonDay2
93,913 views
963 Discussing
7
#TwentyOneCapitalAdds172.25BTC
39,103 views
481 Discussing
8
#HKBillWouldExcludeTokenizedDepositsFromVirtualAssets
3,645 views
47 Discussing
9
#BNBDropsBelow540USDTWith8.46%DailyDecline
54,280 views
496 Discussing
10
#HKBillProposesHK$100KFineForUnauthorizedCryptoTitles
1,858 views
20 Discussing