
#gold
gold
25.1M views
65,506 Discussing
Hot
Latest

·
--
#GOLD Analysis- 👀
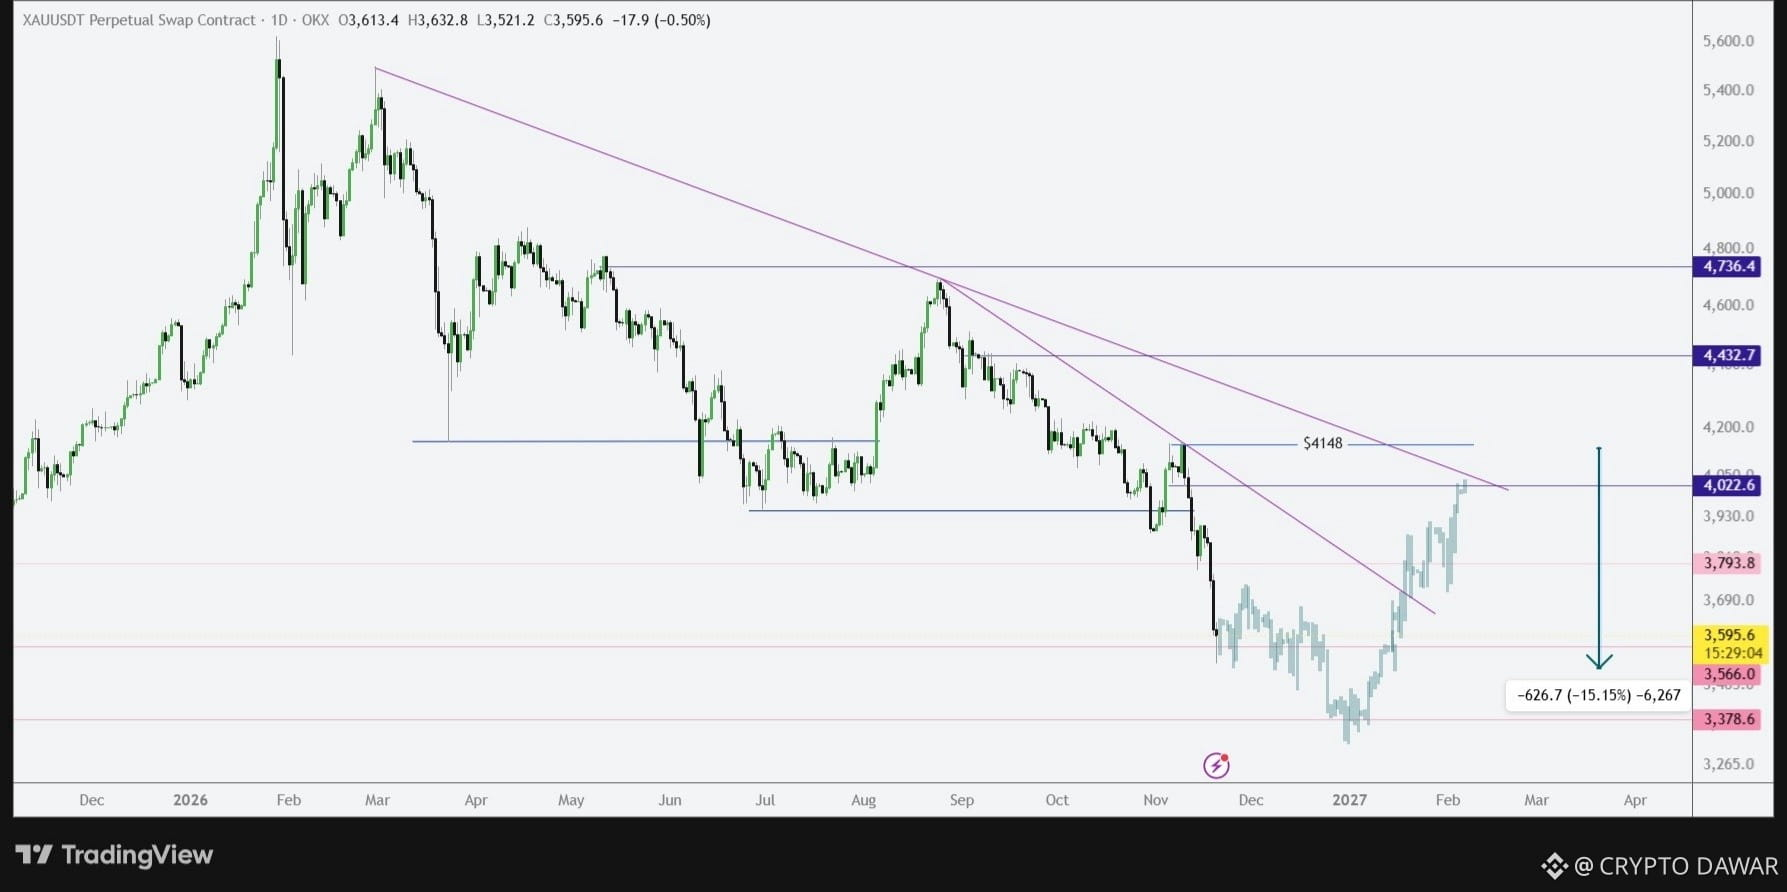
As I mentioned, the correction wasn't over yet, and price dropped another 15% or so.😄
Both of our entries have been filled, and I expect a recovery from here. Make sure to reduce your risk at the average entry price and place an additional order one level lower, around 3,378.😀
$XAUT
{future}(XAUTUSDT)
$PAXG
{spot}(PAXGUSDT)
#NvidiaBoardReportedlySplitOverHuang’sReturn #CanGTA6'sLaunchLiftTTWOShares? #CryptoDawar #BlackRockBitcoinETFRecordsLargestDailyOutflow
#GOLD Analysis- 👀
As I mentioned, the correction wasn't over yet, and price dropped another 15% or so.😄
Both of our entries have been filled, and I expect a recovery from here. Make sure to reduce your risk at the average entry price and place an additional order one level lower, around 3,378.😀
$XAUT
$PAXG
#NvidiaBoardReportedlySplitOverHuang’sReturn #CanGTA6'sLaunchLiftTTWOShares? #CryptoDawar #BlackRockBitcoinETFRecordsLargestDailyOutflow
As I mentioned, the correction wasn't over yet, and price dropped another 15% or so.😄
Both of our entries have been filled, and I expect a recovery from here. Make sure to reduce your risk at the average entry price and place an additional order one level lower, around 3,378.😀
$XAUT
$PAXG
#NvidiaBoardReportedlySplitOverHuang’sReturn #CanGTA6'sLaunchLiftTTWOShares? #CryptoDawar #BlackRockBitcoinETFRecordsLargestDailyOutflow
Square-Creator-a7f1b97d08259fa7f97b:
obrigado !
4
2
1.4k

·
--
Partly True

Article
GOLD'S BIGGEST TEST OF THE YEAR IS HAPPENING RIGHT NOW.GOLD HAS LOST $593 IN 11 DAYS — AND $3,500 IS THE LAST DOOR BEFORE OPEN AIR
$PAXG is at $3,531 right now. Today's low is $3,513.55 — fourteen dollars above $3,500. Spot gold printed $3,551.68 this morning, its lowest since September 2025 (Reuters). Every hourly close since last night has printed lower. There has been no bounce. Not one.
Do the math: Nov 9 close was $4,123.50. $4,123.50 minus $3,530.74 is $592.76 gone in eleven days — 14.4%. From the January record of $5,602, gold is down 37%. This is the worst week in eight months (Reuters), down about 7% since Monday.
Here's the mechanism, and it's three things hitting at once. First, the Fed. The October minutes say nearly all officials expect further hikes. Waller floated 50bp. Chicago Fed's Goolsbee joined the chorus yesterday. The market now prices a December 25bp hike at 97.3% (CME FedWatch) — a hike is no longer a risk, it's the base case. Second, the dollar and yields: the 10-year sits near 5.09%, and gold pays nothing, so every day rates stay high is another day holding gold costs you. Third, forced selling: the AI stock rout is pushing investors to liquidate gold to cover losses (Reuters). Silver tells the same story — $121 to $44. This isn't gold-specific fear. It's everything being sold at once.
And here is the reframe: gold is not falling because the Fed hiked. The Fed hasn't hiked. Gold is falling because the market now believes the hiking era is not over — and gold's whole 2026 run, the record $5,602, was priced on the opposite bet. $5,602 was the price of expected cuts. $3,500 is the price of expected hikes.
My take is this. $3,500 is not a floor, it's a verdict. Hold it and the oversold bounce starts — first reclaim is $3,630. Lose it and there is open air underneath: Global X calls it an air pocket with very little support until $3,300–$3,400. The long-term bull case hasn't died — UBS still sees $4,500 by end of 2026 and $5,000 by end of 2027 — but that is a story for next year, not for this week. The next test is the Fed meeting on Dec 8–9: 25bp is priced in, 50bp is the shock that would take gold straight through $3,500.
Gold spent the year as the trade that couldn't lose. It is now the trade that can't find a floor — and $3,500 is where we find out whether this is a correction or a crash.
$PAXG $XAU
#GOLD #Fed
GOLD'S BIGGEST TEST OF THE YEAR IS HAPPENING RIGHT NOW.
GOLD HAS LOST $593 IN 11 DAYS — AND $3,500 IS THE LAST DOOR BEFORE OPEN AIR
$PAXG is at $3,531 right now. Today's low is $3,513.55 — fourteen dollars above $3,500. Spot gold printed $3,551.68 this morning, its lowest since September 2025 (Reuters). Every hourly close since last night has printed lower. There has been no bounce. Not one.
Do the math: Nov 9 close was $4,123.50. $4,123.50 minus $3,530.74 is $592.76 gone in eleven days — 14.4%. From the January record of $5,602, gold is down 37%. This is the worst week in eight months (Reuters), down about 7% since Monday.
Here's the mechanism, and it's three things hitting at once. First, the Fed. The October minutes say nearly all officials expect further hikes. Waller floated 50bp. Chicago Fed's Goolsbee joined the chorus yesterday. The market now prices a December 25bp hike at 97.3% (CME FedWatch) — a hike is no longer a risk, it's the base case. Second, the dollar and yields: the 10-year sits near 5.09%, and gold pays nothing, so every day rates stay high is another day holding gold costs you. Third, forced selling: the AI stock rout is pushing investors to liquidate gold to cover losses (Reuters). Silver tells the same story — $121 to $44. This isn't gold-specific fear. It's everything being sold at once.
And here is the reframe: gold is not falling because the Fed hiked. The Fed hasn't hiked. Gold is falling because the market now believes the hiking era is not over — and gold's whole 2026 run, the record $5,602, was priced on the opposite bet. $5,602 was the price of expected cuts. $3,500 is the price of expected hikes.
My take is this. $3,500 is not a floor, it's a verdict. Hold it and the oversold bounce starts — first reclaim is $3,630. Lose it and there is open air underneath: Global X calls it an air pocket with very little support until $3,300–$3,400. The long-term bull case hasn't died — UBS still sees $4,500 by end of 2026 and $5,000 by end of 2027 — but that is a story for next year, not for this week. The next test is the Fed meeting on Dec 8–9: 25bp is priced in, 50bp is the shock that would take gold straight through $3,500.
Gold spent the year as the trade that couldn't lose. It is now the trade that can't find a floor — and $3,500 is where we find out whether this is a correction or a crash.
$PAXG $XAU
#GOLD #Fed
$PAXG is at $3,531 right now. Today's low is $3,513.55 — fourteen dollars above $3,500. Spot gold printed $3,551.68 this morning, its lowest since September 2025 (Reuters). Every hourly close since last night has printed lower. There has been no bounce. Not one.
Do the math: Nov 9 close was $4,123.50. $4,123.50 minus $3,530.74 is $592.76 gone in eleven days — 14.4%. From the January record of $5,602, gold is down 37%. This is the worst week in eight months (Reuters), down about 7% since Monday.
Here's the mechanism, and it's three things hitting at once. First, the Fed. The October minutes say nearly all officials expect further hikes. Waller floated 50bp. Chicago Fed's Goolsbee joined the chorus yesterday. The market now prices a December 25bp hike at 97.3% (CME FedWatch) — a hike is no longer a risk, it's the base case. Second, the dollar and yields: the 10-year sits near 5.09%, and gold pays nothing, so every day rates stay high is another day holding gold costs you. Third, forced selling: the AI stock rout is pushing investors to liquidate gold to cover losses (Reuters). Silver tells the same story — $121 to $44. This isn't gold-specific fear. It's everything being sold at once.
And here is the reframe: gold is not falling because the Fed hiked. The Fed hasn't hiked. Gold is falling because the market now believes the hiking era is not over — and gold's whole 2026 run, the record $5,602, was priced on the opposite bet. $5,602 was the price of expected cuts. $3,500 is the price of expected hikes.
My take is this. $3,500 is not a floor, it's a verdict. Hold it and the oversold bounce starts — first reclaim is $3,630. Lose it and there is open air underneath: Global X calls it an air pocket with very little support until $3,300–$3,400. The long-term bull case hasn't died — UBS still sees $4,500 by end of 2026 and $5,000 by end of 2027 — but that is a story for next year, not for this week. The next test is the Fed meeting on Dec 8–9: 25bp is priced in, 50bp is the shock that would take gold straight through $3,500.
Gold spent the year as the trade that couldn't lose. It is now the trade that can't find a floor — and $3,500 is where we find out whether this is a correction or a crash.
$PAXG $XAU
#GOLD #Fed
3
1.2k


#GOLD BIG RECOVERY AHEAD?
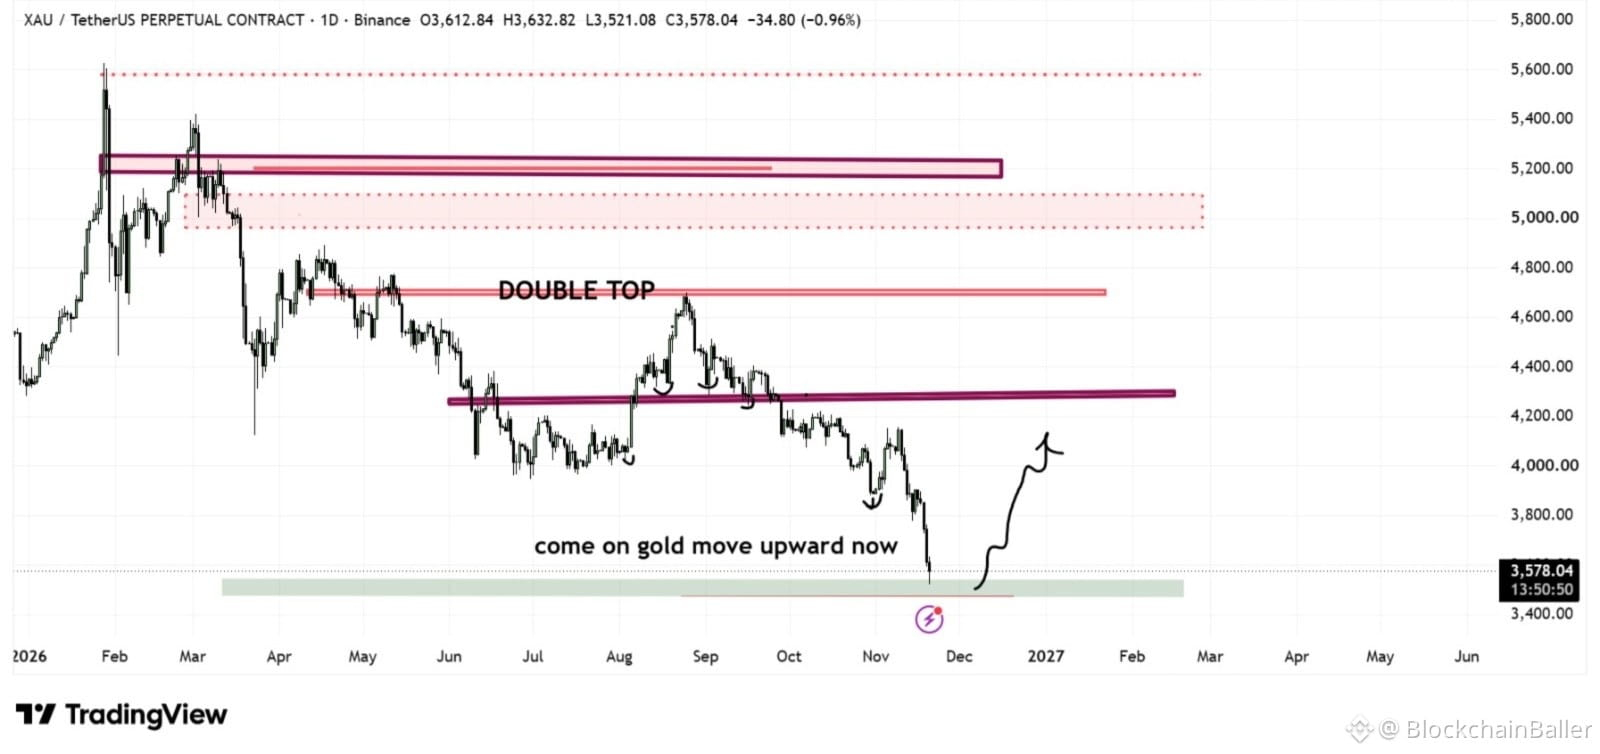
$XAU is dropping hard and now approaching a major demand zone around $3,500–$3,600.
I’m watching this area closely. If buyers step in and confirm a bounce, we could see gold recover toward $3,800, $4,000, and even $4,200.
But if this demand zone breaks, another drop could follow.
I'm watching for bullish confirmation before taking a long. Don't panic sell at the bottom!
#GOLD BIG RECOVERY AHEAD?
$XAU is dropping hard and now approaching a major demand zone around $3,500–$3,600.
I’m watching this area closely. If buyers step in and confirm a bounce, we could see gold recover toward $3,800, $4,000, and even $4,200.
But if this demand zone breaks, another drop could follow.
I'm watching for bullish confirmation before taking a long. Don't panic sell at the bottom!
$XAU is dropping hard and now approaching a major demand zone around $3,500–$3,600.
I’m watching this area closely. If buyers step in and confirm a bounce, we could see gold recover toward $3,800, $4,000, and even $4,200.
But if this demand zone breaks, another drop could follow.
I'm watching for bullish confirmation before taking a long. Don't panic sell at the bottom!
1
2.6k

Verified
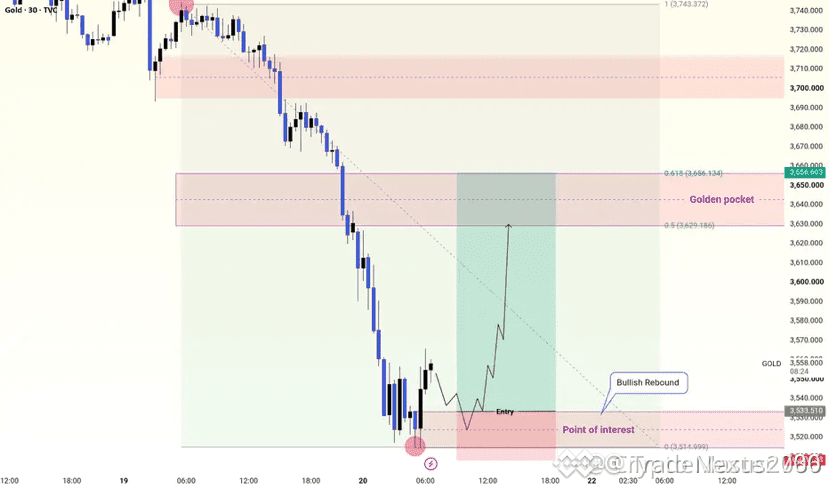
#GOLD at a Turning Point – Can Bulls Reclaim Control?
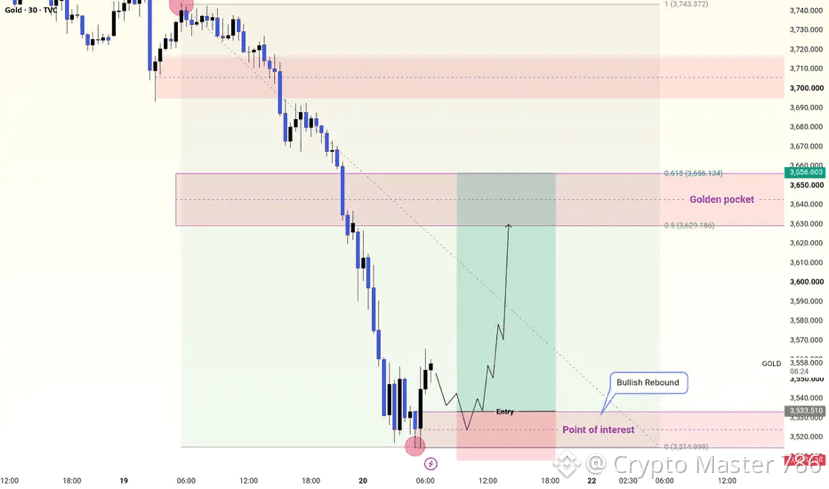
$XAU is testing a critical demand zone near $3,515–$3,535. A confirmed bullish rebound could open the door toward $3,629–$3,656.
What do you expect, traders?? Strong recovery or another drop???
#GOLD at a Turning Point – Can Bulls Reclaim Control?
$XAU is testing a critical demand zone near $3,515–$3,535. A confirmed bullish rebound could open the door toward $3,629–$3,656.
What do you expect, traders?? Strong recovery or another drop???
$XAU is testing a critical demand zone near $3,515–$3,535. A confirmed bullish rebound could open the door toward $3,629–$3,656.
What do you expect, traders?? Strong recovery or another drop???
Muhammad Tufail 77:
what abbout $evaa please reply
1
1
2
1.5k

·
--
Partly True

Article
WHY IS GOLD CRASHING? THE FED, STRONG DOLLAR AND THE $3,500 BATTLEGold is going through a serious correction, and the latest market data suggests that this is more than ordinary profit booking.
On November 20, gold touched an intraday low of $3,513.54 per ounce, while spot prices were reported at $3,576.09, down 1.3% in one Reuters market snapshot.
Gold is now heading towards its worst weekly performance in eight months, with an approximately 8% weekly decline.
But what is actually driving this selloff?
Let's break down the bigger picture.
1. The Federal Reserve has become the biggest problem for gold
One of the strongest reasons behind the current decline is changing expectations around US monetary policy.
Markets are increasingly expecting another interest-rate hike in December.
According to Reuters, traders were pricing in a 99.3% probability of a 25-basis-point rate increase.
This changes the investment equation.
Gold does not generate interest. When investors expect higher interest rates, bonds and other yield-generating assets become more attractive.
This creates additional selling pressure on gold.
2. The US Dollar is strengthening
The dollar has become another major headwind.
The US Dollar Index has been trading around its highest levels in approximately 19 months.
Since gold is priced internationally in dollars, a stronger dollar makes bullion more expensive for international buyers.
This can reduce demand and put additional pressure on prices.
The combination of a stronger dollar and hawkish Fed expectations is particularly negative for gold.
3. AI stock selloff is creating forced liquidation
There is another important factor that many traders might overlook.
The recent weakness in technology and AI-related stocks has increased volatility across global markets.
Some investors are selling profitable positions in other assets to cover losses and raise liquidity.
Gold is also getting caught in this selling pressure.
Normally, gold benefits from stock-market uncertainty. But during forced liquidation, even traditional safe-haven assets can decline.
This is one reason the current correction looks unusually aggressive.
4. Treasury yields remain an important factor
US Treasury yields have remained elevated around the 5% region.
Although the 10-year yield briefly slipped below 5% on Friday amid demand for government bonds, the broader interest-rate environment remains challenging for gold.
The important indicator here is real yields.
If real yields continue increasing, investors may prefer interest-bearing assets over gold.
5. Is institutional demand disappearing?
Not necessarily.
The current decline should not automatically be interpreted as the end of gold's long-term investment story.
Central-bank purchases, reserve diversification and investment demand remain important structural factors.
However, long-term demand cannot prevent short-term corrections when monetary policy expectations change rapidly.
The key distinction is between short-term market positioning and long-term fundamental demand.
6. Important price levels to watch
The recent intraday low around $3,513 is an important reference point.
Here are the areas I would monitor:
$3,500–$3,515: Recent low and psychological support zone.
$3,400: Potential downside observation area.
$3,300–$3,400: A deeper support region highlighted by market analysts.
$3,800: Important recovery area.
$3,900: A stronger bullish recovery would need to establish itself above this region.
These are observation zones, not guaranteed support or resistance levels.
A sustained breakdown below the recent low could extend the bearish structure.
On the other hand, a weaker dollar and declining real yields could create conditions for a recovery.
7. What happens next?
I see three possible scenarios.
Bearish scenario:
If the Federal Reserve maintains its hawkish position, the dollar remains strong and gold fails to recover broken levels, further downside remains possible.
Recovery scenario:
If inflation data starts cooling, rate-hike expectations decline and the dollar weakens, gold could experience a meaningful recovery.
Consolidation scenario:
If economic signals remain mixed, gold could consolidate while investors wait for fresh inflation data and Federal Reserve communication.
My Final View
I think the most important thing to understand is that gold is currently facing a monetary-policy problem.
The combination of higher-rate expectations, dollar strength and forced liquidation is outweighing safe-haven demand.
But I would not call this the complete breakdown of gold's long-term investment case.
For traders, the priority should be watching how price reacts around the recent lows rather than blindly buying because gold looks cheap.
A strong recovery in gold needs confirmation from both macroeconomic conditions and price action.
The real question is not simply how much further gold can fall. It is when the economic conditions that supported its previous rally will return.
What do you think: Is this the beginning of a deeper bearish trend, or is the market preparing for a major recovery?
#Gold #XAUUSD #FederalReserve
WHY IS GOLD CRASHING? THE FED, STRONG DOLLAR AND THE $3,500 BATTLE
Gold is going through a serious correction, and the latest market data suggests that this is more than ordinary profit booking.
On November 20, gold touched an intraday low of $3,513.54 per ounce, while spot prices were reported at $3,576.09, down 1.3% in one Reuters market snapshot.
Gold is now heading towards its worst weekly performance in eight months, with an approximately 8% weekly decline.
But what is actually driving this selloff?
Let's break down the bigger picture.
1. The Federal Reserve has become the biggest problem for gold
One of the strongest reasons behind the current decline is changing expectations around US monetary policy.
Markets are increasingly expecting another interest-rate hike in December.
According to Reuters, traders were pricing in a 99.3% probability of a 25-basis-point rate increase.
This changes the investment equation.
Gold does not generate interest. When investors expect higher interest rates, bonds and other yield-generating assets become more attractive.
This creates additional selling pressure on gold.
2. The US Dollar is strengthening
The dollar has become another major headwind.
The US Dollar Index has been trading around its highest levels in approximately 19 months.
Since gold is priced internationally in dollars, a stronger dollar makes bullion more expensive for international buyers.
This can reduce demand and put additional pressure on prices.
The combination of a stronger dollar and hawkish Fed expectations is particularly negative for gold.
3. AI stock selloff is creating forced liquidation
There is another important factor that many traders might overlook.
The recent weakness in technology and AI-related stocks has increased volatility across global markets.
Some investors are selling profitable positions in other assets to cover losses and raise liquidity.
Gold is also getting caught in this selling pressure.
Normally, gold benefits from stock-market uncertainty. But during forced liquidation, even traditional safe-haven assets can decline.
This is one reason the current correction looks unusually aggressive.
4. Treasury yields remain an important factor
US Treasury yields have remained elevated around the 5% region.
Although the 10-year yield briefly slipped below 5% on Friday amid demand for government bonds, the broader interest-rate environment remains challenging for gold.
The important indicator here is real yields.
If real yields continue increasing, investors may prefer interest-bearing assets over gold.
5. Is institutional demand disappearing?
Not necessarily.
The current decline should not automatically be interpreted as the end of gold's long-term investment story.
Central-bank purchases, reserve diversification and investment demand remain important structural factors.
However, long-term demand cannot prevent short-term corrections when monetary policy expectations change rapidly.
The key distinction is between short-term market positioning and long-term fundamental demand.
6. Important price levels to watch
The recent intraday low around $3,513 is an important reference point.
Here are the areas I would monitor:
$3,500–$3,515: Recent low and psychological support zone.
$3,400: Potential downside observation area.
$3,300–$3,400: A deeper support region highlighted by market analysts.
$3,800: Important recovery area.
$3,900: A stronger bullish recovery would need to establish itself above this region.
These are observation zones, not guaranteed support or resistance levels.
A sustained breakdown below the recent low could extend the bearish structure.
On the other hand, a weaker dollar and declining real yields could create conditions for a recovery.
7. What happens next?
I see three possible scenarios.
Bearish scenario:
If the Federal Reserve maintains its hawkish position, the dollar remains strong and gold fails to recover broken levels, further downside remains possible.
Recovery scenario:
If inflation data starts cooling, rate-hike expectations decline and the dollar weakens, gold could experience a meaningful recovery.
Consolidation scenario:
If economic signals remain mixed, gold could consolidate while investors wait for fresh inflation data and Federal Reserve communication.
My Final View
I think the most important thing to understand is that gold is currently facing a monetary-policy problem.
The combination of higher-rate expectations, dollar strength and forced liquidation is outweighing safe-haven demand.
But I would not call this the complete breakdown of gold's long-term investment case.
For traders, the priority should be watching how price reacts around the recent lows rather than blindly buying because gold looks cheap.
A strong recovery in gold needs confirmation from both macroeconomic conditions and price action.
The real question is not simply how much further gold can fall. It is when the economic conditions that supported its previous rally will return.
What do you think: Is this the beginning of a deeper bearish trend, or is the market preparing for a major recovery?
#Gold #XAUUSD #FederalReserve
On November 20, gold touched an intraday low of $3,513.54 per ounce, while spot prices were reported at $3,576.09, down 1.3% in one Reuters market snapshot.
Gold is now heading towards its worst weekly performance in eight months, with an approximately 8% weekly decline.
But what is actually driving this selloff?
Let's break down the bigger picture.
1. The Federal Reserve has become the biggest problem for gold
One of the strongest reasons behind the current decline is changing expectations around US monetary policy.
Markets are increasingly expecting another interest-rate hike in December.
According to Reuters, traders were pricing in a 99.3% probability of a 25-basis-point rate increase.
This changes the investment equation.
Gold does not generate interest. When investors expect higher interest rates, bonds and other yield-generating assets become more attractive.
This creates additional selling pressure on gold.
2. The US Dollar is strengthening
The dollar has become another major headwind.
The US Dollar Index has been trading around its highest levels in approximately 19 months.
Since gold is priced internationally in dollars, a stronger dollar makes bullion more expensive for international buyers.
This can reduce demand and put additional pressure on prices.
The combination of a stronger dollar and hawkish Fed expectations is particularly negative for gold.
3. AI stock selloff is creating forced liquidation
There is another important factor that many traders might overlook.
The recent weakness in technology and AI-related stocks has increased volatility across global markets.
Some investors are selling profitable positions in other assets to cover losses and raise liquidity.
Gold is also getting caught in this selling pressure.
Normally, gold benefits from stock-market uncertainty. But during forced liquidation, even traditional safe-haven assets can decline.
This is one reason the current correction looks unusually aggressive.
4. Treasury yields remain an important factor
US Treasury yields have remained elevated around the 5% region.
Although the 10-year yield briefly slipped below 5% on Friday amid demand for government bonds, the broader interest-rate environment remains challenging for gold.
The important indicator here is real yields.
If real yields continue increasing, investors may prefer interest-bearing assets over gold.
5. Is institutional demand disappearing?
Not necessarily.
The current decline should not automatically be interpreted as the end of gold's long-term investment story.
Central-bank purchases, reserve diversification and investment demand remain important structural factors.
However, long-term demand cannot prevent short-term corrections when monetary policy expectations change rapidly.
The key distinction is between short-term market positioning and long-term fundamental demand.
6. Important price levels to watch
The recent intraday low around $3,513 is an important reference point.
Here are the areas I would monitor:
$3,500–$3,515: Recent low and psychological support zone.
$3,400: Potential downside observation area.
$3,300–$3,400: A deeper support region highlighted by market analysts.
$3,800: Important recovery area.
$3,900: A stronger bullish recovery would need to establish itself above this region.
These are observation zones, not guaranteed support or resistance levels.
A sustained breakdown below the recent low could extend the bearish structure.
On the other hand, a weaker dollar and declining real yields could create conditions for a recovery.
7. What happens next?
I see three possible scenarios.
Bearish scenario:
If the Federal Reserve maintains its hawkish position, the dollar remains strong and gold fails to recover broken levels, further downside remains possible.
Recovery scenario:
If inflation data starts cooling, rate-hike expectations decline and the dollar weakens, gold could experience a meaningful recovery.
Consolidation scenario:
If economic signals remain mixed, gold could consolidate while investors wait for fresh inflation data and Federal Reserve communication.
My Final View
I think the most important thing to understand is that gold is currently facing a monetary-policy problem.
The combination of higher-rate expectations, dollar strength and forced liquidation is outweighing safe-haven demand.
But I would not call this the complete breakdown of gold's long-term investment case.
For traders, the priority should be watching how price reacts around the recent lows rather than blindly buying because gold looks cheap.
A strong recovery in gold needs confirmation from both macroeconomic conditions and price action.
The real question is not simply how much further gold can fall. It is when the economic conditions that supported its previous rally will return.
What do you think: Is this the beginning of a deeper bearish trend, or is the market preparing for a major recovery?
#Gold #XAUUSD #FederalReserve
1
844

·
--
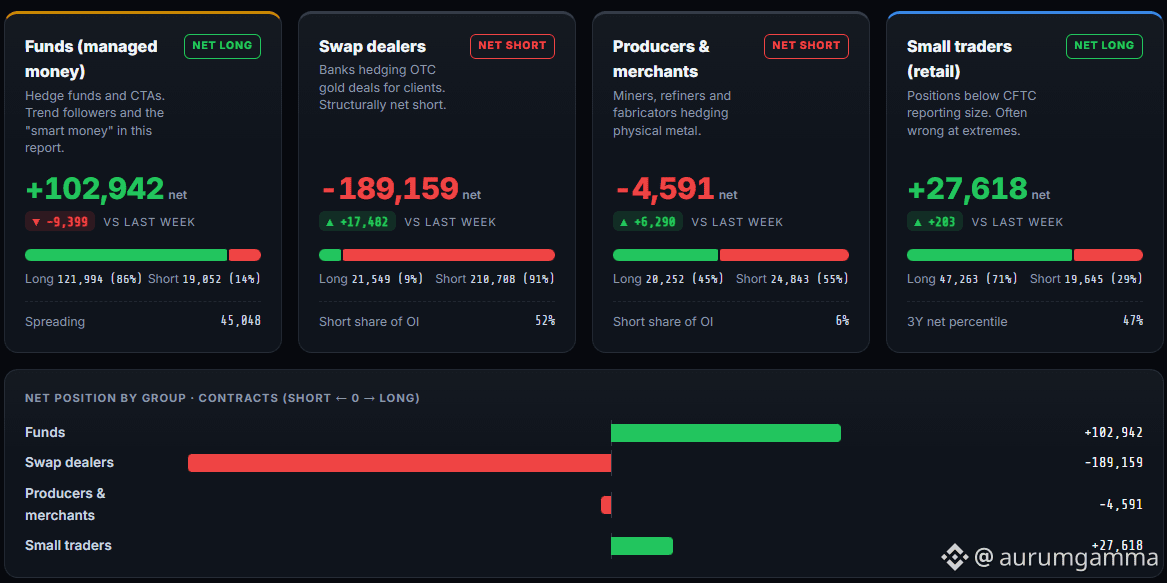
Gold COT report, week of Nov 17:
Managed money net long 102,942 (−9,399 w/w): 121,994 long / 19,052 short
Commercials net −193,750 (from −217,522)
Open interest 407,834 (+3,109)
Our COT model reads 22.3/100 (Very Bearish).
Positioning data from the CFTC, not a forecast.
aurumgamma.cloud/cot/?utm_source=binance_square&utm_medium=social&utm_campaign=cot_weekly
$XAU $XAUT #GOLD #XAUUSD #COT
Gold COT report, week of Nov 17:
Managed money net long 102,942 (−9,399 w/w): 121,994 long / 19,052 short
Commercials net −193,750 (from −217,522)
Open interest 407,834 (+3,109)
Our COT model reads 22.3/100 (Very Bearish).
Positioning data from the CFTC, not a forecast.
aurumgamma.cloud/cot/?utm_source=binance_square&utm_medium=social&utm_campaign=cot_weekly
$XAU $XAUT #GOLD #XAUUSD #COT
Managed money net long 102,942 (−9,399 w/w): 121,994 long / 19,052 short
Commercials net −193,750 (from −217,522)
Open interest 407,834 (+3,109)
Our COT model reads 22.3/100 (Very Bearish).
Positioning data from the CFTC, not a forecast.
aurumgamma.cloud/cot/?utm_source=binance_square&utm_medium=social&utm_campaign=cot_weekly
$XAU $XAUT #GOLD #XAUUSD #COT
412

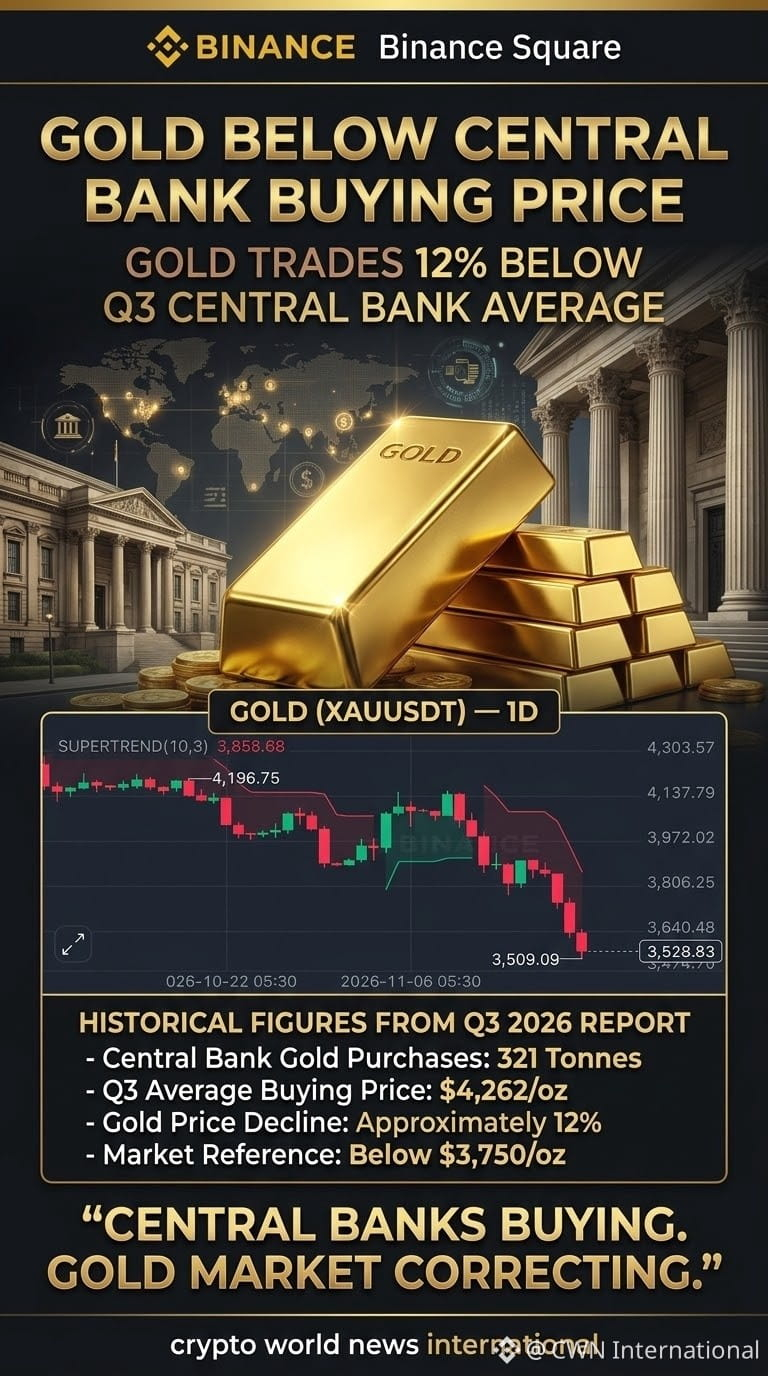
Headline: Gold Falls 12% Below Central Banks' Buying Price — Is This a Buying Opportunity?
Summary:
Gold prices have dropped below $3,750 per ounce, approximately 12% below the $4,262 average price at which central banks accumulated gold during Q3 2026. Despite strong official-sector buying, rising real yields and a stronger US dollar are putting pressure on precious metals.
Key Points:
- Central banks purchased approximately 321 tonnes of gold in Q3 2026.
- Their average gold buying price during the quarter was approximately $4,262 per ounce.
- Gold futures fell below $3,750, reaching their lowest level since September 2025.
- The current price represents an approximately 12% decline from the Q3 average.
- Higher real yields and a stronger US dollar are creating short-term pressure on gold.
- The December 9 Federal Reserve meeting could influence the next move in precious metals.
- Silver is also declining, but its industrial demand creates additional price volatility.
Market Insight:
The gold market is facing an interesting contrast: central banks continue to accumulate gold for long-term reserve diversification, while private investors are dealing with short-term price weakness.
If interest-rate expectations become more favorable, precious metals could regain momentum. However, further monetary tightening or continued dollar strength could extend the decline.
The key question is whether the current correction represents a temporary setback or the beginning of a deeper gold-market adjustment.
#GOLD #CentralBanks #Silver #GoldMarket #PostonTradFi $PAXG $XAG $XAU
{future}(XAUUSDT)
{future}(XAGUSDT)
{future}(PAXGUSDT)
Headline: Gold Falls 12% Below Central Banks' Buying Price — Is This a Buying Opportunity?
Summary:
Gold prices have dropped below $3,750 per ounce, approximately 12% below the $4,262 average price at which central banks accumulated gold during Q3 2026. Despite strong official-sector buying, rising real yields and a stronger US dollar are putting pressure on precious metals.
Key Points:
- Central banks purchased approximately 321 tonnes of gold in Q3 2026.
- Their average gold buying price during the quarter was approximately $4,262 per ounce.
- Gold futures fell below $3,750, reaching their lowest level since September 2025.
- The current price represents an approximately 12% decline from the Q3 average.
- Higher real yields and a stronger US dollar are creating short-term pressure on gold.
- The December 9 Federal Reserve meeting could influence the next move in precious metals.
- Silver is also declining, but its industrial demand creates additional price volatility.
Market Insight:
The gold market is facing an interesting contrast: central banks continue to accumulate gold for long-term reserve diversification, while private investors are dealing with short-term price weakness.
If interest-rate expectations become more favorable, precious metals could regain momentum. However, further monetary tightening or continued dollar strength could extend the decline.
The key question is whether the current correction represents a temporary setback or the beginning of a deeper gold-market adjustment.
#GOLD #CentralBanks #Silver #GoldMarket #PostonTradFi $PAXG $XAG $XAU
Summary:
Gold prices have dropped below $3,750 per ounce, approximately 12% below the $4,262 average price at which central banks accumulated gold during Q3 2026. Despite strong official-sector buying, rising real yields and a stronger US dollar are putting pressure on precious metals.
Key Points:
- Central banks purchased approximately 321 tonnes of gold in Q3 2026.
- Their average gold buying price during the quarter was approximately $4,262 per ounce.
- Gold futures fell below $3,750, reaching their lowest level since September 2025.
- The current price represents an approximately 12% decline from the Q3 average.
- Higher real yields and a stronger US dollar are creating short-term pressure on gold.
- The December 9 Federal Reserve meeting could influence the next move in precious metals.
- Silver is also declining, but its industrial demand creates additional price volatility.
Market Insight:
The gold market is facing an interesting contrast: central banks continue to accumulate gold for long-term reserve diversification, while private investors are dealing with short-term price weakness.
If interest-rate expectations become more favorable, precious metals could regain momentum. However, further monetary tightening or continued dollar strength could extend the decline.
The key question is whether the current correction represents a temporary setback or the beginning of a deeper gold-market adjustment.
#GOLD #CentralBanks #Silver #GoldMarket #PostonTradFi $PAXG $XAG $XAU
527

·
--
Bearish
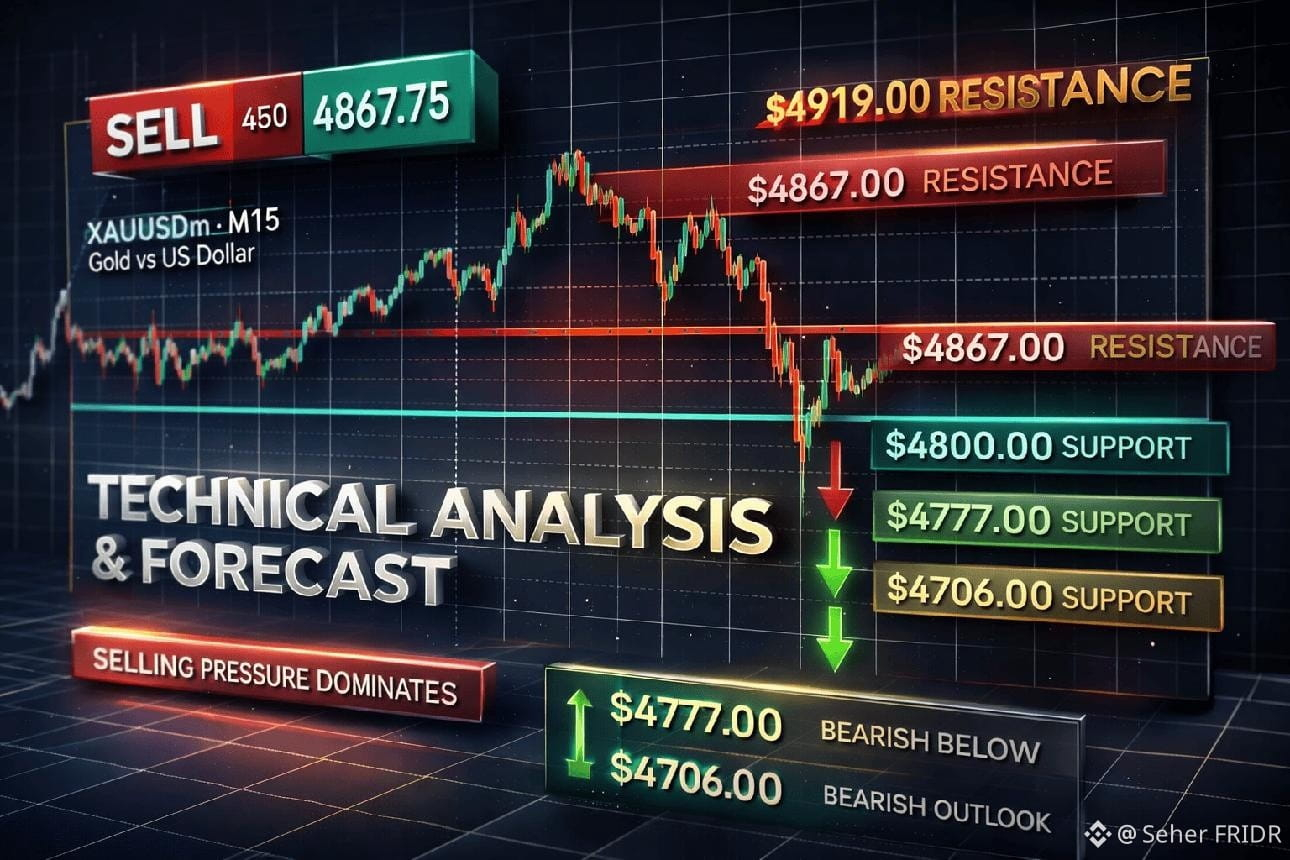
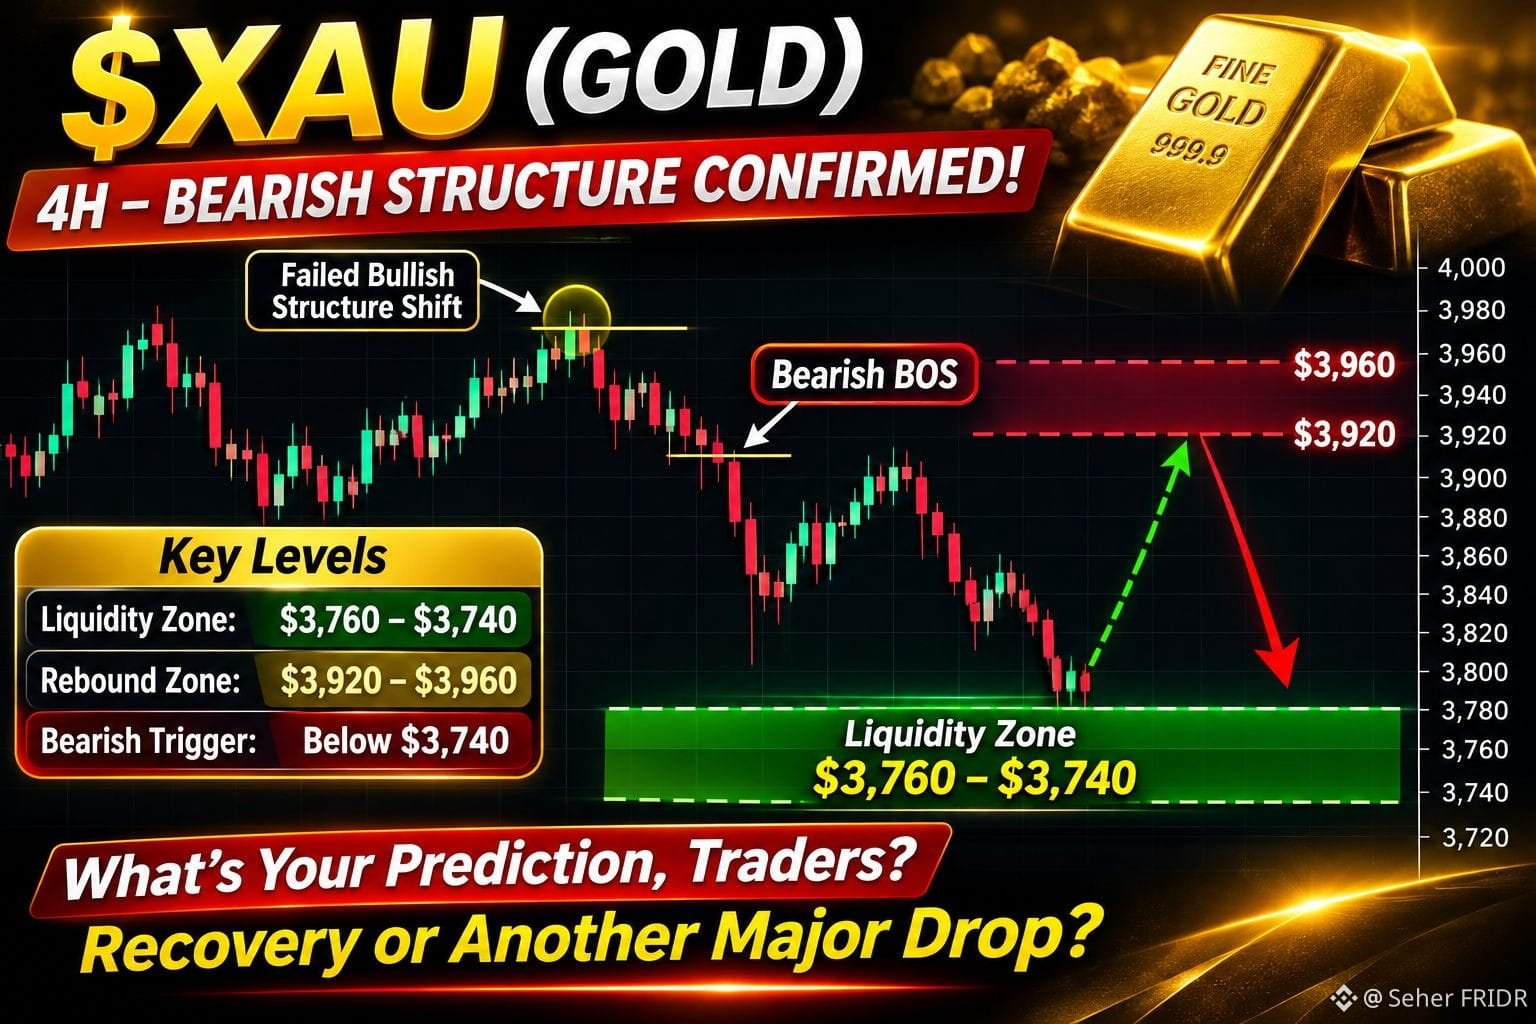
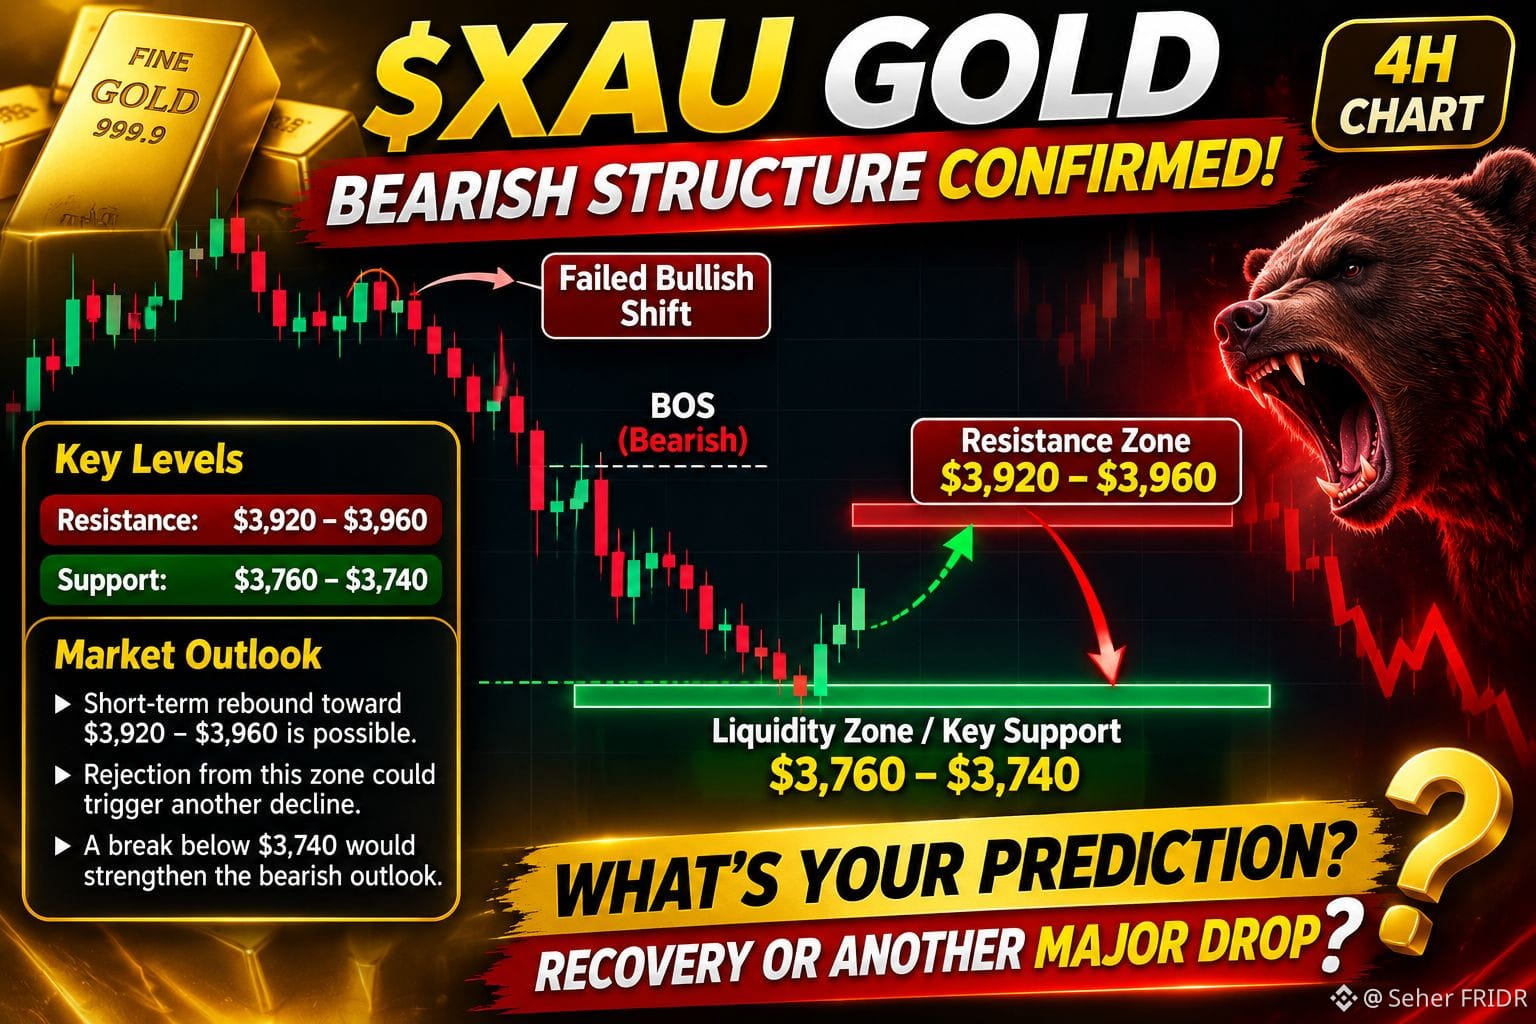
$XAU GOLD BEARS ARE TAKING CONTROL!**
Gold remains under bearish pressure after a failed bullish breakout and bearish BOS on the 4H chart.
Key liquidity zone: $3,760–$3,740.
A short-term bounce toward $3,920–$3,960 is possible, but rejection could trigger another sell-off. A break below $3,740 would strengthen the bearish outlook.
📉 **Will GOLD recover or face another major drop?**
#XAU #GOLD #Trading #Crypto
{future}(XAUUSDT)
$XAU GOLD BEARS ARE TAKING CONTROL!**
Gold remains under bearish pressure after a failed bullish breakout and bearish BOS on the 4H chart.
Key liquidity zone: $3,760–$3,740.
A short-term bounce toward $3,920–$3,960 is possible, but rejection could trigger another sell-off. A break below $3,740 would strengthen the bearish outlook.
📉 **Will GOLD recover or face another major drop?**
#XAU #GOLD #Trading #Crypto
Gold remains under bearish pressure after a failed bullish breakout and bearish BOS on the 4H chart.
Key liquidity zone: $3,760–$3,740.
A short-term bounce toward $3,920–$3,960 is possible, but rejection could trigger another sell-off. A break below $3,740 would strengthen the bearish outlook.
📉 **Will GOLD recover or face another major drop?**
#XAU #GOLD #Trading #Crypto

Xing về bờ:
Kh biết đâu là đáy, vàng mà nó xã như coin rác , chạy giá mà sợ luôn
2
300

·
--
Bearish
30D trade $XAU 5.7K USDT
$XAU
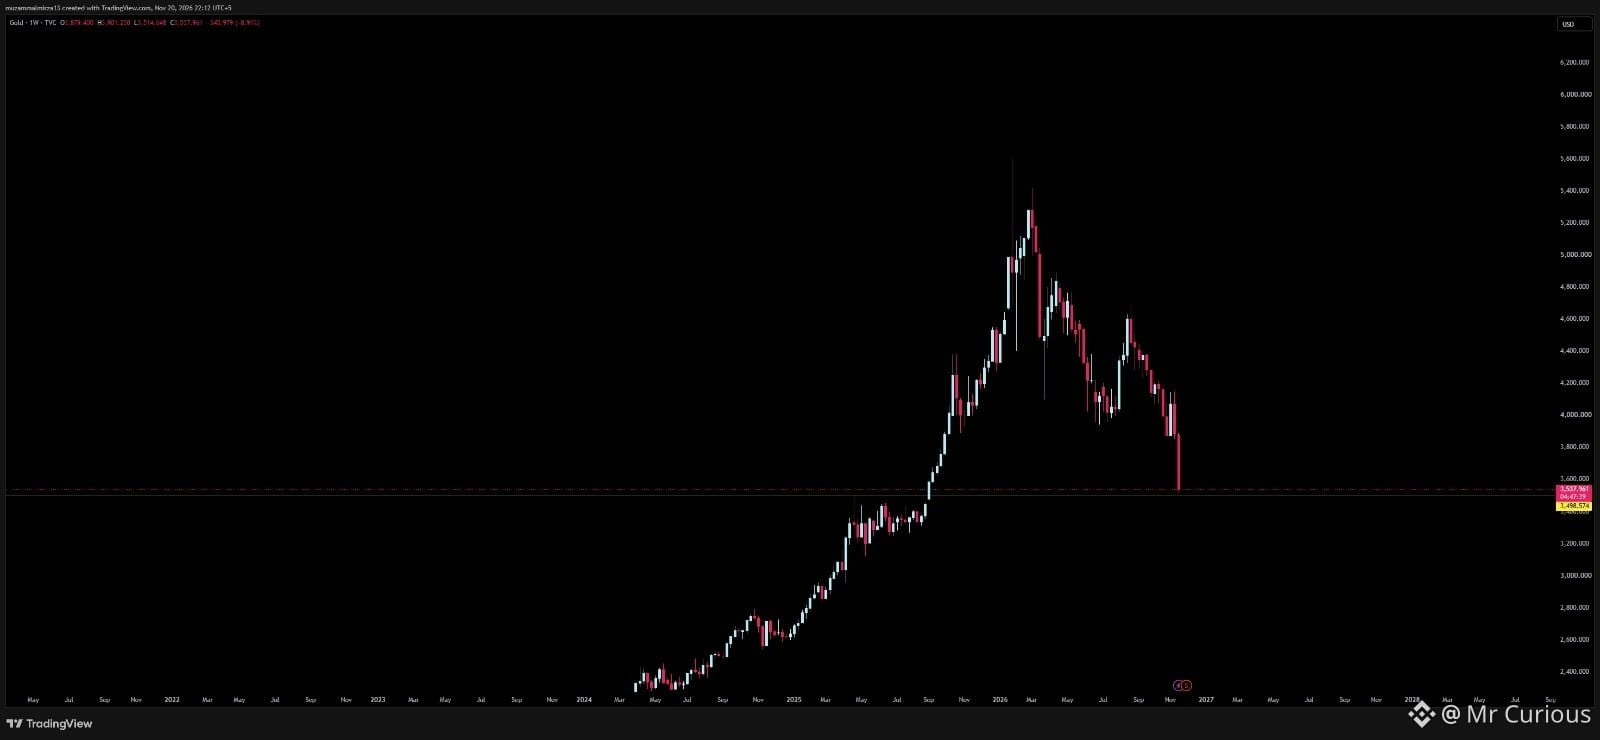
#GOLD — $3,500 IS THE KEY LEVEL‼️
I’ve highlighted $3,500 as a critical level for Gold before, and it remains an important support zone.
Gold should ideally avoid closing a monthly candle below $3,500. If that happens, we could see further downside toward the $2,800–$3,000 range.
For now, $3,500 is the key support level I’m keeping an eye on.
Trade with proper risk management.
{future}(XAUUSDT)
$XAU
#GOLD — $3,500 IS THE KEY LEVEL‼️
I’ve highlighted $3,500 as a critical level for Gold before, and it remains an important support zone.
Gold should ideally avoid closing a monthly candle below $3,500. If that happens, we could see further downside toward the $2,800–$3,000 range.
For now, $3,500 is the key support level I’m keeping an eye on.
Trade with proper risk management.
#GOLD — $3,500 IS THE KEY LEVEL‼️
I’ve highlighted $3,500 as a critical level for Gold before, and it remains an important support zone.
Gold should ideally avoid closing a monthly candle below $3,500. If that happens, we could see further downside toward the $2,800–$3,000 range.
For now, $3,500 is the key support level I’m keeping an eye on.
Trade with proper risk management.
2
506

·
--
Partly True
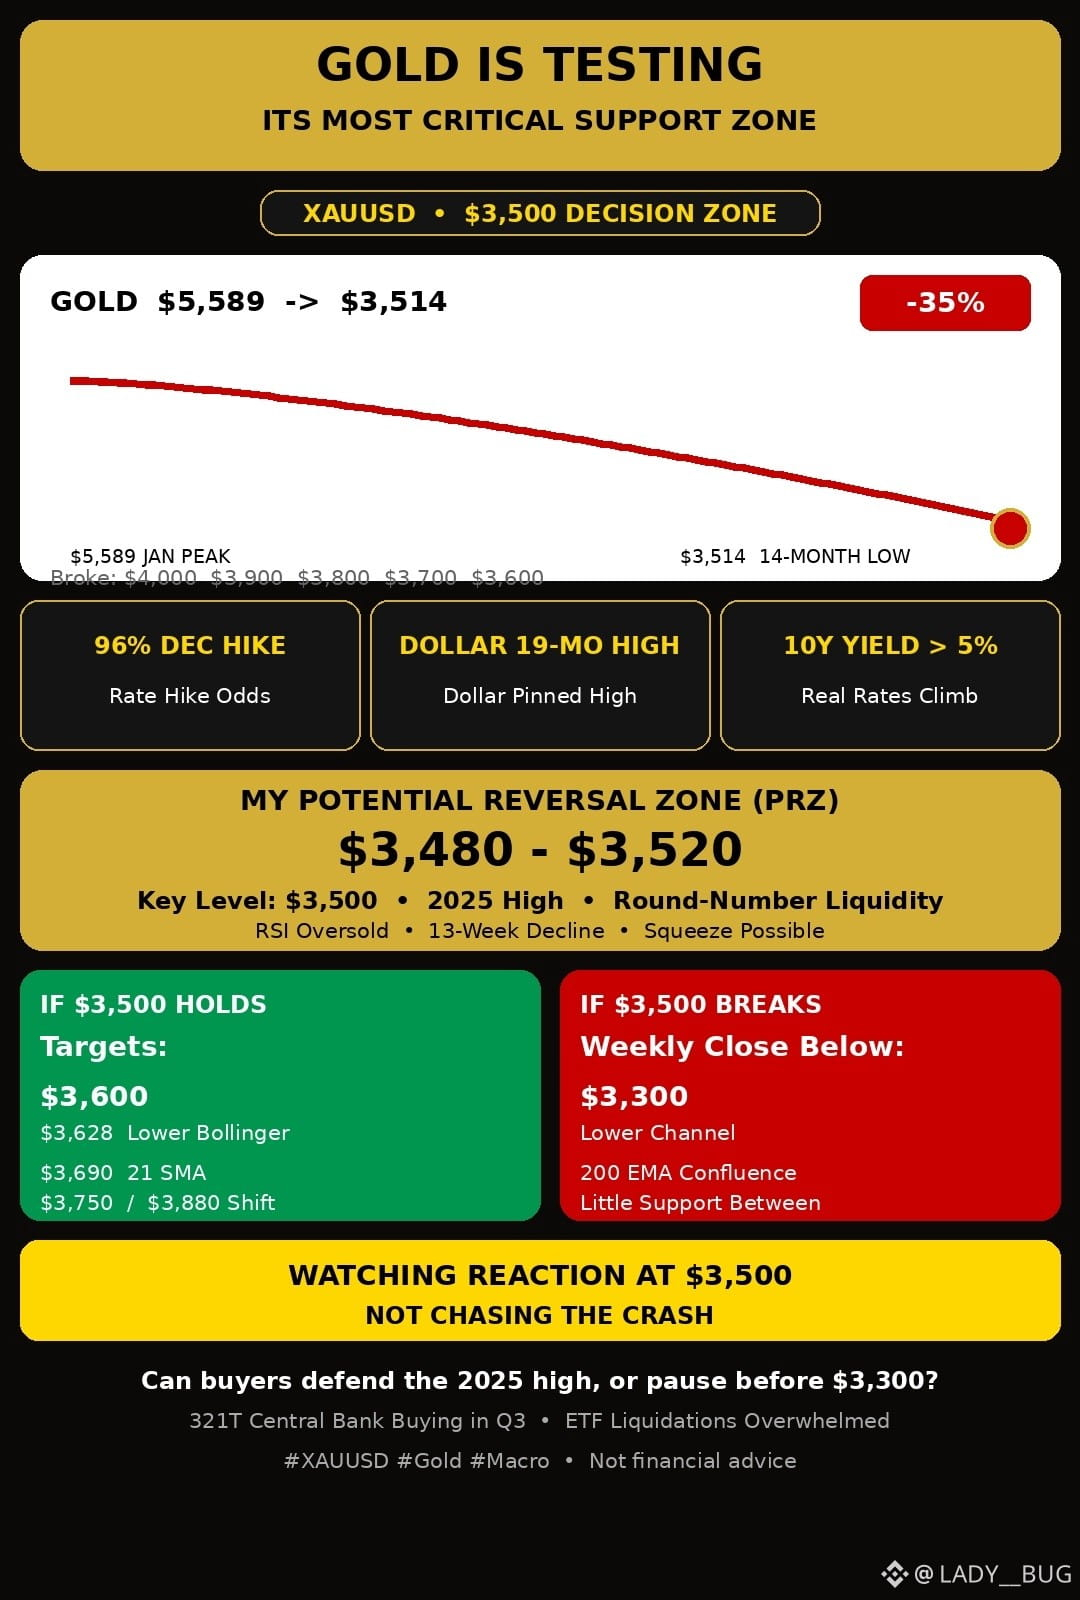
🥇 Gold at $3,500: Last Line of Defense Before $3,300? 🚨Gold Is Testing Its Most Critical Support Zone
$XAU USD has collapsed over 35% from its January peak of $5,589 to a 14-month low of $3,514.
The pressure is macro-driven: markets price a 96% probability of a December rate hike, the dollar sits near a 19-month high, and the 10-year yield holds above 5%. Gold pays no yield, so rising real rates make the opportunity cost unbearable. ETF liquidations have overwhelmed central bank buying, and forced selling from equity margin calls is amplifying the downside.
Technically, gold is entering its most consequential decision zone of the year.
My Potential Reversal Zone (PRZ) sits around ($3,480–$3,520), anchored by the $3,500 psychological level, which also aligns with the 2025 high and a major liquidity pocket. The descending channel’s lower boundary converges near $3,300, coinciding with the 200-period EMA.
The key level I’m watching is $3,500.
Despite bearish momentum, I believe this area could trigger at least a temporary relief rally. A 13-week decline of this magnitude is historically prone to violent counter-trend squeezes.
If buyers defend $3,500, my first targets are $3,600 and $3,628 (lower Bollinger Band). A stronger recovery could extend toward $3,690 (21 SMA) and $3,750. A break above $3,880 would be the first real sign of a structural shift.
But if $3,500 breaks decisively on a weekly close, the bullish recovery scenario dies. That opens the door to $3,300 and the lower channel boundary, with little meaningful support in between.
U.S. equities remain another wildcard. If tech stocks continue selling off and margin calls accelerate, gold could face another wave of forced liquidation.
For now, I’m watching for a reaction around $3,500 rather than chasing the crash.
Can buyers finally defend the 2025 high, or is this just a pause before $3,300?
$XAUT
{future}(XAUTUSDT)
#gold
🥇 Gold at $3,500: Last Line of Defense Before $3,300? 🚨Gold Is Testing Its Most Critical Support Zone
$XAU USD has collapsed over 35% from its January peak of $5,589 to a 14-month low of $3,514.
The pressure is macro-driven: markets price a 96% probability of a December rate hike, the dollar sits near a 19-month high, and the 10-year yield holds above 5%. Gold pays no yield, so rising real rates make the opportunity cost unbearable. ETF liquidations have overwhelmed central bank buying, and forced selling from equity margin calls is amplifying the downside.
Technically, gold is entering its most consequential decision zone of the year.
My Potential Reversal Zone (PRZ) sits around ($3,480–$3,520), anchored by the $3,500 psychological level, which also aligns with the 2025 high and a major liquidity pocket. The descending channel’s lower boundary converges near $3,300, coinciding with the 200-period EMA.
The key level I’m watching is $3,500.
Despite bearish momentum, I believe this area could trigger at least a temporary relief rally. A 13-week decline of this magnitude is historically prone to violent counter-trend squeezes.
If buyers defend $3,500, my first targets are $3,600 and $3,628 (lower Bollinger Band). A stronger recovery could extend toward $3,690 (21 SMA) and $3,750. A break above $3,880 would be the first real sign of a structural shift.
But if $3,500 breaks decisively on a weekly close, the bullish recovery scenario dies. That opens the door to $3,300 and the lower channel boundary, with little meaningful support in between.
U.S. equities remain another wildcard. If tech stocks continue selling off and margin calls accelerate, gold could face another wave of forced liquidation.
For now, I’m watching for a reaction around $3,500 rather than chasing the crash.
Can buyers finally defend the 2025 high, or is this just a pause before $3,300?
$XAUT
#gold
$XAU USD has collapsed over 35% from its January peak of $5,589 to a 14-month low of $3,514.
The pressure is macro-driven: markets price a 96% probability of a December rate hike, the dollar sits near a 19-month high, and the 10-year yield holds above 5%. Gold pays no yield, so rising real rates make the opportunity cost unbearable. ETF liquidations have overwhelmed central bank buying, and forced selling from equity margin calls is amplifying the downside.
Technically, gold is entering its most consequential decision zone of the year.
My Potential Reversal Zone (PRZ) sits around ($3,480–$3,520), anchored by the $3,500 psychological level, which also aligns with the 2025 high and a major liquidity pocket. The descending channel’s lower boundary converges near $3,300, coinciding with the 200-period EMA.
The key level I’m watching is $3,500.
Despite bearish momentum, I believe this area could trigger at least a temporary relief rally. A 13-week decline of this magnitude is historically prone to violent counter-trend squeezes.
If buyers defend $3,500, my first targets are $3,600 and $3,628 (lower Bollinger Band). A stronger recovery could extend toward $3,690 (21 SMA) and $3,750. A break above $3,880 would be the first real sign of a structural shift.
But if $3,500 breaks decisively on a weekly close, the bullish recovery scenario dies. That opens the door to $3,300 and the lower channel boundary, with little meaningful support in between.
U.S. equities remain another wildcard. If tech stocks continue selling off and margin calls accelerate, gold could face another wave of forced liquidation.
For now, I’m watching for a reaction around $3,500 rather than chasing the crash.
Can buyers finally defend the 2025 high, or is this just a pause before $3,300?
$XAUT
#gold
18

·
--
🚨 I WILL NEVER MISS THIS OPPORTUNITY OF BUYING GOLD IN THIS DIP BECAUSE I KNOW IT NEVER FALLS TOO MUCH🚀
I am collecting and filling my bags💰 of $XAU and $XAUT 📈🔥
Whats your plan,are you also thing like me?
$PAXG
{future}(PAXGUSDT)
{future}(XAUTUSDT)
{future}(XAUUSDT)
#xau #GOLD
🚨 I WILL NEVER MISS THIS OPPORTUNITY OF BUYING GOLD IN THIS DIP BECAUSE I KNOW IT NEVER FALLS TOO MUCH🚀
I am collecting and filling my bags💰 of $XAU and $XAUT 📈🔥
Whats your plan,are you also thing like me?
$PAXG
#xau #GOLD
I am collecting and filling my bags💰 of $XAU and $XAUT 📈🔥
Whats your plan,are you also thing like me?
$PAXG
#xau #GOLD
284

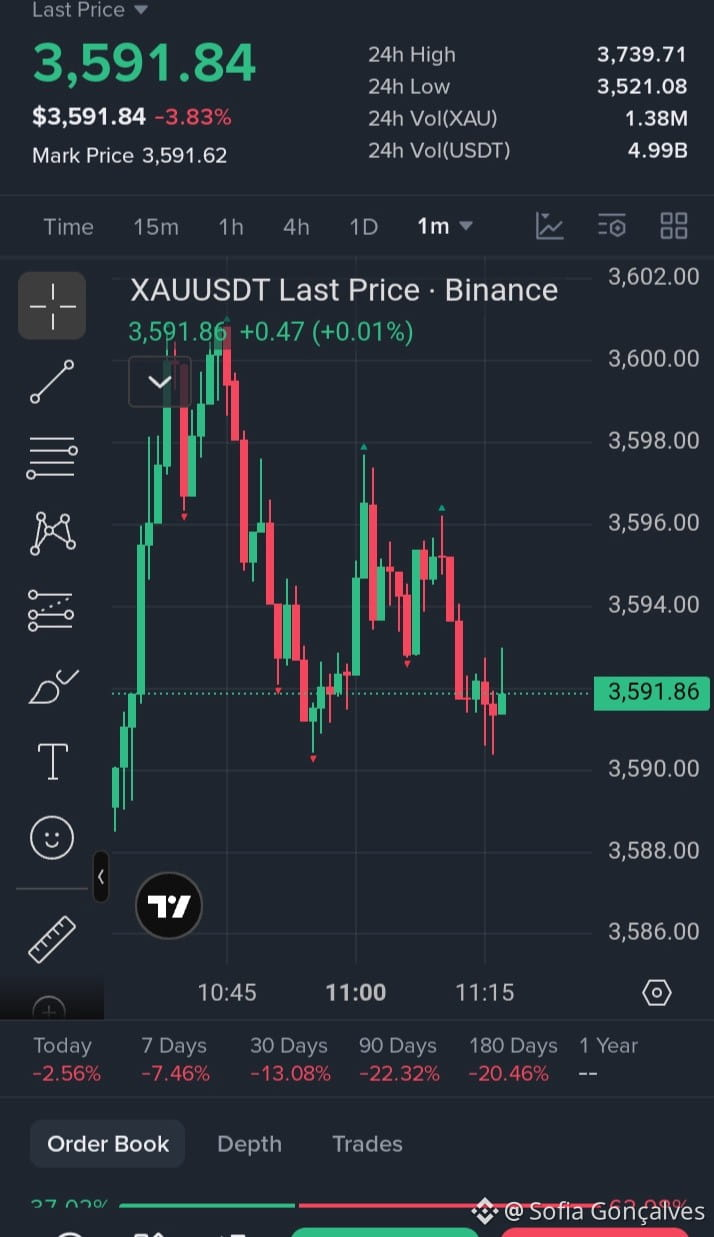

Treasury yields and a surging USD are crushing precious metals this week. Spot gold sits at $3,552/oz on Nov 20, plunging 8.5% and heading for its worst weekly drop since March, while silver bleeds 14% to $42/oz. Fed rate hike bets and AI stock liquidations are fueling the carnage.
Are you buying this metal dip or staying in cash?
#Gold #Silver #Fed #Macro #BinanceSquare
Treasury yields and a surging USD are crushing precious metals this week. Spot gold sits at $3,552/oz on Nov 20, plunging 8.5% and heading for its worst weekly drop since March, while silver bleeds 14% to $42/oz. Fed rate hike bets and AI stock liquidations are fueling the carnage.
Are you buying this metal dip or staying in cash?
#Gold #Silver #Fed #Macro #BinanceSquare
Are you buying this metal dip or staying in cash?
#Gold #Silver #Fed #Macro #BinanceSquare

20

·
--
🚨 GOLD IS BLEEDING… BUT SMART MONEY IS WATCHING! 🥇🔥
Is this the dip before the next massive GOLD rally, or the beginning of a deeper correction?
$PAXG brings physical gold exposure into the crypto world, making every major gold move worth watching.
📊 The big battle is between buyers defending support and sellers pushing for more downside.
👀 One question for the community:
ARE YOU BUYING THE DIP OR WAITING FOR A BIGGER CRASH? 👇
Let’s hear your prediction! 🚀
#PAXG #PAXGold #GOLD #cryptotrading #Binance
{spot}(PAXGUSDT)
🚨 GOLD IS BLEEDING… BUT SMART MONEY IS WATCHING! 🥇🔥
Is this the dip before the next massive GOLD rally, or the beginning of a deeper correction?
$PAXG brings physical gold exposure into the crypto world, making every major gold move worth watching.
📊 The big battle is between buyers defending support and sellers pushing for more downside.
👀 One question for the community:
ARE YOU BUYING THE DIP OR WAITING FOR A BIGGER CRASH? 👇
Let’s hear your prediction! 🚀
#PAXG #PAXGold #GOLD #cryptotrading #Binance
Is this the dip before the next massive GOLD rally, or the beginning of a deeper correction?
$PAXG brings physical gold exposure into the crypto world, making every major gold move worth watching.
📊 The big battle is between buyers defending support and sellers pushing for more downside.
👀 One question for the community:
ARE YOU BUYING THE DIP OR WAITING FOR A BIGGER CRASH? 👇
Let’s hear your prediction! 🚀
#PAXG #PAXGold #GOLD #cryptotrading #Binance

356

·
--
Bullish
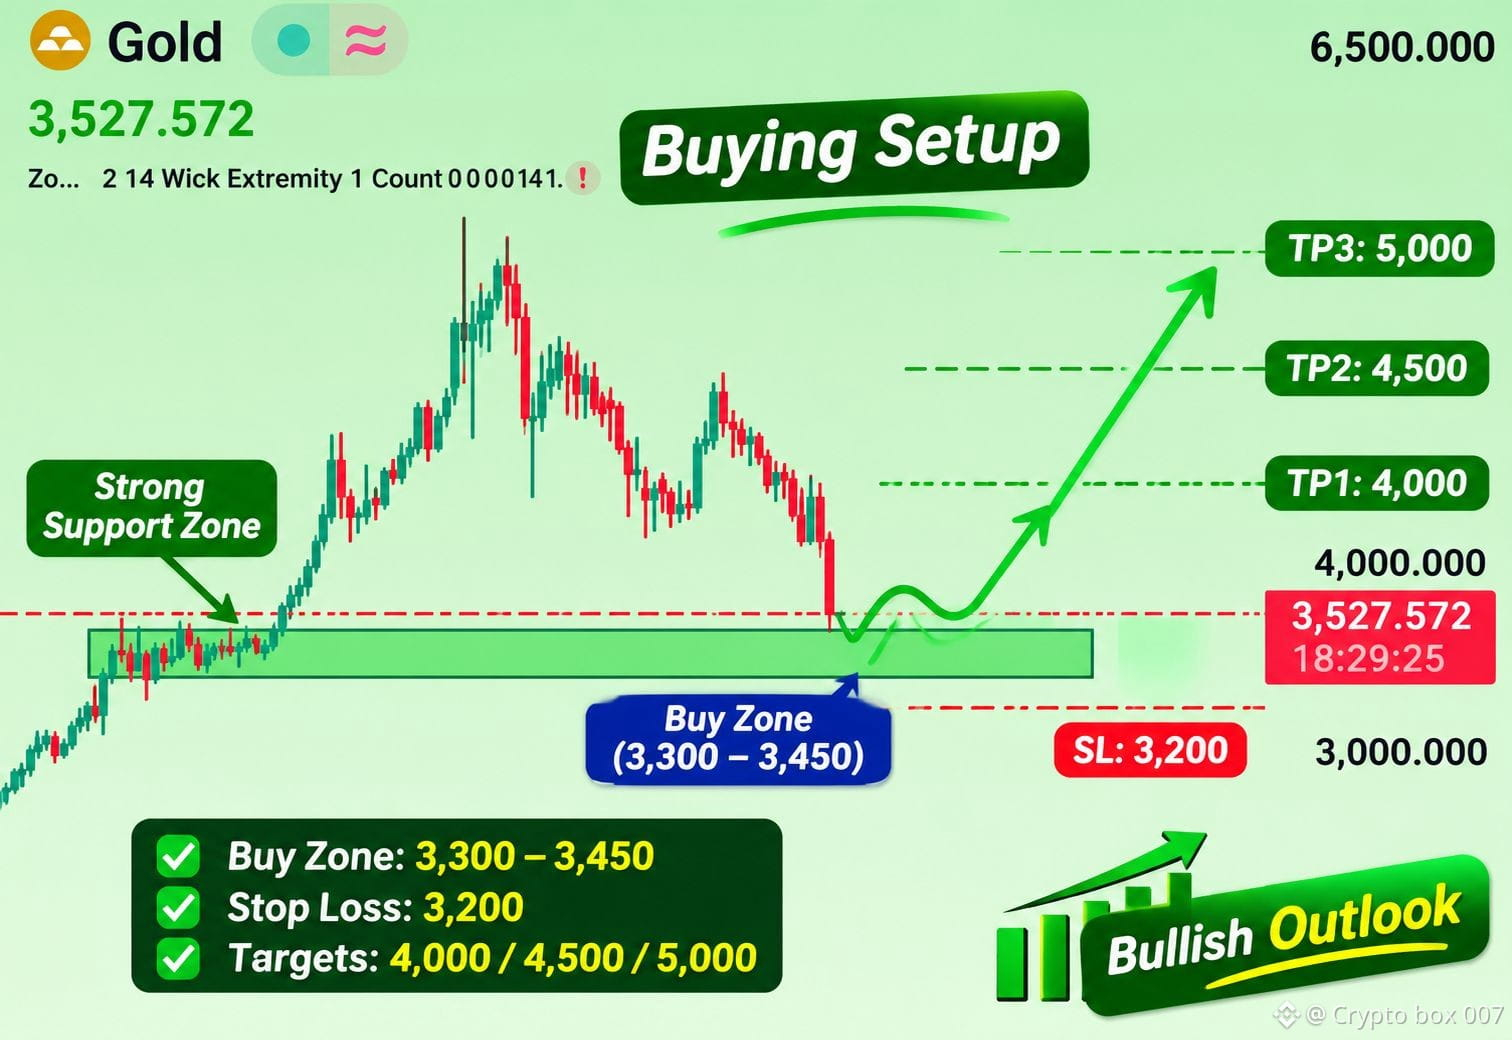
🟢 GOLD (XAU/USD) – BUY SETUP
📊 Market Outlook: Bullish Reversal Potential
Entry Zone: 3,300 – 3,450
Current Price: 3,527.572
🎯 Take Profit Targets:
TP1: 4,000
TP2: 4,500
TP3: 5,000
🛑 Stop Loss: 3,200
Technical Analysis:
Gold is approaching a historically important support and demand zone. Price previously consolidated around this area before making a strong bullish move.
If buyers defend this zone and bullish confirmation appears, Gold could potentially begin another upward movement.
Trade Strategy: Wait for price confirmation around the buying zone before entering a long position. Avoid chasing the price.
⚠️ Risk Management: Use proper position sizing and never risk more than you can afford to lose.
#GOLD #XAUUSD #TradingSignal #BuySetup #TechnicalAnalysisPost $XAUT
{spot}(XAUTUSDT)
🟢 GOLD (XAU/USD) – BUY SETUP
📊 Market Outlook: Bullish Reversal Potential
Entry Zone: 3,300 – 3,450
Current Price: 3,527.572
🎯 Take Profit Targets:
TP1: 4,000
TP2: 4,500
TP3: 5,000
🛑 Stop Loss: 3,200
Technical Analysis:
Gold is approaching a historically important support and demand zone. Price previously consolidated around this area before making a strong bullish move.
If buyers defend this zone and bullish confirmation appears, Gold could potentially begin another upward movement.
Trade Strategy: Wait for price confirmation around the buying zone before entering a long position. Avoid chasing the price.
⚠️ Risk Management: Use proper position sizing and never risk more than you can afford to lose.
#GOLD #XAUUSD #TradingSignal #BuySetup #TechnicalAnalysisPost $XAUT
📊 Market Outlook: Bullish Reversal Potential
Entry Zone: 3,300 – 3,450
Current Price: 3,527.572
🎯 Take Profit Targets:
TP1: 4,000
TP2: 4,500
TP3: 5,000
🛑 Stop Loss: 3,200
Technical Analysis:
Gold is approaching a historically important support and demand zone. Price previously consolidated around this area before making a strong bullish move.
If buyers defend this zone and bullish confirmation appears, Gold could potentially begin another upward movement.
Trade Strategy: Wait for price confirmation around the buying zone before entering a long position. Avoid chasing the price.
⚠️ Risk Management: Use proper position sizing and never risk more than you can afford to lose.
#GOLD #XAUUSD #TradingSignal #BuySetup #TechnicalAnalysisPost $XAUT
Doglas costa:
you are right
1
1
2
319

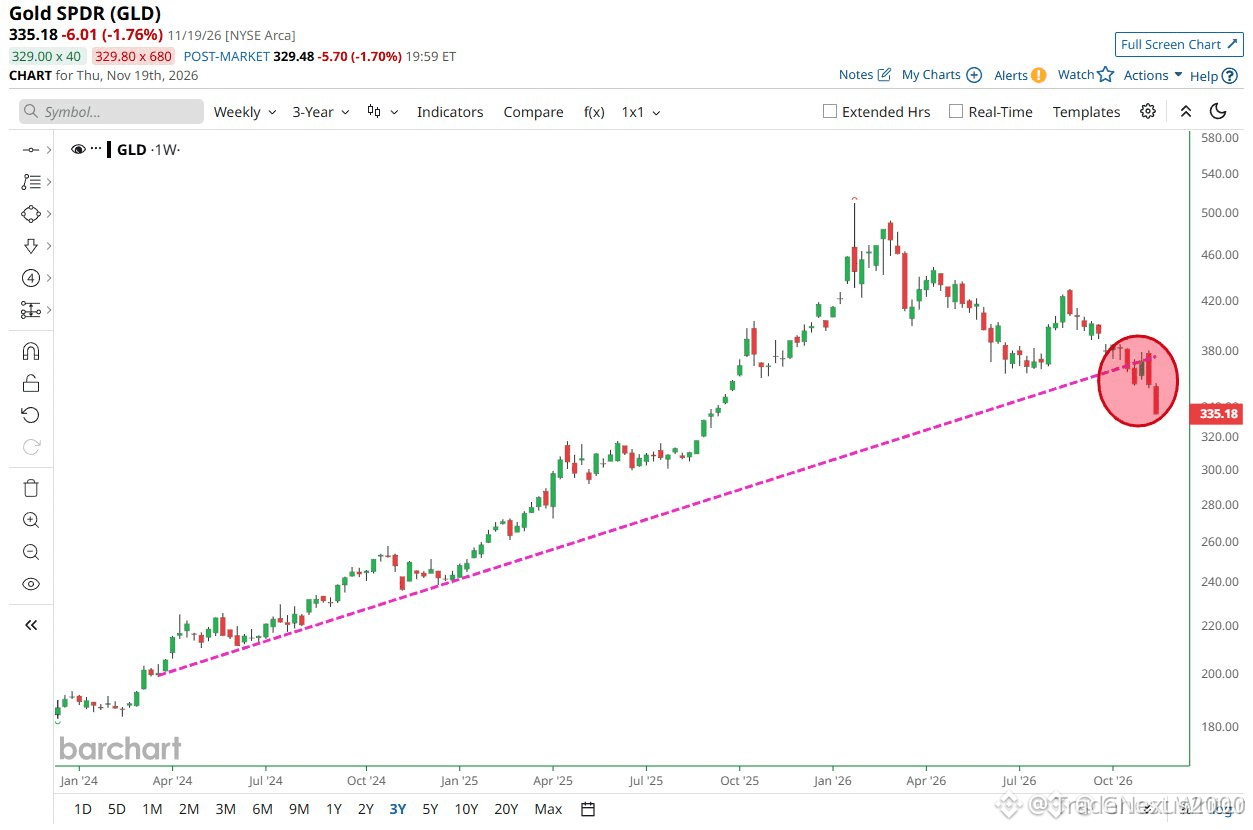
🔴 $XAUT SHATTERS KEY SUPPORT AS THE SAFE HAVEN NARRATIVE COLLAPSES 📉
Entry: 3,550 📉
Institutional distribution is brutal as $XAUT slices below the 3,550 threshold, a structural floor untouched in over twelve months. The aggressive liquidation wave wiped over four trillion from the asset class since equities peaked in October, leaving it sitting 24.5 percent below the August high of 4,700. 📊
Liquidity providers are aggressively repricing risk while structural bids vanish near historical extremes, currently resting 36.6 percent under the all-time high of 5,600. 💡 Where do you anticipate institutional order flow finding a legitimate demand block after this unprecedented flush? 💬
⚠️ Not financial advice. Always manage your risk. 🛡️
🏷️ #XAUT #MarketStructure #Liquidity #Gold
🦈 ⚖️
🔴 $XAUT SHATTERS KEY SUPPORT AS THE SAFE HAVEN NARRATIVE COLLAPSES 📉
Entry: 3,550 📉
Institutional distribution is brutal as $XAUT slices below the 3,550 threshold, a structural floor untouched in over twelve months. The aggressive liquidation wave wiped over four trillion from the asset class since equities peaked in October, leaving it sitting 24.5 percent below the August high of 4,700. 📊
Liquidity providers are aggressively repricing risk while structural bids vanish near historical extremes, currently resting 36.6 percent under the all-time high of 5,600. 💡 Where do you anticipate institutional order flow finding a legitimate demand block after this unprecedented flush? 💬
⚠️ Not financial advice. Always manage your risk. 🛡️
🏷️ #XAUT #MarketStructure #Liquidity #Gold
🦈 ⚖️
Entry: 3,550 📉
Institutional distribution is brutal as $XAUT slices below the 3,550 threshold, a structural floor untouched in over twelve months. The aggressive liquidation wave wiped over four trillion from the asset class since equities peaked in October, leaving it sitting 24.5 percent below the August high of 4,700. 📊
Liquidity providers are aggressively repricing risk while structural bids vanish near historical extremes, currently resting 36.6 percent under the all-time high of 5,600. 💡 Where do you anticipate institutional order flow finding a legitimate demand block after this unprecedented flush? 💬
⚠️ Not financial advice. Always manage your risk. 🛡️
🏷️ #XAUT #MarketStructure #Liquidity #Gold
🦈 ⚖️
2
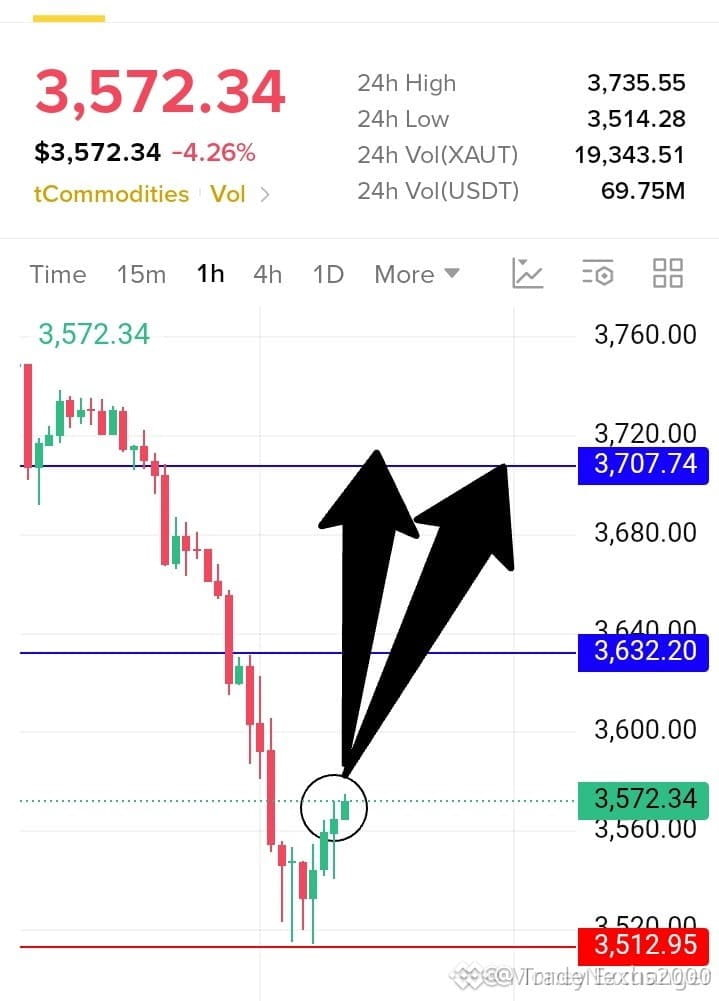
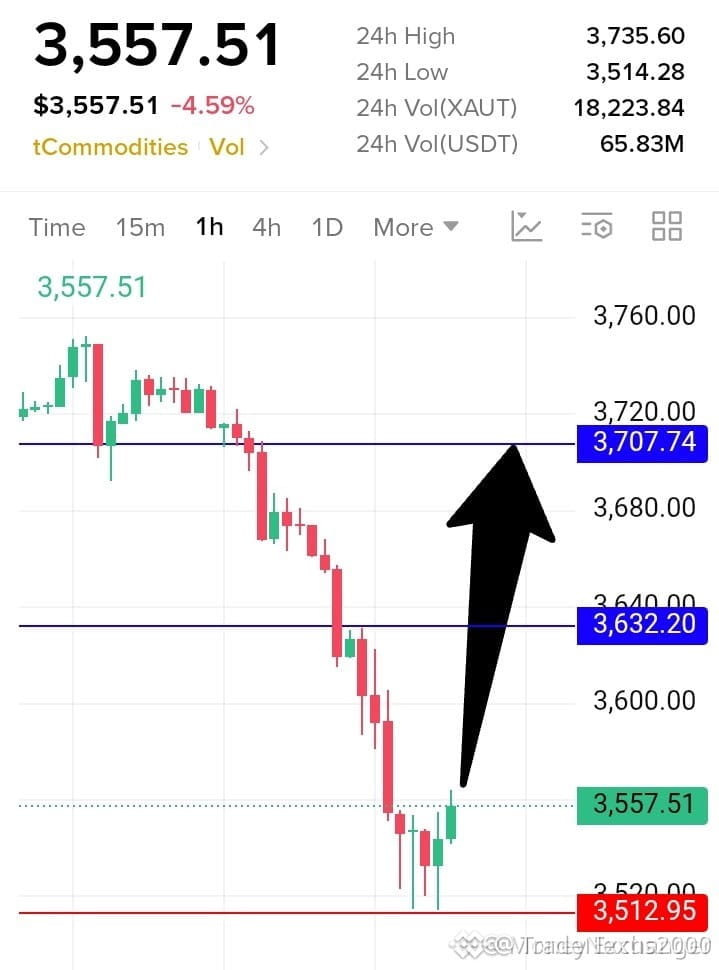
🚨 $XAUT TESTING INSTITUTIONAL DEMAND AS SMART MONEY ABSORBS THE PULLBACK 🦈
Entry: 3,550 - 3,570 ⚡
Target: 3,810 🚀
Institutional order flow on $XAUT is currently defending the 3,550 to 3,570 liquidity cluster, signaling aggressive accumulation from major market participants. This inefficiency zone routinely acts as a launchpad before a structural expansion toward higher premium levels. 📊
Price action is respecting the higher time frame demand block while flushing late retail longs. Expect volatility to contract before institutional algorithms drive the next impulsive leg higher. 💡
💬 Are you positioning alongside institutional accumulation or waiting for a confirmed range breakout? 👇
⚠️ Not financial advice. Always manage your risk. 🛡️
🏷️ #XAUT #Gold #SmartMoney #MarketStructure
🔥 💎
🚨 $XAUT TESTING INSTITUTIONAL DEMAND AS SMART MONEY ABSORBS THE PULLBACK 🦈
Entry: 3,550 - 3,570 ⚡
Target: 3,810 🚀
Institutional order flow on $XAUT is currently defending the 3,550 to 3,570 liquidity cluster, signaling aggressive accumulation from major market participants. This inefficiency zone routinely acts as a launchpad before a structural expansion toward higher premium levels. 📊
Price action is respecting the higher time frame demand block while flushing late retail longs. Expect volatility to contract before institutional algorithms drive the next impulsive leg higher. 💡
💬 Are you positioning alongside institutional accumulation or waiting for a confirmed range breakout? 👇
⚠️ Not financial advice. Always manage your risk. 🛡️
🏷️ #XAUT #Gold #SmartMoney #MarketStructure
🔥 💎
Entry: 3,550 - 3,570 ⚡
Target: 3,810 🚀
Institutional order flow on $XAUT is currently defending the 3,550 to 3,570 liquidity cluster, signaling aggressive accumulation from major market participants. This inefficiency zone routinely acts as a launchpad before a structural expansion toward higher premium levels. 📊
Price action is respecting the higher time frame demand block while flushing late retail longs. Expect volatility to contract before institutional algorithms drive the next impulsive leg higher. 💡
💬 Are you positioning alongside institutional accumulation or waiting for a confirmed range breakout? 👇
⚠️ Not financial advice. Always manage your risk. 🛡️
🏷️ #XAUT #Gold #SmartMoney #MarketStructure
🔥 💎
2

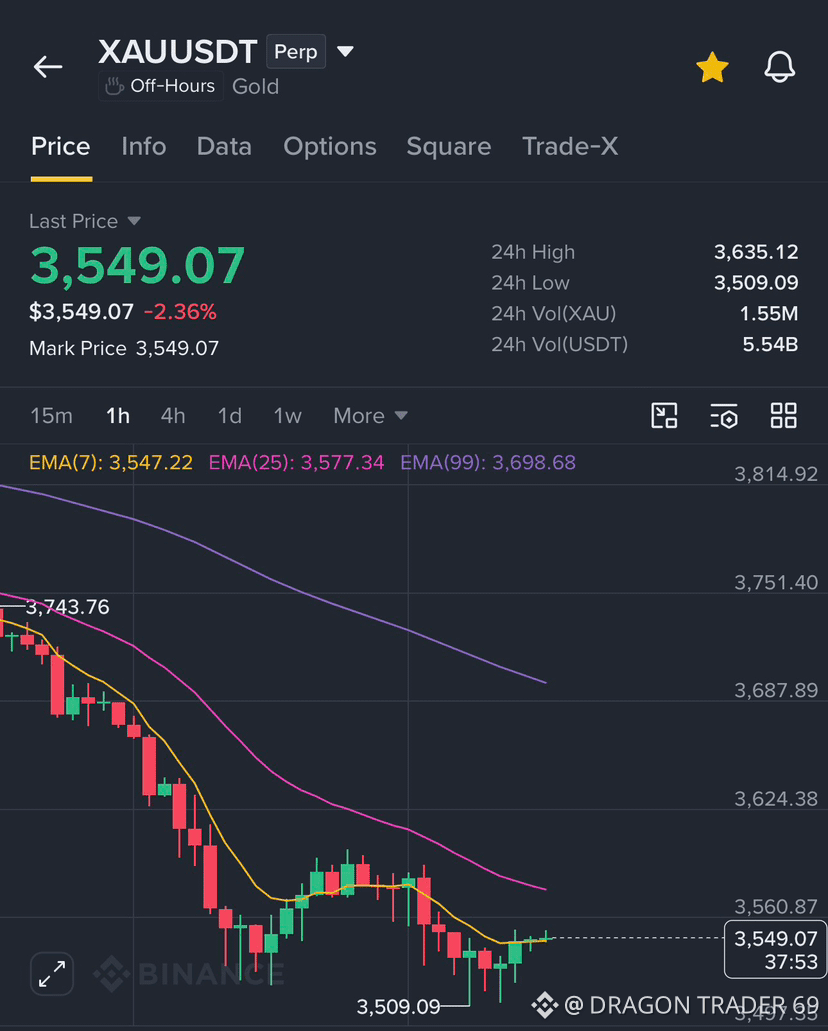
#GOLD at a Critical Turning Point! 👀
$XAU is testing a key demand zone around $3,515–$3,535. If bulls successfully defend this level, we could see a strong recovery toward $3,629–$3,656.
Will buyers take control, or are we heading for another drop?
What’s your prediction, traders? 🐂🐻
{future}(XAUUSDT)
#GOLD at a Critical Turning Point! 👀
$XAU is testing a key demand zone around $3,515–$3,535. If bulls successfully defend this level, we could see a strong recovery toward $3,629–$3,656.
Will buyers take control, or are we heading for another drop?
What’s your prediction, traders? 🐂🐻
$XAU is testing a key demand zone around $3,515–$3,535. If bulls successfully defend this level, we could see a strong recovery toward $3,629–$3,656.
Will buyers take control, or are we heading for another drop?
What’s your prediction, traders? 🐂🐻
1
25
🦈 $XAU TESTING A CRITICAL INSTITUTIONAL DEMAND BLOCK AT THE RANGE EQUILIBRIUM! ⚡
Entry: 3,515 ⚡
Target: 3,629 🚀
Smart money footprints are clearly visible as price taps into this multi-week liquidity pool, looking for trapped retail shorts to fuel the next leg. 📊 Market structure on the lower timeframes indicates accumulation behavior rather than heavy distribution pressure. 💡
If order flow absorbs the lingering sell-side imbalance here, expect a rapid structural shift toward higher resistance targets. 🌊 Are you positioning for this bullish recovery or waiting for a deeper sweep? 👇
⚠️ Not financial advice. Always manage your risk. 🛡️
🏷️ #XAU #SmartMoney #MarketStructure #Gold
🔥 🦈
🦈 $XAU TESTING A CRITICAL INSTITUTIONAL DEMAND BLOCK AT THE RANGE EQUILIBRIUM! ⚡
Entry: 3,515 ⚡
Target: 3,629 🚀
Smart money footprints are clearly visible as price taps into this multi-week liquidity pool, looking for trapped retail shorts to fuel the next leg. 📊 Market structure on the lower timeframes indicates accumulation behavior rather than heavy distribution pressure. 💡
If order flow absorbs the lingering sell-side imbalance here, expect a rapid structural shift toward higher resistance targets. 🌊 Are you positioning for this bullish recovery or waiting for a deeper sweep? 👇
⚠️ Not financial advice. Always manage your risk. 🛡️
🏷️ #XAU #SmartMoney #MarketStructure #Gold
🔥 🦈
Entry: 3,515 ⚡
Target: 3,629 🚀
Smart money footprints are clearly visible as price taps into this multi-week liquidity pool, looking for trapped retail shorts to fuel the next leg. 📊 Market structure on the lower timeframes indicates accumulation behavior rather than heavy distribution pressure. 💡
If order flow absorbs the lingering sell-side imbalance here, expect a rapid structural shift toward higher resistance targets. 🌊 Are you positioning for this bullish recovery or waiting for a deeper sweep? 👇
⚠️ Not financial advice. Always manage your risk. 🛡️
🏷️ #XAU #SmartMoney #MarketStructure #Gold
🔥 🦈
1

·
--
Nvidia SEC Probe and 149M Laundering Alert: How weekend capital is rotating into $USDC ahead of Monday's metals open.
Sitting at the desk at 3:48 AM on a Saturday, the weekend orderbooks are telling a story most traders will wake up late to. Elliptic forensics just flagged 149 million in Bitcoin moving through coinjoins tied to recent exchange security breaches, accelerating institutional deleveraging across $BTC as weekend liquidity thins out. At the same time, TradFi risk desks are already on edge for Monday after Reuters reported an SEC accounting probe into Nvidia, right as Michael Burry trims half his semiconductor put positions and Anthropic IPO chatter adds fresh pressure to risk-on sentiment.
With spot demand shifting toward defensive collateral, USDC is holding a slight premium around 1.0019 on Binance Spot. Circle confirming the first real-time dividends settled in digital dollars only reinforces why large desks are parking idle liquidity in regulated stable collateral rather than riding weekend volatility.
Since London LBMA and COMEX metals markets are closed until Sunday evening, $PAXG serves as our live weekend barometer following Friday's weekly gold close. Sovereign central bank bullion buying has stayed aggressive all quarter, creating deep safe-haven bid support underneath XAU/USD even as high-beta assets wobble. Spot silver, on the other hand, enters the new week caught between those same safe-haven flows and shifting industrial demand expectations tied to tech and semiconductor capital spending.
As Binance expands TradFi perpetuals and tokenized collateral like Anthropic bStocks, equity shocks now transmit straight into crypto orderflow. When global markets reopen Monday morning, keep your eyes on whether gold holds its weekly close structure above key multi-week support and whether silver can reclaim Friday's intraday resistance without equity contagion dragging industrial metals lower.
Are you rotating into USDC and gold-backed collateral for Monday's open, or holding risk exposure through the weekend?
#Gold #Silver
Nvidia SEC Probe and 149M Laundering Alert: How weekend capital is rotating into $USDC ahead of Monday's metals open.
Sitting at the desk at 3:48 AM on a Saturday, the weekend orderbooks are telling a story most traders will wake up late to. Elliptic forensics just flagged 149 million in Bitcoin moving through coinjoins tied to recent exchange security breaches, accelerating institutional deleveraging across $BTC as weekend liquidity thins out. At the same time, TradFi risk desks are already on edge for Monday after Reuters reported an SEC accounting probe into Nvidia, right as Michael Burry trims half his semiconductor put positions and Anthropic IPO chatter adds fresh pressure to risk-on sentiment.
With spot demand shifting toward defensive collateral, USDC is holding a slight premium around 1.0019 on Binance Spot. Circle confirming the first real-time dividends settled in digital dollars only reinforces why large desks are parking idle liquidity in regulated stable collateral rather than riding weekend volatility.
Since London LBMA and COMEX metals markets are closed until Sunday evening, $PAXG serves as our live weekend barometer following Friday's weekly gold close. Sovereign central bank bullion buying has stayed aggressive all quarter, creating deep safe-haven bid support underneath XAU/USD even as high-beta assets wobble. Spot silver, on the other hand, enters the new week caught between those same safe-haven flows and shifting industrial demand expectations tied to tech and semiconductor capital spending.
As Binance expands TradFi perpetuals and tokenized collateral like Anthropic bStocks, equity shocks now transmit straight into crypto orderflow. When global markets reopen Monday morning, keep your eyes on whether gold holds its weekly close structure above key multi-week support and whether silver can reclaim Friday's intraday resistance without equity contagion dragging industrial metals lower.
Are you rotating into USDC and gold-backed collateral for Monday's open, or holding risk exposure through the weekend?
#Gold #Silver
Sitting at the desk at 3:48 AM on a Saturday, the weekend orderbooks are telling a story most traders will wake up late to. Elliptic forensics just flagged 149 million in Bitcoin moving through coinjoins tied to recent exchange security breaches, accelerating institutional deleveraging across $BTC as weekend liquidity thins out. At the same time, TradFi risk desks are already on edge for Monday after Reuters reported an SEC accounting probe into Nvidia, right as Michael Burry trims half his semiconductor put positions and Anthropic IPO chatter adds fresh pressure to risk-on sentiment.
With spot demand shifting toward defensive collateral, USDC is holding a slight premium around 1.0019 on Binance Spot. Circle confirming the first real-time dividends settled in digital dollars only reinforces why large desks are parking idle liquidity in regulated stable collateral rather than riding weekend volatility.
Since London LBMA and COMEX metals markets are closed until Sunday evening, $PAXG serves as our live weekend barometer following Friday's weekly gold close. Sovereign central bank bullion buying has stayed aggressive all quarter, creating deep safe-haven bid support underneath XAU/USD even as high-beta assets wobble. Spot silver, on the other hand, enters the new week caught between those same safe-haven flows and shifting industrial demand expectations tied to tech and semiconductor capital spending.
As Binance expands TradFi perpetuals and tokenized collateral like Anthropic bStocks, equity shocks now transmit straight into crypto orderflow. When global markets reopen Monday morning, keep your eyes on whether gold holds its weekly close structure above key multi-week support and whether silver can reclaim Friday's intraday resistance without equity contagion dragging industrial metals lower.
Are you rotating into USDC and gold-backed collateral for Monday's open, or holding risk exposure through the weekend?
#Gold #Silver
3
Log in to explore more content
Join global crypto users on Binance Square
⚡️ Get latest and useful information about crypto.
💬 Trusted by the world’s largest crypto exchange.
👍 Discover real insights from verified creators.
Email / Phone number
Trending Topics
1
#CanBTCReboundAfterFallingBelow60K?
88,137 views
486 Discussing
2
#GlobalStocksFaceLongestLosingStreakSince2023
43,509 views
490 Discussing
3
#AnthropicPlungesTowardIPOPriceonDay2
12,329 views
192 Discussing
4
#GaoTengBitcoinETFListsOnHKEX
33,714 views
386 Discussing
5
#TradFiForBeginners
995,952 views
5,803 Discussing
6
#NvidiaBoardReportedlySplitOverHuang’sReturn
385,950 views
2,572 Discussing
7
#TetherBurns8BillionUSDTInPast20Days
36,882 views
155 Discussing
8
#BitcoinWalletSignatureFlawExploitableWithinSeconds
10,573 views
74 Discussing
9
#CanGTA6'sLaunchLiftTTWOShares?
323,881 views
1,802 Discussing
10
#HongKongProposesSFCLicensingForFourVirtualAssetServices
1,981 views
36 Discussing