
#13
13
71,969 views
475 Discussing
Hot
Latest

·
--
Crypto Quiz Quest #13
🚨 ETH LEVEL CHALLENGE
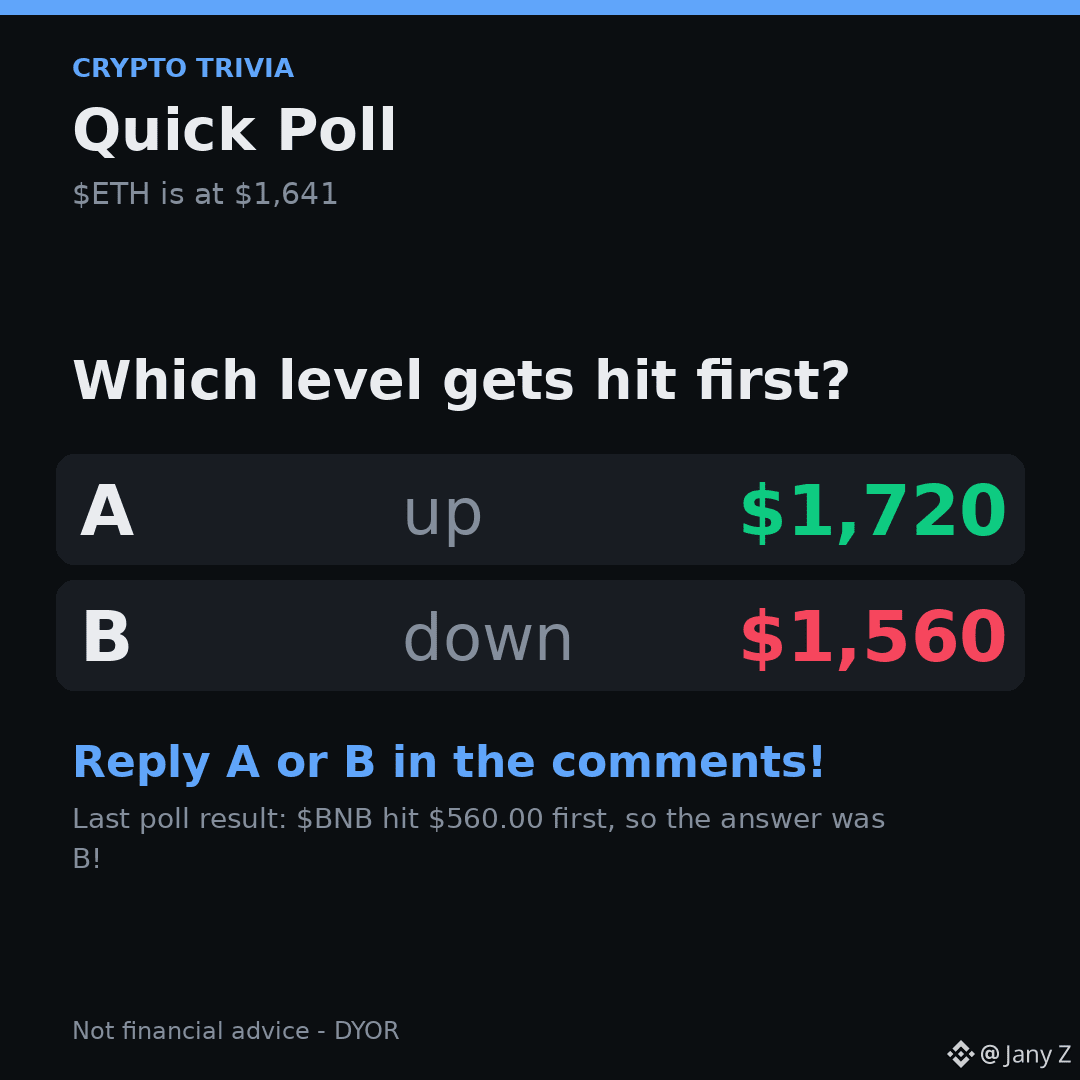
✅ Last poll: $BNB hit $560.00 first, answer was B. Congrats to everyone who called it
$ETH sits at $1,641 right now. Which level gets hit first?
🅰️ $1,720
🅱️ $1,560
Reply A or B with a one-line reason. Results in the next poll, which way will it go?
#ETH #Poll
Crypto Quiz Quest #13
🚨 ETH LEVEL CHALLENGE
✅ Last poll: $BNB hit $560.00 first, answer was B. Congrats to everyone who called it
$ETH sits at $1,641 right now. Which level gets hit first?
🅰️ $1,720
🅱️ $1,560
Reply A or B with a one-line reason. Results in the next poll, which way will it go?
#ETH #Poll
🚨 ETH LEVEL CHALLENGE
✅ Last poll: $BNB hit $560.00 first, answer was B. Congrats to everyone who called it
$ETH sits at $1,641 right now. Which level gets hit first?
🅰️ $1,720
🅱️ $1,560
Reply A or B with a one-line reason. Results in the next poll, which way will it go?
#ETH #Poll
77
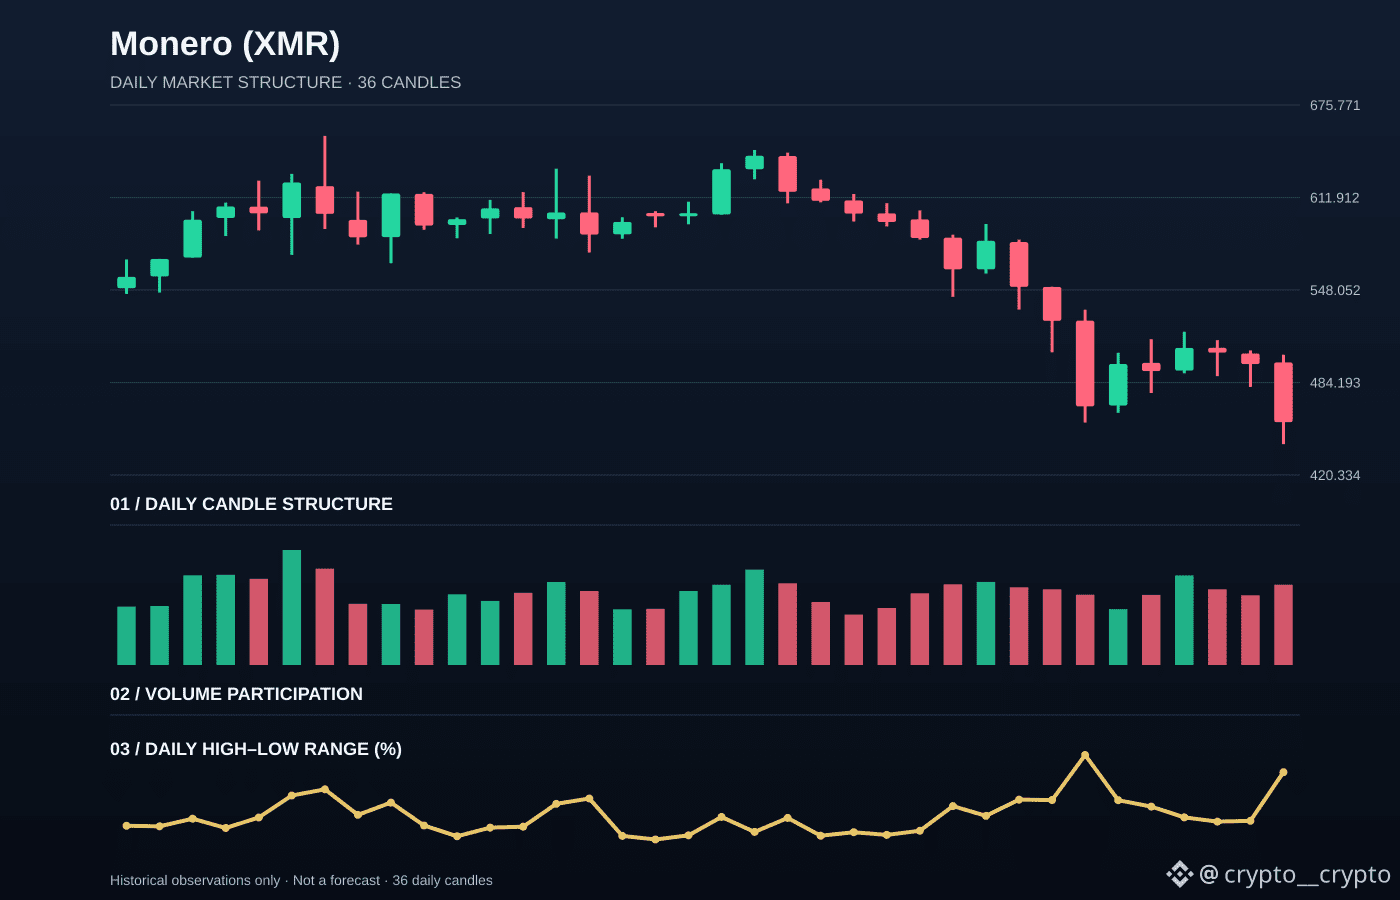
Monero (XMR) declined 8.06% between the last two available daily closes. The detail I am watching is how that move finished, not just the headline percentage.
The daily close sat in the lower part of its range, showing sellers retained more of the session move. A recovery close would suggest supply is easing; another weak close would keep downside pressure in focus.
XMR is worth tracking at the next daily close: does the market accept the latest price area, or reject it? The latest candle covered 13.98% from low to high, with OHLC: 498.04679 / 503.33728 / 441.62075 / 456.83125.
For context, the 24-hour market move is -10.32%, while reported turnover is approximately 167.51M USD. CoinMarketCap rank: #13. Benchmark snapshot: BTC -6.09% · ETH -7.82%.
Are you reading XMR as continuation or a pause? Explain the price level behind your view.
Data note: CMC listings market quote and CoinLore daily candles. These are observed market figures, not a price prediction or a trade instruction.
$XMR $BTC $ETH
Monero (XMR) declined 8.06% between the last two available daily closes. The detail I am watching is how that move finished, not just the headline percentage.
The daily close sat in the lower part of its range, showing sellers retained more of the session move. A recovery close would suggest supply is easing; another weak close would keep downside pressure in focus.
XMR is worth tracking at the next daily close: does the market accept the latest price area, or reject it? The latest candle covered 13.98% from low to high, with OHLC: 498.04679 / 503.33728 / 441.62075 / 456.83125.
For context, the 24-hour market move is -10.32%, while reported turnover is approximately 167.51M USD. CoinMarketCap rank: #13. Benchmark snapshot: BTC -6.09% · ETH -7.82%.
Are you reading XMR as continuation or a pause? Explain the price level behind your view.
Data note: CMC listings market quote and CoinLore daily candles. These are observed market figures, not a price prediction or a trade instruction.
$XMR $BTC $ETH
The daily close sat in the lower part of its range, showing sellers retained more of the session move. A recovery close would suggest supply is easing; another weak close would keep downside pressure in focus.
XMR is worth tracking at the next daily close: does the market accept the latest price area, or reject it? The latest candle covered 13.98% from low to high, with OHLC: 498.04679 / 503.33728 / 441.62075 / 456.83125.
For context, the 24-hour market move is -10.32%, while reported turnover is approximately 167.51M USD. CoinMarketCap rank: #13. Benchmark snapshot: BTC -6.09% · ETH -7.82%.
Are you reading XMR as continuation or a pause? Explain the price level behind your view.
Data note: CMC listings market quote and CoinLore daily candles. These are observed market figures, not a price prediction or a trade instruction.
$XMR $BTC $ETH

·
--
Web3 Workshop #13
bitcoin's slipping again, $BTC $59,424 down 5.30% and $ETH $1,641 down 7.13%
back in 2016 a hack stole about 3.6 million ETH from The DAO. the chain hard-forked to return the funds; those who kept the original became Ethereum Classic
was that fork the right call? 🤔
Tech decoded. 🛠️
#CryptoHistory #Bitcoin
Web3 Workshop #13
bitcoin's slipping again, $BTC $59,424 down 5.30% and $ETH $1,641 down 7.13%
back in 2016 a hack stole about 3.6 million ETH from The DAO. the chain hard-forked to return the funds; those who kept the original became Ethereum Classic
was that fork the right call? 🤔
Tech decoded. 🛠️
#CryptoHistory #Bitcoin
bitcoin's slipping again, $BTC $59,424 down 5.30% and $ETH $1,641 down 7.13%
back in 2016 a hack stole about 3.6 million ETH from The DAO. the chain hard-forked to return the funds; those who kept the original became Ethereum Classic
was that fork the right call? 🤔
Tech decoded. 🛠️
#CryptoHistory #Bitcoin
1
266

·
--
Morning Pulse #13
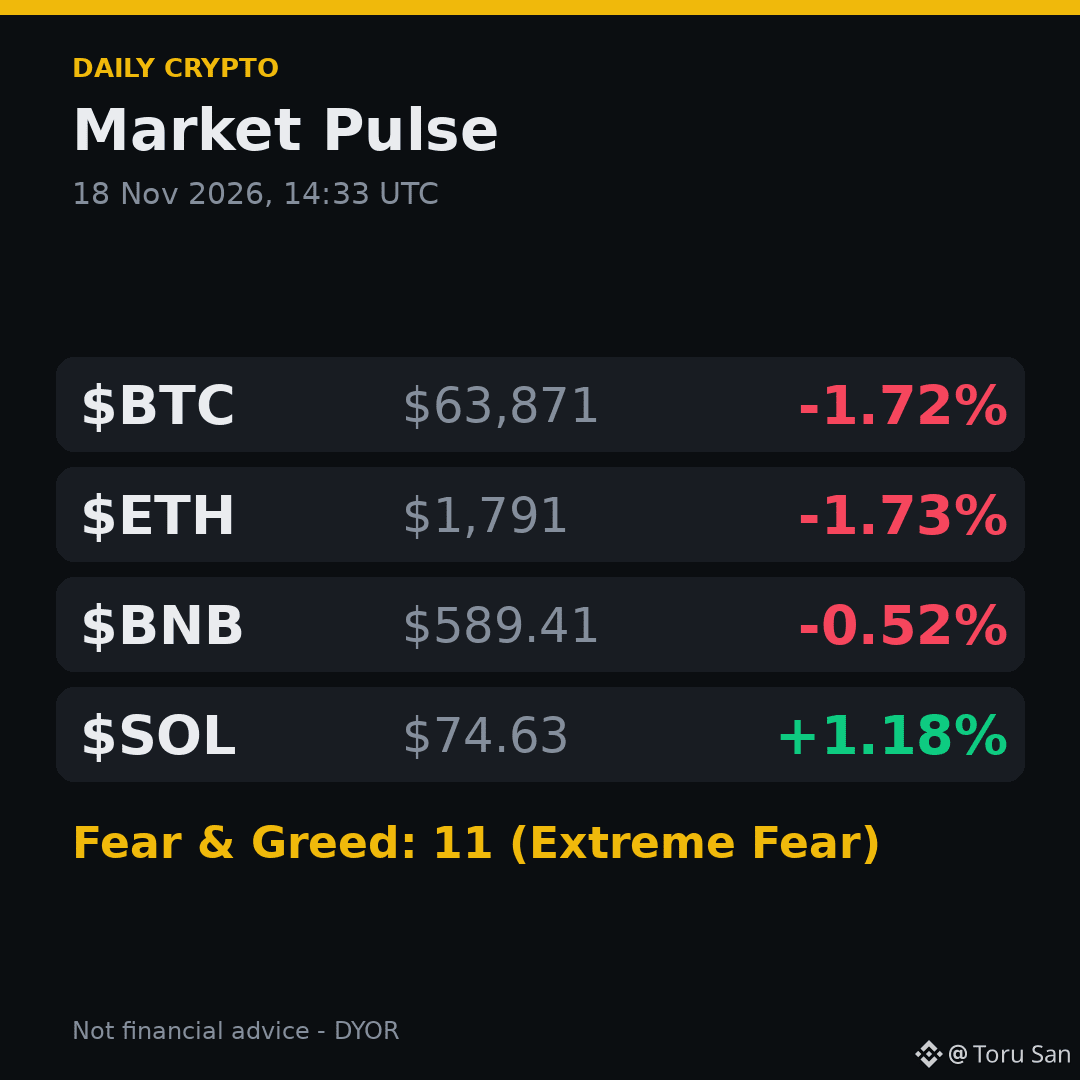
😬 Not the sunrise I wanted.
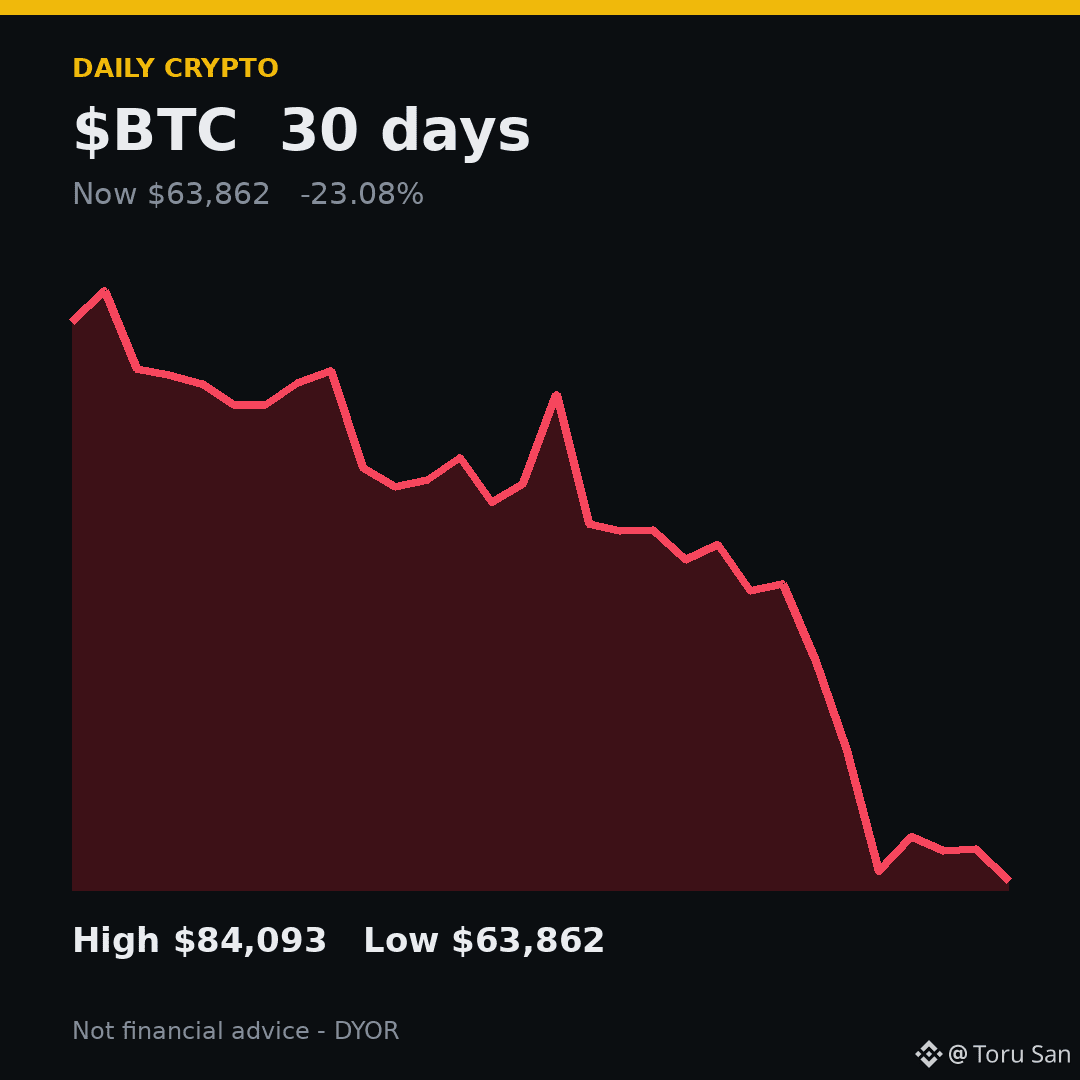
$BTC $63,871 down 1.72%
$ETH $1,791 down 1.73%
$BNB $589.41 down 0.52%
SOL $74.63 up 1.18%
Fear & Greed index sits at 11, extreme fear. In a nutshell, the market's pulling back hard.
What's your move today, accumulate, hold, or sit on the sidelines?
#MarketPulse #Crypto
Morning Pulse #13
😬 Not the sunrise I wanted.
$BTC $63,871 down 1.72%
$ETH $1,791 down 1.73%
$BNB $589.41 down 0.52%
SOL $74.63 up 1.18%
Fear & Greed index sits at 11, extreme fear. In a nutshell, the market's pulling back hard.
What's your move today, accumulate, hold, or sit on the sidelines?
#MarketPulse #Crypto
😬 Not the sunrise I wanted.
$BTC $63,871 down 1.72%
$ETH $1,791 down 1.73%
$BNB $589.41 down 0.52%
SOL $74.63 up 1.18%
Fear & Greed index sits at 11, extreme fear. In a nutshell, the market's pulling back hard.
What's your move today, accumulate, hold, or sit on the sidelines?
#MarketPulse #Crypto
58


bonuz explained #13 🛡️
a few safety habits that protect any wallet, bonuz included.
never share a login code. not with support, not with a friend, not with anyone in your DMs. a real team will never ask for it.
use a passkey or a strong lock on your phone. it's the door to everything.
and if a message feels rushed, stop. scammers love hurry.
what's your number one safety rule? 👇
bonuz explained #13 🛡️
a few safety habits that protect any wallet, bonuz included.
never share a login code. not with support, not with a friend, not with anyone in your DMs. a real team will never ask for it.
use a passkey or a strong lock on your phone. it's the door to everything.
and if a message feels rushed, stop. scammers love hurry.
what's your number one safety rule? 👇
a few safety habits that protect any wallet, bonuz included.
never share a login code. not with support, not with a friend, not with anyone in your DMs. a real team will never ask for it.
use a passkey or a strong lock on your phone. it's the door to everything.
and if a message feels rushed, stop. scammers love hurry.
what's your number one safety rule? 👇
78

Mood Meter #13
$BTC $ETH $BNB SOL
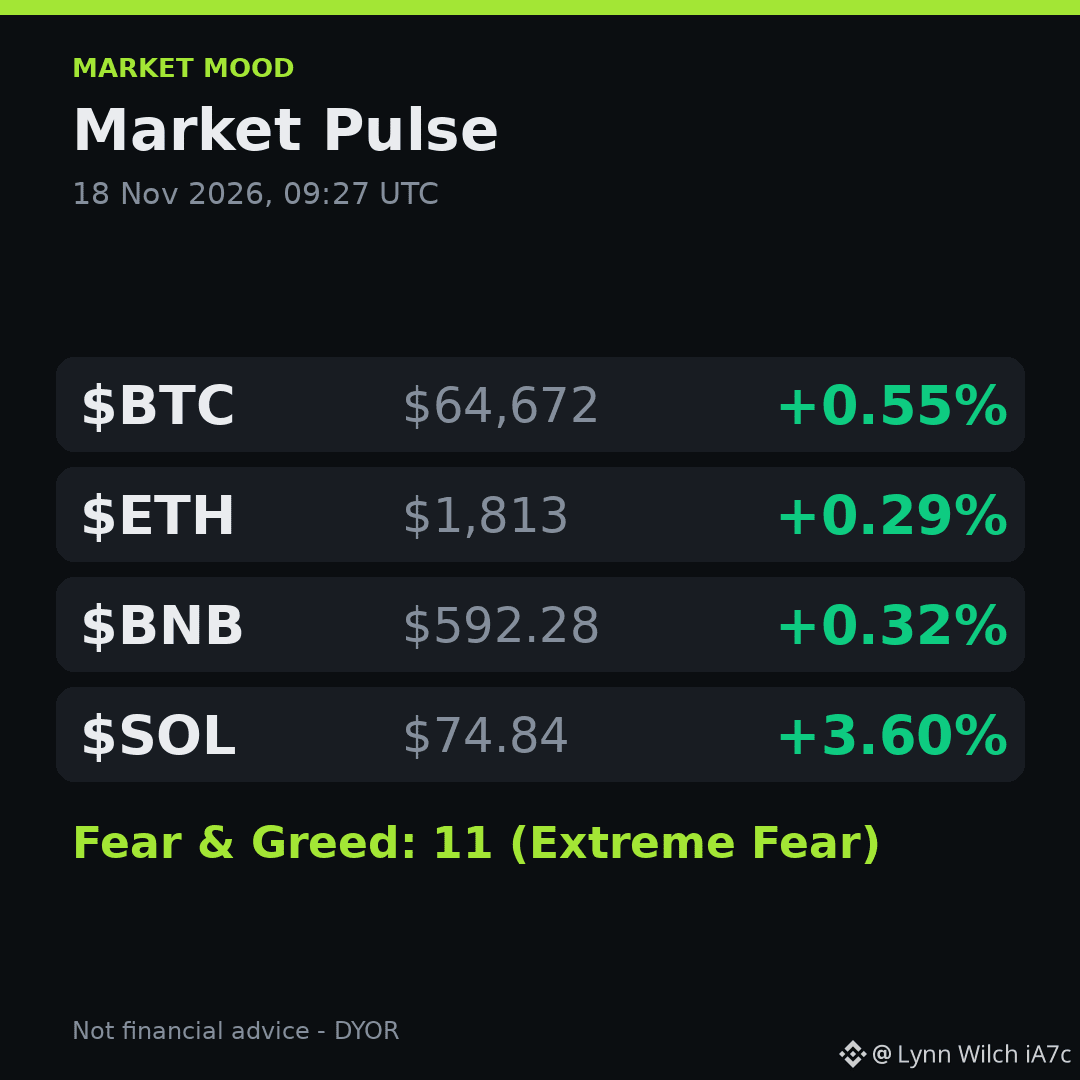
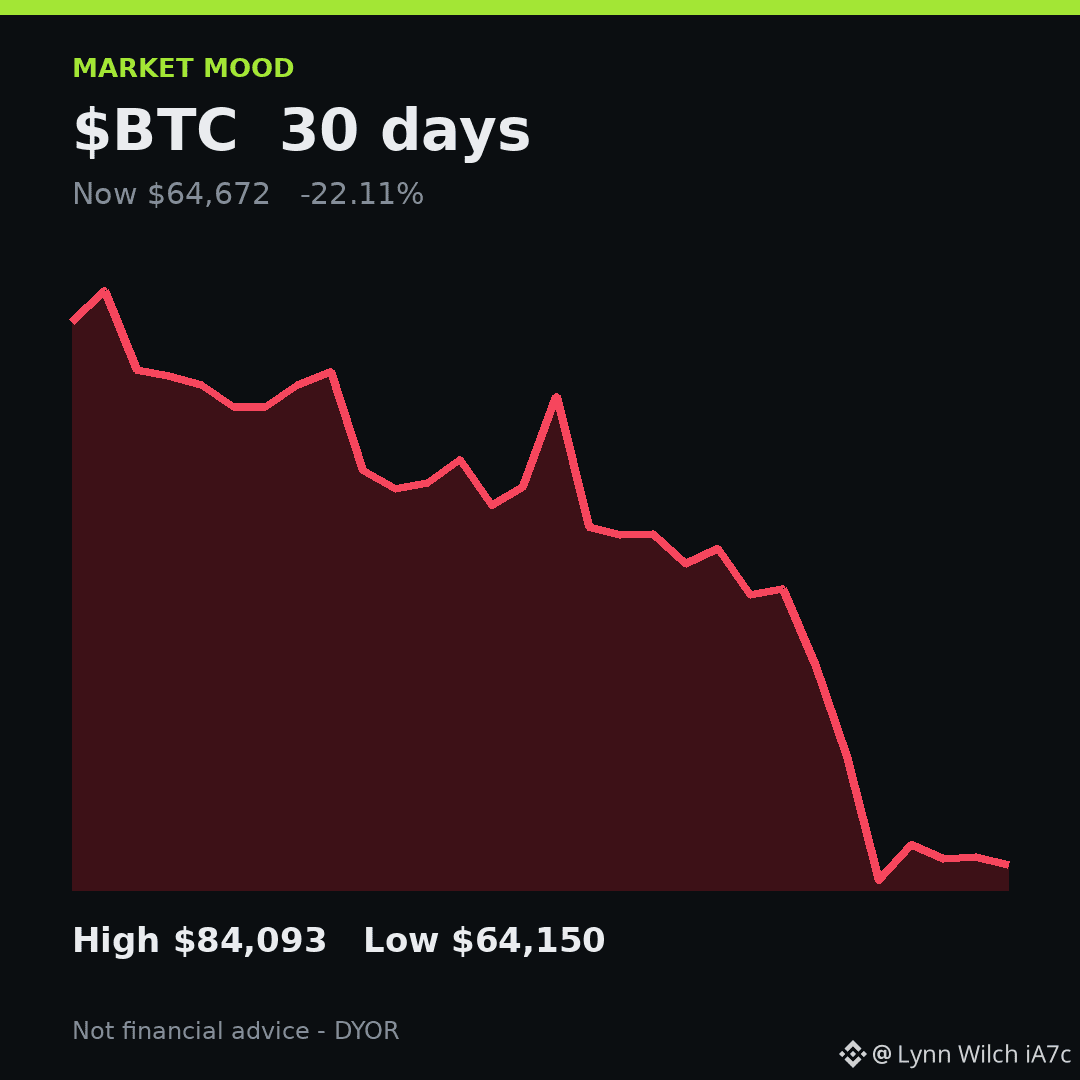
btc nudges up to $64,672, up 0.55%; eth at $1,813, up 0.29%; bnb $592.28, up 0.32%; sol spikes to $74.84, up 3.60%.
fear & greed index sits at 11, extreme fear. green or red day ahead? drop a 🟢 or 🔴 👇
Thoughts filed. ✍️
#MarketPulse #Crypto
Mood Meter #13
$BTC $ETH $BNB SOL
btc nudges up to $64,672, up 0.55%; eth at $1,813, up 0.29%; bnb $592.28, up 0.32%; sol spikes to $74.84, up 3.60%.
fear & greed index sits at 11, extreme fear. green or red day ahead? drop a 🟢 or 🔴 👇
Thoughts filed. ✍️
#MarketPulse #Crypto
$BTC $ETH $BNB SOL
btc nudges up to $64,672, up 0.55%; eth at $1,813, up 0.29%; bnb $592.28, up 0.32%; sol spikes to $74.84, up 3.60%.
fear & greed index sits at 11, extreme fear. green or red day ahead? drop a 🟢 or 🔴 👇
Thoughts filed. ✍️
#MarketPulse #Crypto
82

·
--
Bitcoin Beacon #13
Morning coffee, the market barely moved.
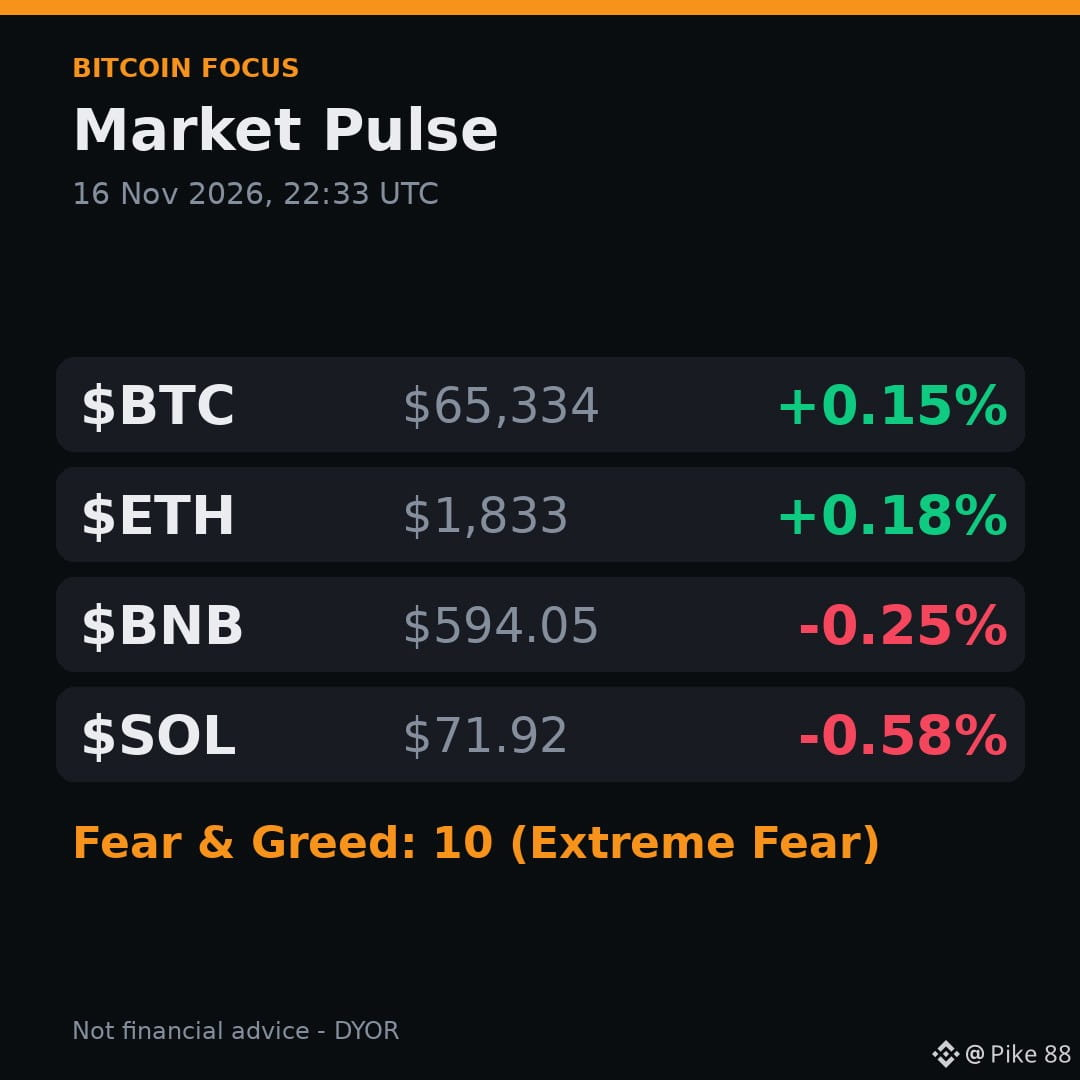
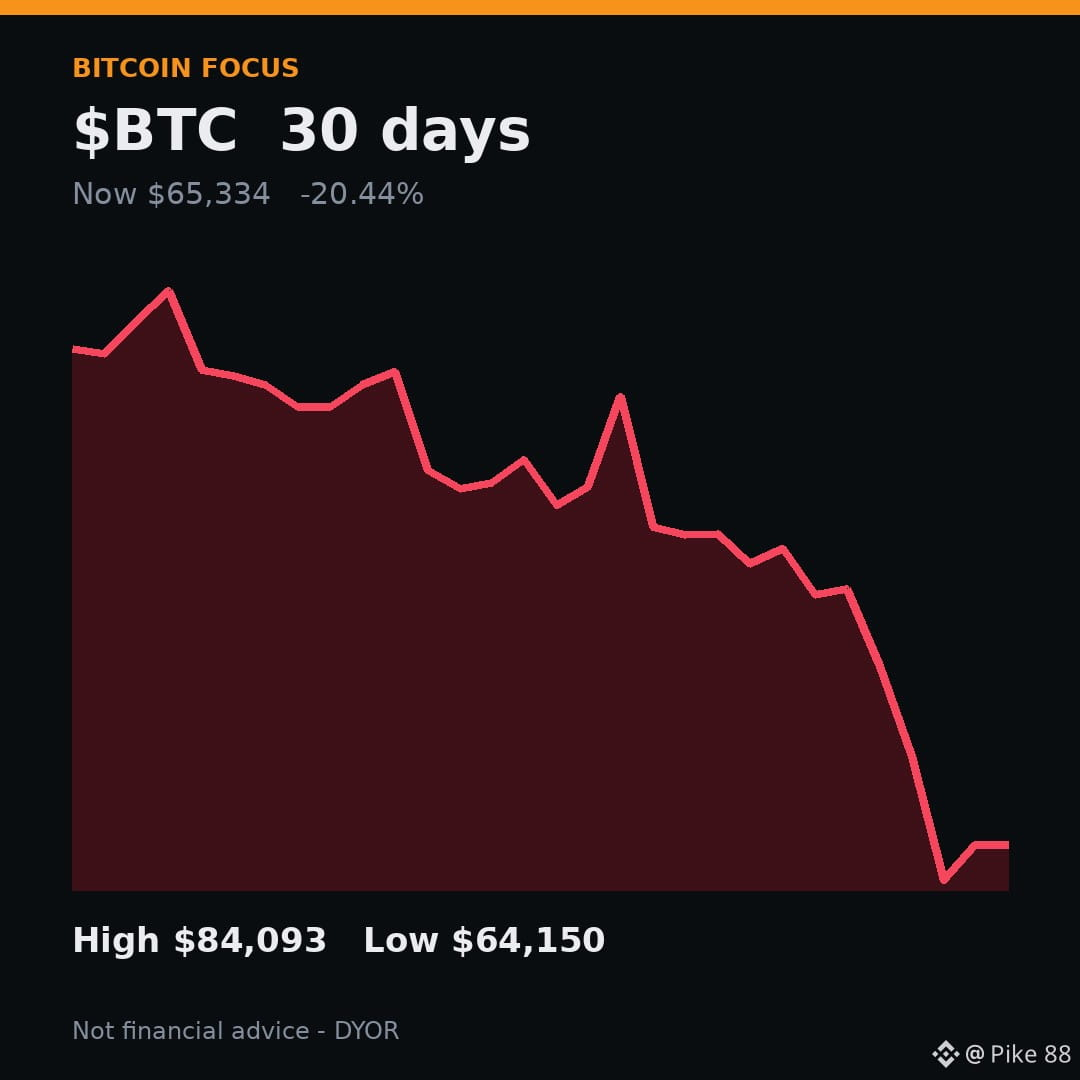
$BTC $65,334 up 0.15%
$ETH $1,833 up 0.18%
$BNB $594.05 down 0.25%
SOL $71.92 down 0.58%
Fear & Greed: 10 (Extreme Fear)
One block at a time, are you accumulating, holding, or waiting on the sidelines?
On the chain. ⛓️
#MarketPulse #Crypto
Bitcoin Beacon #13
Morning coffee, the market barely moved.
$BTC $65,334 up 0.15%
$ETH $1,833 up 0.18%
$BNB $594.05 down 0.25%
SOL $71.92 down 0.58%
Fear & Greed: 10 (Extreme Fear)
One block at a time, are you accumulating, holding, or waiting on the sidelines?
On the chain. ⛓️
#MarketPulse #Crypto
Morning coffee, the market barely moved.
$BTC $65,334 up 0.15%
$ETH $1,833 up 0.18%
$BNB $594.05 down 0.25%
SOL $71.92 down 0.58%
Fear & Greed: 10 (Extreme Fear)
One block at a time, are you accumulating, holding, or waiting on the sidelines?
On the chain. ⛓️
#MarketPulse #Crypto
41

·
--
Wang Xiaolou’s Trading Journal #14
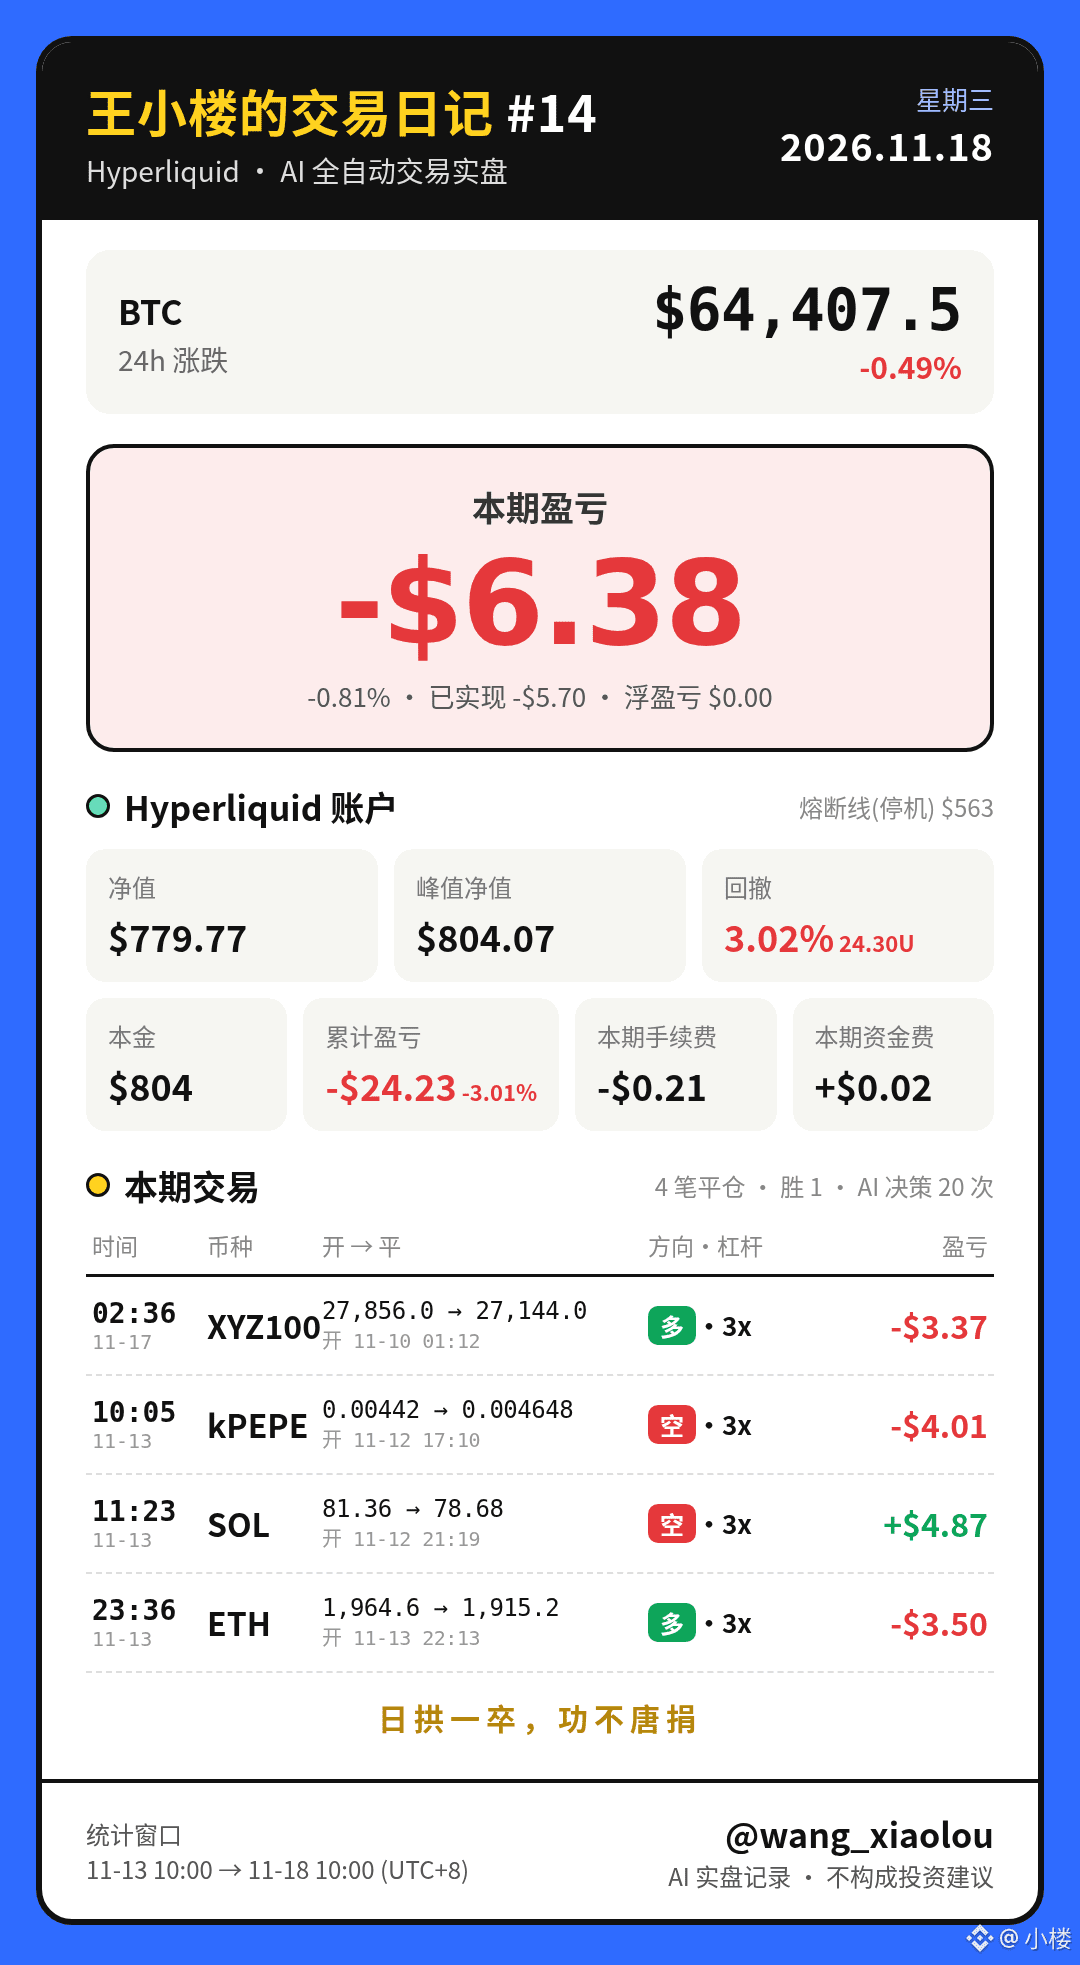
Four closed trades: one win and three losses. Net asset value: 779.77U, down 6.38U this period. Now flat and waiting.
📅 Trading period: 2026-11-13 10:00 — 2026-11-18 10:00 (Shanghai)
No updates were issued for the periods on 11-15 and 11-16, so this period’s window starts from the previous update, #13 (11-13 10:00).
Ending net asset value: 779.77U (opening snapshot: 786.16U, 11-13 10:14), down 6.38U (−0.81%) this period. Realized PnL: −5.70U; unrealized PnL: 0.00U; fees: −0.21U; funding: +0.02U. Cumulative PnL: −24.23U (−3.01%).
Peak: 804.07U · Drawdown: 3.02% (24.30U)
Trade by trade:
Short kPEPE 0.00442→0.004648 (3x), −4.01U (stop-loss)
Short SOL 81.365→78.682 (3x), +4.87U (take-profit)
Long ETH 1964.6→1915.2 (3x), −3.50U (stop-loss)
Long XYZ100 (U.S. stocks) 27856→27144 (3x), −3.37U (stop-loss)
AI’s reasoning: The kPEPE and SOL shorts carried over from the previous period were closed at a stop-loss and take-profit, respectively. On the evening of the 13th, a trend-following ETH long was opened based on 1h+4h alignment, but it hit its stop-loss that same day. The XYZ100 (U.S. stocks) long never reached the 1R reduction point, and the account went flat after the stop-loss was triggered in the early hours of the 17th. After that, no new positions were opened: price was repeatedly near 24h highs or lows, nearby structure for a 1.5R take-profit was lacking, or tech-stock group constraints and U.S. market closures prevented entries. Funds remained in cash while waiting.
Day 19 of AI live trading. See you next time!
Steady progress, one step at a time; no effort is ever wasted.
Wang Xiaolou’s Trading Journal #14
Four closed trades: one win and three losses. Net asset value: 779.77U, down 6.38U this period. Now flat and waiting.
📅 Trading period: 2026-11-13 10:00 — 2026-11-18 10:00 (Shanghai)
No updates were issued for the periods on 11-15 and 11-16, so this period’s window starts from the previous update, #13 (11-13 10:00).
Ending net asset value: 779.77U (opening snapshot: 786.16U, 11-13 10:14), down 6.38U (−0.81%) this period. Realized PnL: −5.70U; unrealized PnL: 0.00U; fees: −0.21U; funding: +0.02U. Cumulative PnL: −24.23U (−3.01%).
Peak: 804.07U · Drawdown: 3.02% (24.30U)
Trade by trade:
Short kPEPE 0.00442→0.004648 (3x), −4.01U (stop-loss)
Short SOL 81.365→78.682 (3x), +4.87U (take-profit)
Long ETH 1964.6→1915.2 (3x), −3.50U (stop-loss)
Long XYZ100 (U.S. stocks) 27856→27144 (3x), −3.37U (stop-loss)
AI’s reasoning: The kPEPE and SOL shorts carried over from the previous period were closed at a stop-loss and take-profit, respectively. On the evening of the 13th, a trend-following ETH long was opened based on 1h+4h alignment, but it hit its stop-loss that same day. The XYZ100 (U.S. stocks) long never reached the 1R reduction point, and the account went flat after the stop-loss was triggered in the early hours of the 17th. After that, no new positions were opened: price was repeatedly near 24h highs or lows, nearby structure for a 1.5R take-profit was lacking, or tech-stock group constraints and U.S. market closures prevented entries. Funds remained in cash while waiting.
Day 19 of AI live trading. See you next time!
Steady progress, one step at a time; no effort is ever wasted.
Four closed trades: one win and three losses. Net asset value: 779.77U, down 6.38U this period. Now flat and waiting.
📅 Trading period: 2026-11-13 10:00 — 2026-11-18 10:00 (Shanghai)
No updates were issued for the periods on 11-15 and 11-16, so this period’s window starts from the previous update, #13 (11-13 10:00).
Ending net asset value: 779.77U (opening snapshot: 786.16U, 11-13 10:14), down 6.38U (−0.81%) this period. Realized PnL: −5.70U; unrealized PnL: 0.00U; fees: −0.21U; funding: +0.02U. Cumulative PnL: −24.23U (−3.01%).
Peak: 804.07U · Drawdown: 3.02% (24.30U)
Trade by trade:
Short kPEPE 0.00442→0.004648 (3x), −4.01U (stop-loss)
Short SOL 81.365→78.682 (3x), +4.87U (take-profit)
Long ETH 1964.6→1915.2 (3x), −3.50U (stop-loss)
Long XYZ100 (U.S. stocks) 27856→27144 (3x), −3.37U (stop-loss)
AI’s reasoning: The kPEPE and SOL shorts carried over from the previous period were closed at a stop-loss and take-profit, respectively. On the evening of the 13th, a trend-following ETH long was opened based on 1h+4h alignment, but it hit its stop-loss that same day. The XYZ100 (U.S. stocks) long never reached the 1R reduction point, and the account went flat after the stop-loss was triggered in the early hours of the 17th. After that, no new positions were opened: price was repeatedly near 24h highs or lows, nearby structure for a 1.5R take-profit was lacking, or tech-stock group constraints and U.S. market closures prevented entries. Funds remained in cash while waiting.
Day 19 of AI live trading. See you next time!
Steady progress, one step at a time; no effort is ever wasted.
284

·
--
$MUB Price Revisits Swing Low Following Recent Pullback
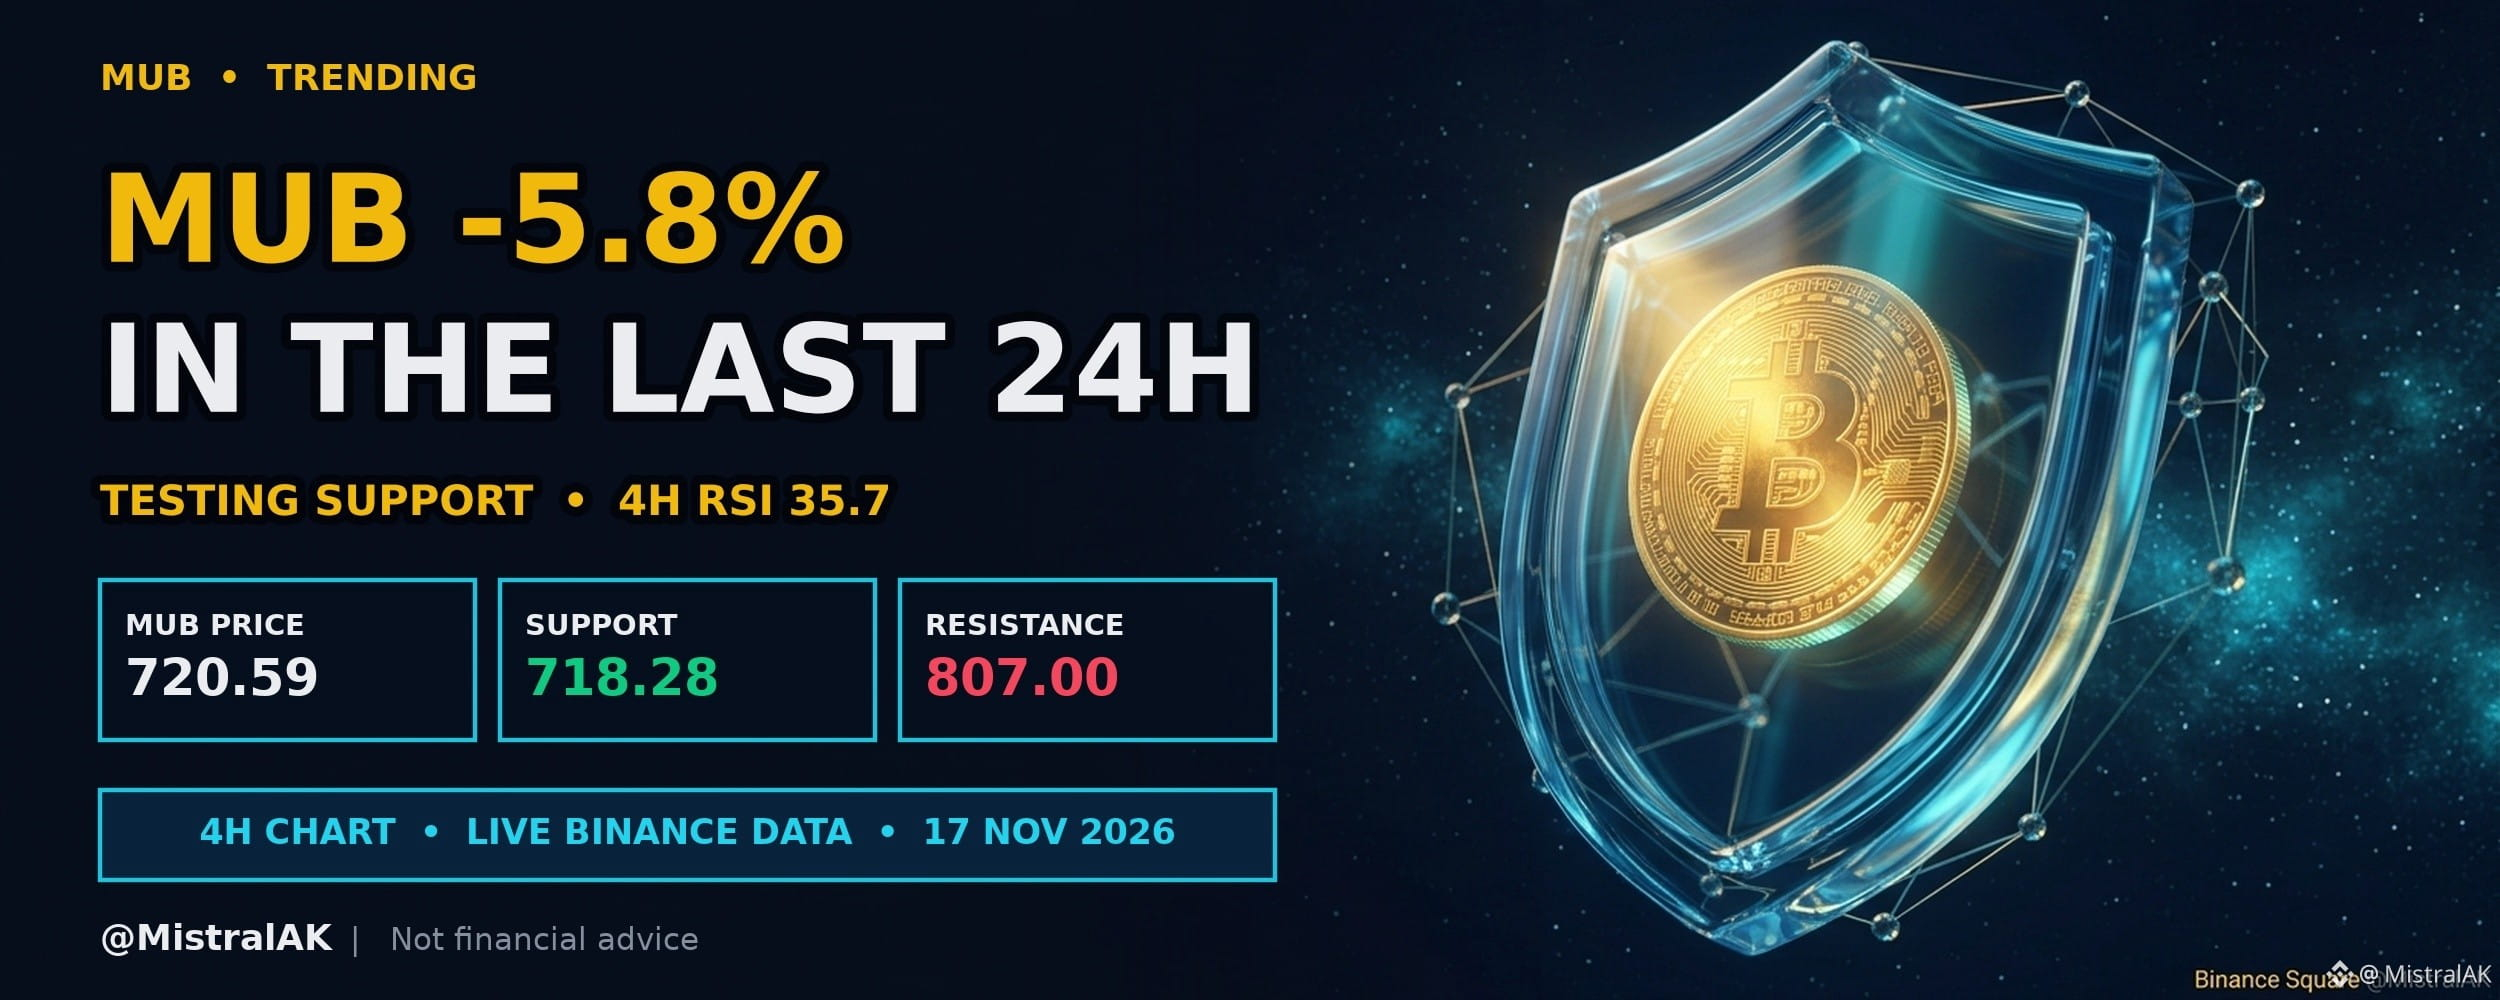
$MUB trades at 720.59 USD, down 5.8% over the past 24 hours, with 4H RSI at 35.7 (neutral).
Downward movement over the past twenty-four hours has brought price to test its twenty-candle swing low. On the four-hour chart, the relative strength index remains in the neutral zone, reflecting balanced momentum at this key level.
WHY IT IS ON THE RADAR
▪️ 24h move: -5.8%
▪️ 24h volume: 41M USDT (#13 among liquid USDT pairs)
KEY LEVELS
▪️ Resistance: 807.00 USD (20-candle 4H swing high)
▪️ Support: 718.28 USD (20-candle 4H swing low)
WHAT WOULD CONFIRM A HOLD
▪️ 4H candles defending 718.28 USD with a recovery above EMA 20 (752.62 USD)
WHAT WOULD INVALIDATE IT
▪️ A 4H close below 718.28 USD
Do you expect this swing low to hold or break on the four-hour chart?
Not financial advice. Always DYOR.
Like & Follow for Daily Trade Analytics & Insider News. @MistralAK
#MUB #Trending #TrendingTopic
{spot}(MUBUSDT)
$MUB Price Revisits Swing Low Following Recent Pullback
$MUB trades at 720.59 USD, down 5.8% over the past 24 hours, with 4H RSI at 35.7 (neutral).
Downward movement over the past twenty-four hours has brought price to test its twenty-candle swing low. On the four-hour chart, the relative strength index remains in the neutral zone, reflecting balanced momentum at this key level.
WHY IT IS ON THE RADAR
▪️ 24h move: -5.8%
▪️ 24h volume: 41M USDT (#13 among liquid USDT pairs)
KEY LEVELS
▪️ Resistance: 807.00 USD (20-candle 4H swing high)
▪️ Support: 718.28 USD (20-candle 4H swing low)
WHAT WOULD CONFIRM A HOLD
▪️ 4H candles defending 718.28 USD with a recovery above EMA 20 (752.62 USD)
WHAT WOULD INVALIDATE IT
▪️ A 4H close below 718.28 USD
Do you expect this swing low to hold or break on the four-hour chart?
Not financial advice. Always DYOR.
Like & Follow for Daily Trade Analytics & Insider News. @MistralAK
#MUB #Trending #TrendingTopic
$MUB trades at 720.59 USD, down 5.8% over the past 24 hours, with 4H RSI at 35.7 (neutral).
Downward movement over the past twenty-four hours has brought price to test its twenty-candle swing low. On the four-hour chart, the relative strength index remains in the neutral zone, reflecting balanced momentum at this key level.
WHY IT IS ON THE RADAR
▪️ 24h move: -5.8%
▪️ 24h volume: 41M USDT (#13 among liquid USDT pairs)
KEY LEVELS
▪️ Resistance: 807.00 USD (20-candle 4H swing high)
▪️ Support: 718.28 USD (20-candle 4H swing low)
WHAT WOULD CONFIRM A HOLD
▪️ 4H candles defending 718.28 USD with a recovery above EMA 20 (752.62 USD)
WHAT WOULD INVALIDATE IT
▪️ A 4H close below 718.28 USD
Do you expect this swing low to hold or break on the four-hour chart?
Not financial advice. Always DYOR.
Like & Follow for Daily Trade Analytics & Insider News. @MistralAK
#MUB #Trending #TrendingTopic
33
·
--
【Alpha New Listing Monitoring Report】2026-11-17 18:00
■ Sample: Alpha Top 30 (BSC 30 + Solana 30)
■ New in this period: 13 (BSC 13 / SOL 0)
■ Filtering criteria: Top 3 by liquidity, excluding those published within 24h
━━━━━━━━━━━━━━━
▸ $ARIA [BSC]
Liquidity 215.3万
Alpha ranking #13 (new)
1h inflow chart No
Smart money signal None
Overall score 1/6 · Low attention
▸ $ZEST [BSC]
Liquidity 135.8万
Alpha ranking #25 (new)
1h inflow chart No
Smart money signal None
Overall score 1/6 · Low attention
▸ $龙虾 [BSC]
Liquidity 131.1万
Alpha ranking #7 (new)
1h inflow chart No
Smart money signal None
Overall score 2/6 · Low attention
━━━━━━━━━━━━━━━
This report is automatically generated and does not constitute investment advice.
#$ARIA #$ZEST #$龙虾
【Alpha New Listing Monitoring Report】2026-11-17 18:00
■ Sample: Alpha Top 30 (BSC 30 + Solana 30)
■ New in this period: 13 (BSC 13 / SOL 0)
■ Filtering criteria: Top 3 by liquidity, excluding those published within 24h
━━━━━━━━━━━━━━━
▸ $ARIA [BSC]
Liquidity 215.3万
Alpha ranking #13 (new)
1h inflow chart No
Smart money signal None
Overall score 1/6 · Low attention
▸ $ZEST [BSC]
Liquidity 135.8万
Alpha ranking #25 (new)
1h inflow chart No
Smart money signal None
Overall score 1/6 · Low attention
▸ $龙虾 [BSC]
Liquidity 131.1万
Alpha ranking #7 (new)
1h inflow chart No
Smart money signal None
Overall score 2/6 · Low attention
━━━━━━━━━━━━━━━
This report is automatically generated and does not constitute investment advice.
#$ARIA #$ZEST #$龙虾
■ Sample: Alpha Top 30 (BSC 30 + Solana 30)
■ New in this period: 13 (BSC 13 / SOL 0)
■ Filtering criteria: Top 3 by liquidity, excluding those published within 24h
━━━━━━━━━━━━━━━
▸ $ARIA [BSC]
Liquidity 215.3万
Alpha ranking #13 (new)
1h inflow chart No
Smart money signal None
Overall score 1/6 · Low attention
▸ $ZEST [BSC]
Liquidity 135.8万
Alpha ranking #25 (new)
1h inflow chart No
Smart money signal None
Overall score 1/6 · Low attention
▸ $龙虾 [BSC]
Liquidity 131.1万
Alpha ranking #7 (new)
1h inflow chart No
Smart money signal None
Overall score 2/6 · Low attention
━━━━━━━━━━━━━━━
This report is automatically generated and does not constitute investment advice.
#$ARIA #$ZEST #$龙虾
740

·
--
Meme Wave #13
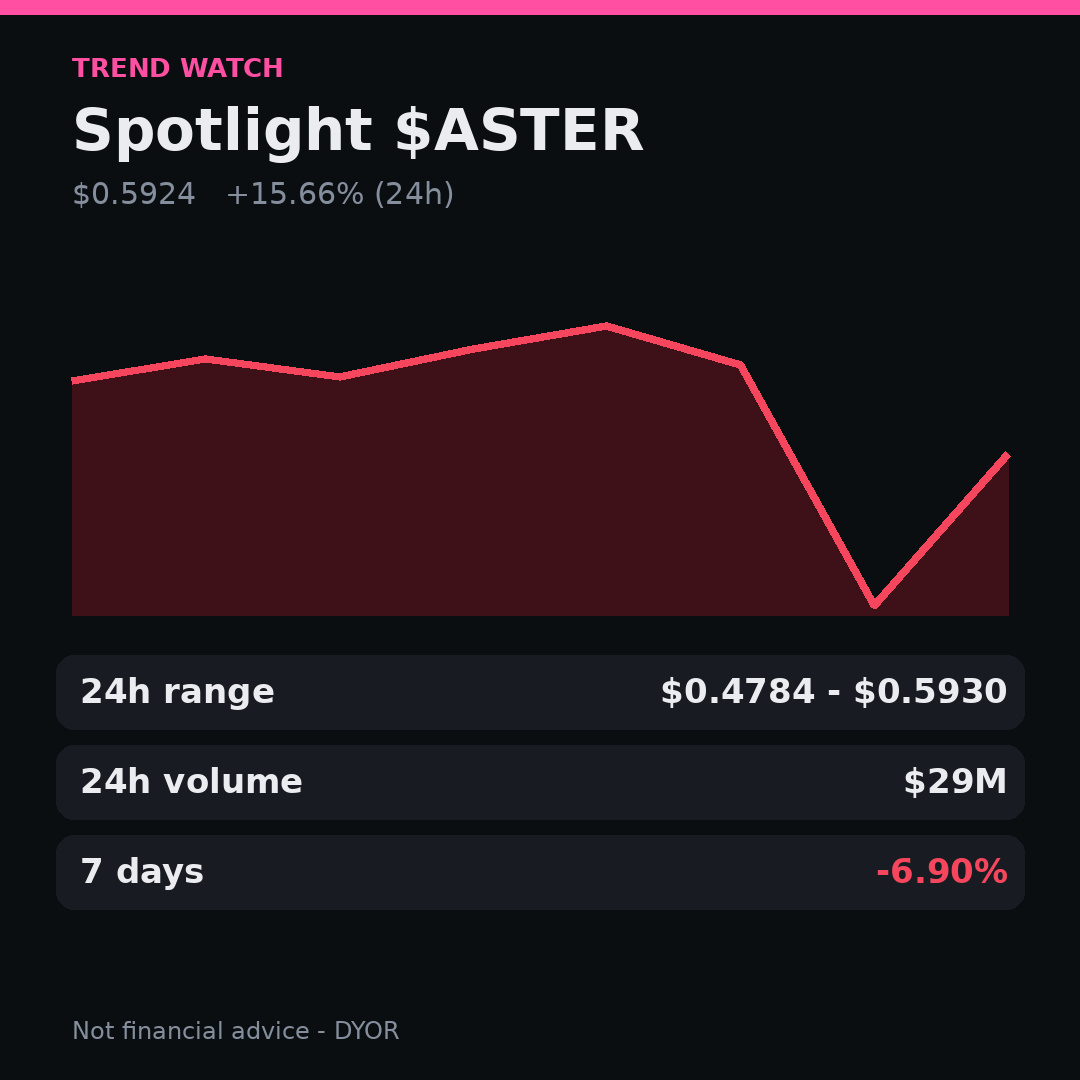
📈 $ASTER up +15.66% to $0.5924, 24h range $0.4784 - $0.5930 (±24.0%) and $29M volume.
7-day swing -6.90%. Anyone holding $ASTER, what was your entry?
NFA, always DYOR.
#ASTER #Altcoins
Meme Wave #13
📈 $ASTER up +15.66% to $0.5924, 24h range $0.4784 - $0.5930 (±24.0%) and $29M volume.
7-day swing -6.90%. Anyone holding $ASTER , what was your entry?
NFA, always DYOR.
#ASTER #Altcoins
📈 $ASTER up +15.66% to $0.5924, 24h range $0.4784 - $0.5930 (±24.0%) and $29M volume.
7-day swing -6.90%. Anyone holding $ASTER , what was your entry?
NFA, always DYOR.
#ASTER #Altcoins
369

·
--
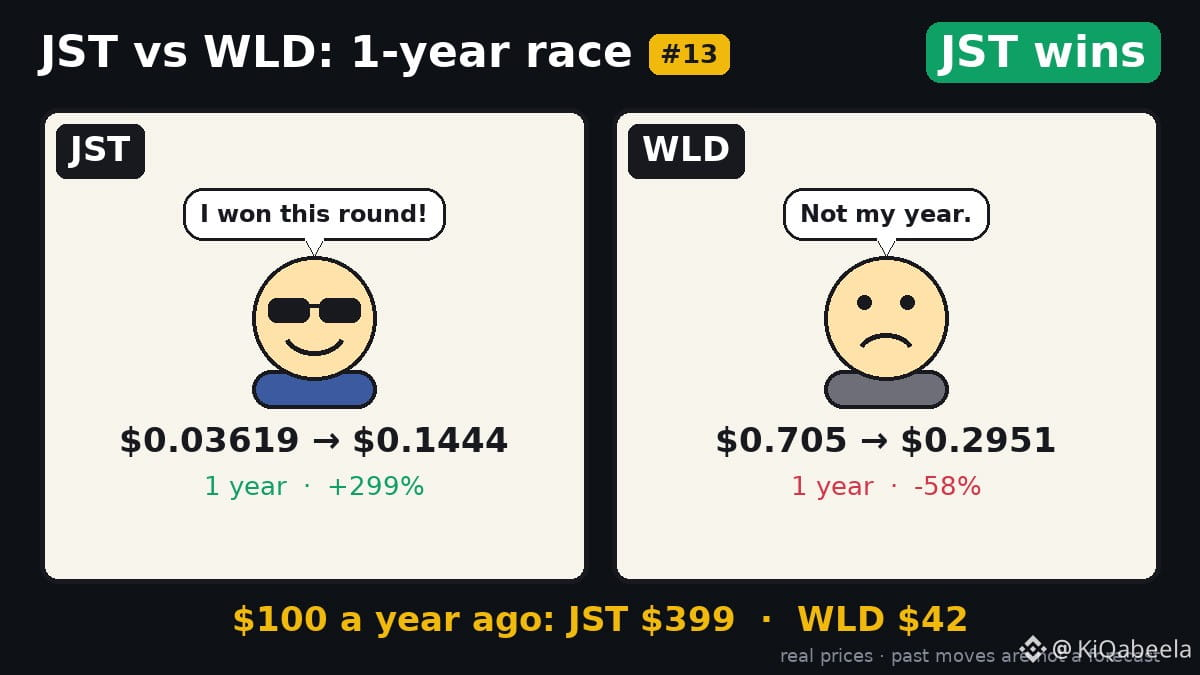
$100 → $399 vs $42: $JST outperforms $WLD in 1‑yr run
JST surged from $0.036 to $0.144, a 299% jump that turned $100 into $399. In contrast, WLD fell from $0.705 to $0.295, a 58% drop leaving $100 worth just $42.
Past moves say nothing about the next ones.
Which one? 💬
🎨 Coin vs Coin #13 · a new one every morning
#JST
$100 → $399 vs $42: $JST outperforms $WLD in 1‑yr run
JST surged from $0.036 to $0.144, a 299% jump that turned $100 into $399. In contrast, WLD fell from $0.705 to $0.295, a 58% drop leaving $100 worth just $42.
Past moves say nothing about the next ones.
Which one? 💬
🎨 Coin vs Coin #13 · a new one every morning
#JST
JST surged from $0.036 to $0.144, a 299% jump that turned $100 into $399. In contrast, WLD fell from $0.705 to $0.295, a 58% drop leaving $100 worth just $42.
Past moves say nothing about the next ones.
Which one? 💬
🎨 Coin vs Coin #13 · a new one every morning
#JST
77
·
--
Wang Xiaolou’s Trading Journal #13
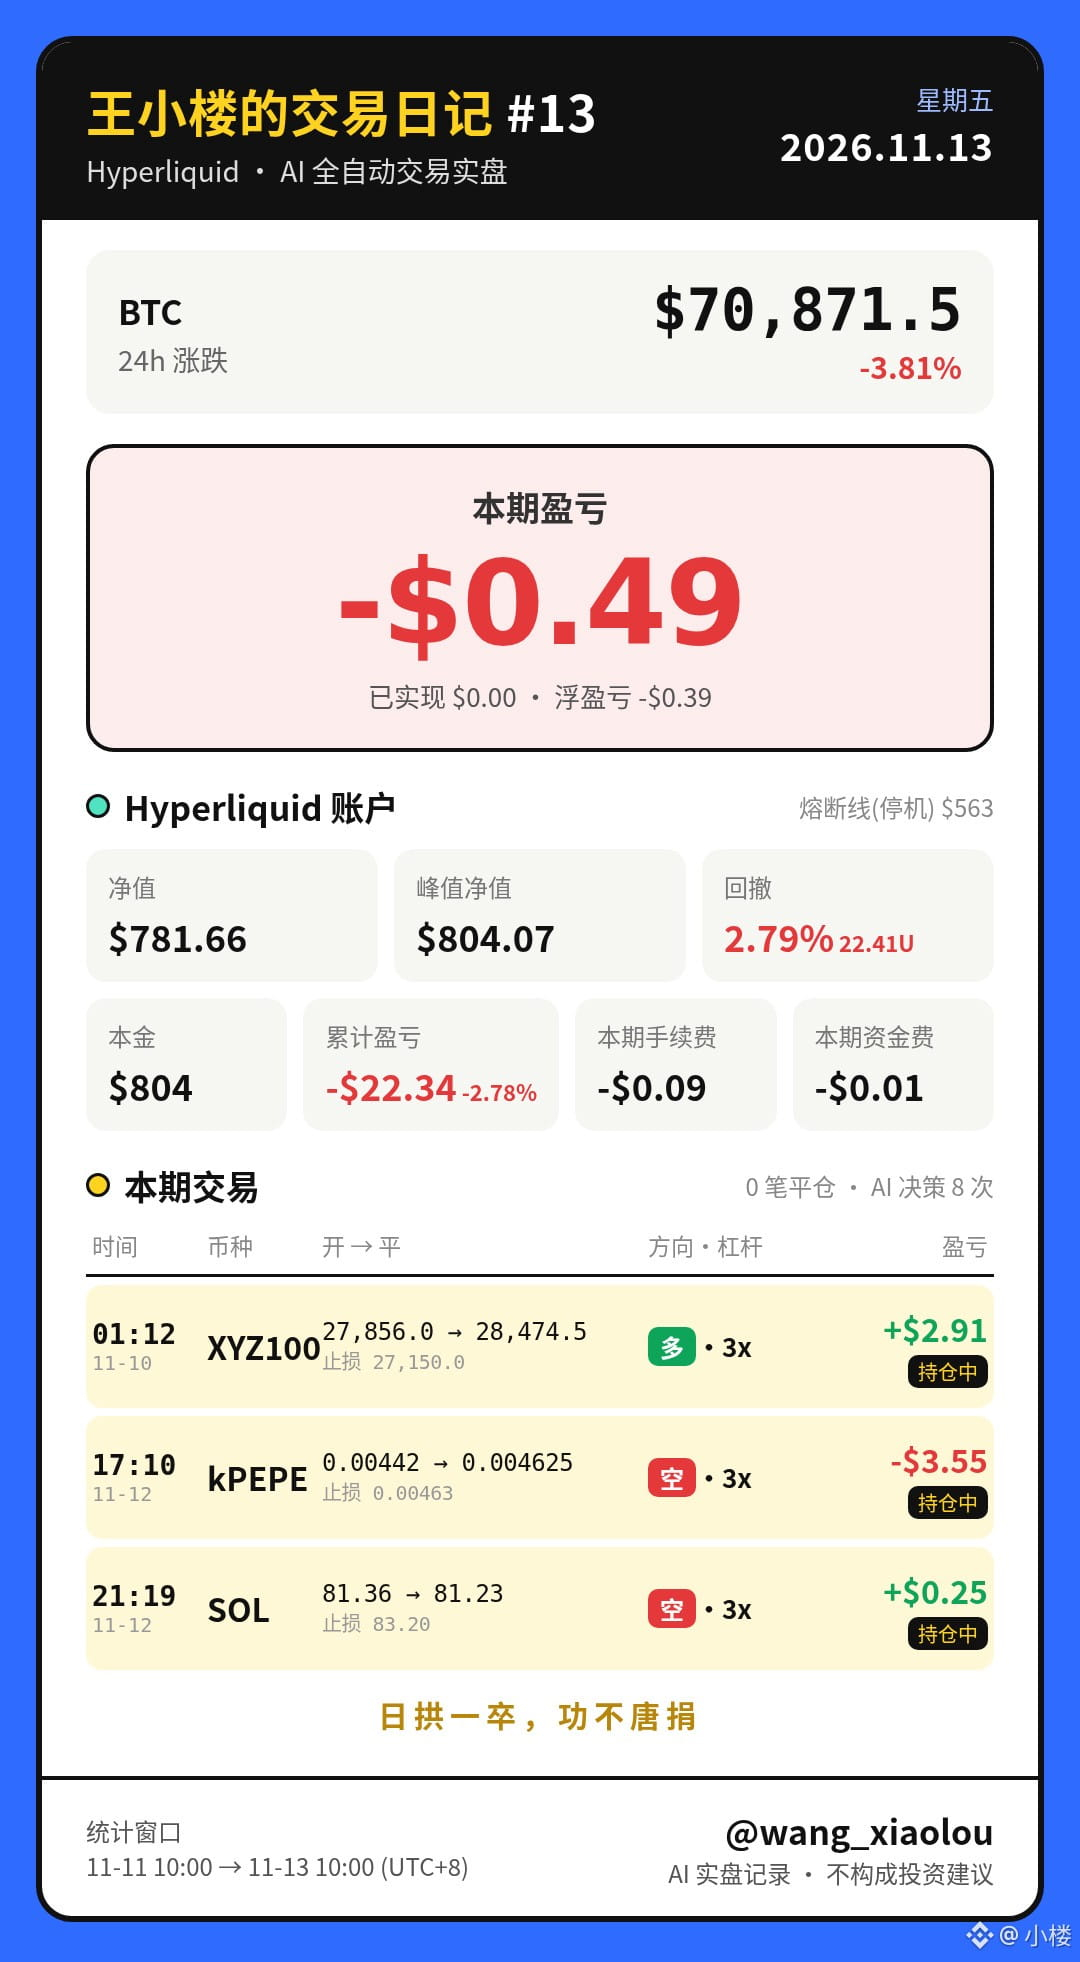
Opened two new trend shorts in kPEPE and SOL. Continued holding the XYZ100 index long. Small loss this period.
📅 Trading period: Nov 11, 10:00 — Nov 13, 10:00 (Shanghai)
Equity: 781.66U; this period: -0.49U (realized 0, unrealized -0.39, fees -0.09, funding -0.01)
Peak: 804.07U · Drawdown: 2.79% (22.41U)
Long XYZ100 (US stock index) 27856→28474.5 (3x), unrealized P&L +2.91U, continuing to hold
Short kPEPE 0.00442→0.004625 (3x), unrealized P&L -3.55U, continuing to hold
Short SOL 81.365→81.231 (3x), unrealized P&L +0.25U, continuing to hold
AI’s thought process: The XYZ100 long hadn’t reached the 1R scale-out point, so I kept holding and didn’t add to MU in the same group. On the afternoon of the 12th, I opened a trend short in kPEPE (the 1-hour and 4-hour trends were aligned to the downside; stop-loss at 0.00463, take-profit around 1.5R). In the evening, after SOL broke below the 4-hour lower band, I opened another trend short, with a stop-loss at 83.2 and take-profit at 78.7. None of the three positions have reached their scale-out points, so I’m continuing to hold. The kPEPE short is close to its stop-loss.
Day 14 of the AI live trading series. See you next time!
Steady progress every day; no effort is ever wasted.
Wang Xiaolou’s Trading Journal #13
Opened two new trend shorts in kPEPE and SOL. Continued holding the XYZ100 index long. Small loss this period.
📅 Trading period: Nov 11, 10:00 — Nov 13, 10:00 (Shanghai)
Equity: 781.66U; this period: -0.49U (realized 0, unrealized -0.39, fees -0.09, funding -0.01)
Peak: 804.07U · Drawdown: 2.79% (22.41U)
Long XYZ100 (US stock index) 27856→28474.5 (3x), unrealized P&L +2.91U, continuing to hold
Short kPEPE 0.00442→0.004625 (3x), unrealized P&L -3.55U, continuing to hold
Short SOL 81.365→81.231 (3x), unrealized P&L +0.25U, continuing to hold
AI’s thought process: The XYZ100 long hadn’t reached the 1R scale-out point, so I kept holding and didn’t add to MU in the same group. On the afternoon of the 12th, I opened a trend short in kPEPE (the 1-hour and 4-hour trends were aligned to the downside; stop-loss at 0.00463, take-profit around 1.5R). In the evening, after SOL broke below the 4-hour lower band, I opened another trend short, with a stop-loss at 83.2 and take-profit at 78.7. None of the three positions have reached their scale-out points, so I’m continuing to hold. The kPEPE short is close to its stop-loss.
Day 14 of the AI live trading series. See you next time!
Steady progress every day; no effort is ever wasted.
Opened two new trend shorts in kPEPE and SOL. Continued holding the XYZ100 index long. Small loss this period.
📅 Trading period: Nov 11, 10:00 — Nov 13, 10:00 (Shanghai)
Equity: 781.66U; this period: -0.49U (realized 0, unrealized -0.39, fees -0.09, funding -0.01)
Peak: 804.07U · Drawdown: 2.79% (22.41U)
Long XYZ100 (US stock index) 27856→28474.5 (3x), unrealized P&L +2.91U, continuing to hold
Short kPEPE 0.00442→0.004625 (3x), unrealized P&L -3.55U, continuing to hold
Short SOL 81.365→81.231 (3x), unrealized P&L +0.25U, continuing to hold
AI’s thought process: The XYZ100 long hadn’t reached the 1R scale-out point, so I kept holding and didn’t add to MU in the same group. On the afternoon of the 12th, I opened a trend short in kPEPE (the 1-hour and 4-hour trends were aligned to the downside; stop-loss at 0.00463, take-profit around 1.5R). In the evening, after SOL broke below the 4-hour lower band, I opened another trend short, with a stop-loss at 83.2 and take-profit at 78.7. None of the three positions have reached their scale-out points, so I’m continuing to hold. The kPEPE short is close to its stop-loss.
Day 14 of the AI live trading series. See you next time!
Steady progress every day; no effort is ever wasted.
197
·
--
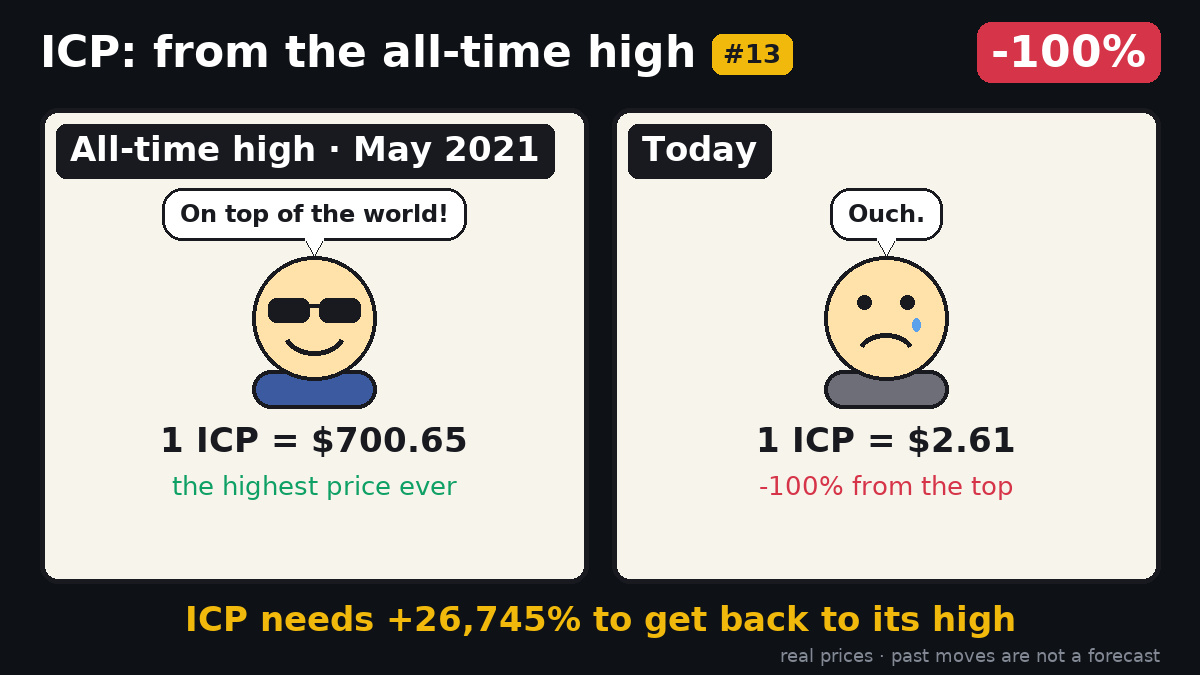
Would you have held $ICP through a 99.6% drop from $700?
The all‑time high for $ICP was $700.65 on 2021‑05‑10. Today it trades around $2.61, a plunge of roughly 100% from that peak.
To return to that level, the price would need to climb about 26,745%. Past moves say nothing about the next ones.
Yes?
🎨 From the Top #13 · a new one every morning
#ICP
Would you have held $ICP through a 99.6% drop from $700?
The all‑time high for $ICP was $700.65 on 2021‑05‑10. Today it trades around $2.61, a plunge of roughly 100% from that peak.
To return to that level, the price would need to climb about 26,745%. Past moves say nothing about the next ones.
Yes?
🎨 From the Top #13 · a new one every morning
#ICP
The all‑time high for $ICP was $700.65 on 2021‑05‑10. Today it trades around $2.61, a plunge of roughly 100% from that peak.
To return to that level, the price would need to climb about 26,745%. Past moves say nothing about the next ones.
Yes?
🎨 From the Top #13 · a new one every morning
#ICP
105
·
--
【Alpha New Listing Monitoring Report】2026-11-12 18:00
■ Sample: Alpha Top 30 (BSC 30 + Solana 30)
■ New this period: 8 (BSC 8 / SOL 0)
■ Filters: Top 3 by liquidity, excluding tokens launched within the past 24 hours
━━━━━━━━━━━━━━━
▸ $DGAI [BSC]
Liquidity 271.3万
Alpha Rank #27 (New)
1h Inflow List No
Smart Money Signal None
Overall Score 1/6 · Low attention
▸ $HANA [BSC]
Liquidity 105.7万
Alpha Rank #13 (New)
1h Inflow List No
Smart Money Signal None
Overall Score 1/6 · Low attention
▸ $CT [BSC]
Liquidity 101.6万
Alpha Rank #25 (New)
1h Inflow List No
Smart Money Signal None
Overall Score 1/6 · Low attention
━━━━━━━━━━━━━━━
This report was generated automatically and does not constitute investment advice.
#$DGAI #$HANA #$CT
【Alpha New Listing Monitoring Report】2026-11-12 18:00
■ Sample: Alpha Top 30 (BSC 30 + Solana 30)
■ New this period: 8 (BSC 8 / SOL 0)
■ Filters: Top 3 by liquidity, excluding tokens launched within the past 24 hours
━━━━━━━━━━━━━━━
▸ $DGAI [BSC]
Liquidity 271.3万
Alpha Rank #27 (New)
1h Inflow List No
Smart Money Signal None
Overall Score 1/6 · Low attention
▸ $HANA [BSC]
Liquidity 105.7万
Alpha Rank #13 (New)
1h Inflow List No
Smart Money Signal None
Overall Score 1/6 · Low attention
▸ $CT [BSC]
Liquidity 101.6万
Alpha Rank #25 (New)
1h Inflow List No
Smart Money Signal None
Overall Score 1/6 · Low attention
━━━━━━━━━━━━━━━
This report was generated automatically and does not constitute investment advice.
#$DGAI #$HANA #$CT
■ Sample: Alpha Top 30 (BSC 30 + Solana 30)
■ New this period: 8 (BSC 8 / SOL 0)
■ Filters: Top 3 by liquidity, excluding tokens launched within the past 24 hours
━━━━━━━━━━━━━━━
▸ $DGAI [BSC]
Liquidity 271.3万
Alpha Rank #27 (New)
1h Inflow List No
Smart Money Signal None
Overall Score 1/6 · Low attention
▸ $HANA [BSC]
Liquidity 105.7万
Alpha Rank #13 (New)
1h Inflow List No
Smart Money Signal None
Overall Score 1/6 · Low attention
▸ $CT [BSC]
Liquidity 101.6万
Alpha Rank #25 (New)
1h Inflow List No
Smart Money Signal None
Overall Score 1/6 · Low attention
━━━━━━━━━━━━━━━
This report was generated automatically and does not constitute investment advice.
#$DGAI #$HANA #$CT
1
935

$DOGE spot check — the original meme coin just hit its lowest since November 2023.
📉 Price: ~$0.068, -2% in 24h, -9.5% this week, -21% this month. Market cap ~$10.7B, still rank #13.
🔑 Levels: support $0.067, then $0.0666 (today's low). Resistance $0.0688, then the $0.070 zone traders are watching. A daily close below $0.067 weakens it further; reclaiming $0.070 flips the mood.
📰 Spot DOGE ETFs: zero net flows for a 19th straight day — no fresh money coming in. And 21Shares just ended its support deal for the TDOG Dogecoin ETF.
💡 BTC holding ~$73,600 is the only thing keeping DOGE from worse. If BTC breaks $72,700, DOGE likely tests $0.065.
Verdict: meme season is on pause — DOGE needs BTC to stabilize first.
Not financial advice. DYOR.
$DOGE spot check — the original meme coin just hit its lowest since November 2023.
📉 Price: ~$0.068, -2% in 24h, -9.5% this week, -21% this month. Market cap ~$10.7B, still rank #13.
🔑 Levels: support $0.067, then $0.0666 (today's low). Resistance $0.0688, then the $0.070 zone traders are watching. A daily close below $0.067 weakens it further; reclaiming $0.070 flips the mood.
📰 Spot DOGE ETFs: zero net flows for a 19th straight day — no fresh money coming in. And 21Shares just ended its support deal for the TDOG Dogecoin ETF.
💡 BTC holding ~$73,600 is the only thing keeping DOGE from worse. If BTC breaks $72,700, DOGE likely tests $0.065.
Verdict: meme season is on pause — DOGE needs BTC to stabilize first.
Not financial advice. DYOR.
📉 Price: ~$0.068, -2% in 24h, -9.5% this week, -21% this month. Market cap ~$10.7B, still rank #13.
🔑 Levels: support $0.067, then $0.0666 (today's low). Resistance $0.0688, then the $0.070 zone traders are watching. A daily close below $0.067 weakens it further; reclaiming $0.070 flips the mood.
📰 Spot DOGE ETFs: zero net flows for a 19th straight day — no fresh money coming in. And 21Shares just ended its support deal for the TDOG Dogecoin ETF.
💡 BTC holding ~$73,600 is the only thing keeping DOGE from worse. If BTC breaks $72,700, DOGE likely tests $0.065.
Verdict: meme season is on pause — DOGE needs BTC to stabilize first.
Not financial advice. DYOR.
30

·
--
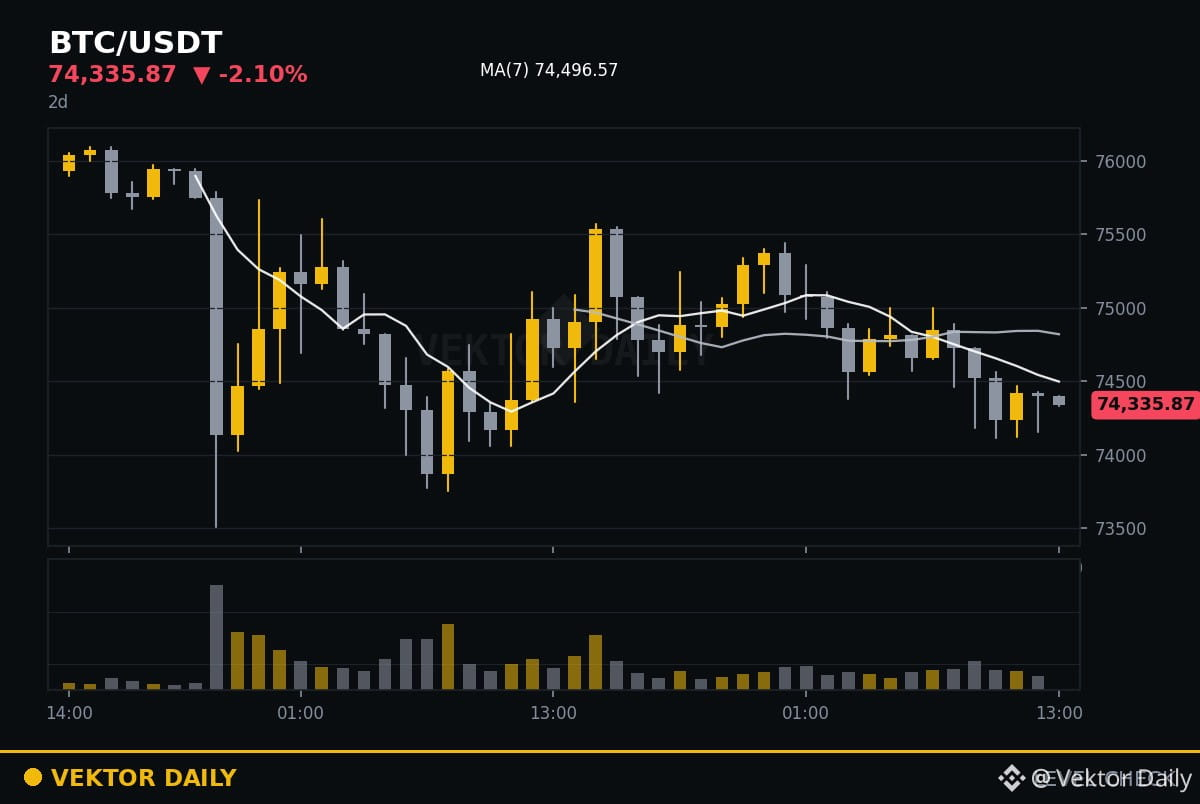
👀 Level Check #13: $BTC
Now 74 336
24h high 75 568
24h low 74 116
Yesterday's check (#12, BNB): it broke below its range (693.40 to 702.00).
Series record: range held 2 of 12 days.
These are just the edges of the last day, not a forecast.
Inside or outside by tomorrow?
Not financial advice.
#LevelCheck #VektorDaily
👀 Level Check #13: $BTC
Now 74 336
24h high 75 568
24h low 74 116
Yesterday's check (#12, BNB): it broke below its range (693.40 to 702.00).
Series record: range held 2 of 12 days.
These are just the edges of the last day, not a forecast.
Inside or outside by tomorrow?
Not financial advice.
#LevelCheck #VektorDaily
Now 74 336
24h high 75 568
24h low 74 116
Yesterday's check (#12, BNB): it broke below its range (693.40 to 702.00).
Series record: range held 2 of 12 days.
These are just the edges of the last day, not a forecast.
Inside or outside by tomorrow?
Not financial advice.
#LevelCheck #VektorDaily
2

·
--
On the eve of CPI, $75,000 got kicked down again—but bounced back this time.
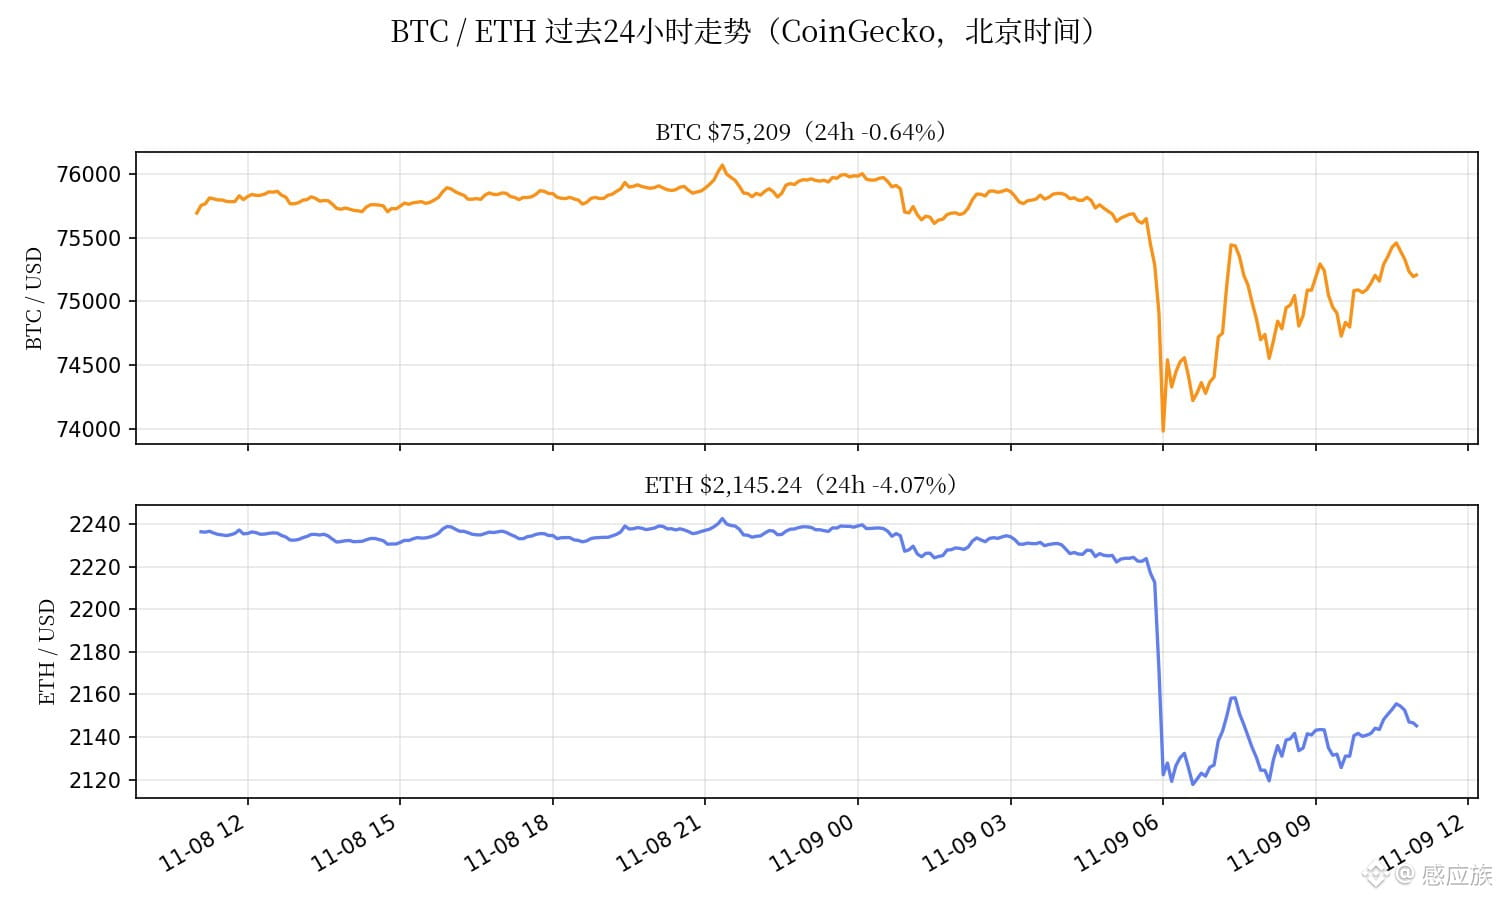
At 11:02, $BTC was around $75,214, down 0.6% over 24 hours; $ETH was around $2,146, down 3.9% (live CoinGecko data). The 06:00 candle this morning hit a low of $73,981—the price lost $75,000 again, then reclaimed it again. Honestly, this level is looking more fragile with every test: TradingKey says this morning’s low was the lowest since August. A break below $74,000 puts $72,000 in view, while a decisive loss of $75,000 points to $65,000–$67,000 technically.
Short trade update #13: Opened a short at $75,800–$76,100 on November 7 at 13:00, with a $75,950 average entry. At the current price of $75,214, the price is down 0.97%, putting unrealized profit at around +97% on 100x margin—basically unchanged from +100% at 09:02 this morning. It’s been flat all morning. The $77,500 stop-loss and invalidation on a 4-hour close above $76,250 have both stayed untouched, so I’m holding. Targets remain $73,200 (take half off there) / $68,000.
Tomorrow is the real test: US October CPI comes out tomorrow morning, with core CPI expected to rise 0.2% month over month (coinlab data). After the stronger-than-expected jobs report, the odds of a 25-basis-point rate hike in December have already climbed to 76%–80%. Hotter-than-expected CPI → firmer rate-hike expectations → $75,000 may genuinely fail to hold; cooler-than-expected CPI → a relief bounce, but we’d need to reclaim $78,000 to turn bullish. There are also 7,932 BTC options expiring at 16:00 this afternoon, with a max pain level of $76,000. Prices may be pulled toward $76,000, but don’t count on it as support.
My plan hasn’t changed: keep holding the short; consider adding if it bounces back to around $75,300–$75,500, or after a 4-hour close below $75,000. I’ll only turn bullish if it reclaims and holds above $78,000. No trades in the hour before or after the CPI release. With 100x margin, I’m only putting a very small portion of my total funds at risk.
Janction is still up 226% in a day on the trending list, and PEPE is up 6.6%. I treat small caps as sentiment gauges, not trades. Do you think tomorrow’s CPI will come in hot or cool? Let’s talk in the comments. (Prices: live CoinGecko data captured November 9 at 11:02 Beijing time; chart shows the past 24 hours)
On the eve of CPI, $75,000 got kicked down again—but bounced back this time.
At 11:02, $BTC was around $75,214, down 0.6% over 24 hours; $ETH was around $2,146, down 3.9% (live CoinGecko data). The 06:00 candle this morning hit a low of $73,981—the price lost $75,000 again, then reclaimed it again. Honestly, this level is looking more fragile with every test: TradingKey says this morning’s low was the lowest since August. A break below $74,000 puts $72,000 in view, while a decisive loss of $75,000 points to $65,000–$67,000 technically.
Short trade update #13: Opened a short at $75,800–$76,100 on November 7 at 13:00, with a $75,950 average entry. At the current price of $75,214, the price is down 0.97%, putting unrealized profit at around +97% on 100x margin—basically unchanged from +100% at 09:02 this morning. It’s been flat all morning. The $77,500 stop-loss and invalidation on a 4-hour close above $76,250 have both stayed untouched, so I’m holding. Targets remain $73,200 (take half off there) / $68,000.
Tomorrow is the real test: US October CPI comes out tomorrow morning, with core CPI expected to rise 0.2% month over month (coinlab data). After the stronger-than-expected jobs report, the odds of a 25-basis-point rate hike in December have already climbed to 76%–80%. Hotter-than-expected CPI → firmer rate-hike expectations → $75,000 may genuinely fail to hold; cooler-than-expected CPI → a relief bounce, but we’d need to reclaim $78,000 to turn bullish. There are also 7,932 BTC options expiring at 16:00 this afternoon, with a max pain level of $76,000. Prices may be pulled toward $76,000, but don’t count on it as support.
My plan hasn’t changed: keep holding the short; consider adding if it bounces back to around $75,300–$75,500, or after a 4-hour close below $75,000. I’ll only turn bullish if it reclaims and holds above $78,000. No trades in the hour before or after the CPI release. With 100x margin, I’m only putting a very small portion of my total funds at risk.
Janction is still up 226% in a day on the trending list, and PEPE is up 6.6%. I treat small caps as sentiment gauges, not trades. Do you think tomorrow’s CPI will come in hot or cool? Let’s talk in the comments. (Prices: live CoinGecko data captured November 9 at 11:02 Beijing time; chart shows the past 24 hours)
At 11:02, $BTC was around $75,214, down 0.6% over 24 hours; $ETH was around $2,146, down 3.9% (live CoinGecko data). The 06:00 candle this morning hit a low of $73,981—the price lost $75,000 again, then reclaimed it again. Honestly, this level is looking more fragile with every test: TradingKey says this morning’s low was the lowest since August. A break below $74,000 puts $72,000 in view, while a decisive loss of $75,000 points to $65,000–$67,000 technically.
Short trade update #13: Opened a short at $75,800–$76,100 on November 7 at 13:00, with a $75,950 average entry. At the current price of $75,214, the price is down 0.97%, putting unrealized profit at around +97% on 100x margin—basically unchanged from +100% at 09:02 this morning. It’s been flat all morning. The $77,500 stop-loss and invalidation on a 4-hour close above $76,250 have both stayed untouched, so I’m holding. Targets remain $73,200 (take half off there) / $68,000.
Tomorrow is the real test: US October CPI comes out tomorrow morning, with core CPI expected to rise 0.2% month over month (coinlab data). After the stronger-than-expected jobs report, the odds of a 25-basis-point rate hike in December have already climbed to 76%–80%. Hotter-than-expected CPI → firmer rate-hike expectations → $75,000 may genuinely fail to hold; cooler-than-expected CPI → a relief bounce, but we’d need to reclaim $78,000 to turn bullish. There are also 7,932 BTC options expiring at 16:00 this afternoon, with a max pain level of $76,000. Prices may be pulled toward $76,000, but don’t count on it as support.
My plan hasn’t changed: keep holding the short; consider adding if it bounces back to around $75,300–$75,500, or after a 4-hour close below $75,000. I’ll only turn bullish if it reclaims and holds above $78,000. No trades in the hour before or after the CPI release. With 100x margin, I’m only putting a very small portion of my total funds at risk.
Janction is still up 226% in a day on the trending list, and PEPE is up 6.6%. I treat small caps as sentiment gauges, not trades. Do you think tomorrow’s CPI will come in hot or cool? Let’s talk in the comments. (Prices: live CoinGecko data captured November 9 at 11:02 Beijing time; chart shows the past 24 hours)
156

·
--
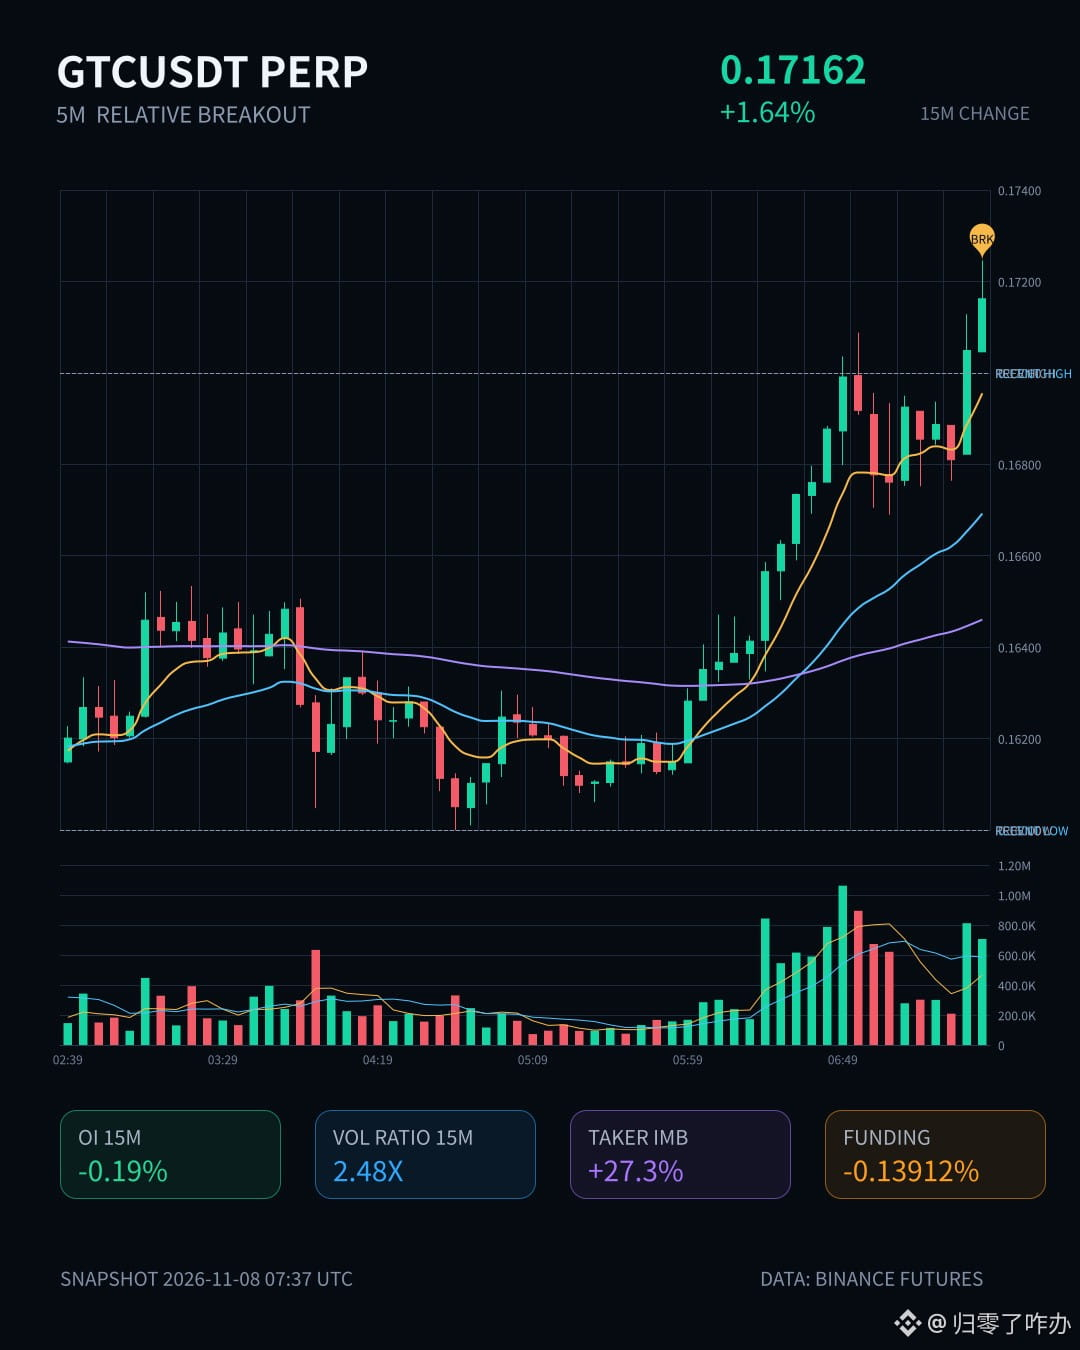
$GTC has made an interesting move: up 1.64% in 15m, with volume surging to 2.48x and a buy/sell ratio of 1.75, showing clear dominance by aggressive buyers.
But the OI picture is a little subtle—1h futures OI dropped nearly 3% while the price rose. This price-up, OI-down setup looks more like a short squeeze than fresh longs entering. The close has just broken above the high of the past 20 5m candles, with volume confirming the move. Short-term sentiment has heated up, but its staying power is questionable.
The abnormal percentile is 92.3%, ranking #13 across the entire pool. 24h trading volume is only a little over 18M, so liquidity isn't particularly deep: it's easy to push the price up, but it can fall just as quickly. I'm not comfortable chasing longs at this level; better to wait for a pullback and confirmation.
$GTC has made an interesting move: up 1.64% in 15m, with volume surging to 2.48x and a buy/sell ratio of 1.75, showing clear dominance by aggressive buyers.
But the OI picture is a little subtle—1h futures OI dropped nearly 3% while the price rose. This price-up, OI-down setup looks more like a short squeeze than fresh longs entering. The close has just broken above the high of the past 20 5m candles, with volume confirming the move. Short-term sentiment has heated up, but its staying power is questionable.
The abnormal percentile is 92.3%, ranking #13 across the entire pool. 24h trading volume is only a little over 18M, so liquidity isn't particularly deep: it's easy to push the price up, but it can fall just as quickly. I'm not comfortable chasing longs at this level; better to wait for a pullback and confirmation.
But the OI picture is a little subtle—1h futures OI dropped nearly 3% while the price rose. This price-up, OI-down setup looks more like a short squeeze than fresh longs entering. The close has just broken above the high of the past 20 5m candles, with volume confirming the move. Short-term sentiment has heated up, but its staying power is questionable.
The abnormal percentile is 92.3%, ranking #13 across the entire pool. 24h trading volume is only a little over 18M, so liquidity isn't particularly deep: it's easy to push the price up, but it can fall just as quickly. I'm not comfortable chasing longs at this level; better to wait for a pullback and confirmation.
41

·
--
$ESPORTS This drop has some weight behind it. The 15m chart plunged 2.68%, volume surged to 3.97 times normal, and the Z-score hit 4.64—clearly not normal volatility.
The key is OI: futures OI fell 0.92% over 15m and 2.90% over 1h, with notional value down 580K over 1h. Price down + OI down—that's a classic long deleveraging pattern, not fresh shorts entering. Net aggressive trading volume was -21.5%, and the buy/sell ratio was 0.65. Selling pressure is real, but it looks more like stop-losses getting swept.
The OI anomaly ranks in the 96.2th percentile, #5 across the entire pool, while notional change ranks #13. The move has persisted across multiple timeframes. The close also broke below the lower end of the range formed by the last 20 5m candles, nearing historically extreme levels.
I lean toward viewing this as position contraction rather than the start of a trend reversal. But with volume this elevated, don't rush to buy the dip in the short term. Wait for OI to stabilize, then reassess.
$ESPORTS This drop has some weight behind it. The 15m chart plunged 2.68%, volume surged to 3.97 times normal, and the Z-score hit 4.64—clearly not normal volatility.
The key is OI: futures OI fell 0.92% over 15m and 2.90% over 1h, with notional value down 580K over 1h. Price down + OI down—that's a classic long deleveraging pattern, not fresh shorts entering. Net aggressive trading volume was -21.5%, and the buy/sell ratio was 0.65. Selling pressure is real, but it looks more like stop-losses getting swept.
The OI anomaly ranks in the 96.2th percentile, #5 across the entire pool, while notional change ranks #13. The move has persisted across multiple timeframes. The close also broke below the lower end of the range formed by the last 20 5m candles, nearing historically extreme levels.
I lean toward viewing this as position contraction rather than the start of a trend reversal. But with volume this elevated, don't rush to buy the dip in the short term. Wait for OI to stabilize, then reassess.
The key is OI: futures OI fell 0.92% over 15m and 2.90% over 1h, with notional value down 580K over 1h. Price down + OI down—that's a classic long deleveraging pattern, not fresh shorts entering. Net aggressive trading volume was -21.5%, and the buy/sell ratio was 0.65. Selling pressure is real, but it looks more like stop-losses getting swept.
The OI anomaly ranks in the 96.2th percentile, #5 across the entire pool, while notional change ranks #13. The move has persisted across multiple timeframes. The close also broke below the lower end of the range formed by the last 20 5m candles, nearing historically extreme levels.
I lean toward viewing this as position contraction rather than the start of a trend reversal. But with volume this elevated, don't rush to buy the dip in the short term. Wait for OI to stabilize, then reassess.
29
Log in to explore more content
Join global crypto users on Binance Square
⚡️ Get latest and useful information about crypto.
💬 Trusted by the world’s largest crypto exchange.
👍 Discover real insights from verified creators.
Email / Phone number
Trending Topics
1
#NvidiaLoses$2.7TrillionInMonthAndAHalf
2,852 views
65 Discussing
2
#CanBTCReboundAfterFallingBelow60K?
582,639 views
2,545 Discussing
3
#GlobalStocksFaceLongestLosingStreakSince2023
201,971 views
1,765 Discussing
4
#BlackRockIBITPostsRecord$541MSingleDayOutflow
18,677 views
61 Discussing
5
#AnthropicPlungesTowardIPOPriceonDay2
100,510 views
1,047 Discussing
6
#TwentyOneCapitalAdds172.25BTC
42,165 views
529 Discussing
7
#HKBillWouldExcludeTokenizedDepositsFromVirtualAssets
4,329 views
48 Discussing
8
#BNBDropsBelow540USDTWith8.46%DailyDecline
57,786 views
551 Discussing
9
#HKBillProposesHK$100KFineForUnauthorizedCryptoTitles
1,958 views
20 Discussing
10
#BitMineFaces$10.1BUnrealizedETHLoss
4,195 views
25 Discussing