
#27
27
21,598 views
200 Discussing
Hot
Latest

·
--
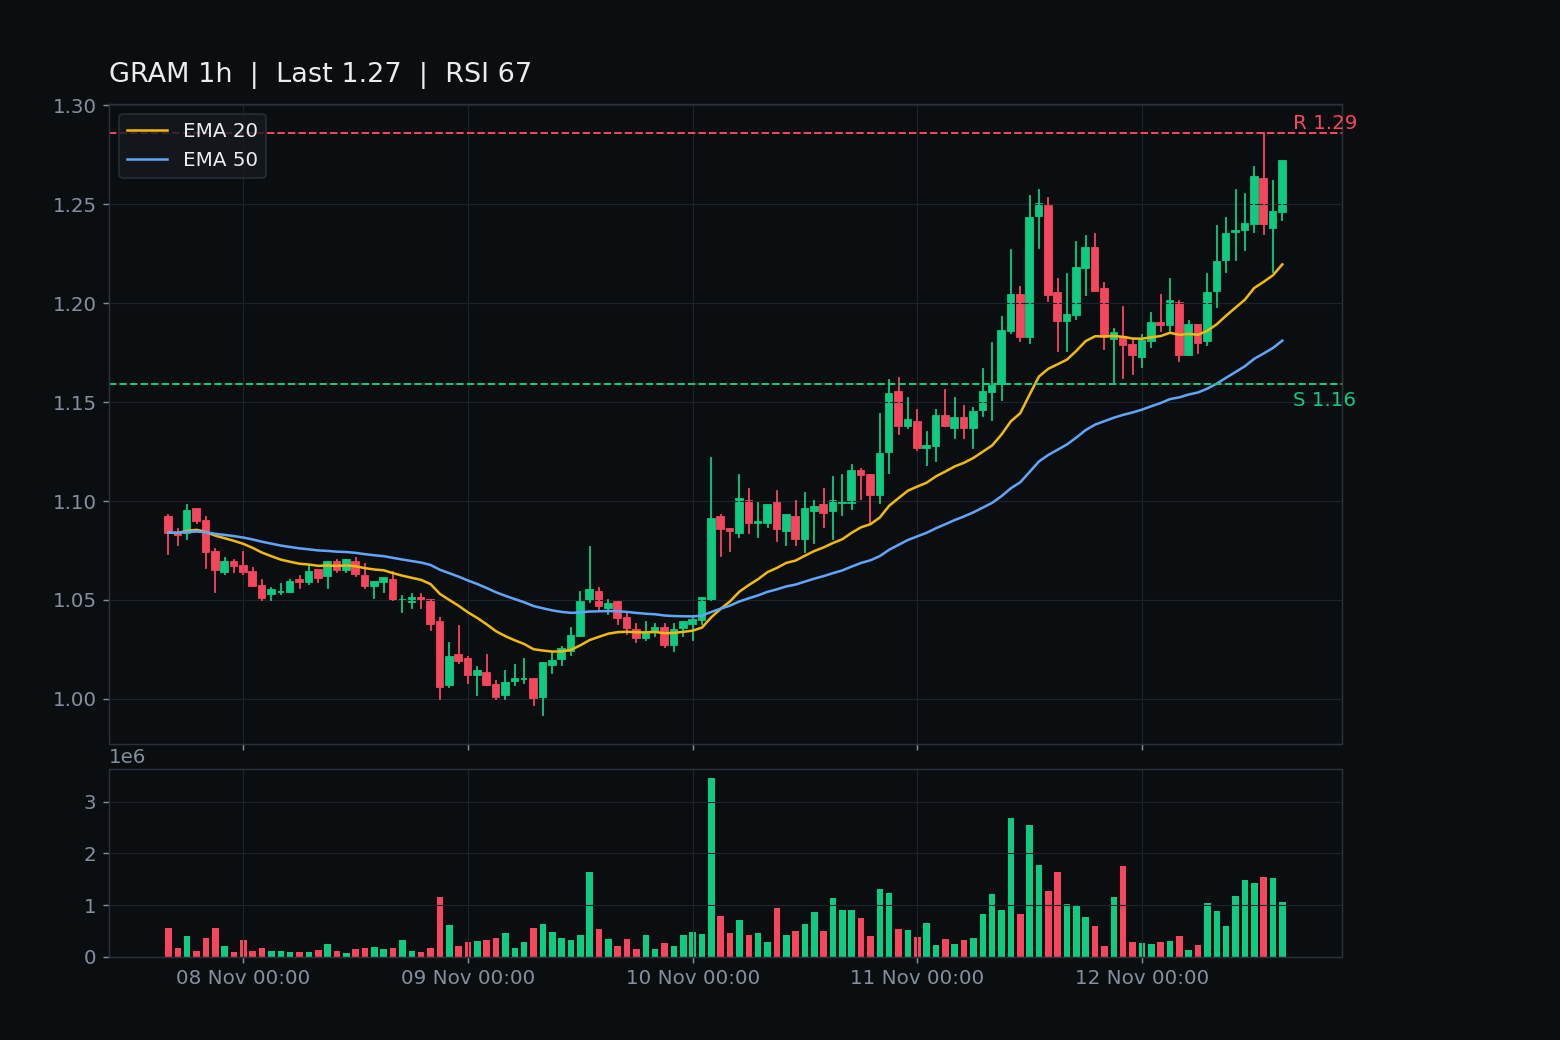
$1.272 — the close that rewrote $GRAM's day.
The 15:00 UTC candle closed $1.272, the first closed hour above the $1.257 ceiling since the midday take — and the first close above the $1.269 open-air line. It closed at the top of its own hour, on $1.32M.
Rewind the tape: 12:00 took the ceiling at $1.264. 13:00 printed the day's heaviest bar ($1.95M) and closed right back under it at $1.240. Three straight closes under. The extension was unwritten — until 15:00 rewrote it.
Live $1.279, +8.5% on $24.0M of Binance volume, while BTC bleeds at $72,134 (-2.7%, fresh low $71,255). GRAM is diverging from the board, not riding it. Rank #27, $3.67B — a large cap moving on its own tape, not a microcap wick.
The honest side: RSI 67 is warming, and the 13:00 rejection came on the heaviest volume of the day. One hourly close back under $1.257 unwrites this chapter the same way 13:00 unwrote the last one. The forming hour is printing $1.279, unclosed — its 17:00 UTC close decides whether $1.290, the 24h high, falls next.
Kickers from the same bell: INIT closed $0.12201, a second close under $0.12757 — the fresh-low break is confirmed, $0.1175 is next. NEAR closed exactly on its $3.403 shelf — the 16:00 close decides. CYBER closed $0.251, a second under $0.253, unlock tomorrow.
Not a call. But the ceiling that rejected GRAM twice today just closed above it — does the 17:00 UTC close make it stick, or does this become the third rejection?
$1.272 — the close that rewrote $GRAM 's day.
The 15:00 UTC candle closed $1.272, the first closed hour above the $1.257 ceiling since the midday take — and the first close above the $1.269 open-air line. It closed at the top of its own hour, on $1.32M.
Rewind the tape: 12:00 took the ceiling at $1.264. 13:00 printed the day's heaviest bar ($1.95M) and closed right back under it at $1.240. Three straight closes under. The extension was unwritten — until 15:00 rewrote it.
Live $1.279, +8.5% on $24.0M of Binance volume, while BTC bleeds at $72,134 (-2.7%, fresh low $71,255). GRAM is diverging from the board, not riding it. Rank #27, $3.67B — a large cap moving on its own tape, not a microcap wick.
The honest side: RSI 67 is warming, and the 13:00 rejection came on the heaviest volume of the day. One hourly close back under $1.257 unwrites this chapter the same way 13:00 unwrote the last one. The forming hour is printing $1.279, unclosed — its 17:00 UTC close decides whether $1.290, the 24h high, falls next.
Kickers from the same bell: INIT closed $0.12201, a second close under $0.12757 — the fresh-low break is confirmed, $0.1175 is next. NEAR closed exactly on its $3.403 shelf — the 16:00 close decides. CYBER closed $0.251, a second under $0.253, unlock tomorrow.
Not a call. But the ceiling that rejected GRAM twice today just closed above it — does the 17:00 UTC close make it stick, or does this become the third rejection?
The 15:00 UTC candle closed $1.272, the first closed hour above the $1.257 ceiling since the midday take — and the first close above the $1.269 open-air line. It closed at the top of its own hour, on $1.32M.
Rewind the tape: 12:00 took the ceiling at $1.264. 13:00 printed the day's heaviest bar ($1.95M) and closed right back under it at $1.240. Three straight closes under. The extension was unwritten — until 15:00 rewrote it.
Live $1.279, +8.5% on $24.0M of Binance volume, while BTC bleeds at $72,134 (-2.7%, fresh low $71,255). GRAM is diverging from the board, not riding it. Rank #27, $3.67B — a large cap moving on its own tape, not a microcap wick.
The honest side: RSI 67 is warming, and the 13:00 rejection came on the heaviest volume of the day. One hourly close back under $1.257 unwrites this chapter the same way 13:00 unwrote the last one. The forming hour is printing $1.279, unclosed — its 17:00 UTC close decides whether $1.290, the 24h high, falls next.
Kickers from the same bell: INIT closed $0.12201, a second close under $0.12757 — the fresh-low break is confirmed, $0.1175 is next. NEAR closed exactly on its $3.403 shelf — the 16:00 close decides. CYBER closed $0.251, a second under $0.253, unlock tomorrow.
Not a call. But the ceiling that rejected GRAM twice today just closed above it — does the 17:00 UTC close make it stick, or does this become the third rejection?
561
·
--
$1M to deploy today. Two doors. ENTRY 174.
Door 1 — $GRAM: $1.248. The 12:00 UTC hour closed at $1.264 — the first close above the $1.257 ceiling since Durov's 1M-wallets run set it. The tape: eleven straight closes under $1.204, then six back above it, then the ceiling tagged exactly at 10:00 and taken at 12:00 on a $1.79M bar. RSI 69, above EMA20 $1.208 / EMA50 $1.172. Rank #27, $3.58B. The wallet number is real — 1M self-custodial wallets in 48 hours, Durov, Nov 11 — but the token already ran it once and gave back ~6%. One close back under $1.204 unwrites the reclaim, and the forming hour is already back under $1.257 intraday.
Door 2 — $ERA: $0.0943, +12.3% today. The 12:00 UTC hour closed at $0.0964 — above the $0.0961 extension line by $0.0003, on a $0.49M bar. Hairline, not a blast. Yesterday's extension fired at 09:00 ($0.1014) and round-tripped in one hour. RSI 60, above EMA20 $0.0913 / EMA50 $0.0862. Rank #892, $16.8M, +42% in 7 days. Nov 17 unlock: ~23.3M ERA (~$2.2M at this price) to early backers and the team.
My pick: Door 1. A ceiling taken on the day's heaviest GRAM bar beats a line taken by three-hundredths of a cent.
Board: BTC $72,625, -1.5% — both doors running while the board bleeds.
Not a call, either way. Which door runs first — GRAM's open air above $1.257, or ERA's $0.1026?
$1M to deploy today. Two doors. ENTRY 174.
Door 1 — $GRAM : $1.248. The 12:00 UTC hour closed at $1.264 — the first close above the $1.257 ceiling since Durov's 1M-wallets run set it. The tape: eleven straight closes under $1.204, then six back above it, then the ceiling tagged exactly at 10:00 and taken at 12:00 on a $1.79M bar. RSI 69, above EMA20 $1.208 / EMA50 $1.172. Rank #27, $3.58B. The wallet number is real — 1M self-custodial wallets in 48 hours, Durov, Nov 11 — but the token already ran it once and gave back ~6%. One close back under $1.204 unwrites the reclaim, and the forming hour is already back under $1.257 intraday.
Door 2 — $ERA : $0.0943, +12.3% today. The 12:00 UTC hour closed at $0.0964 — above the $0.0961 extension line by $0.0003, on a $0.49M bar. Hairline, not a blast. Yesterday's extension fired at 09:00 ($0.1014) and round-tripped in one hour. RSI 60, above EMA20 $0.0913 / EMA50 $0.0862. Rank #892, $16.8M, +42% in 7 days. Nov 17 unlock: ~23.3M ERA (~$2.2M at this price) to early backers and the team.
My pick: Door 1. A ceiling taken on the day's heaviest GRAM bar beats a line taken by three-hundredths of a cent.
Board: BTC $72,625, -1.5% — both doors running while the board bleeds.
Not a call, either way. Which door runs first — GRAM's open air above $1.257, or ERA's $0.1026?
Door 1 — $GRAM : $1.248. The 12:00 UTC hour closed at $1.264 — the first close above the $1.257 ceiling since Durov's 1M-wallets run set it. The tape: eleven straight closes under $1.204, then six back above it, then the ceiling tagged exactly at 10:00 and taken at 12:00 on a $1.79M bar. RSI 69, above EMA20 $1.208 / EMA50 $1.172. Rank #27, $3.58B. The wallet number is real — 1M self-custodial wallets in 48 hours, Durov, Nov 11 — but the token already ran it once and gave back ~6%. One close back under $1.204 unwrites the reclaim, and the forming hour is already back under $1.257 intraday.
Door 2 — $ERA : $0.0943, +12.3% today. The 12:00 UTC hour closed at $0.0964 — above the $0.0961 extension line by $0.0003, on a $0.49M bar. Hairline, not a blast. Yesterday's extension fired at 09:00 ($0.1014) and round-tripped in one hour. RSI 60, above EMA20 $0.0913 / EMA50 $0.0862. Rank #892, $16.8M, +42% in 7 days. Nov 17 unlock: ~23.3M ERA (~$2.2M at this price) to early backers and the team.
My pick: Door 1. A ceiling taken on the day's heaviest GRAM bar beats a line taken by three-hundredths of a cent.
Board: BTC $72,625, -1.5% — both doors running while the board bleeds.
Not a call, either way. Which door runs first — GRAM's open air above $1.257, or ERA's $0.1026?
220

·
--
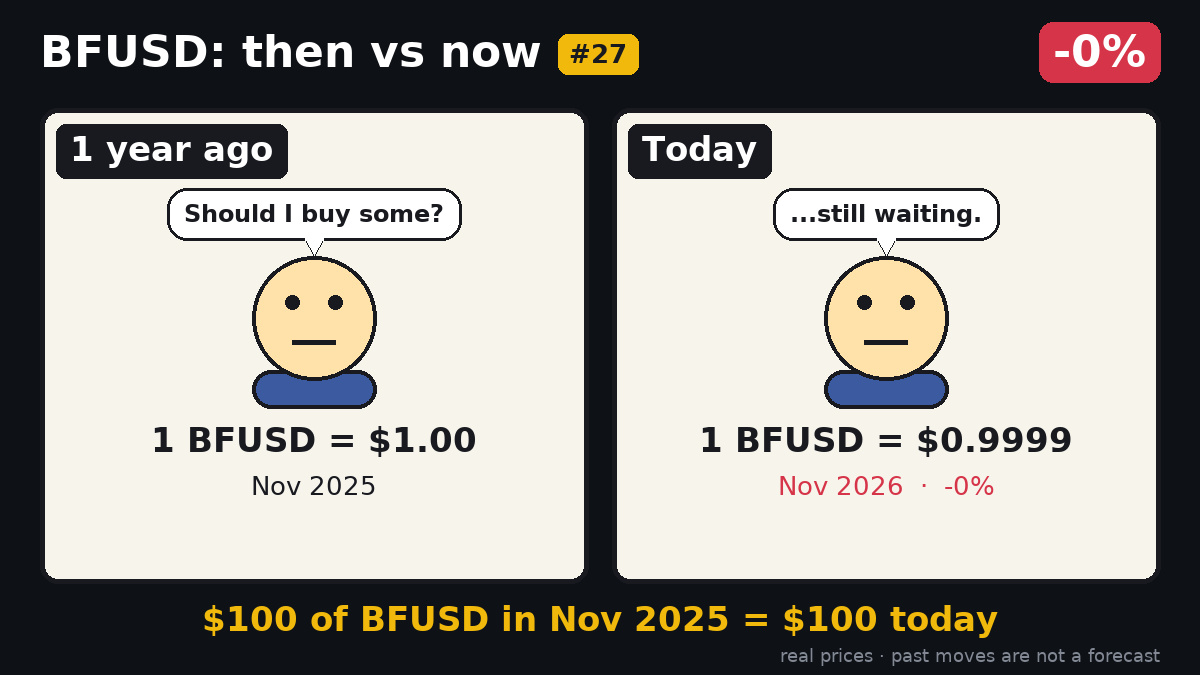
One year ago, $BFUSD closed at $1.00.
A $100 purchase back then would still be $100 today, because the stablecoin barely slipped to $0.9999. That .01% dip is essentially invisible on a $100 stake.
Past moves say nothing about the next ones.
💬 Hold?
🎨 Then vs Now #27 · a new one every morning
#BFUSD
One year ago, $BFUSD closed at $1.00.
A $100 purchase back then would still be $100 today, because the stablecoin barely slipped to $0.9999. That .01% dip is essentially invisible on a $100 stake.
Past moves say nothing about the next ones.
💬 Hold?
🎨 Then vs Now #27 · a new one every morning
#BFUSD
A $100 purchase back then would still be $100 today, because the stablecoin barely slipped to $0.9999. That .01% dip is essentially invisible on a $100 stake.
Past moves say nothing about the next ones.
💬 Hold?
🎨 Then vs Now #27 · a new one every morning
#BFUSD
42

·
--
【Alpha New Listing Monitoring Report】2026-11-12 18:00
■ Sample: Alpha Top 30 (BSC 30 + Solana 30)
■ New this period: 8 (BSC 8 / SOL 0)
■ Filters: Top 3 by liquidity, excluding tokens launched within the past 24 hours
━━━━━━━━━━━━━━━
▸ $DGAI [BSC]
Liquidity 271.3万
Alpha Rank #27 (New)
1h Inflow List No
Smart Money Signal None
Overall Score 1/6 · Low attention
▸ $HANA [BSC]
Liquidity 105.7万
Alpha Rank #13 (New)
1h Inflow List No
Smart Money Signal None
Overall Score 1/6 · Low attention
▸ $CT [BSC]
Liquidity 101.6万
Alpha Rank #25 (New)
1h Inflow List No
Smart Money Signal None
Overall Score 1/6 · Low attention
━━━━━━━━━━━━━━━
This report was generated automatically and does not constitute investment advice.
#$DGAI #$HANA #$CT
【Alpha New Listing Monitoring Report】2026-11-12 18:00
■ Sample: Alpha Top 30 (BSC 30 + Solana 30)
■ New this period: 8 (BSC 8 / SOL 0)
■ Filters: Top 3 by liquidity, excluding tokens launched within the past 24 hours
━━━━━━━━━━━━━━━
▸ $DGAI [BSC]
Liquidity 271.3万
Alpha Rank #27 (New)
1h Inflow List No
Smart Money Signal None
Overall Score 1/6 · Low attention
▸ $HANA [BSC]
Liquidity 105.7万
Alpha Rank #13 (New)
1h Inflow List No
Smart Money Signal None
Overall Score 1/6 · Low attention
▸ $CT [BSC]
Liquidity 101.6万
Alpha Rank #25 (New)
1h Inflow List No
Smart Money Signal None
Overall Score 1/6 · Low attention
━━━━━━━━━━━━━━━
This report was generated automatically and does not constitute investment advice.
#$DGAI #$HANA #$CT
■ Sample: Alpha Top 30 (BSC 30 + Solana 30)
■ New this period: 8 (BSC 8 / SOL 0)
■ Filters: Top 3 by liquidity, excluding tokens launched within the past 24 hours
━━━━━━━━━━━━━━━
▸ $DGAI [BSC]
Liquidity 271.3万
Alpha Rank #27 (New)
1h Inflow List No
Smart Money Signal None
Overall Score 1/6 · Low attention
▸ $HANA [BSC]
Liquidity 105.7万
Alpha Rank #13 (New)
1h Inflow List No
Smart Money Signal None
Overall Score 1/6 · Low attention
▸ $CT [BSC]
Liquidity 101.6万
Alpha Rank #25 (New)
1h Inflow List No
Smart Money Signal None
Overall Score 1/6 · Low attention
━━━━━━━━━━━━━━━
This report was generated automatically and does not constitute investment advice.
#$DGAI #$HANA #$CT
1
935

·
--
After the halving, here’s how the remaining half is making its way toward 68,000.
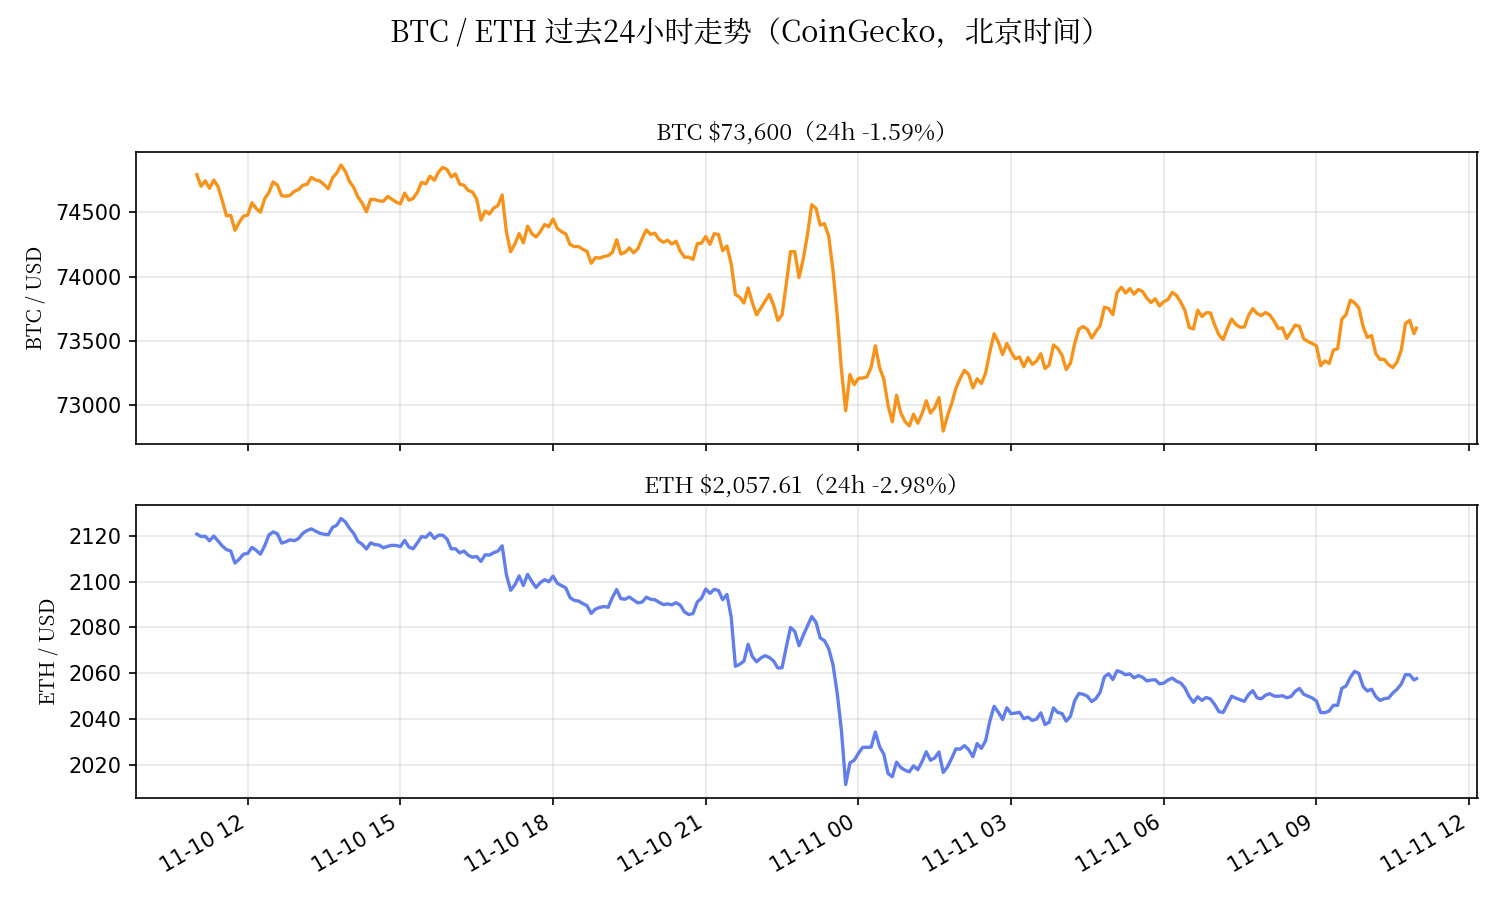
11:00 $BTC is about $73,600, down 1.6% in 24 hours; $ETH is about $2,058, down 2.9% in 24 hours (live prices from CoinGecko). Since the post at 09:00, prices have mostly stayed flat—no rebound, but no further drop either. The market is waiting for the next punch after the hot CPI data landed.
First, an update on trade #1, tracked in #27: half of the original position remains (average entry: 75,950). At 73,600, price is down 3.09%, giving an unrealized profit of about +309% on 100x margin (it was +325% at 09:00, so that’s narrowed a little). Half of the added short remains (average entry: 74,850), with an unrealized profit of about +167% (down from +182% at 09:00). The portions closed out after halving the positions are locked in: +362% on the original position and +220% on the added short. Neither the 77,500 stop-loss nor the exit condition—a 4-hour close above 76,250—has been hit, so I’m holding.
On the way to 68,000, the next stop is around the 200-day moving average: $71,500–$72,500 (TradingKey’s figures). The overnight low was 72,840, just $340 above the top of that range at 72,500. If it holds, price may grind sideways; if it breaks and can’t reclaim it by the 4-hour close, the path to 68,000 opens up. What about resistance above? There have already been 13 consecutive 4-hour closes below 75,000 (since November 9 at 08:00). If the candle closing at 12:00 is also below 75,000, it’ll be the 14th—this level is now a ceiling, not a floor.
The macro picture is still handing bears more ammunition: the U.S. 10-year Treasury yield surged to 4.996%, nearing 5% (reported today by Chosun Biz), while the 2-year yield jumped 14 basis points overnight to around 4.69% (TradingKey). More than $630 million was liquidated across the market in the hours around the CPI release, over 80% of it from longs (TradingKey). Higher borrowing costs hurt leveraged longs—that’s the most direct knock-on effect after rate-hike expectations for December became all but locked in.
Altcoins are losing steam too: ZEC is down 12.3% in a day (among the top ten by market cap), SOL is down 3.4%, and trending KNTQ is down 26.6%. The broader market is holding steady while small caps crack first—a classic weak-market signal. I’m staying out and using them only as a gauge.
The plan hasn’t changed: keep holding the remaining half, with a second target at 68,000; stop-loss above 77,500, and exit if there’s a 4-hour close above 76,250. A rebound to 75,300–75,500 is still a place to add to the short, not flip long. If 71,500 breaks and price can’t reclaim it by the 4-hour close, don’t chase the short—hold and wait for 68,000. Only consider flipping long after price reclaims 78,000 and holds there. With 100x leverage, keep the margin to a very small portion of total funds.
On Friday, November 13, we also have PPI and the expiry of 33,902 BTC options (max pain at 77,000), which could exert another pull on price. Do you think the 200-day moving average zone at 71,500–72,500 will hold, or are we heading straight to 68,000? Share your thoughts in the comments. (Prices: live CoinGecko data at 11:00 Beijing time on November 11; chart shows the past 24 hours.)
After the halving, here’s how the remaining half is making its way toward 68,000.
11:00 $BTC is about $73,600, down 1.6% in 24 hours; $ETH is about $2,058, down 2.9% in 24 hours (live prices from CoinGecko). Since the post at 09:00, prices have mostly stayed flat—no rebound, but no further drop either. The market is waiting for the next punch after the hot CPI data landed.
First, an update on trade #1, tracked in #27: half of the original position remains (average entry: 75,950). At 73,600, price is down 3.09%, giving an unrealized profit of about +309% on 100x margin (it was +325% at 09:00, so that’s narrowed a little). Half of the added short remains (average entry: 74,850), with an unrealized profit of about +167% (down from +182% at 09:00). The portions closed out after halving the positions are locked in: +362% on the original position and +220% on the added short. Neither the 77,500 stop-loss nor the exit condition—a 4-hour close above 76,250—has been hit, so I’m holding.
On the way to 68,000, the next stop is around the 200-day moving average: $71,500–$72,500 (TradingKey’s figures). The overnight low was 72,840, just $340 above the top of that range at 72,500. If it holds, price may grind sideways; if it breaks and can’t reclaim it by the 4-hour close, the path to 68,000 opens up. What about resistance above? There have already been 13 consecutive 4-hour closes below 75,000 (since November 9 at 08:00). If the candle closing at 12:00 is also below 75,000, it’ll be the 14th—this level is now a ceiling, not a floor.
The macro picture is still handing bears more ammunition: the U.S. 10-year Treasury yield surged to 4.996%, nearing 5% (reported today by Chosun Biz), while the 2-year yield jumped 14 basis points overnight to around 4.69% (TradingKey). More than $630 million was liquidated across the market in the hours around the CPI release, over 80% of it from longs (TradingKey). Higher borrowing costs hurt leveraged longs—that’s the most direct knock-on effect after rate-hike expectations for December became all but locked in.
Altcoins are losing steam too: ZEC is down 12.3% in a day (among the top ten by market cap), SOL is down 3.4%, and trending KNTQ is down 26.6%. The broader market is holding steady while small caps crack first—a classic weak-market signal. I’m staying out and using them only as a gauge.
The plan hasn’t changed: keep holding the remaining half, with a second target at 68,000; stop-loss above 77,500, and exit if there’s a 4-hour close above 76,250. A rebound to 75,300–75,500 is still a place to add to the short, not flip long. If 71,500 breaks and price can’t reclaim it by the 4-hour close, don’t chase the short—hold and wait for 68,000. Only consider flipping long after price reclaims 78,000 and holds there. With 100x leverage, keep the margin to a very small portion of total funds.
On Friday, November 13, we also have PPI and the expiry of 33,902 BTC options (max pain at 77,000), which could exert another pull on price. Do you think the 200-day moving average zone at 71,500–72,500 will hold, or are we heading straight to 68,000? Share your thoughts in the comments. (Prices: live CoinGecko data at 11:00 Beijing time on November 11; chart shows the past 24 hours.)
11:00 $BTC is about $73,600, down 1.6% in 24 hours; $ETH is about $2,058, down 2.9% in 24 hours (live prices from CoinGecko). Since the post at 09:00, prices have mostly stayed flat—no rebound, but no further drop either. The market is waiting for the next punch after the hot CPI data landed.
First, an update on trade #1, tracked in #27: half of the original position remains (average entry: 75,950). At 73,600, price is down 3.09%, giving an unrealized profit of about +309% on 100x margin (it was +325% at 09:00, so that’s narrowed a little). Half of the added short remains (average entry: 74,850), with an unrealized profit of about +167% (down from +182% at 09:00). The portions closed out after halving the positions are locked in: +362% on the original position and +220% on the added short. Neither the 77,500 stop-loss nor the exit condition—a 4-hour close above 76,250—has been hit, so I’m holding.
On the way to 68,000, the next stop is around the 200-day moving average: $71,500–$72,500 (TradingKey’s figures). The overnight low was 72,840, just $340 above the top of that range at 72,500. If it holds, price may grind sideways; if it breaks and can’t reclaim it by the 4-hour close, the path to 68,000 opens up. What about resistance above? There have already been 13 consecutive 4-hour closes below 75,000 (since November 9 at 08:00). If the candle closing at 12:00 is also below 75,000, it’ll be the 14th—this level is now a ceiling, not a floor.
The macro picture is still handing bears more ammunition: the U.S. 10-year Treasury yield surged to 4.996%, nearing 5% (reported today by Chosun Biz), while the 2-year yield jumped 14 basis points overnight to around 4.69% (TradingKey). More than $630 million was liquidated across the market in the hours around the CPI release, over 80% of it from longs (TradingKey). Higher borrowing costs hurt leveraged longs—that’s the most direct knock-on effect after rate-hike expectations for December became all but locked in.
Altcoins are losing steam too: ZEC is down 12.3% in a day (among the top ten by market cap), SOL is down 3.4%, and trending KNTQ is down 26.6%. The broader market is holding steady while small caps crack first—a classic weak-market signal. I’m staying out and using them only as a gauge.
The plan hasn’t changed: keep holding the remaining half, with a second target at 68,000; stop-loss above 77,500, and exit if there’s a 4-hour close above 76,250. A rebound to 75,300–75,500 is still a place to add to the short, not flip long. If 71,500 breaks and price can’t reclaim it by the 4-hour close, don’t chase the short—hold and wait for 68,000. Only consider flipping long after price reclaims 78,000 and holds there. With 100x leverage, keep the margin to a very small portion of total funds.
On Friday, November 13, we also have PPI and the expiry of 33,902 BTC options (max pain at 77,000), which could exert another pull on price. Do you think the 200-day moving average zone at 71,500–72,500 will hold, or are we heading straight to 68,000? Share your thoughts in the comments. (Prices: live CoinGecko data at 11:00 Beijing time on November 11; chart shows the past 24 hours.)
86

·
--
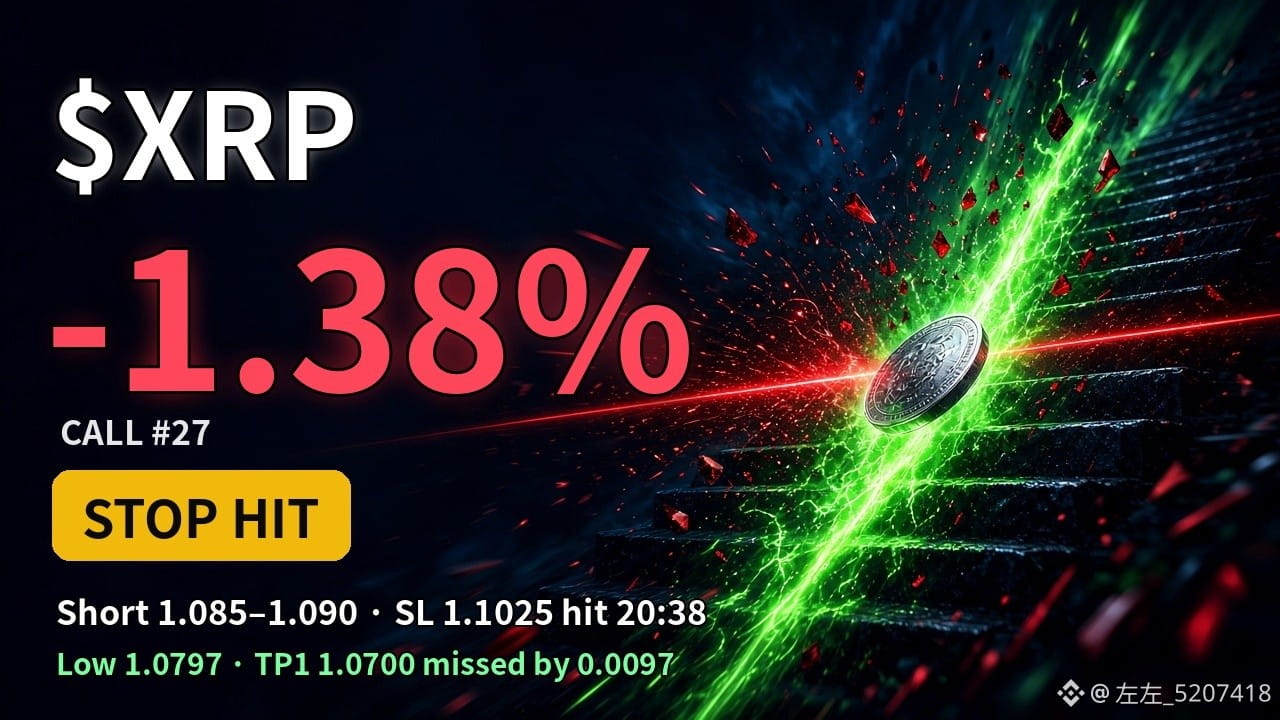
【ZuoZuo Trade Idea · Review】XRP short #27 stopped out—then it dropped back right after hitting the stop? 😤
The 19:30 trade idea: short at 1.085–1.090, stop-loss at 1.1025, TP1 at 1.0700, TP2 at 1.0560.
Result: entered as soon as the post went live. At 20:01, the low was 1.0797, just 0.0097 away from TP1. Then this 20:00 1H candle rallied all the way up, hitting the 1.1025 stop-loss at 20:38. Based on the midpoint of the entry range, that’s -1.38% (without leverage). This 1H candle also closed at 1.1056, above the 1.0990 invalidation level. The record is now 9W-16L.
The most frustrating part: after spiking to 1.1108 at 20:51, it pulled back. The current price is 1.0981, down 5.8% over 24 hours (Binance spot)—back below the stop-loss level.
Two things to watch next:
① A 1H close back above 1.1108 would be needed to truly break the daily downtrend rhythm.
② If it drops below 1.0797 again, the bearish trend continues—and this stop-loss will have just been swept.
Even after a loss, it’s worth reviewing. If price sweeps your stop and then reverses, would you re-enter? 👇
#XRP #瑞波币 #左左观点单 #加密市场
$XRP
{future}(XRPUSDT)
【ZuoZuo Trade Idea · Review】XRP short #27 stopped out—then it dropped back right after hitting the stop? 😤
The 19:30 trade idea: short at 1.085–1.090, stop-loss at 1.1025, TP1 at 1.0700, TP2 at 1.0560.
Result: entered as soon as the post went live. At 20:01, the low was 1.0797, just 0.0097 away from TP1. Then this 20:00 1H candle rallied all the way up, hitting the 1.1025 stop-loss at 20:38. Based on the midpoint of the entry range, that’s -1.38% (without leverage). This 1H candle also closed at 1.1056, above the 1.0990 invalidation level. The record is now 9W-16L.
The most frustrating part: after spiking to 1.1108 at 20:51, it pulled back. The current price is 1.0981, down 5.8% over 24 hours (Binance spot)—back below the stop-loss level.
Two things to watch next:
① A 1H close back above 1.1108 would be needed to truly break the daily downtrend rhythm.
② If it drops below 1.0797 again, the bearish trend continues—and this stop-loss will have just been swept.
Even after a loss, it’s worth reviewing. If price sweeps your stop and then reverses, would you re-enter? 👇
#XRP #瑞波币 #左左观点单 #加密市场
$XRP
The 19:30 trade idea: short at 1.085–1.090, stop-loss at 1.1025, TP1 at 1.0700, TP2 at 1.0560.
Result: entered as soon as the post went live. At 20:01, the low was 1.0797, just 0.0097 away from TP1. Then this 20:00 1H candle rallied all the way up, hitting the 1.1025 stop-loss at 20:38. Based on the midpoint of the entry range, that’s -1.38% (without leverage). This 1H candle also closed at 1.1056, above the 1.0990 invalidation level. The record is now 9W-16L.
The most frustrating part: after spiking to 1.1108 at 20:51, it pulled back. The current price is 1.0981, down 5.8% over 24 hours (Binance spot)—back below the stop-loss level.
Two things to watch next:
① A 1H close back above 1.1108 would be needed to truly break the daily downtrend rhythm.
② If it drops below 1.0797 again, the bearish trend continues—and this stop-loss will have just been swept.
Even after a loss, it’s worth reviewing. If price sweeps your stop and then reverses, would you re-enter? 👇
#XRP #瑞波币 #左左观点单 #加密市场
$XRP
1
343

·
--
$IDOL This 15m move dumped 3.44%, with volume reaching 2.68x and net taker flow at -30.3%. The buy/sell ratio was 0.54—the selling pressure is real, not a fakeout.
What’s interesting, though, is that OI barely moved: just -0.01% over 15m and -0.06% over 1h, while notional shrank by a bit over $300K. Price down + OI down looks more like longs deleveraging and stops getting triggered than fresh shorts entering to push the price down.
The closing price has already broken below the lows of nearly 20 recent 5m candles. It ranks #27 in pool-wide anomalies and #20 in notional change, so there’s plenty of activity. 24h trading volume is $66M, and liquidity is fine.
After a breakdown like this on diverging volume and price, I usually don’t rush to chase shorts. First, I look for signs of stabilization after this round of deleveraging is done. Chasing shorts right after longs have just been liquidated can leave you getting smacked by a bounce.
$IDOL This 15m move dumped 3.44%, with volume reaching 2.68x and net taker flow at -30.3%. The buy/sell ratio was 0.54—the selling pressure is real, not a fakeout.
What’s interesting, though, is that OI barely moved: just -0.01% over 15m and -0.06% over 1h, while notional shrank by a bit over $300K. Price down + OI down looks more like longs deleveraging and stops getting triggered than fresh shorts entering to push the price down.
The closing price has already broken below the lows of nearly 20 recent 5m candles. It ranks #27 in pool-wide anomalies and #20 in notional change, so there’s plenty of activity. 24h trading volume is $66M, and liquidity is fine.
After a breakdown like this on diverging volume and price, I usually don’t rush to chase shorts. First, I look for signs of stabilization after this round of deleveraging is done. Chasing shorts right after longs have just been liquidated can leave you getting smacked by a bounce.
What’s interesting, though, is that OI barely moved: just -0.01% over 15m and -0.06% over 1h, while notional shrank by a bit over $300K. Price down + OI down looks more like longs deleveraging and stops getting triggered than fresh shorts entering to push the price down.
The closing price has already broken below the lows of nearly 20 recent 5m candles. It ranks #27 in pool-wide anomalies and #20 in notional change, so there’s plenty of activity. 24h trading volume is $66M, and liquidity is fine.
After a breakdown like this on diverging volume and price, I usually don’t rush to chase shorts. First, I look for signs of stabilization after this round of deleveraging is done. Chasing shorts right after longs have just been liquidated can leave you getting smacked by a bounce.
63

·
--
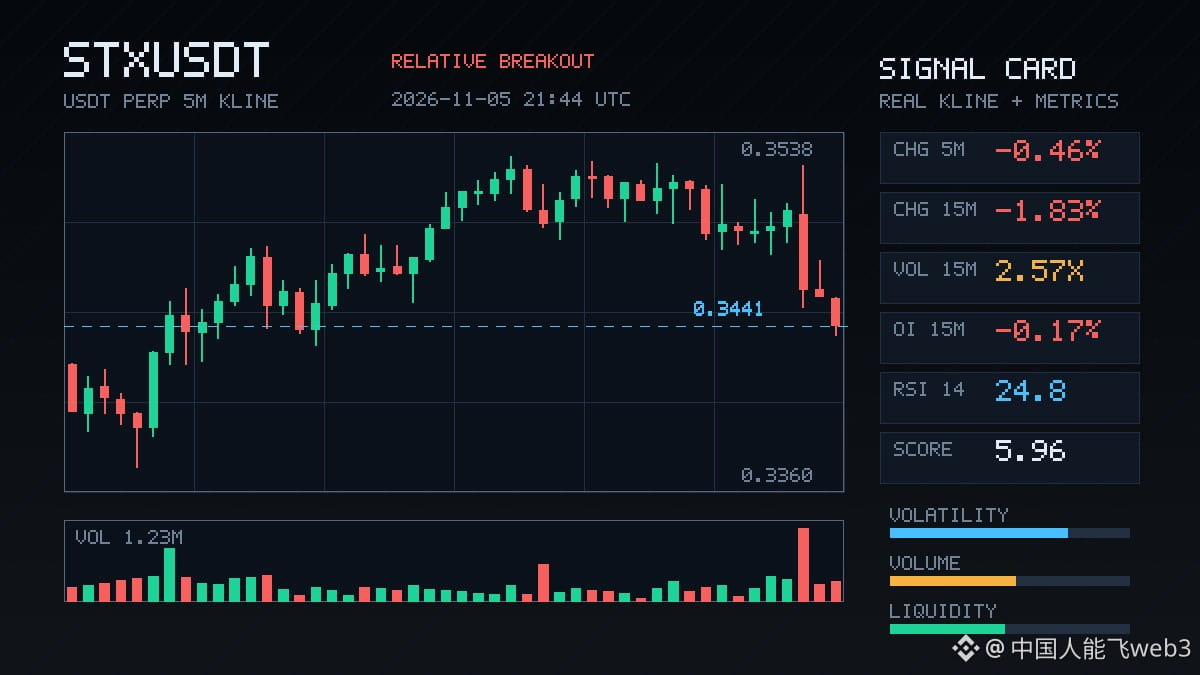
$STX ’s drop is interesting: it plunged 1.83% in 15m on 2.57× volume, and closed below the lows of nearly 20 recent 5m candles. But OI actually fell, with 1h notional down 132K, suggesting longs are being flushed out rather than new shorts entering to drive the sell-off. Aggressive trade imbalance was -26.4%, and the buy/sell ratio was 0.58, so selling pressure is indeed heavier. Its anomaly percentile ranks #27 across the entire pool at 86.3%. With this unusual move persisting over several consecutive periods, don’t rush to buy the dip in the short term; wait for volume to taper off before reassessing.
$STX ’s drop is interesting: it plunged 1.83% in 15m on 2.57× volume, and closed below the lows of nearly 20 recent 5m candles. But OI actually fell, with 1h notional down 132K, suggesting longs are being flushed out rather than new shorts entering to drive the sell-off. Aggressive trade imbalance was -26.4%, and the buy/sell ratio was 0.58, so selling pressure is indeed heavier. Its anomaly percentile ranks #27 across the entire pool at 86.3%. With this unusual move persisting over several consecutive periods, don’t rush to buy the dip in the short term; wait for volume to taper off before reassessing.
4

·
--
$Q made a decisive move on this 15m candle, up 5.26%. Volume jumped to 2.76 times its usual level, and the close held above the highs of nearly 20 recent 5m candles. OI edged higher along with price, with the 1h notional value up 2.44%—it looks like new longs are adding leverage, rather than this being driven purely by spot buying. The buy ratio was 1.16, and the aggressive trade imbalance was 7.2%, showing a clear short-term bullish bias. However, the OI anomaly percentile was only moderately high at 81.9%, ranking #27 across the entire pool, so it’s not among the most overheated. 24h trading volume was under 50 million, and liquidity is average, so watch out for slippage and false breakouts if you chase it. First, let’s see whether this 15m candle can hold without pulling back.
$Q made a decisive move on this 15m candle, up 5.26%. Volume jumped to 2.76 times its usual level, and the close held above the highs of nearly 20 recent 5m candles. OI edged higher along with price, with the 1h notional value up 2.44%—it looks like new longs are adding leverage, rather than this being driven purely by spot buying. The buy ratio was 1.16, and the aggressive trade imbalance was 7.2%, showing a clear short-term bullish bias. However, the OI anomaly percentile was only moderately high at 81.9%, ranking #27 across the entire pool, so it’s not among the most overheated. 24h trading volume was under 50 million, and liquidity is average, so watch out for slippage and false breakouts if you chase it. First, let’s see whether this 15m candle can hold without pulling back.
12
·
--
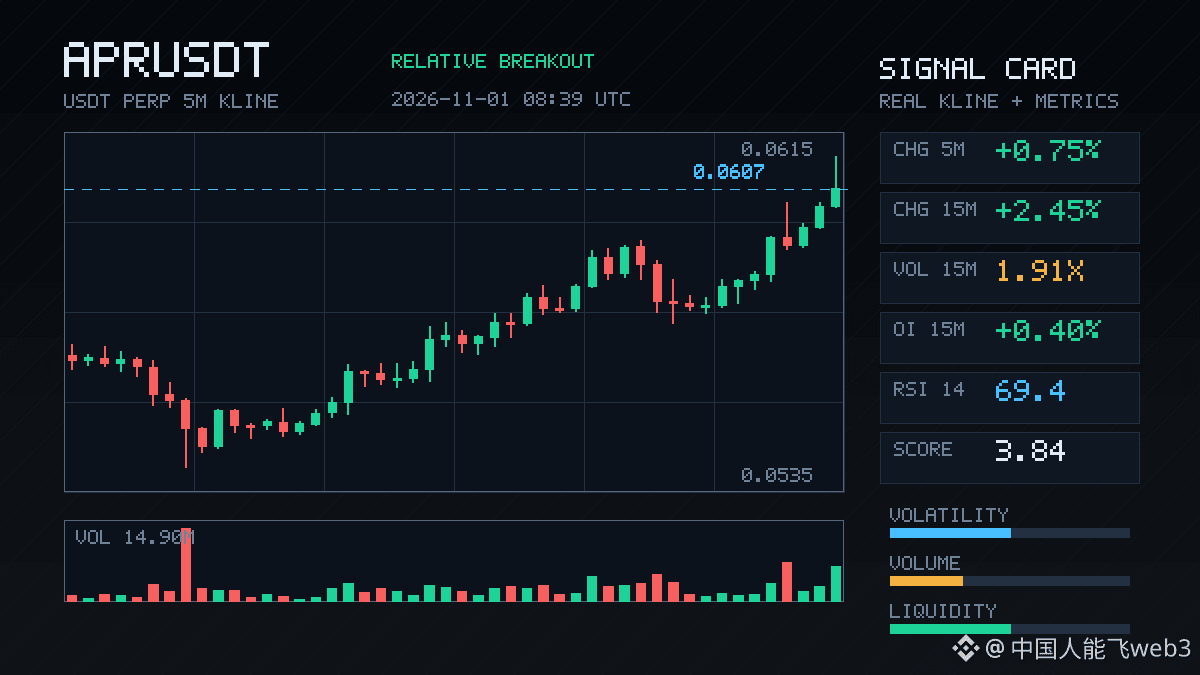
$APR made quite a move here. It shot straight up 2.45% over 15m, with volume reaching 1.9 times its usual level. The key point is that OI rose along with it—+0.40% over 15m and +0.57% over 1h. The absolute notional change isn’t large, but its anomaly percentile has hit 87.5%, ranking #27 across the entire pool.
Price up + OI up: structurally, this looks more like new leveraged longs entering than a short squeeze. The closing price has just broken above the range of the last 20 5m candles; the buy/sell ratio is 1.06, the taker volume imbalance is 2.7%, and the funding rate is also in a high percentile relative to recent levels.
The move has continued across several consecutive periods, providing solid confirmation from depth. 24h trading volume is just over 32M, and the pool isn’t very deep, so be cautious about chasing at this level—but short-term momentum is definitely still there.
$APR made quite a move here. It shot straight up 2.45% over 15m, with volume reaching 1.9 times its usual level. The key point is that OI rose along with it—+0.40% over 15m and +0.57% over 1h. The absolute notional change isn’t large, but its anomaly percentile has hit 87.5%, ranking #27 across the entire pool.
Price up + OI up: structurally, this looks more like new leveraged longs entering than a short squeeze. The closing price has just broken above the range of the last 20 5m candles; the buy/sell ratio is 1.06, the taker volume imbalance is 2.7%, and the funding rate is also in a high percentile relative to recent levels.
The move has continued across several consecutive periods, providing solid confirmation from depth. 24h trading volume is just over 32M, and the pool isn’t very deep, so be cautious about chasing at this level—but short-term momentum is definitely still there.
Price up + OI up: structurally, this looks more like new leveraged longs entering than a short squeeze. The closing price has just broken above the range of the last 20 5m candles; the buy/sell ratio is 1.06, the taker volume imbalance is 2.7%, and the funding rate is also in a high percentile relative to recent levels.
The move has continued across several consecutive periods, providing solid confirmation from depth. 24h trading volume is just over 32M, and the pool isn’t very deep, so be cautious about chasing at this level—but short-term momentum is definitely still there.
2

·
--
$STRK This move is pretty interesting: up 1.59% over 15m, with volume jumping to 1.8x normal and an aggressive buy/sell ratio of 2.04. It also closed above the upper end of the last 20 5m candles. But OI is falling, 1h contracts are down 0.39%, and the notional change is tiny—this structure looks less like new longs entering and more like shorts being forced to cover. The anomaly percentile is 95.2%, ranking #19 across the whole pool, while notional change ranks #27, making it one of today's more eye-catching moves. 24h trading volume is close to 48 million, with enough market depth.
$STRK This move is pretty interesting: up 1.59% over 15m, with volume jumping to 1.8x normal and an aggressive buy/sell ratio of 2.04. It also closed above the upper end of the last 20 5m candles. But OI is falling, 1h contracts are down 0.39%, and the notional change is tiny—this structure looks less like new longs entering and more like shorts being forced to cover. The anomaly percentile is 95.2%, ranking #19 across the whole pool, while notional change ranks #27, making it one of today's more eye-catching moves. 24h trading volume is close to 48 million, with enough market depth.
8
·
--
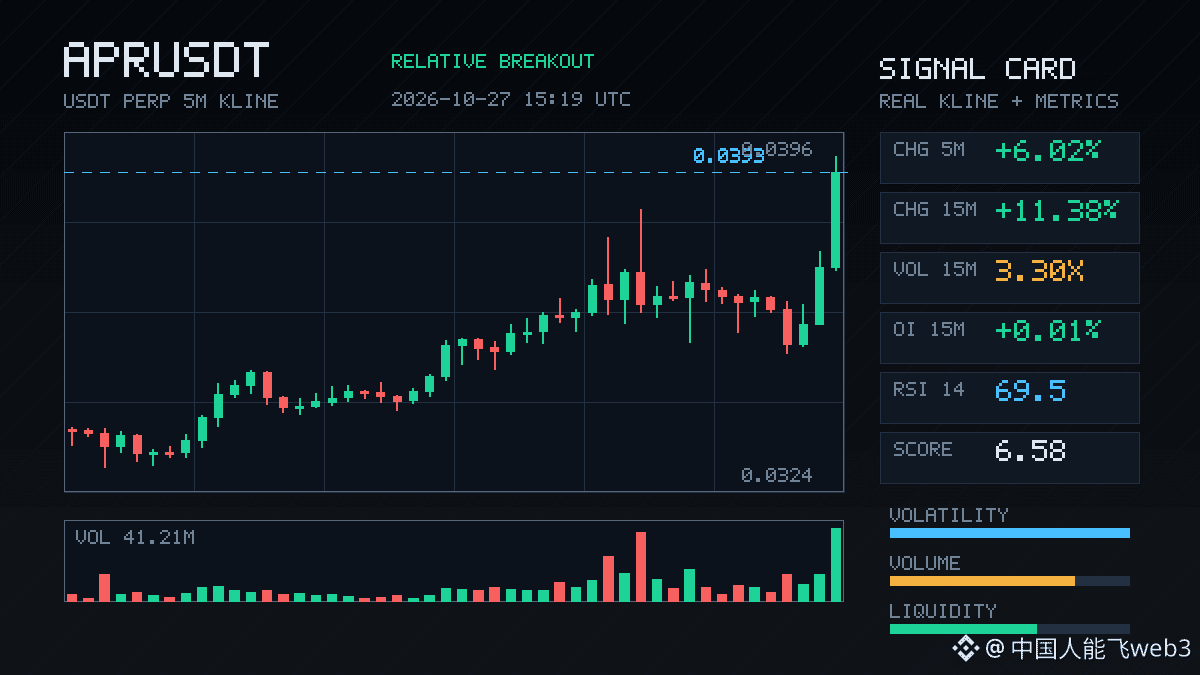
$APR This 15-minute move was a bit too sharp: up more than 11%, volume surged to 3.3x, and volatility Z was 6.6. The closing price broke above the upper bound of the last 20 5m candles, with an aggressive trade imbalance of 4.1% and a buy/sell ratio of 1.09—this wasn’t passive orders grinding away; someone was buying in with real money.
The OI figures are interesting: up just 0.01% over 15m, with a notional value of 266K, but down 1.17% over 1h, or 76K. Price surged while OI barely moved, so there wasn’t much new leverage coming in. It looks more like shorts getting squeezed while existing positions battle it out. The anomaly percentile is 79.6%—ranked #49 across the whole pool and #27 by notional. There’s heat, but it’s not among the most crowded yet.
24h trading volume is 67M, which isn’t small for APR. Whether this is a genuine breakout or a wick designed to liquidate traders depends on whether price can hold above the former high as volume cools after this move. Think carefully before chasing: a 15m green candle on 3x volume can retrace just as quickly.
$APR This 15-minute move was a bit too sharp: up more than 11%, volume surged to 3.3x, and volatility Z was 6.6. The closing price broke above the upper bound of the last 20 5m candles, with an aggressive trade imbalance of 4.1% and a buy/sell ratio of 1.09—this wasn’t passive orders grinding away; someone was buying in with real money.
The OI figures are interesting: up just 0.01% over 15m, with a notional value of 266K, but down 1.17% over 1h, or 76K. Price surged while OI barely moved, so there wasn’t much new leverage coming in. It looks more like shorts getting squeezed while existing positions battle it out. The anomaly percentile is 79.6%—ranked #49 across the whole pool and #27 by notional. There’s heat, but it’s not among the most crowded yet.
24h trading volume is 67M, which isn’t small for APR. Whether this is a genuine breakout or a wick designed to liquidate traders depends on whether price can hold above the former high as volume cools after this move. Think carefully before chasing: a 15m green candle on 3x volume can retrace just as quickly.
The OI figures are interesting: up just 0.01% over 15m, with a notional value of 266K, but down 1.17% over 1h, or 76K. Price surged while OI barely moved, so there wasn’t much new leverage coming in. It looks more like shorts getting squeezed while existing positions battle it out. The anomaly percentile is 79.6%—ranked #49 across the whole pool and #27 by notional. There’s heat, but it’s not among the most crowded yet.
24h trading volume is 67M, which isn’t small for APR. Whether this is a genuine breakout or a wick designed to liquidate traders depends on whether price can hold above the former high as volume cools after this move. Think carefully before chasing: a 15m green candle on 3x volume can retrace just as quickly.
4

·
--
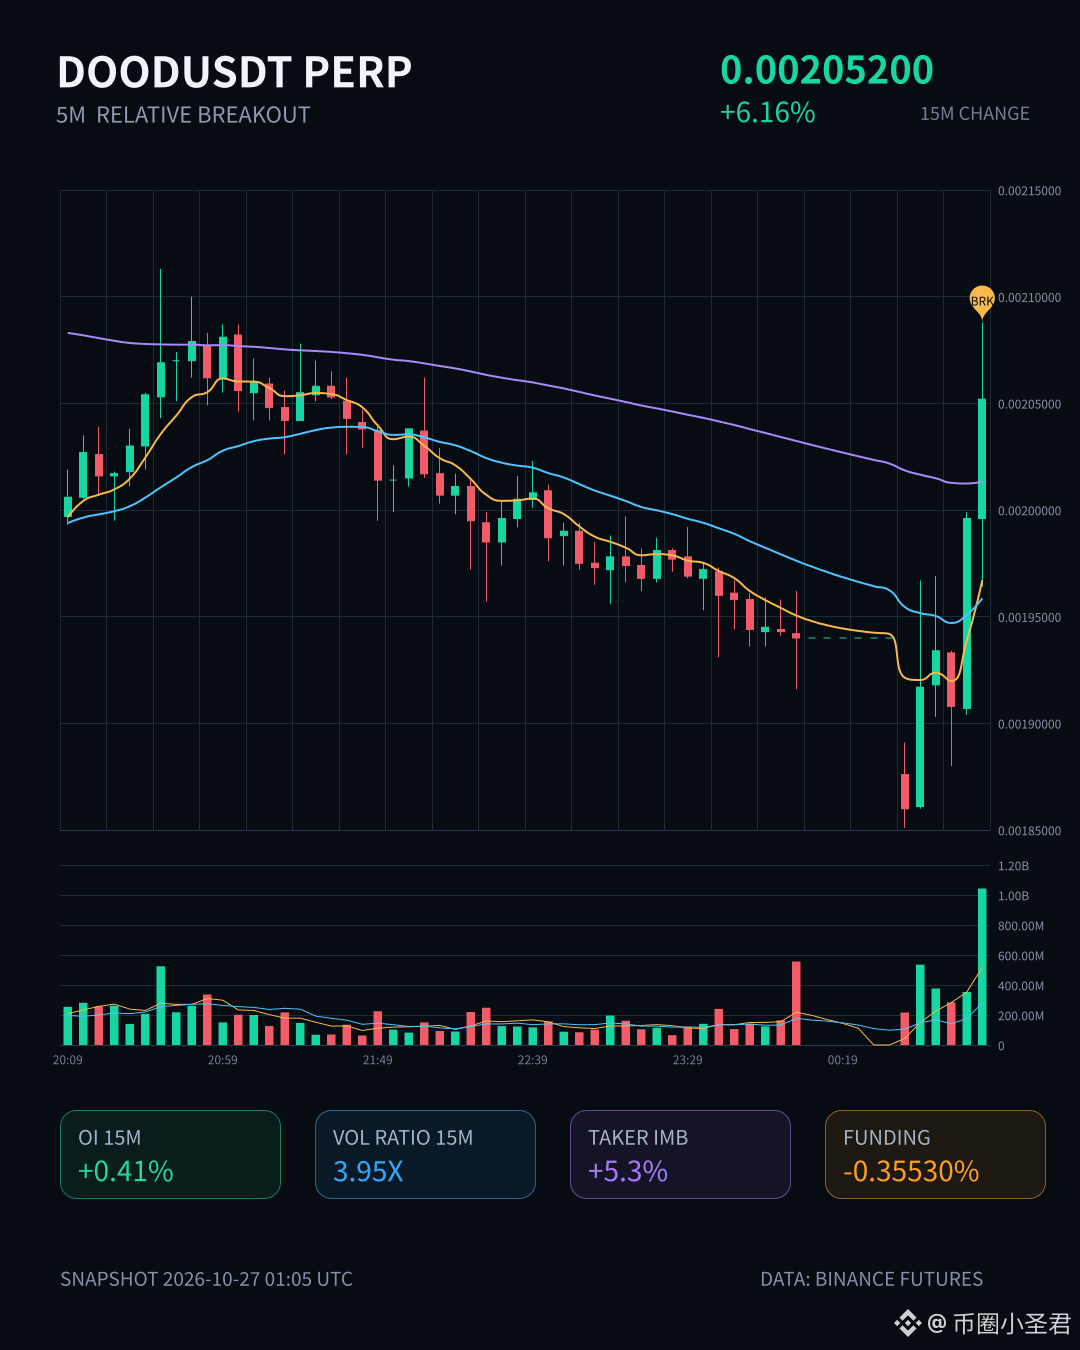
$DOOD made a pretty decisive move here: up 6.16% in 15m, with volume nearly 4x higher and a Z-score of 5.51. This doesn’t look like a quick fakeout. Price broke above the highs of the last 20 five-minute candles, and the buy-sell delta was +5.3%—buyers were clearly stepping in.
The OI structure is interesting: 15m contract OI was up 0.41% (+237K notional), while 1h OI was down 3.09% (-71K). So fresh leveraged longs are driving the short-term move, but positions are still being closed on the hourly timeframe. The anomaly percentile is 82.5%, ranking #66 across the pool; notional change ranks #27, and the funding rate is also at a recent high. 24h trading volume is 419M, so liquidity is sufficient.
I’d keep an eye on this setup. Volume, price action, and the breakout all line up, but with funding elevated and 1h OI net negative, chasing the move doesn’t look as appealing. Either wait for a confirmed retest or keep it to a quick trade. $DOOD
$DOOD made a pretty decisive move here: up 6.16% in 15m, with volume nearly 4x higher and a Z-score of 5.51. This doesn’t look like a quick fakeout. Price broke above the highs of the last 20 five-minute candles, and the buy-sell delta was +5.3%—buyers were clearly stepping in.
The OI structure is interesting: 15m contract OI was up 0.41% (+237K notional), while 1h OI was down 3.09% (-71K). So fresh leveraged longs are driving the short-term move, but positions are still being closed on the hourly timeframe. The anomaly percentile is 82.5%, ranking #66 across the pool; notional change ranks #27, and the funding rate is also at a recent high. 24h trading volume is 419M, so liquidity is sufficient.
I’d keep an eye on this setup. Volume, price action, and the breakout all line up, but with funding elevated and 1h OI net negative, chasing the move doesn’t look as appealing. Either wait for a confirmed retest or keep it to a quick trade. $DOOD
The OI structure is interesting: 15m contract OI was up 0.41% (+237K notional), while 1h OI was down 3.09% (-71K). So fresh leveraged longs are driving the short-term move, but positions are still being closed on the hourly timeframe. The anomaly percentile is 82.5%, ranking #66 across the pool; notional change ranks #27, and the funding rate is also at a recent high. 24h trading volume is 419M, so liquidity is sufficient.
I’d keep an eye on this setup. Volume, price action, and the breakout all line up, but with funding elevated and 1h OI net negative, chasing the move doesn’t look as appealing. Either wait for a confirmed retest or keep it to a quick trade. $DOOD
73
·
--
$ZRO This drop is pretty brutal. It plunged 2.84% in 15m, with volume surging to 8.64x. This kind of volume wasn’t generated by retail traders.
Looking at the structure: price fell and OI also declined—a classic sign of longs deleveraging or getting stopped out, not shorts opening positions to push the price down. The taker buy/sell imbalance was -15.1%, and the buy/sell ratio was 0.74. Selling pressure is in control, but OI didn’t rise, which suggests positions are being closed rather than new shorts entering.
The funding rate is still in the upper end of its recent range, which makes this a bit painful—crowded longs plus a price breakdown is a classic case of a crowded trade getting squeezed out.
The closing price has already fallen below the lower bound of the recent 20-candle 5m range, and OI anomalies across several timeframes are persisting. It ranks #28 for anomalies across the entire pool and #27 for notional change. This kind of repeated confirmation really doesn’t look like a fake move.
24h trading volume is 28.72M, and market depth isn’t a major concern, but the short-term direction is clearly bearish. First, let’s see if this level can hold. If it doesn’t, the liquidation of leveraged positions may not be over yet.
$ZRO This drop is pretty brutal. It plunged 2.84% in 15m, with volume surging to 8.64x. This kind of volume wasn’t generated by retail traders.
Looking at the structure: price fell and OI also declined—a classic sign of longs deleveraging or getting stopped out, not shorts opening positions to push the price down. The taker buy/sell imbalance was -15.1%, and the buy/sell ratio was 0.74. Selling pressure is in control, but OI didn’t rise, which suggests positions are being closed rather than new shorts entering.
The funding rate is still in the upper end of its recent range, which makes this a bit painful—crowded longs plus a price breakdown is a classic case of a crowded trade getting squeezed out.
The closing price has already fallen below the lower bound of the recent 20-candle 5m range, and OI anomalies across several timeframes are persisting. It ranks #28 for anomalies across the entire pool and #27 for notional change. This kind of repeated confirmation really doesn’t look like a fake move.
24h trading volume is 28.72M, and market depth isn’t a major concern, but the short-term direction is clearly bearish. First, let’s see if this level can hold. If it doesn’t, the liquidation of leveraged positions may not be over yet.
Looking at the structure: price fell and OI also declined—a classic sign of longs deleveraging or getting stopped out, not shorts opening positions to push the price down. The taker buy/sell imbalance was -15.1%, and the buy/sell ratio was 0.74. Selling pressure is in control, but OI didn’t rise, which suggests positions are being closed rather than new shorts entering.
The funding rate is still in the upper end of its recent range, which makes this a bit painful—crowded longs plus a price breakdown is a classic case of a crowded trade getting squeezed out.
The closing price has already fallen below the lower bound of the recent 20-candle 5m range, and OI anomalies across several timeframes are persisting. It ranks #28 for anomalies across the entire pool and #27 for notional change. This kind of repeated confirmation really doesn’t look like a fake move.
24h trading volume is 28.72M, and market depth isn’t a major concern, but the short-term direction is clearly bearish. First, let’s see if this level can hold. If it doesn’t, the liquidation of leveraged positions may not be over yet.

·
--
🎯 $ORDER LONG · 50X · ROE +28.5% locked in
📍 Entry 0.0403 → Exit 0.0426
⏱ Held for 22 minutes; TP1 hit precisely
🧠 This trade wasn’t a guess—the LLM strategy #27 identified the target 6 minutes in advance:
• 24h plunge of -22.67%, followed by another -3.87% drop in 1h; 5m/15m RSI at 33.1/31.2, both oversold
• Bounced +3.73% from the low of 0.03913; 5m long lower-wick Pinbar with a 1.7x wick ratio—a signal that the downtrend was losing steam
• 5m price moved above EMA20 + MACD histogram bars expanded; aggressive buying returned to 51.8%
• Market regime MILD_BULL, score 65—trend confirmation passed
Wait for a signal while screening on the left side; only pull the trigger once a reversal is confirmed on the right side—limit order at the 0.0403 pullback level, no chasing.
🛡️ Discipline: Take partial profits at TP1, move the SL on the remainder to breakeven; time-based circuit breaker if ROE<+18% after 30 minutes, with an exception for large profits.
This trade had a 2.8:1 risk-reward ratio. Did you catch it? Share your entry price in the comments 👇
#币安合约 #实盘战报 #量化交易 #ORDER
🎯 $ORDER LONG · 50X · ROE +28.5% locked in
📍 Entry 0.0403 → Exit 0.0426
⏱ Held for 22 minutes; TP1 hit precisely
🧠 This trade wasn’t a guess—the LLM strategy #27 identified the target 6 minutes in advance:
• 24h plunge of -22.67%, followed by another -3.87% drop in 1h; 5m/15m RSI at 33.1/31.2, both oversold
• Bounced +3.73% from the low of 0.03913; 5m long lower-wick Pinbar with a 1.7x wick ratio—a signal that the downtrend was losing steam
• 5m price moved above EMA20 + MACD histogram bars expanded; aggressive buying returned to 51.8%
• Market regime MILD_BULL, score 65—trend confirmation passed
Wait for a signal while screening on the left side; only pull the trigger once a reversal is confirmed on the right side—limit order at the 0.0403 pullback level, no chasing.
🛡️ Discipline: Take partial profits at TP1, move the SL on the remainder to breakeven; time-based circuit breaker if ROE<+18% after 30 minutes, with an exception for large profits.
This trade had a 2.8:1 risk-reward ratio. Did you catch it? Share your entry price in the comments 👇
#币安合约 #实盘战报 #量化交易 #ORDER
📍 Entry 0.0403 → Exit 0.0426
⏱ Held for 22 minutes; TP1 hit precisely
🧠 This trade wasn’t a guess—the LLM strategy #27 identified the target 6 minutes in advance:
• 24h plunge of -22.67%, followed by another -3.87% drop in 1h; 5m/15m RSI at 33.1/31.2, both oversold
• Bounced +3.73% from the low of 0.03913; 5m long lower-wick Pinbar with a 1.7x wick ratio—a signal that the downtrend was losing steam
• 5m price moved above EMA20 + MACD histogram bars expanded; aggressive buying returned to 51.8%
• Market regime MILD_BULL, score 65—trend confirmation passed
Wait for a signal while screening on the left side; only pull the trigger once a reversal is confirmed on the right side—limit order at the 0.0403 pullback level, no chasing.
🛡️ Discipline: Take partial profits at TP1, move the SL on the remainder to breakeven; time-based circuit breaker if ROE<+18% after 30 minutes, with an exception for large profits.
This trade had a 2.8:1 risk-reward ratio. Did you catch it? Share your entry price in the comments 👇
#币安合约 #实盘战报 #量化交易 #ORDER
192
·
--
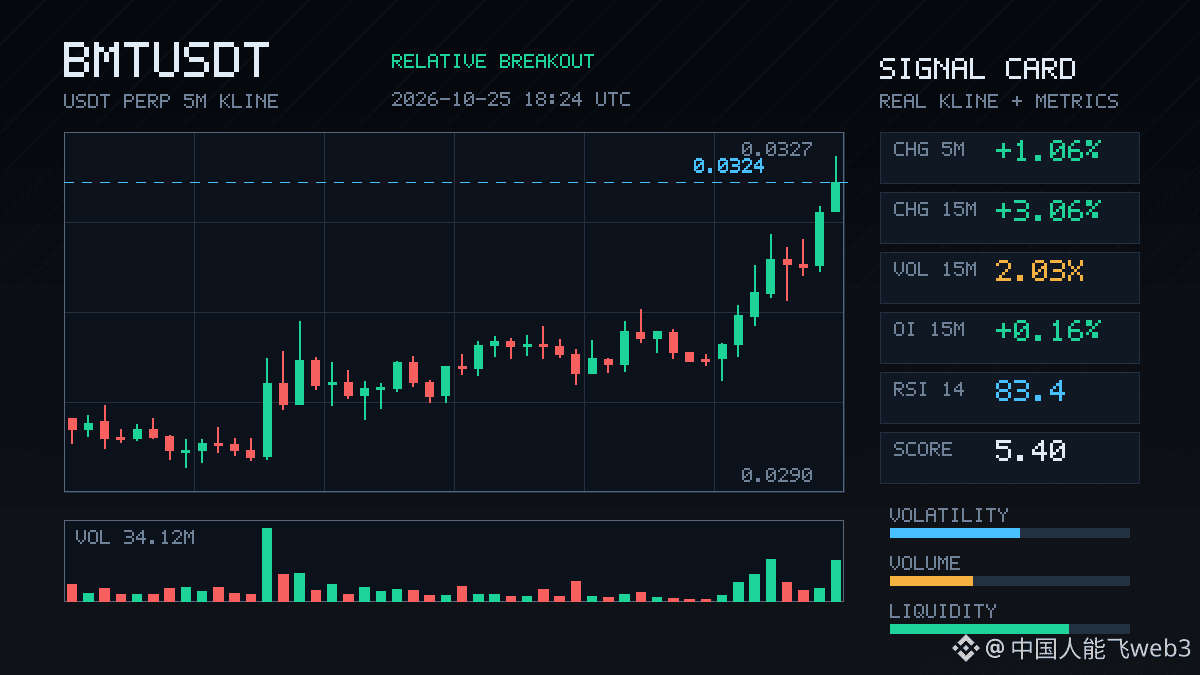
$BMT made a decisive 15m move, +3.06%, breaking straight through the upper end of the range from the last 20 5m candles, with volume also rising to 2x normal. The key is OI—1h contracts are up +2.08%, or +439K notional. Combined with the price rise, this looks more like new leveraged longs pushing the move than simple short covering. The aggressive trade delta is +15.1%, and the buy/sell ratio is 1.36, showing a bias toward buyers. Notional change ranks #27 across the full pool, and depth confirmation has also passed. This kind of setup can quickly ignite short-term sentiment, but once leveraged longs start piling in, pullbacks can also become more pronounced. Keep a close eye on OI to make sure it doesn't accelerate further.
$BMT made a decisive 15m move, +3.06%, breaking straight through the upper end of the range from the last 20 5m candles, with volume also rising to 2x normal. The key is OI—1h contracts are up +2.08%, or +439K notional. Combined with the price rise, this looks more like new leveraged longs pushing the move than simple short covering. The aggressive trade delta is +15.1%, and the buy/sell ratio is 1.36, showing a bias toward buyers. Notional change ranks #27 across the full pool, and depth confirmation has also passed. This kind of setup can quickly ignite short-term sentiment, but once leveraged longs start piling in, pullbacks can also become more pronounced. Keep a close eye on OI to make sure it doesn't accelerate further.
5
·
--
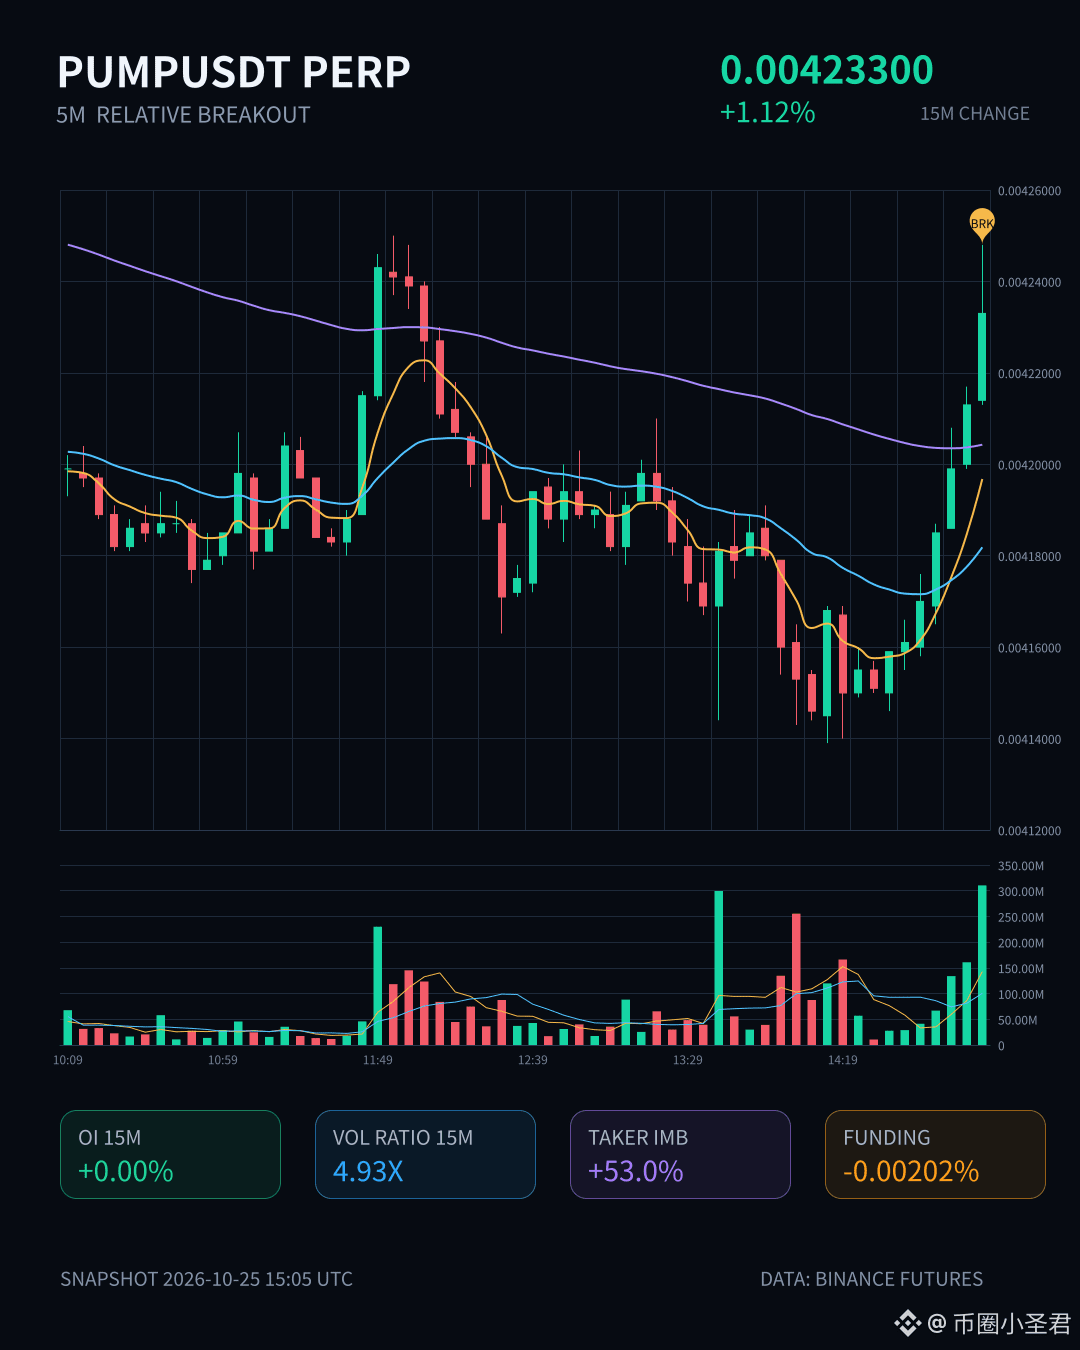
$PUMP had a clean 15m push, with volume hitting 4.9x normal levels. The taker buy/sell ratio was 3.26, and the buy-sell volume delta was 53%—buyers were clearly pushing in one direction. Price just closed near the top of its recent 20-candle 5m range, breaking through the recent boundary.
OI was up 1% on the 15m and 0.35% on the 1h, reaching 1.19M USDT. Its anomaly percentile was 92.1%, ranking #27 across the pool and #15 for notional change. These aren’t explosive figures, but the move has continued over several periods, which looks more like fresh leveraged longs gradually entering than shorts getting squeezed. 24h trading volume was 92.98M, with adequate liquidity.
The structure is bullish, but OI is rising more modestly than price. Be careful not to chase at the top of the range; wait for a pullback and confirmation.
$PUMP had a clean 15m push, with volume hitting 4.9x normal levels. The taker buy/sell ratio was 3.26, and the buy-sell volume delta was 53%—buyers were clearly pushing in one direction. Price just closed near the top of its recent 20-candle 5m range, breaking through the recent boundary.
OI was up 1% on the 15m and 0.35% on the 1h, reaching 1.19M USDT. Its anomaly percentile was 92.1%, ranking #27 across the pool and #15 for notional change. These aren’t explosive figures, but the move has continued over several periods, which looks more like fresh leveraged longs gradually entering than shorts getting squeezed. 24h trading volume was 92.98M, with adequate liquidity.
The structure is bullish, but OI is rising more modestly than price. Be careful not to chase at the top of the range; wait for a pullback and confirmation.
OI was up 1% on the 15m and 0.35% on the 1h, reaching 1.19M USDT. Its anomaly percentile was 92.1%, ranking #27 across the pool and #15 for notional change. These aren’t explosive figures, but the move has continued over several periods, which looks more like fresh leveraged longs gradually entering than shorts getting squeezed. 24h trading volume was 92.98M, with adequate liquidity.
The structure is bullish, but OI is rising more modestly than price. Be careful not to chase at the top of the range; wait for a pullback and confirmation.
10
·
--
$SUI This 15m move is interesting: the drop isn’t large, but volume has climbed to 1.93x. Price has broken below the lows of the past 20 5m candles, aggressive trade imbalance is -30.3%, and the buy/sell ratio is 0.53, with sellers in control. The key point is that OI is falling in tandem rather than rising—this looks more like longs deleveraging and stops getting triggered than fresh shorts entering and driving the price down. The anomaly percentile ranks 71.2% at #27 across the pool, while nominal change ranks #15—not huge, but not insignificant, and there is depth confirmation. For a pool with 24h trading volume of 205M, this volume-price structure is worth watching to see whether it can hold above the lower end of the range. If it can’t, the leverage flush may not be over yet.
$SUI This 15m move is interesting: the drop isn’t large, but volume has climbed to 1.93x. Price has broken below the lows of the past 20 5m candles, aggressive trade imbalance is -30.3%, and the buy/sell ratio is 0.53, with sellers in control. The key point is that OI is falling in tandem rather than rising—this looks more like longs deleveraging and stops getting triggered than fresh shorts entering and driving the price down. The anomaly percentile ranks 71.2% at #27 across the pool, while nominal change ranks #15—not huge, but not insignificant, and there is depth confirmation. For a pool with 24h trading volume of 205M, this volume-price structure is worth watching to see whether it can hold above the lower end of the range. If it can’t, the leverage flush may not be over yet.
5
·
--
$DOT This 15m move is somewhat interesting—the price is down 0.85%, which isn't extreme, but volume is up to 2.16x, the aggressive trading imbalance is -12.9%, and the buy/sell ratio is 0.77, so the selling is highly concentrated. More importantly, OI is up 0.88% over 1h while price is moving lower. That's a classic sign of fresh leveraged shorts entering, not a drop caused by existing longs closing. The close also broke below the low of the last 20 or so 5m candles, effectively giving up the recent support level.
The OI anomaly percentile is 86.3%, ranking #27 across the entire pool—not headline-worthy, but not exactly clean either. With this kind of setup, I wouldn't feel comfortable chasing shorts. Instead, I'd watch to see whether a rebound forces the shorts into a squeeze—the faster leverage piles up, the uglier the covering can get. For now, just watch; no need to rush.
$DOT This 15m move is somewhat interesting—the price is down 0.85%, which isn't extreme, but volume is up to 2.16x, the aggressive trading imbalance is -12.9%, and the buy/sell ratio is 0.77, so the selling is highly concentrated. More importantly, OI is up 0.88% over 1h while price is moving lower. That's a classic sign of fresh leveraged shorts entering, not a drop caused by existing longs closing. The close also broke below the low of the last 20 or so 5m candles, effectively giving up the recent support level.
The OI anomaly percentile is 86.3%, ranking #27 across the entire pool—not headline-worthy, but not exactly clean either. With this kind of setup, I wouldn't feel comfortable chasing shorts. Instead, I'd watch to see whether a rebound forces the shorts into a squeeze—the faster leverage piles up, the uglier the covering can get. For now, just watch; no need to rush.
The OI anomaly percentile is 86.3%, ranking #27 across the entire pool—not headline-worthy, but not exactly clean either. With this kind of setup, I wouldn't feel comfortable chasing shorts. Instead, I'd watch to see whether a rebound forces the shorts into a squeeze—the faster leverage piles up, the uglier the covering can get. For now, just watch; no need to rush.
3
·
--
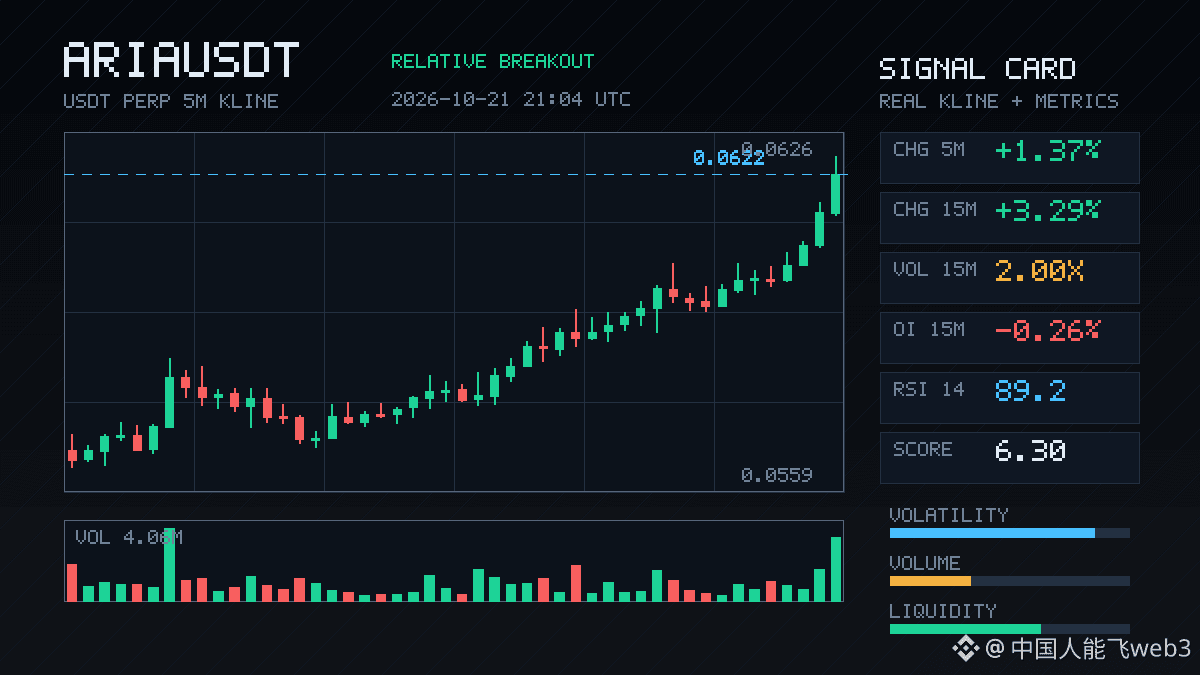
$ARIA This move up is pretty interesting: it jumped 3.29% in 15m, with volume at 2x and a taker buy/sell ratio of 1.76. It also closed above the top of the range from the last 20 5m candles.
But looking closely, OI is falling: 1h contract OI is down 0.47%, while notional change is increasing. Put simply, this structure looks more like short covering than a rally fueled by new longs coming in. Price is up while open interest is down, so be cautious about chasing the move—don’t mistake short covering for the start of a trend.
It ranks #27 for anomalies across the entire pool and #32 for notional change, with 24h volume around 75M. There is confirmation in terms of market depth. Still, with a breakout diverging from OI, I’d wait to see whether price can retest and hold above the range before drawing conclusions.
$ARIA This move up is pretty interesting: it jumped 3.29% in 15m, with volume at 2x and a taker buy/sell ratio of 1.76. It also closed above the top of the range from the last 20 5m candles.
But looking closely, OI is falling: 1h contract OI is down 0.47%, while notional change is increasing. Put simply, this structure looks more like short covering than a rally fueled by new longs coming in. Price is up while open interest is down, so be cautious about chasing the move—don’t mistake short covering for the start of a trend.
It ranks #27 for anomalies across the entire pool and #32 for notional change, with 24h volume around 75M. There is confirmation in terms of market depth. Still, with a breakout diverging from OI, I’d wait to see whether price can retest and hold above the range before drawing conclusions.
But looking closely, OI is falling: 1h contract OI is down 0.47%, while notional change is increasing. Put simply, this structure looks more like short covering than a rally fueled by new longs coming in. Price is up while open interest is down, so be cautious about chasing the move—don’t mistake short covering for the start of a trend.
It ranks #27 for anomalies across the entire pool and #32 for notional change, with 24h volume around 75M. There is confirmation in terms of market depth. Still, with a breakout diverging from OI, I’d wait to see whether price can retest and hold above the range before drawing conclusions.
3
Log in to explore more content
Join global crypto users on Binance Square
⚡️ Get latest and useful information about crypto.
💬 Trusted by the world’s largest crypto exchange.
👍 Discover real insights from verified creators.
Email / Phone number
Trending Topics
1
#XRPDropsToTwoYearLowNear87Cents
5,974 views
135 Discussing
2
#BitcoinFallsBelow$57KToTwoYearLow
3,717 views
30 Discussing
3
#NvidiaLoses$2.7TrillionInMonthAndAHalf
924 views
41 Discussing
4
#CanBTCReboundAfterFallingBelow60K?
533,149 views
2,281 Discussing
5
#GlobalStocksFaceLongestLosingStreakSince2023
183,463 views
1,576 Discussing
6
#BlackRockIBITPostsRecord$541MSingleDayOutflow
13,482 views
53 Discussing
7
#AnthropicPlungesTowardIPOPriceonDay2
90,276 views
903 Discussing
8
#TwentyOneCapitalAdds172.25BTC
37,703 views
423 Discussing
9
#HKBillWouldExcludeTokenizedDepositsFromVirtualAssets
3,355 views
43 Discussing
10
#BNBDropsBelow540USDTWith8.46%DailyDecline
52,410 views
471 Discussing