
#19
19
20,189 views
311 Discussing
Hot
Latest

Mood Meter #19
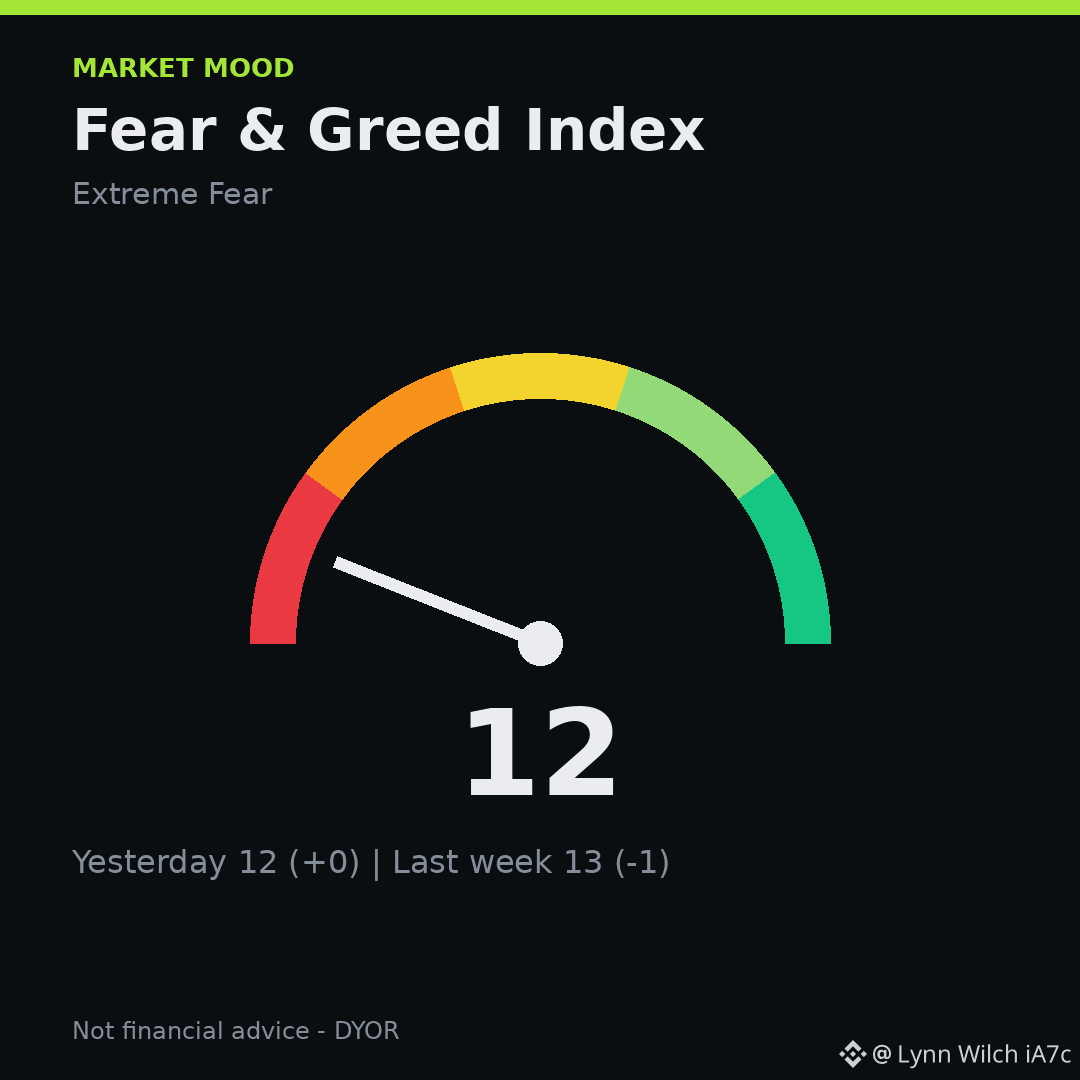
😱 Fear & Greed Index at 12, extreme fear, yesterday same, last week 13 down 1.
$BTC $59,513 (-3.16%)
$SOL $69.74 (-1.47%)
I'm watching the dip and feeling a bit uneasy myself. Where do you sit, fearful, neutral or greedy?
#FearAndGreed #Bitcoin
Mood Meter #19
😱 Fear & Greed Index at 12, extreme fear, yesterday same, last week 13 down 1.
$BTC $59,513 (-3.16%)
$SOL $69.74 (-1.47%)
I'm watching the dip and feeling a bit uneasy myself. Where do you sit, fearful, neutral or greedy?
#FearAndGreed #Bitcoin
😱 Fear & Greed Index at 12, extreme fear, yesterday same, last week 13 down 1.
$BTC $59,513 (-3.16%)
$SOL $69.74 (-1.47%)
I'm watching the dip and feeling a bit uneasy myself. Where do you sit, fearful, neutral or greedy?
#FearAndGreed #Bitcoin
50

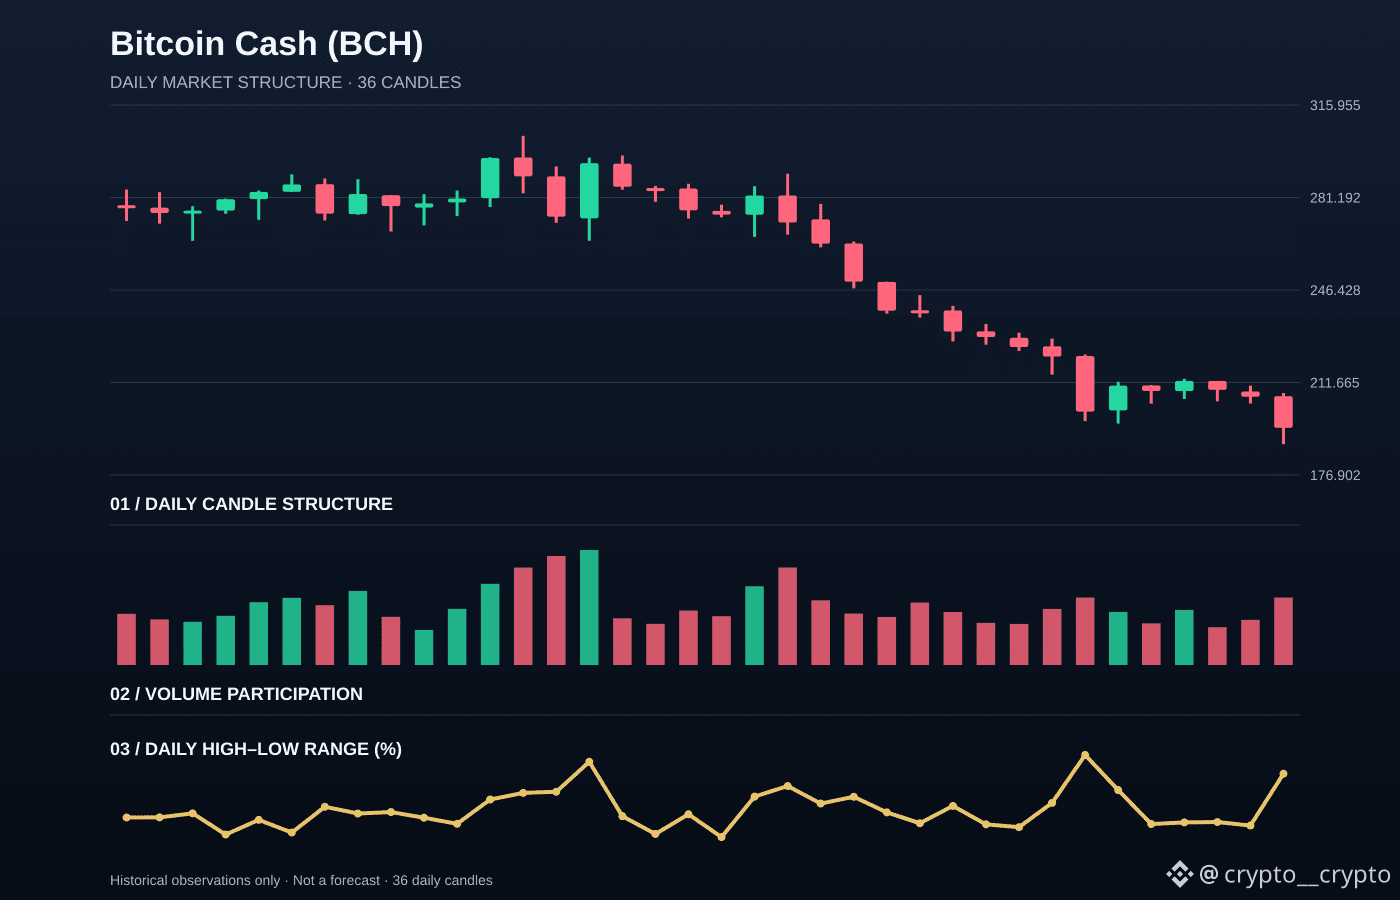
Bitcoin Cash (BCH) declined 5.66% between the last two available daily closes. The detail I am watching is how that move finished, not just the headline percentage.
The close landed around the middle of the daily range, so neither side dominated the finish. A recovery close would suggest supply is easing; another weak close would keep downside pressure in focus.
BCH is worth tracking at the next daily close: does the market accept the latest price area, or reject it? The latest candle covered 10.19% from low to high, with OHLC: 206.52901 / 207.70143 / 188.48938 / 194.63283.
For context, the 24-hour market move is -10.29%, while reported turnover is approximately 190.78M USD. CoinMarketCap rank: #19. Benchmark snapshot: BTC -9.69% · ETH -9.92%.
Are you reading BCH as continuation or a pause? Explain the price level behind your view.
Data note: CMC listings market quote and CoinLore daily candles. These are observed market figures, not a price prediction or a trade instruction.
$BCH $BTC $ETH
Bitcoin Cash (BCH) declined 5.66% between the last two available daily closes. The detail I am watching is how that move finished, not just the headline percentage.
The close landed around the middle of the daily range, so neither side dominated the finish. A recovery close would suggest supply is easing; another weak close would keep downside pressure in focus.
BCH is worth tracking at the next daily close: does the market accept the latest price area, or reject it? The latest candle covered 10.19% from low to high, with OHLC: 206.52901 / 207.70143 / 188.48938 / 194.63283.
For context, the 24-hour market move is -10.29%, while reported turnover is approximately 190.78M USD. CoinMarketCap rank: #19. Benchmark snapshot: BTC -9.69% · ETH -9.92%.
Are you reading BCH as continuation or a pause? Explain the price level behind your view.
Data note: CMC listings market quote and CoinLore daily candles. These are observed market figures, not a price prediction or a trade instruction.
$BCH $BTC $ETH
The close landed around the middle of the daily range, so neither side dominated the finish. A recovery close would suggest supply is easing; another weak close would keep downside pressure in focus.
BCH is worth tracking at the next daily close: does the market accept the latest price area, or reject it? The latest candle covered 10.19% from low to high, with OHLC: 206.52901 / 207.70143 / 188.48938 / 194.63283.
For context, the 24-hour market move is -10.29%, while reported turnover is approximately 190.78M USD. CoinMarketCap rank: #19. Benchmark snapshot: BTC -9.69% · ETH -9.92%.
Are you reading BCH as continuation or a pause? Explain the price level behind your view.
Data note: CMC listings market quote and CoinLore daily candles. These are observed market figures, not a price prediction or a trade instruction.
$BCH $BTC $ETH
1
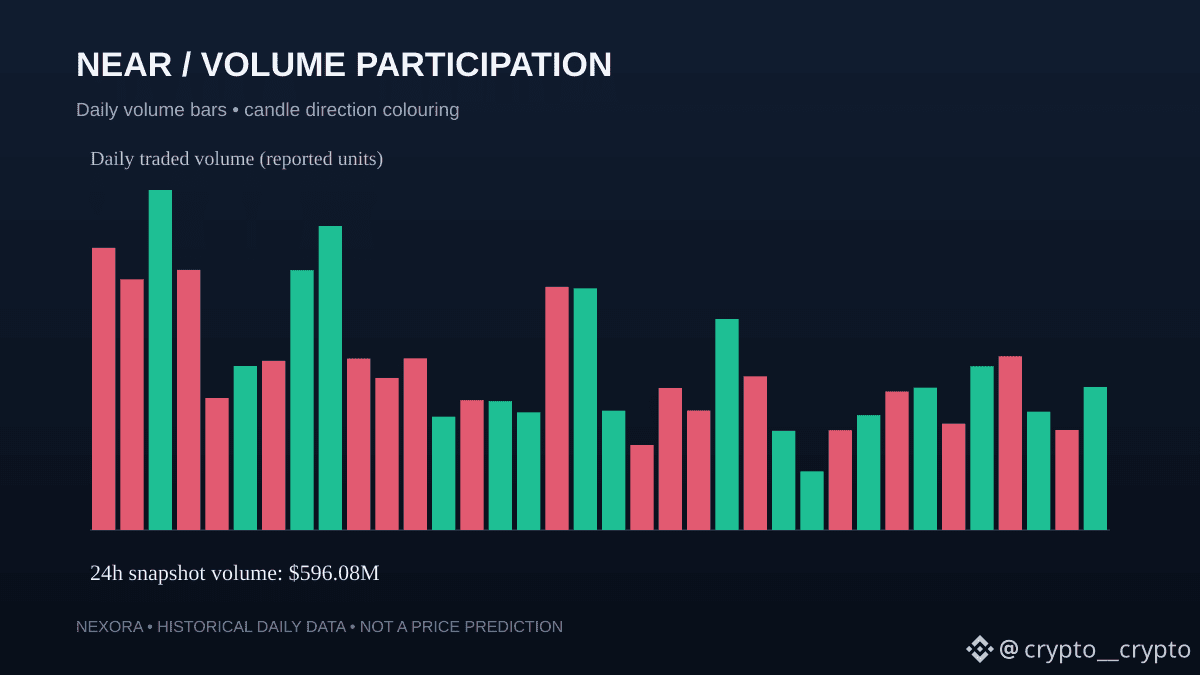
NEAR Protocol is holding a positive 24-hour reading in this market snapshot.
CMC rank #19. The quoted price is $3.198054, with a 24-hour change of +1.48%.
Reported 24-hour volume is $596.08M and market capitalization is $4.20B.
Turnover is elevated enough to make participation worth watching.
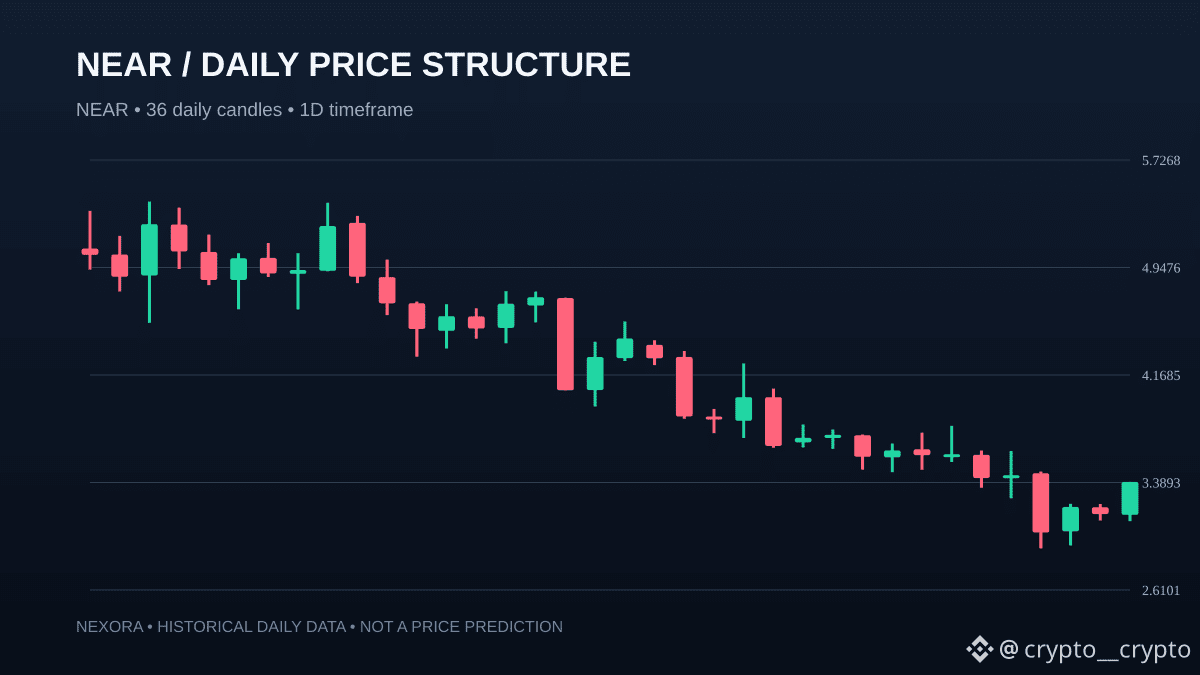
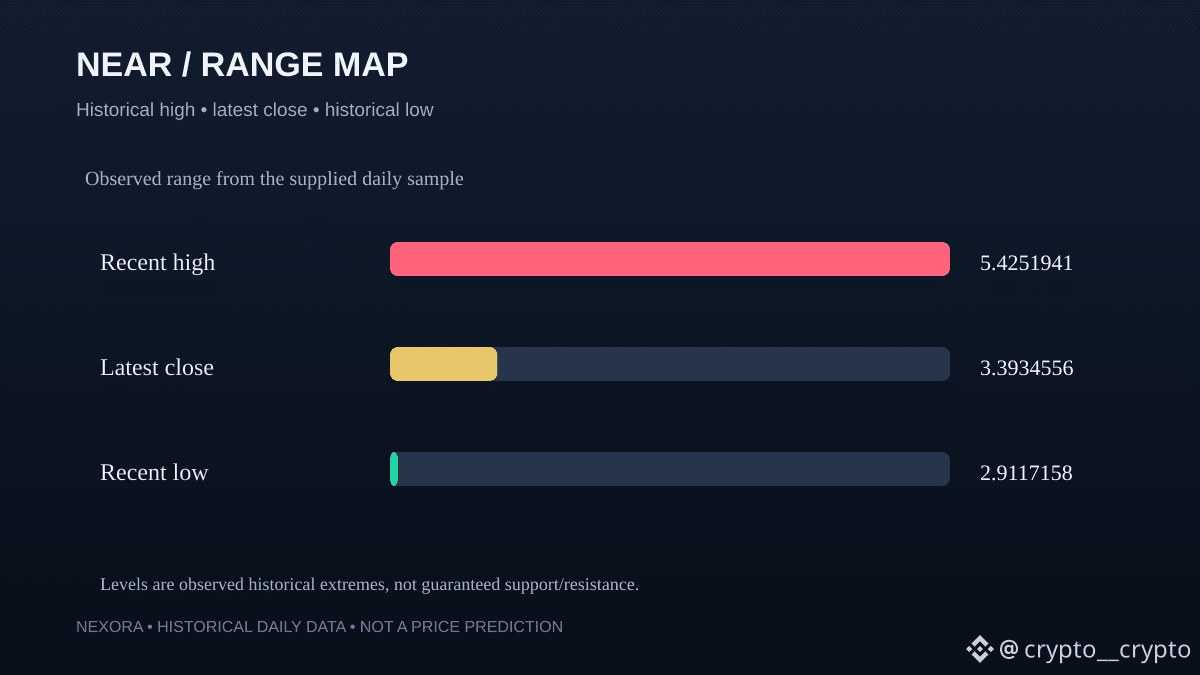
The latest daily candle ranges from $3.1090105 to $3.3934556 (9.15%). Its close changed +7.38% versus the previous candle.
Across the displayed sample, the latest close is 33.26% below the first candle's open.
What to watch next: whether the next daily close confirms or rejects this range, and whether volume expands with the move. These observations describe the supplied data, not a prediction.
Market data: CoinMarketCap snapshot; daily OHLCV: CoinLore.
Research commentary only; not financial advice.
$NEAR #Crypto #NEXORA
NEAR Protocol is holding a positive 24-hour reading in this market snapshot.
CMC rank #19. The quoted price is $3.198054, with a 24-hour change of +1.48%.
Reported 24-hour volume is $596.08M and market capitalization is $4.20B.
Turnover is elevated enough to make participation worth watching.
The latest daily candle ranges from $3.1090105 to $3.3934556 (9.15%). Its close changed +7.38% versus the previous candle.
Across the displayed sample, the latest close is 33.26% below the first candle's open.
What to watch next: whether the next daily close confirms or rejects this range, and whether volume expands with the move. These observations describe the supplied data, not a prediction.
Market data: CoinMarketCap snapshot; daily OHLCV: CoinLore.
Research commentary only; not financial advice.
$NEAR #Crypto #NEXORA
CMC rank #19. The quoted price is $3.198054, with a 24-hour change of +1.48%.
Reported 24-hour volume is $596.08M and market capitalization is $4.20B.
Turnover is elevated enough to make participation worth watching.
The latest daily candle ranges from $3.1090105 to $3.3934556 (9.15%). Its close changed +7.38% versus the previous candle.
Across the displayed sample, the latest close is 33.26% below the first candle's open.
What to watch next: whether the next daily close confirms or rejects this range, and whether volume expands with the move. These observations describe the supplied data, not a prediction.
Market data: CoinMarketCap snapshot; daily OHLCV: CoinLore.
Research commentary only; not financial advice.
$NEAR #Crypto #NEXORA
57

·
--
Bearish
$ROBO How are we doing today? Bouncing to drop a little more, or is it time to fly? I’ll read your comments...
Oh, by the way, the launch of #Anthropic is approaching, which could generate a fabulous bounce. #19 November $ANT
#BTC #FABRIC #protocol
$ROBO How are we doing today? Bouncing to drop a little more, or is it time to fly? I’ll read your comments...
Oh, by the way, the launch of #Anthropic is approaching, which could generate a fabulous bounce. #19 November $ANT
#BTC #FABRIC #protocol
Oh, by the way, the launch of #Anthropic is approaching, which could generate a fabulous bounce. #19 November $ANT
#BTC #FABRIC #protocol
GAREEBO WHALE :
Robo Delist Soon Just Short it
2
1
134

·
--
🚨 MYX has crashed! Down 21.1% in 24H, with this sell-off giving bulls no room to breathe.
But here's what's interesting: trading volume surged to 2.6×, while OI fell 0.7%; there was no KOL push on X, and BSQ ranked only #19. The price is falling, but the buzz hasn't followed—these figures definitely need verification.
📊 What does this mean? Anyone looking to buy the dip is afraid of catching a falling knife, while anyone chasing a rebound fears being the last one in. Without social buzz to back it up, rising volume during a decline alone hardly proves that capital is flowing back in.
My take: short-term bearish—I'm absolutely not blindly catching this falling knife! If volume picks up, the price stabilizes, and social buzz returns, then a rebound may be worth watching. If the sell-off continues on rising volume, the risk of a bull capitulation remains.
Will MYX keep probing lower, or stabilize on rising volume and rebound? 👇 #MYX #CryptoMarket
🚨 MYX has crashed! Down 21.1% in 24H, with this sell-off giving bulls no room to breathe.
But here's what's interesting: trading volume surged to 2.6×, while OI fell 0.7%; there was no KOL push on X, and BSQ ranked only #19. The price is falling, but the buzz hasn't followed—these figures definitely need verification.
📊 What does this mean? Anyone looking to buy the dip is afraid of catching a falling knife, while anyone chasing a rebound fears being the last one in. Without social buzz to back it up, rising volume during a decline alone hardly proves that capital is flowing back in.
My take: short-term bearish—I'm absolutely not blindly catching this falling knife! If volume picks up, the price stabilizes, and social buzz returns, then a rebound may be worth watching. If the sell-off continues on rising volume, the risk of a bull capitulation remains.
Will MYX keep probing lower, or stabilize on rising volume and rebound? 👇 #MYX #CryptoMarket
But here's what's interesting: trading volume surged to 2.6×, while OI fell 0.7%; there was no KOL push on X, and BSQ ranked only #19. The price is falling, but the buzz hasn't followed—these figures definitely need verification.
📊 What does this mean? Anyone looking to buy the dip is afraid of catching a falling knife, while anyone chasing a rebound fears being the last one in. Without social buzz to back it up, rising volume during a decline alone hardly proves that capital is flowing back in.
My take: short-term bearish—I'm absolutely not blindly catching this falling knife! If volume picks up, the price stabilizes, and social buzz returns, then a rebound may be worth watching. If the sell-off continues on rising volume, the risk of a bull capitulation remains.
Will MYX keep probing lower, or stabilize on rising volume and rebound? 👇 #MYX #CryptoMarket
21

Article
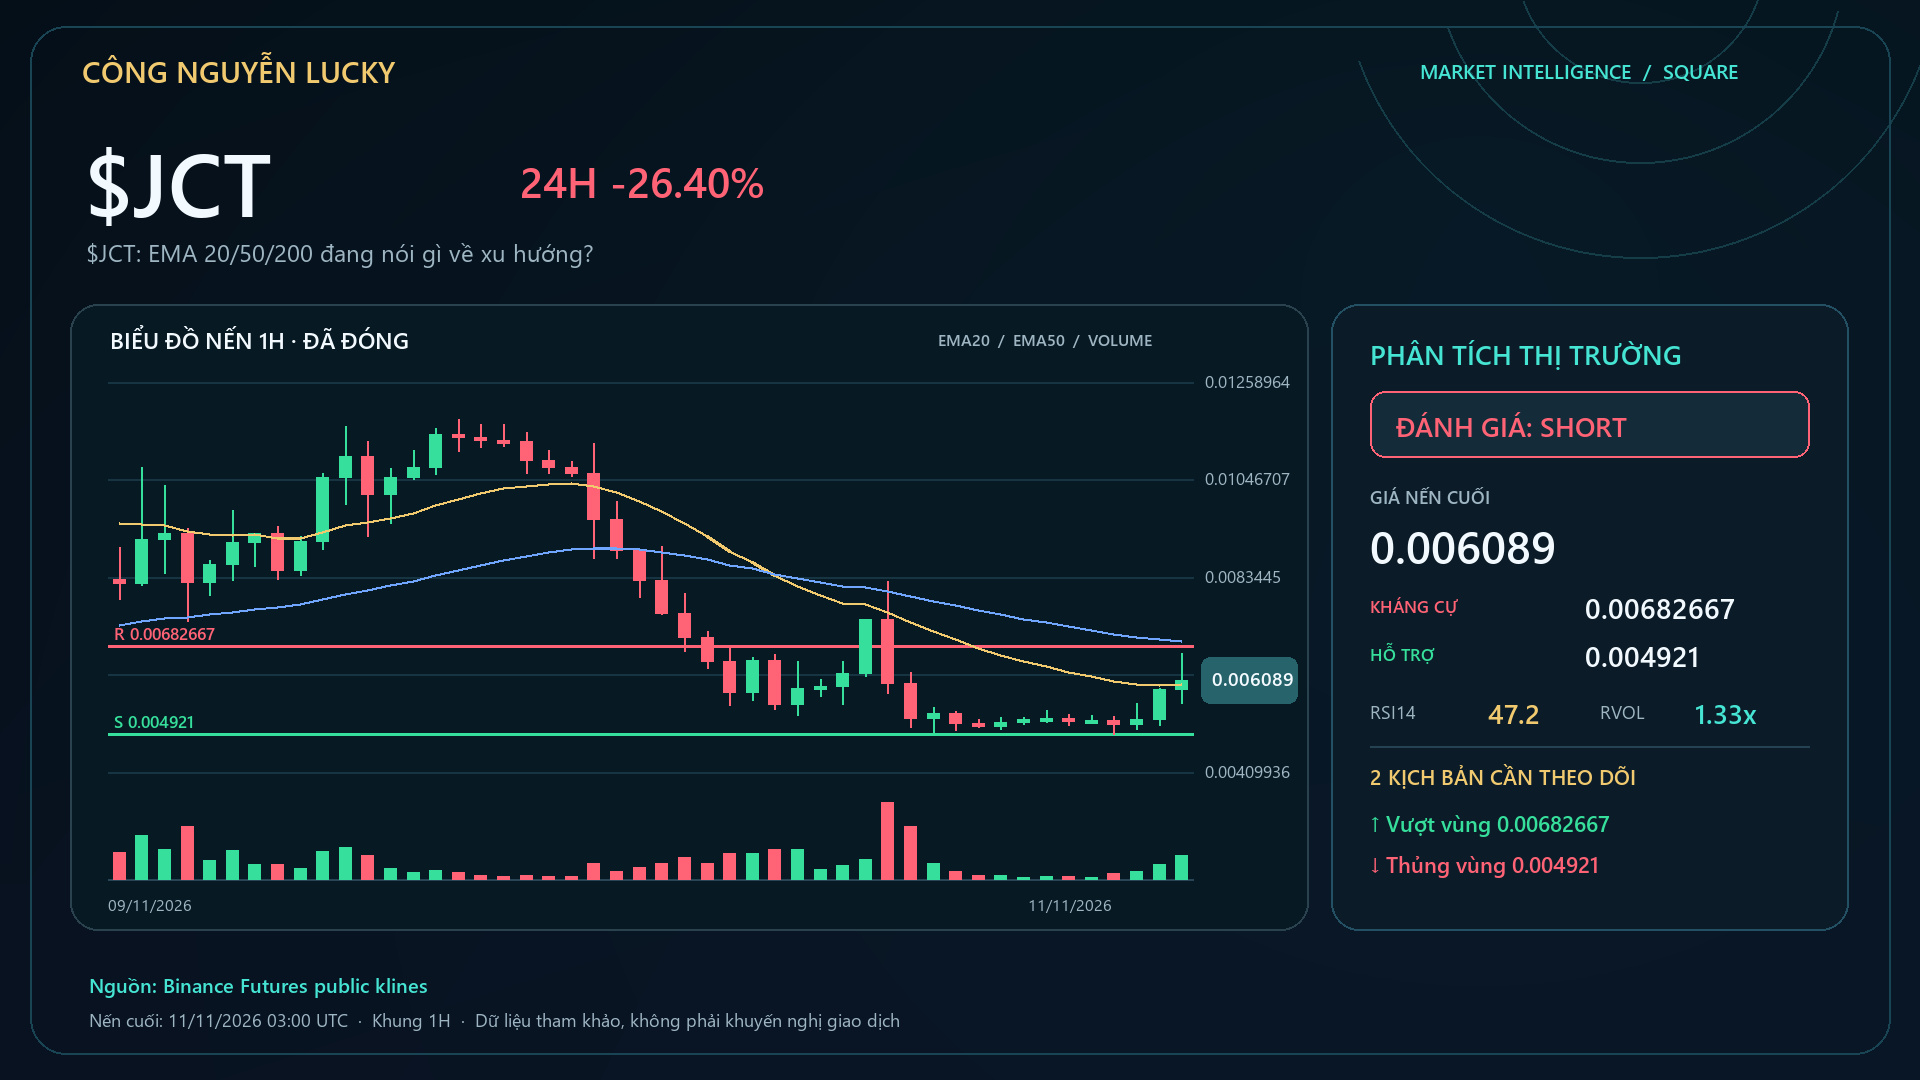
$JCT: What are the 20/50/200 EMAs saying about the trend?🔥 $JCT down -23.47% — but the percentage change alone isn't enough to call this a good setup. Market: 0.005994 · 24h -23.47% · volume ~566.9M USDT · 8,997,375 trades.
EMA20 0.00599648 · EMA50 0.00694748 · EMA200 0.00575407.
Structure: LH_LL · RSI14 47.2 · MACD histogram 0.000193572. Technical bias: NEUTRAL 63/100. EMA is only a trend filter; I only increase conviction when structure + momentum + money flow all confirm.
Nearby support/resistance: 0.004921 / 0.00682667. Technical layers are selected according to the regime:
$JCT: What are the 20/50/200 EMAs saying about the trend?
🔥 $JCT down -23.47% — but the percentage change alone isn't enough to call this a good setup. Market: 0.005994 · 24h -23.47% · volume ~566.9M USDT · 8,997,375 trades.
EMA20 0.00599648 · EMA50 0.00694748 · EMA200 0.00575407.
Structure: LH_LL · RSI14 47.2 · MACD histogram 0.000193572. Technical bias: NEUTRAL 63/100. EMA is only a trend filter; I only increase conviction when structure + momentum + money flow all confirm.
Nearby support/resistance: 0.004921 / 0.00682667. Technical layers are selected according to the regime:
EMA20 0.00599648 · EMA50 0.00694748 · EMA200 0.00575407.
Structure: LH_LL · RSI14 47.2 · MACD histogram 0.000193572. Technical bias: NEUTRAL 63/100. EMA is only a trend filter; I only increase conviction when structure + momentum + money flow all confirm.
Nearby support/resistance: 0.004921 / 0.00682667. Technical layers are selected according to the regime:
425

·
--
$AKE This move is pretty interesting: it surged 4.29% in 15m, with volume hitting 2.68 times its usual level, and closed above the highs of nearly the last 20 5m candles. But take a closer look at OI: down 0.90% over 15m and 1.71% over 1h. The price is rising while positions are shrinking—this looks less like new longs coming in and more like shorts being caught off guard, with a short squeeze pushing the price up. The aggressive buy/sell ratio is 1.32 and the volume delta is 13.7%, so short-term buying is indeed skewed to the upside. The notional change also ranks #19 across the pool. However, the OI anomaly percentile is only 45%, which suggests positioning hasn’t reached an extreme. Be careful chasing this kind of setup: once the short covering stops, it may be hard for buyers to step in. For now, let’s see if it can hold above the top of this range.
$AKE This move is pretty interesting: it surged 4.29% in 15m, with volume hitting 2.68 times its usual level, and closed above the highs of nearly the last 20 5m candles. But take a closer look at OI: down 0.90% over 15m and 1.71% over 1h. The price is rising while positions are shrinking—this looks less like new longs coming in and more like shorts being caught off guard, with a short squeeze pushing the price up. The aggressive buy/sell ratio is 1.32 and the volume delta is 13.7%, so short-term buying is indeed skewed to the upside. The notional change also ranks #19 across the pool. However, the OI anomaly percentile is only 45%, which suggests positioning hasn’t reached an extreme. Be careful chasing this kind of setup: once the short covering stops, it may be hard for buyers to step in. For now, let’s see if it can hold above the top of this range.
9

·
--
$PIEVERSE This move looks somewhat interesting: 15m volume is 1.94× higher, volatility Z is 2.82, and the price has climbed above the upper end of the last 20 5m candles. The aggressive buy/sell ratio is 1.31, leaning toward buyers.
But OI is falling, down 0.15% over 1h, while the notional change is only +1.17%. Rising price with falling open interest looks more like short covering than aggressive new long positioning. The anomaly percentile is 87.9%, ranked #19 across the entire pool. Liquidity is definitely sufficient, but be cautious about chasing a move with this structure.
First, let’s see if it can hold above the range.
$PIEVERSE This move looks somewhat interesting: 15m volume is 1.94× higher, volatility Z is 2.82, and the price has climbed above the upper end of the last 20 5m candles. The aggressive buy/sell ratio is 1.31, leaning toward buyers.
But OI is falling, down 0.15% over 1h, while the notional change is only +1.17%. Rising price with falling open interest looks more like short covering than aggressive new long positioning. The anomaly percentile is 87.9%, ranked #19 across the entire pool. Liquidity is definitely sufficient, but be cautious about chasing a move with this structure.
First, let’s see if it can hold above the range.
But OI is falling, down 0.15% over 1h, while the notional change is only +1.17%. Rising price with falling open interest looks more like short covering than aggressive new long positioning. The anomaly percentile is 87.9%, ranked #19 across the entire pool. Liquidity is definitely sufficient, but be cautious about chasing a move with this structure.
First, let’s see if it can hold above the range.
9
·
--
$XLM : This 15m setup is interesting—the price is down 0.55%, which isn’t much, but volume surged to 3.91x. It also closed below the lower end of the last ~20 5m candles. Aggressive trade flow is -11.4%, the buy/sell ratio is 0.79, and the selling pressure is real. More importantly, OI is also rising: +0.83% over 15m and +1.18% over 1h. Price down, OI up—it looks more like new shorts entering than longs closing. It ranks #19 for anomalies and #25 for notional change, and volume in the order book depth confirms it too. If the price keeps breaking lower on rising volume from here, there could be another short-term move down. On the other hand, if OI stops rising and the price recovers, it’s a false breakout. Keep an eye on it.
$XLM : This 15m setup is interesting—the price is down 0.55%, which isn’t much, but volume surged to 3.91x. It also closed below the lower end of the last ~20 5m candles. Aggressive trade flow is -11.4%, the buy/sell ratio is 0.79, and the selling pressure is real. More importantly, OI is also rising: +0.83% over 15m and +1.18% over 1h. Price down, OI up—it looks more like new shorts entering than longs closing. It ranks #19 for anomalies and #25 for notional change, and volume in the order book depth confirms it too. If the price keeps breaking lower on rising volume from here, there could be another short-term move down. On the other hand, if OI stops rising and the price recovers, it’s a false breakout. Keep an eye on it.
2

·
--
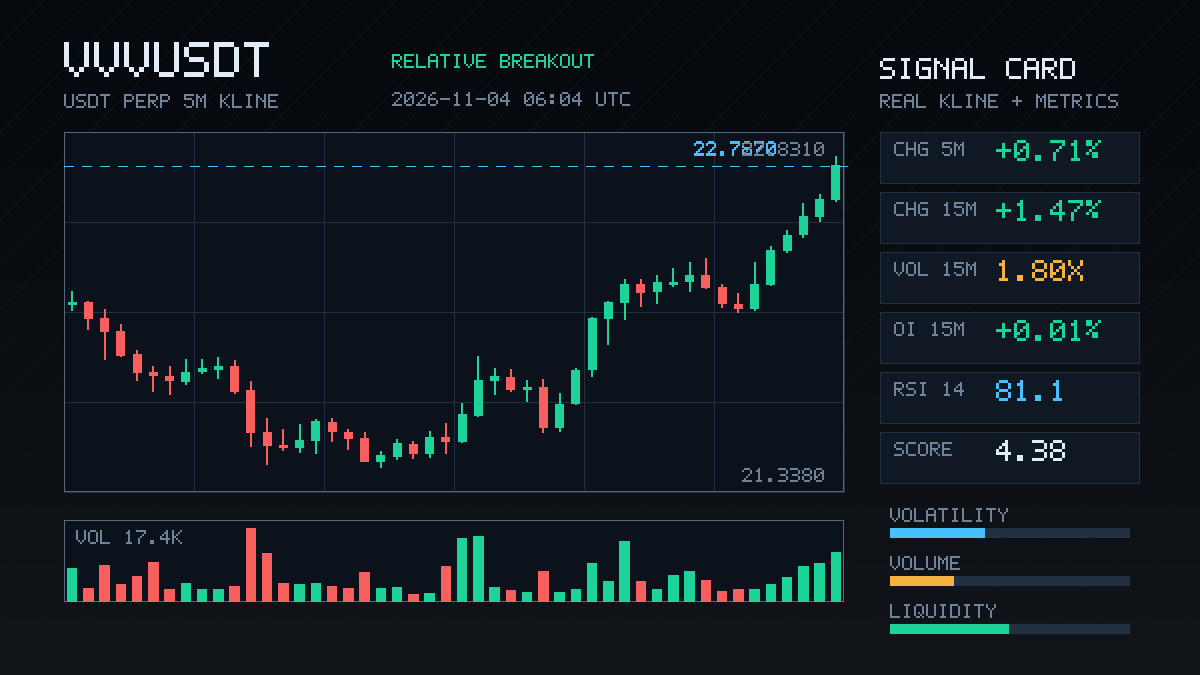
$VVV This is getting interesting: it surged on volume over 15m to 1.47%, with volume 1.8x the norm, and closed above the upper edge of the range from the last 20 5m candles—it wasn’t just a wick; it closed up there.
The OI structure is more worth watching: 15m contracts barely moved, but the 1h notional change was +1.74%, at the 87.1st percentile for anomalies, ranking #19 across the entire pool. Price rose and OI followed, which looks more like new leveraged longs entering than a short-covering burst.
The taker buy-sell volume difference was 20.6%, with a buy/sell ratio of 1.52, tilting toward buyers. 24h trading volume is just over 30M, and liquidity isn’t particularly deep. If it accelerates from here, slippage could be high; on the flip side, a pullback could be sharp.
I’m not chasing the price for now. I’ll wait for a retest of the range’s upper edge and see if it holds; then I’ll decide.
$VVV This is getting interesting: it surged on volume over 15m to 1.47%, with volume 1.8x the norm, and closed above the upper edge of the range from the last 20 5m candles—it wasn’t just a wick; it closed up there.
The OI structure is more worth watching: 15m contracts barely moved, but the 1h notional change was +1.74%, at the 87.1st percentile for anomalies, ranking #19 across the entire pool. Price rose and OI followed, which looks more like new leveraged longs entering than a short-covering burst.
The taker buy-sell volume difference was 20.6%, with a buy/sell ratio of 1.52, tilting toward buyers. 24h trading volume is just over 30M, and liquidity isn’t particularly deep. If it accelerates from here, slippage could be high; on the flip side, a pullback could be sharp.
I’m not chasing the price for now. I’ll wait for a retest of the range’s upper edge and see if it holds; then I’ll decide.
The OI structure is more worth watching: 15m contracts barely moved, but the 1h notional change was +1.74%, at the 87.1st percentile for anomalies, ranking #19 across the entire pool. Price rose and OI followed, which looks more like new leveraged longs entering than a short-covering burst.
The taker buy-sell volume difference was 20.6%, with a buy/sell ratio of 1.52, tilting toward buyers. 24h trading volume is just over 30M, and liquidity isn’t particularly deep. If it accelerates from here, slippage could be high; on the flip side, a pullback could be sharp.
I’m not chasing the price for now. I’ll wait for a retest of the range’s upper edge and see if it holds; then I’ll decide.

·
--
$UNI 15 minutes saw a sudden 1.88% surge, with volume jumping straight to 3.51 times its usual level and a volatility Z-score of 4.23. This isn't an ordinary intraday spike. The key is OI: +0.20% over 15 minutes and +0.54% over 1 hour, with combined notional changes exceeding 3.4M USDT. The anomaly percentile is 93.1%, ranking #19 across the entire pool. This is new leveraged longs entering the market, not the old short-covering routine.
The price just closed above the upper end of the range of the last 20 5-minute candles. The taker volume delta is 8.7%, and the buy/sell ratio is 1.19, showing clear buyer dominance. The funding rate has also climbed to a high percentile recently, suggesting bullish sentiment is getting pricey. 24-hour trading volume is 212 million, with sufficient market depth, but the closer we get to historical extremes, the more cautious we should be: when leverage piles up, prices can surge quickly, but pullbacks won't be gentle either.
Watch whether this breakout can hold. If OI keeps rising while the price doesn't, that's a different story.
$UNI 15 minutes saw a sudden 1.88% surge, with volume jumping straight to 3.51 times its usual level and a volatility Z-score of 4.23. This isn't an ordinary intraday spike. The key is OI: +0.20% over 15 minutes and +0.54% over 1 hour, with combined notional changes exceeding 3.4M USDT. The anomaly percentile is 93.1%, ranking #19 across the entire pool. This is new leveraged longs entering the market, not the old short-covering routine.
The price just closed above the upper end of the range of the last 20 5-minute candles. The taker volume delta is 8.7%, and the buy/sell ratio is 1.19, showing clear buyer dominance. The funding rate has also climbed to a high percentile recently, suggesting bullish sentiment is getting pricey. 24-hour trading volume is 212 million, with sufficient market depth, but the closer we get to historical extremes, the more cautious we should be: when leverage piles up, prices can surge quickly, but pullbacks won't be gentle either.
Watch whether this breakout can hold. If OI keeps rising while the price doesn't, that's a different story.
The price just closed above the upper end of the range of the last 20 5-minute candles. The taker volume delta is 8.7%, and the buy/sell ratio is 1.19, showing clear buyer dominance. The funding rate has also climbed to a high percentile recently, suggesting bullish sentiment is getting pricey. 24-hour trading volume is 212 million, with sufficient market depth, but the closer we get to historical extremes, the more cautious we should be: when leverage piles up, prices can surge quickly, but pullbacks won't be gentle either.
Watch whether this breakout can hold. If OI keeps rising while the price doesn't, that's a different story.
4
·
--
ONDO is looking interesting over the past 15 minutes. The price is down 0.76%, which isn’t much, but volume is 1.57 times normal. The taker trade imbalance is -35%, and the buy/sell ratio is 0.48, indicating notably heavier selling pressure. More importantly, OI is still rising: +0.17% over 1h and +0.06% over 15m. Price down and open interest up looks more like new shorts entering than longs closing. The closing price has already broken below the lower bound of the last 20 5m candles, and its anomaly percentile of 89.1% ranks #19 across the entire pool. I’d watch this structure for confirmation—don’t rush to buy the dip.
ONDO is looking interesting over the past 15 minutes. The price is down 0.76%, which isn’t much, but volume is 1.57 times normal. The taker trade imbalance is -35%, and the buy/sell ratio is 0.48, indicating notably heavier selling pressure. More importantly, OI is still rising: +0.17% over 1h and +0.06% over 15m. Price down and open interest up looks more like new shorts entering than longs closing. The closing price has already broken below the lower bound of the last 20 5m candles, and its anomaly percentile of 89.1% ranks #19 across the entire pool. I’d watch this structure for confirmation—don’t rush to buy the dip.
1

·
--
【Alpha New Entry Monitoring Report】2026-11-02 18:00
■ Sample: Alpha Top 30 (BSC 30 + Solana 30)
■ New entries this period: 14 (BSC 14 / SOL 0)
■ Filters: Top 3 by liquidity; excludes tokens listed within the past 24 hours
━━━━━━━━━━━━━━━
▸ $TAG [BSC]
Liquidity 1.839 million
Alpha ranking #19 (New)
1h inflow list No
Smart money signal None
Overall score 1/6 · Low attention
▸ $ZEST [BSC]
Liquidity 1.592 million
Alpha ranking #28 (New)
1h inflow list No
Smart money signal None
Overall score 1/6 · Low attention
▸ $GWEI [BSC]
Liquidity 1.481 million
Alpha ranking #30 (New)
1h inflow list No
Smart money signal None
Overall score 1/6 · Low attention
━━━━━━━━━━━━━━━
This report is automatically generated and does not constitute investment advice.
#$TAG #$ZEST #$GWEI
【Alpha New Entry Monitoring Report】2026-11-02 18:00
■ Sample: Alpha Top 30 (BSC 30 + Solana 30)
■ New entries this period: 14 (BSC 14 / SOL 0)
■ Filters: Top 3 by liquidity; excludes tokens listed within the past 24 hours
━━━━━━━━━━━━━━━
▸ $TAG [BSC]
Liquidity 1.839 million
Alpha ranking #19 (New)
1h inflow list No
Smart money signal None
Overall score 1/6 · Low attention
▸ $ZEST [BSC]
Liquidity 1.592 million
Alpha ranking #28 (New)
1h inflow list No
Smart money signal None
Overall score 1/6 · Low attention
▸ $GWEI [BSC]
Liquidity 1.481 million
Alpha ranking #30 (New)
1h inflow list No
Smart money signal None
Overall score 1/6 · Low attention
━━━━━━━━━━━━━━━
This report is automatically generated and does not constitute investment advice.
#$TAG #$ZEST #$GWEI
■ Sample: Alpha Top 30 (BSC 30 + Solana 30)
■ New entries this period: 14 (BSC 14 / SOL 0)
■ Filters: Top 3 by liquidity; excludes tokens listed within the past 24 hours
━━━━━━━━━━━━━━━
▸ $TAG [BSC]
Liquidity 1.839 million
Alpha ranking #19 (New)
1h inflow list No
Smart money signal None
Overall score 1/6 · Low attention
▸ $ZEST [BSC]
Liquidity 1.592 million
Alpha ranking #28 (New)
1h inflow list No
Smart money signal None
Overall score 1/6 · Low attention
▸ $GWEI [BSC]
Liquidity 1.481 million
Alpha ranking #30 (New)
1h inflow list No
Smart money signal None
Overall score 1/6 · Low attention
━━━━━━━━━━━━━━━
This report is automatically generated and does not constitute investment advice.
#$TAG #$ZEST #$GWEI
572
·
--
$TAO This dip is worth noting—the price fell 0.57%, which isn't much, but 15m trading volume surged to 2.58x, the aggressive trade delta was -15.2%, and the buy/sell ratio was 0.74, with selling pressure clearly dominant. Meanwhile, 1h OI is still rising slightly. A falling price with rising OI looks more like new leveraged shorts entering than longs being forced to close. The closing price has already fallen below the lower bound of the last 20 or so 5m candles, so the short-term structure is weak. The anomaly percentile is 89.3%, ranking #19 across the entire pool. It's worth watching to see whether volume picks up to confirm the direction.
$TAO This dip is worth noting—the price fell 0.57%, which isn't much, but 15m trading volume surged to 2.58x, the aggressive trade delta was -15.2%, and the buy/sell ratio was 0.74, with selling pressure clearly dominant. Meanwhile, 1h OI is still rising slightly. A falling price with rising OI looks more like new leveraged shorts entering than longs being forced to close. The closing price has already fallen below the lower bound of the last 20 or so 5m candles, so the short-term structure is weak. The anomaly percentile is 89.3%, ranking #19 across the entire pool. It's worth watching to see whether volume picks up to confirm the direction.
·
--
$BTW This 15m drop looks interesting—the price fell 1.55%, but OI is rising. 1h contracts are up 0.77%, the OI anomaly percentile hit 81%, and the market-wide anomaly ranking is #19. Falling price + rising OI is a typical pattern of new leveraged shorts entering. Volume expanded 2.26x, the aggressive trade delta was -28%, and the buy/sell ratio was 0.56, showing clear selling pressure. The close also broke below the lower boundary of the range formed by the last nearly 20 5m candles. Notional changes were -216K / -408K USDT, indicating that shorts are being added as positions shrink. With this setup, don't rush to buy the dip in the short term: leveraged shorts are piling up, so a squeeze in the opposite direction could be sharp, but for now the bears are still in control. 24h trading volume is 34.71M, and liquidity is sufficient. Watch whether price can reclaim the lower boundary of the 5m range.
$BTW This 15m drop looks interesting—the price fell 1.55%, but OI is rising. 1h contracts are up 0.77%, the OI anomaly percentile hit 81%, and the market-wide anomaly ranking is #19. Falling price + rising OI is a typical pattern of new leveraged shorts entering. Volume expanded 2.26x, the aggressive trade delta was -28%, and the buy/sell ratio was 0.56, showing clear selling pressure. The close also broke below the lower boundary of the range formed by the last nearly 20 5m candles. Notional changes were -216K / -408K USDT, indicating that shorts are being added as positions shrink. With this setup, don't rush to buy the dip in the short term: leveraged shorts are piling up, so a squeeze in the opposite direction could be sharp, but for now the bears are still in control. 24h trading volume is 34.71M, and liquidity is sufficient. Watch whether price can reclaim the lower boundary of the 5m range.
1
·
--
$ON surged 3.71% over 15m, with volume shooting up to 5.23x and a Z-score of 3.98. Looks pretty strong.
But a closer look reveals something interesting—the price is rising while OI is falling: -0.62% over 15m and -1.81% over 1h. Positions are closing as the price surges, which looks more like shorts being forced to cover than new longs entering. The taker buy/sell ratio is 1.47, and the volume delta is +18.9%—buyers are indeed pushing, but there are no new positions underneath to carry the move forward.
The close just broke above the upper bound of the last 20 5m candles. 24h trading volume is only 7M, so the pool is shallow. Be careful chasing a move with this setup: once the short covering is done, who will step in to buy? The notional change ranks #19 across the entire pool, with an anomaly percentile of 97.6%. There’s plenty of heat, but it’s important to understand what’s driving it.
$ON surged 3.71% over 15m, with volume shooting up to 5.23x and a Z-score of 3.98. Looks pretty strong.
But a closer look reveals something interesting—the price is rising while OI is falling: -0.62% over 15m and -1.81% over 1h. Positions are closing as the price surges, which looks more like shorts being forced to cover than new longs entering. The taker buy/sell ratio is 1.47, and the volume delta is +18.9%—buyers are indeed pushing, but there are no new positions underneath to carry the move forward.
The close just broke above the upper bound of the last 20 5m candles. 24h trading volume is only 7M, so the pool is shallow. Be careful chasing a move with this setup: once the short covering is done, who will step in to buy? The notional change ranks #19 across the entire pool, with an anomaly percentile of 97.6%. There’s plenty of heat, but it’s important to understand what’s driving it.
But a closer look reveals something interesting—the price is rising while OI is falling: -0.62% over 15m and -1.81% over 1h. Positions are closing as the price surges, which looks more like shorts being forced to cover than new longs entering. The taker buy/sell ratio is 1.47, and the volume delta is +18.9%—buyers are indeed pushing, but there are no new positions underneath to carry the move forward.
The close just broke above the upper bound of the last 20 5m candles. 24h trading volume is only 7M, so the pool is shallow. Be careful chasing a move with this setup: once the short covering is done, who will step in to buy? The notional change ranks #19 across the entire pool, with an anomaly percentile of 97.6%. There’s plenty of heat, but it’s important to understand what’s driving it.
6

·
--
🎯 $EVAA long position entered! 10X leverage, average entry price 1.3732, current price 1.4599, unrealized ROE approximately +63%🔥
📊【Live Trading Data】
Direction: LONG perpetual
Entry: 1.3732 (LIMIT order placed at the pullback level; no chasing highs)
Targets: TP1 1.4599 ✅ / TP2 1.5187
Stop-loss: 1.3325 (R:R 2.8:1)
🧠【LLM Strategy Rationale】
#19 Go long on the pullback during the main uptrend, with contracting volume and confluence:
• 1h bullish trend confirmed, RSI=50—not overbought
• 15m pullback is just 1.00% away from EMA20; 5m contracting volume, RVOL=1.00x
• 5m bullish alignment (price>EMA20>EMA60), with aggressive buying returning at 51.3%
• Broader market is choppy with a bullish bias, score 58.3; already rebounded +10.16% from the low—follow the trend, don't fight it
🛡️【Risk Management】
45-minute timeout circuit breaker; auto-close if ROE<+20%; large-profit positions are exempt and may be held. Position size has been anonymized; leverage is not compounded.
For this trade, we waited for the pullback on the left and confirmation on the right—the timing felt just right. Did you catch this move? Share your entry price in the comments👇
#币安合约 #实盘战报 #量化交易 #EVAA
🎯 $EVAA long position entered! 10X leverage, average entry price 1.3732, current price 1.4599, unrealized ROE approximately +63%🔥
📊【Live Trading Data】
Direction: LONG perpetual
Entry: 1.3732 (LIMIT order placed at the pullback level; no chasing highs)
Targets: TP1 1.4599 ✅ / TP2 1.5187
Stop-loss: 1.3325 (R:R 2.8:1)
🧠【LLM Strategy Rationale】
#19 Go long on the pullback during the main uptrend, with contracting volume and confluence:
• 1h bullish trend confirmed, RSI=50—not overbought
• 15m pullback is just 1.00% away from EMA20; 5m contracting volume, RVOL=1.00x
• 5m bullish alignment (price>EMA20>EMA60), with aggressive buying returning at 51.3%
• Broader market is choppy with a bullish bias, score 58.3; already rebounded +10.16% from the low—follow the trend, don't fight it
🛡️【Risk Management】
45-minute timeout circuit breaker; auto-close if ROE<+20%; large-profit positions are exempt and may be held. Position size has been anonymized; leverage is not compounded.
For this trade, we waited for the pullback on the left and confirmation on the right—the timing felt just right. Did you catch this move? Share your entry price in the comments👇
#币安合约 #实盘战报 #量化交易 #EVAA
📊【Live Trading Data】
Direction: LONG perpetual
Entry: 1.3732 (LIMIT order placed at the pullback level; no chasing highs)
Targets: TP1 1.4599 ✅ / TP2 1.5187
Stop-loss: 1.3325 (R:R 2.8:1)
🧠【LLM Strategy Rationale】
#19 Go long on the pullback during the main uptrend, with contracting volume and confluence:
• 1h bullish trend confirmed, RSI=50—not overbought
• 15m pullback is just 1.00% away from EMA20; 5m contracting volume, RVOL=1.00x
• 5m bullish alignment (price>EMA20>EMA60), with aggressive buying returning at 51.3%
• Broader market is choppy with a bullish bias, score 58.3; already rebounded +10.16% from the low—follow the trend, don't fight it
🛡️【Risk Management】
45-minute timeout circuit breaker; auto-close if ROE<+20%; large-profit positions are exempt and may be held. Position size has been anonymized; leverage is not compounded.
For this trade, we waited for the pullback on the left and confirmation on the right—the timing felt just right. Did you catch this move? Share your entry price in the comments👇
#币安合约 #实盘战报 #量化交易 #EVAA
165
·
--
$BTW This 15m selloff came with a surge in volume: 3.69x volume and a volatility Z-score of 2.8, breaking straight below the lower bound of the last 20 5m candles—the short-term structure has clearly deteriorated.
What's interesting is OI: 15m contract OI is up 0.25%, but notional change is -235K, suggesting this isn't traders closing positions and exiting; it looks more like new leveraged shorts coming in. On the 1h timeframe, OI is still down 0.53%, with longs and shorts rotating positions. It ranks #37 in pool-wide anomalies and #19 in notional change—not the most striking, but depth has confirmed it: volume is indeed above normal.
With just 66 million in 24h trading volume, the pool isn't deep. If bears keep applying pressure at these levels, slippage below could get ugly. Don't rush to buy the dip; first watch whether price can quickly reclaim the lower bound of this 20-candle range. If it can't, we're looking at a new round of price discovery.
$BTW This 15m selloff came with a surge in volume: 3.69x volume and a volatility Z-score of 2.8, breaking straight below the lower bound of the last 20 5m candles—the short-term structure has clearly deteriorated.
What's interesting is OI: 15m contract OI is up 0.25%, but notional change is -235K, suggesting this isn't traders closing positions and exiting; it looks more like new leveraged shorts coming in. On the 1h timeframe, OI is still down 0.53%, with longs and shorts rotating positions. It ranks #37 in pool-wide anomalies and #19 in notional change—not the most striking, but depth has confirmed it: volume is indeed above normal.
With just 66 million in 24h trading volume, the pool isn't deep. If bears keep applying pressure at these levels, slippage below could get ugly. Don't rush to buy the dip; first watch whether price can quickly reclaim the lower bound of this 20-candle range. If it can't, we're looking at a new round of price discovery.
What's interesting is OI: 15m contract OI is up 0.25%, but notional change is -235K, suggesting this isn't traders closing positions and exiting; it looks more like new leveraged shorts coming in. On the 1h timeframe, OI is still down 0.53%, with longs and shorts rotating positions. It ranks #37 in pool-wide anomalies and #19 in notional change—not the most striking, but depth has confirmed it: volume is indeed above normal.
With just 66 million in 24h trading volume, the pool isn't deep. If bears keep applying pressure at these levels, slippage below could get ugly. Don't rush to buy the dip; first watch whether price can quickly reclaim the lower bound of this 20-candle range. If it can't, we're looking at a new round of price discovery.
74

·
--
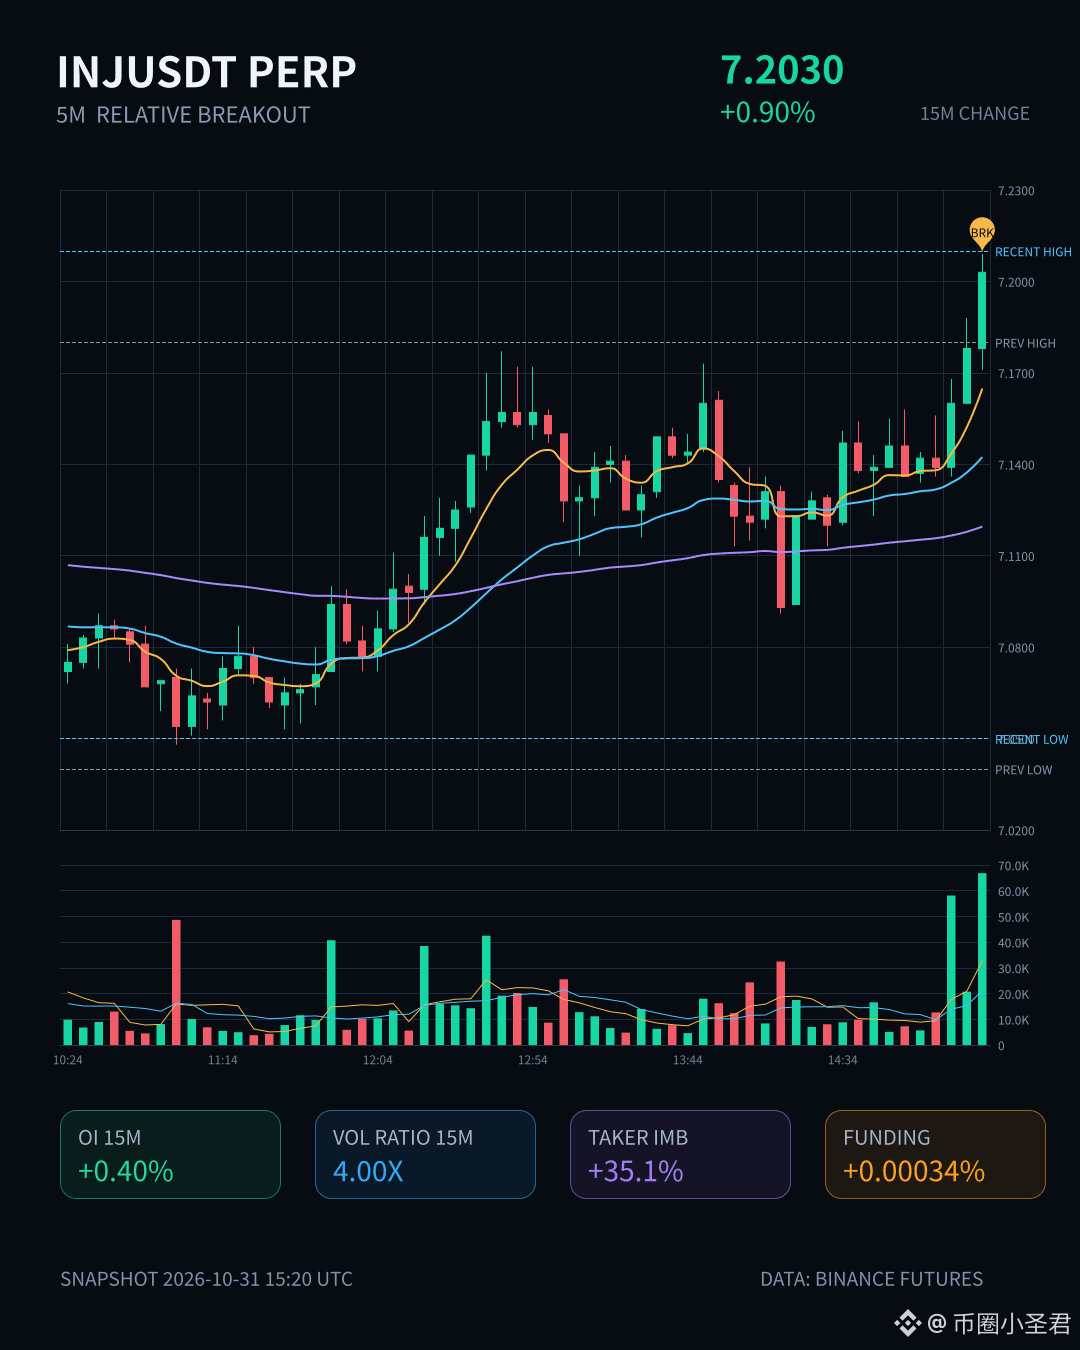
$INJ This move has some substance. It surged 0.90% in 15m, with volume hitting 4x, a Z-score of 2.56, and the close breaking above the upper bound of the recent 20-bar 5m range. The key is that OI rose along with it—+0.40% in 15m and +0.46% in 1h, with notional change also increasing. This is the setup of new leveraged longs entering, not shorts covering. Aggressive trade imbalance was 35.1%, and the buy/sell ratio was 2.08, showing buyers are clearly stepping in. It ranked #19 for anomalies across the full pool and #32 for notional change, at the 83.3rd percentile, with depth confirming the move too. At a 24h trading volume of 52M, this kind of activity is worth keeping an eye on.
$INJ This move has some substance. It surged 0.90% in 15m, with volume hitting 4x, a Z-score of 2.56, and the close breaking above the upper bound of the recent 20-bar 5m range. The key is that OI rose along with it—+0.40% in 15m and +0.46% in 1h, with notional change also increasing. This is the setup of new leveraged longs entering, not shorts covering. Aggressive trade imbalance was 35.1%, and the buy/sell ratio was 2.08, showing buyers are clearly stepping in. It ranked #19 for anomalies across the full pool and #32 for notional change, at the 83.3rd percentile, with depth confirming the move too. At a 24h trading volume of 52M, this kind of activity is worth keeping an eye on.
10
·
--
$UNI This 15m drop of 1.54% doesn't look like much, but volume has surged to 7.76x, with an active trade imbalance of -42.5% and a buy/sell ratio of 0.40—clear signs of aggressive selling. OI is rising too: +1.93% over 15m and +1.67% over 1h. Price down + open interest up looks more like new leveraged shorts entering than longs being forced to close. The anomaly percentile is 86.1%, ranking #19 across the pool and #4 for notional change—this is no small move. 24h trading volume is 280 million, and liquidity is there. With volume and price moving this way, there's no sign of stabilization yet, so keep watching.
$UNI This 15m drop of 1.54% doesn't look like much, but volume has surged to 7.76x, with an active trade imbalance of -42.5% and a buy/sell ratio of 0.40—clear signs of aggressive selling. OI is rising too: +1.93% over 15m and +1.67% over 1h. Price down + open interest up looks more like new leveraged shorts entering than longs being forced to close. The anomaly percentile is 86.1%, ranking #19 across the pool and #4 for notional change—this is no small move. 24h trading volume is 280 million, and liquidity is there. With volume and price moving this way, there's no sign of stabilization yet, so keep watching.
48
Log in to explore more content
Join global crypto users on Binance Square
⚡️ Get latest and useful information about crypto.
💬 Trusted by the world’s largest crypto exchange.
👍 Discover real insights from verified creators.
Email / Phone number
Trending Topics
1
#NvidiaLoses$2.7TrillionInMonthAndAHalf
82 views
12 Discussing
2
#CanBTCReboundAfterFallingBelow60K?
477,933 views
2,087 Discussing
3
#GlobalStocksFaceLongestLosingStreakSince2023
164,781 views
1,462 Discussing
4
#BlackRockIBITPostsRecord$541MSingleDayOutflow
7,371 views
46 Discussing
5
#AnthropicPlungesTowardIPOPriceonDay2
78,782 views
835 Discussing
6
#TwentyOneCapitalAdds172.25BTC
30,258 views
367 Discussing
7
#HKBillWouldExcludeTokenizedDepositsFromVirtualAssets
2,974 views
38 Discussing
8
#BNBDropsBelow540USDTWith8.46%DailyDecline
46,202 views
418 Discussing
9
#HKBillProposesHK$100KFineForUnauthorizedCryptoTitles
1,633 views
20 Discussing
10
#BitMineFaces$10.1BUnrealizedETHLoss
3,404 views
25 Discussing