
#37
37
5,998 views
117 Discussing
Hot
Latest


·
--
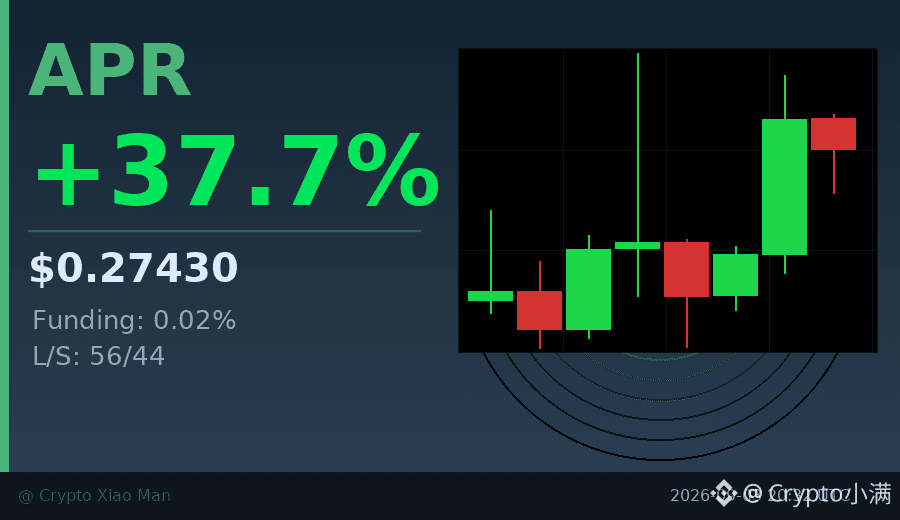
37% single-day surge, the APR chart looks kind of interesting.
The funding rate has spiked to 0.02%, and the longs are clearly accumulating aggressively.
Trading volume is close to 50 million USDT, but the price hasn’t broken the previous high at 0.2985 yet.
The long/short ratio is 56% to 44%—there’s still disagreement, not a one-sided move.
In the past 8 hours, the overall trend has strengthened. The most recent K-line moved from 0.24 to above 0.28.
With this kind of volume-price alignment, it will either keep pushing higher or pull back to shake out positions.
I’m watching the 0.30 level—if it breaks through, I’ll reassess.
$APR #资金费率飙升 #37%
Tap the small card below to quickly view the market👇
37% single-day surge, the APR chart looks kind of interesting.
The funding rate has spiked to 0.02%, and the longs are clearly accumulating aggressively.
Trading volume is close to 50 million USDT, but the price hasn’t broken the previous high at 0.2985 yet.
The long/short ratio is 56% to 44%—there’s still disagreement, not a one-sided move.
In the past 8 hours, the overall trend has strengthened. The most recent K-line moved from 0.24 to above 0.28.
With this kind of volume-price alignment, it will either keep pushing higher or pull back to shake out positions.
I’m watching the 0.30 level—if it breaks through, I’ll reassess.
$APR #资金费率飙升 #37%
Tap the small card below to quickly view the market👇
The funding rate has spiked to 0.02%, and the longs are clearly accumulating aggressively.
Trading volume is close to 50 million USDT, but the price hasn’t broken the previous high at 0.2985 yet.
The long/short ratio is 56% to 44%—there’s still disagreement, not a one-sided move.
In the past 8 hours, the overall trend has strengthened. The most recent K-line moved from 0.24 to above 0.28.
With this kind of volume-price alignment, it will either keep pushing higher or pull back to shake out positions.
I’m watching the 0.30 level—if it breaks through, I’ll reassess.
$APR #资金费率飙升 #37%
Tap the small card below to quickly view the market👇
50

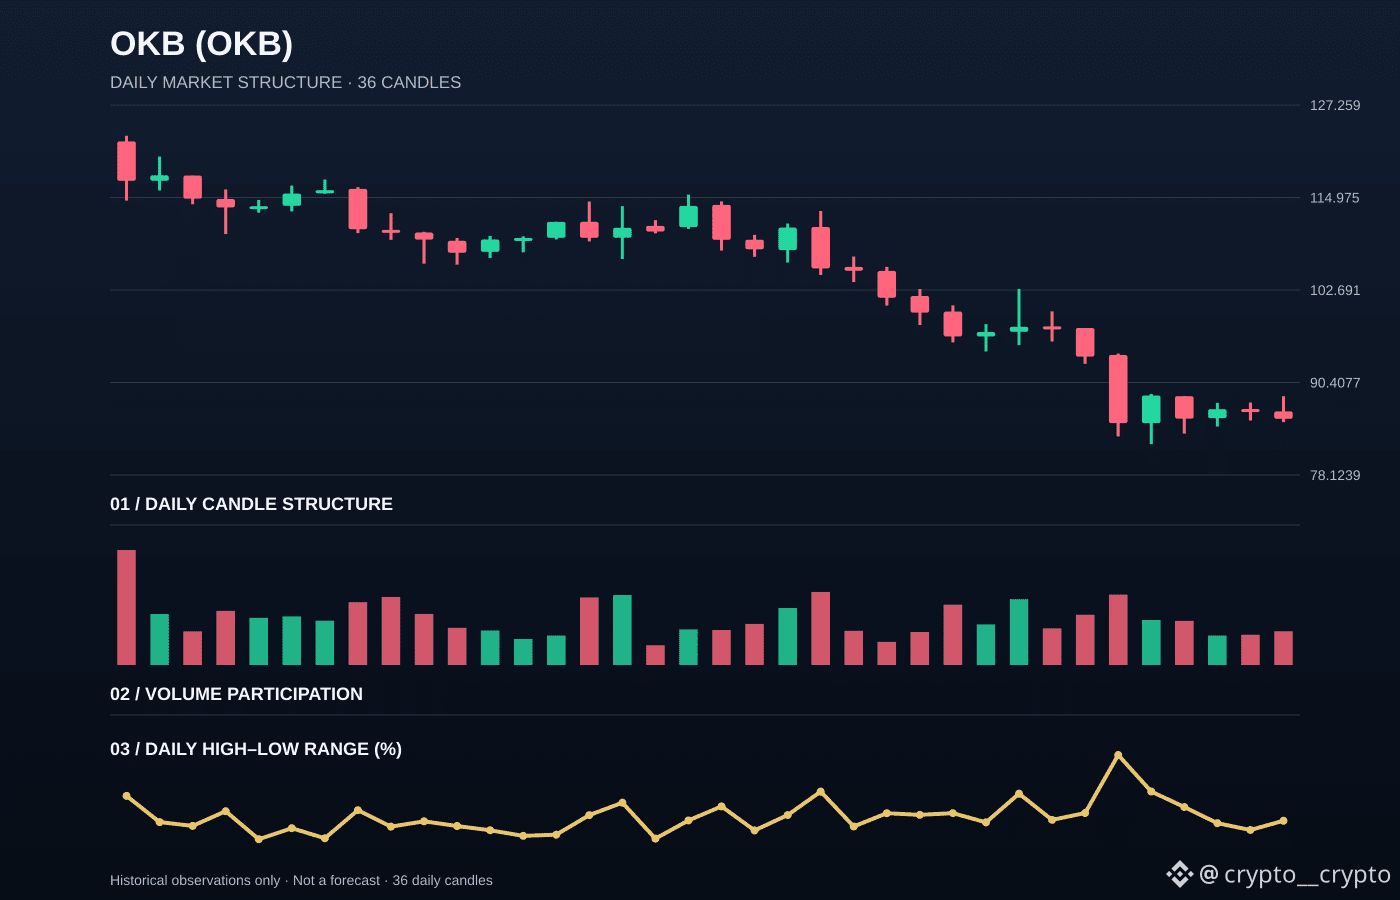
OKB (OKB) declined 1.45% between the last two available daily closes. The detail I am watching is how that move finished, not just the headline percentage.
The daily close sat in the lower part of its range, showing sellers retained more of the session move. A recovery close would suggest supply is easing; another weak close would keep downside pressure in focus.
I would compare the next session's volume with this candle before calling the move a trend. One session alone is not confirmation. The latest candle covered 4.06% from low to high, with OHLC: 86.563611 / 88.598118 / 85.141611 / 85.590167.
For context, the 24-hour market move is -4.32%, while reported turnover is approximately 22.42M USD. CoinMarketCap rank: #37. Benchmark snapshot: BTC -3.04% · ETH -2.88%.
Would you wait for a daily close or use volume confirmation before judging OKB's next move?
Data note: CMC listings market quote and CoinLore daily candles. These are observed market figures, not a price prediction or a trade instruction.
$OKB $BTC $ETH
OKB (OKB) declined 1.45% between the last two available daily closes. The detail I am watching is how that move finished, not just the headline percentage.
The daily close sat in the lower part of its range, showing sellers retained more of the session move. A recovery close would suggest supply is easing; another weak close would keep downside pressure in focus.
I would compare the next session's volume with this candle before calling the move a trend. One session alone is not confirmation. The latest candle covered 4.06% from low to high, with OHLC: 86.563611 / 88.598118 / 85.141611 / 85.590167.
For context, the 24-hour market move is -4.32%, while reported turnover is approximately 22.42M USD. CoinMarketCap rank: #37. Benchmark snapshot: BTC -3.04% · ETH -2.88%.
Would you wait for a daily close or use volume confirmation before judging OKB's next move?
Data note: CMC listings market quote and CoinLore daily candles. These are observed market figures, not a price prediction or a trade instruction.
$OKB $BTC $ETH
The daily close sat in the lower part of its range, showing sellers retained more of the session move. A recovery close would suggest supply is easing; another weak close would keep downside pressure in focus.
I would compare the next session's volume with this candle before calling the move a trend. One session alone is not confirmation. The latest candle covered 4.06% from low to high, with OHLC: 86.563611 / 88.598118 / 85.141611 / 85.590167.
For context, the 24-hour market move is -4.32%, while reported turnover is approximately 22.42M USD. CoinMarketCap rank: #37. Benchmark snapshot: BTC -3.04% · ETH -2.88%.
Would you wait for a daily close or use volume confirmation before judging OKB's next move?
Data note: CMC listings market quote and CoinLore daily candles. These are observed market figures, not a price prediction or a trade instruction.
$OKB $BTC $ETH
1
12
NEXORA // THE STRUCTURE CHECK
━━━━━━━━━━━━━━━━━━━━
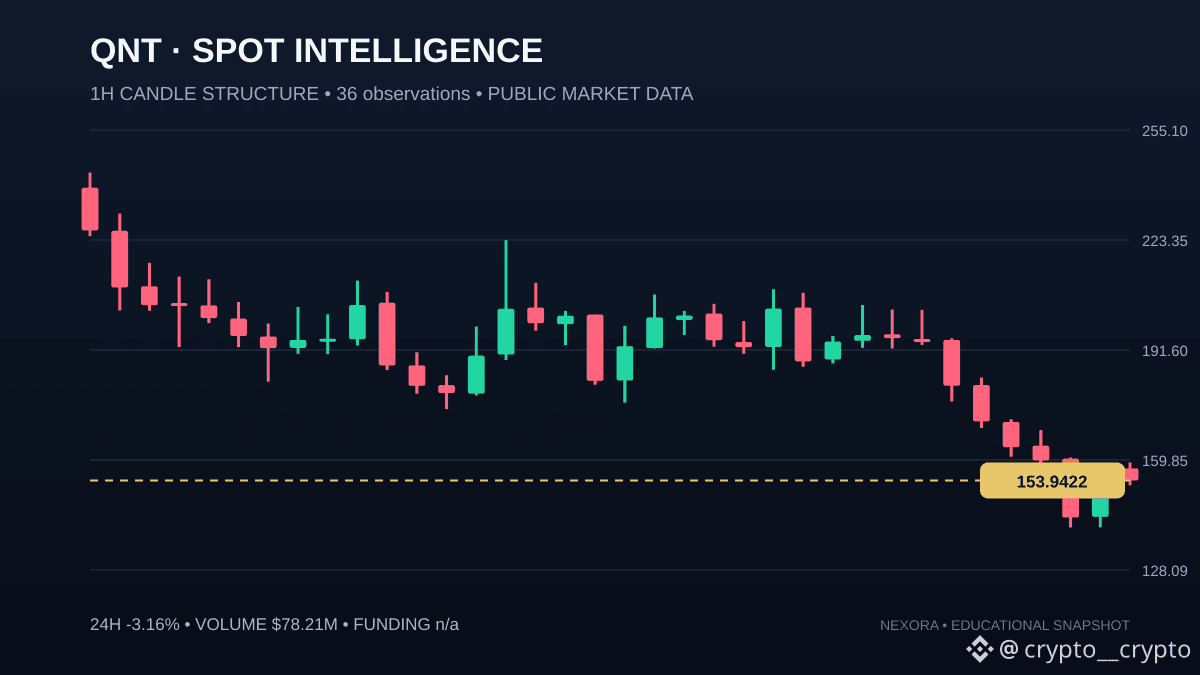
Quant / QNT • SPOT MARKET
PRICE $151.60091
24H MOVE -3.16%
24H VOLUME $78.21M
MARKET CAP $1.83B
MARKET RANK #37
LATEST DAILY RANGE 4.30%
A single percentage change is not a complete market read. Compare the latest daily candle with the broader sequence.
CHART READ: The latest daily close is below the first candle's open across the displayed sample. This is historical context, not a forecast.
DATA: CoinMarketCap market snapshot + CoinLore daily OHLCV. Captured 18 Nov 2026, 00:44 IST.
Research snapshot only — not a trade signal or financial advice.
#NEXORA #CryptoMarket #QNT
NEXORA // THE STRUCTURE CHECK
━━━━━━━━━━━━━━━━━━━━
Quant / QNT • SPOT MARKET
PRICE $151.60091
24H MOVE -3.16%
24H VOLUME $78.21M
MARKET CAP $1.83B
MARKET RANK #37
LATEST DAILY RANGE 4.30%
A single percentage change is not a complete market read. Compare the latest daily candle with the broader sequence.
CHART READ: The latest daily close is below the first candle's open across the displayed sample. This is historical context, not a forecast.
DATA: CoinMarketCap market snapshot + CoinLore daily OHLCV. Captured 18 Nov 2026, 00:44 IST.
Research snapshot only — not a trade signal or financial advice.
#NEXORA #CryptoMarket #QNT
━━━━━━━━━━━━━━━━━━━━
Quant / QNT • SPOT MARKET
PRICE $151.60091
24H MOVE -3.16%
24H VOLUME $78.21M
MARKET CAP $1.83B
MARKET RANK #37
LATEST DAILY RANGE 4.30%
A single percentage change is not a complete market read. Compare the latest daily candle with the broader sequence.
CHART READ: The latest daily close is below the first candle's open across the displayed sample. This is historical context, not a forecast.
DATA: CoinMarketCap market snapshot + CoinLore daily OHLCV. Captured 18 Nov 2026, 00:44 IST.
Research snapshot only — not a trade signal or financial advice.
#NEXORA #CryptoMarket #QNT
12
NEXORA // THE MOMENTUM RADAR
━━━━━━━━━━━━━━━━━━━━
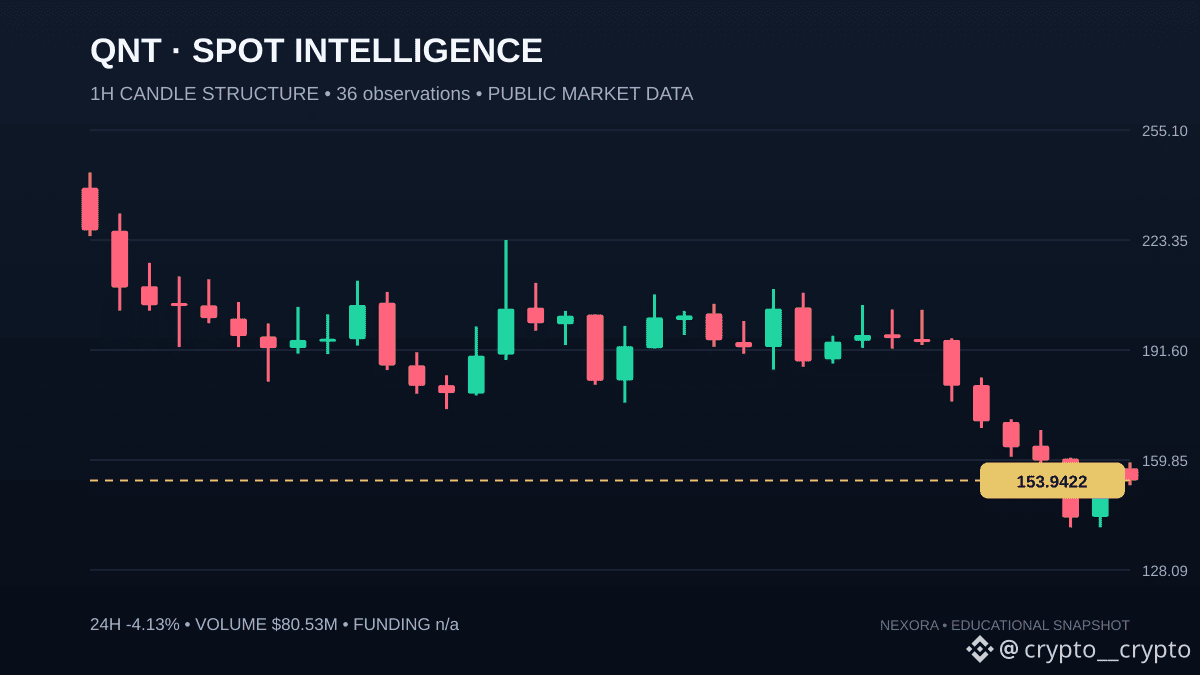
Quant / QNT • SPOT MARKET
PRICE $151.98008
24H MOVE -4.13%
24H VOLUME $80.53M
MARKET CAP $1.83B
MARKET RANK #37
LATEST DAILY RANGE 4.30%
The daily move merits attention. The next question is whether daily closes and trading participation confirm the move.
CHART READ: The latest daily close is below the first candle's open across the displayed sample. This is historical context, not a forecast.
DATA: CoinMarketCap market snapshot + CoinLore daily OHLCV. Captured 17 Nov 2026, 23:14 IST.
Research snapshot only — not a trade signal or financial advice.
#NEXORA #CryptoMarket #QNT
NEXORA // THE MOMENTUM RADAR
━━━━━━━━━━━━━━━━━━━━
Quant / QNT • SPOT MARKET
PRICE $151.98008
24H MOVE -4.13%
24H VOLUME $80.53M
MARKET CAP $1.83B
MARKET RANK #37
LATEST DAILY RANGE 4.30%
The daily move merits attention. The next question is whether daily closes and trading participation confirm the move.
CHART READ: The latest daily close is below the first candle's open across the displayed sample. This is historical context, not a forecast.
DATA: CoinMarketCap market snapshot + CoinLore daily OHLCV. Captured 17 Nov 2026, 23:14 IST.
Research snapshot only — not a trade signal or financial advice.
#NEXORA #CryptoMarket #QNT
━━━━━━━━━━━━━━━━━━━━
Quant / QNT • SPOT MARKET
PRICE $151.98008
24H MOVE -4.13%
24H VOLUME $80.53M
MARKET CAP $1.83B
MARKET RANK #37
LATEST DAILY RANGE 4.30%
The daily move merits attention. The next question is whether daily closes and trading participation confirm the move.
CHART READ: The latest daily close is below the first candle's open across the displayed sample. This is historical context, not a forecast.
DATA: CoinMarketCap market snapshot + CoinLore daily OHLCV. Captured 17 Nov 2026, 23:14 IST.
Research snapshot only — not a trade signal or financial advice.
#NEXORA #CryptoMarket #QNT
28

·
--
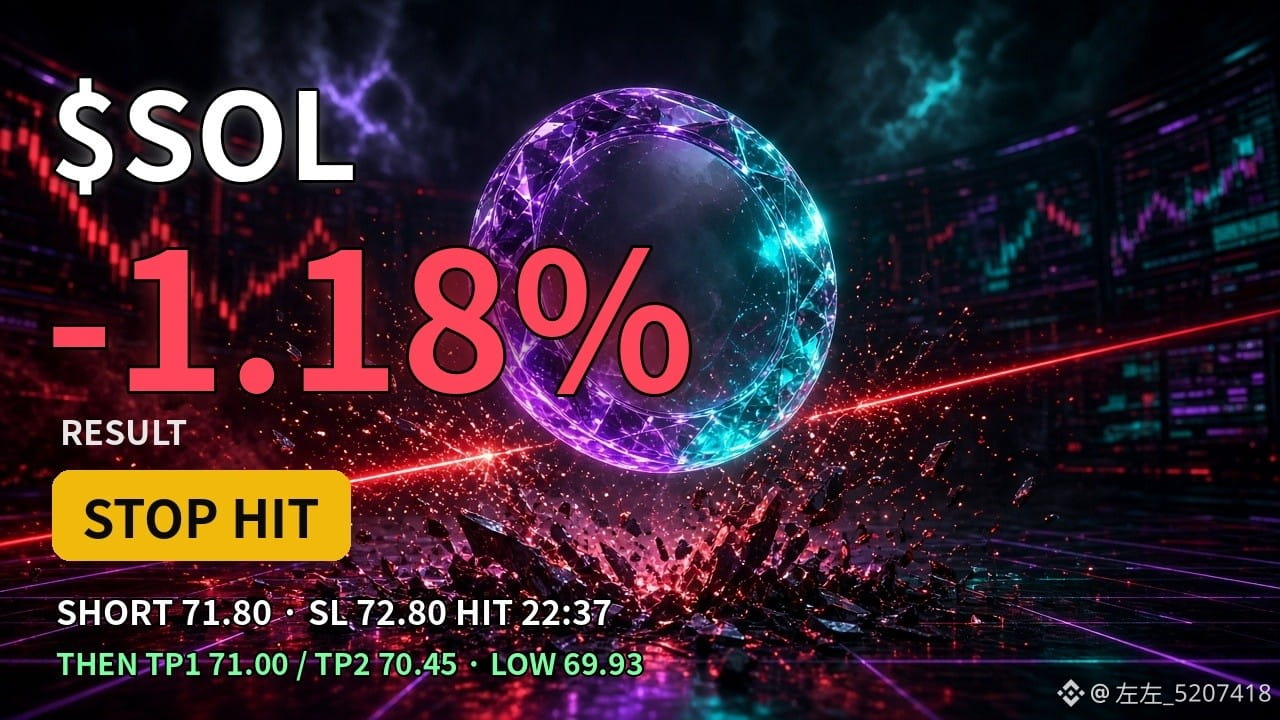
【Zuo Zuo's Take · Trade Review】😣 The stop-loss was hit first, then the price fell to the target—how should this trade be counted?
#37 SOL short: entry 71.80–72.10, stop-loss 72.80, TP1 71.00, TP2 70.45.
Last night, the price rebounded into the entry at 22:32 (71.80). At 22:37, a sharp spike hit 72.92, triggering the 72.80 stop-loss first.
Result: -1.18% (based on the median entry of 71.95, without leverage), record: 13 wins, 21 losses.
The most painful part: at 23:04, the price fell to 71.00; at 23:10, it fell to 70.45. The low was 69.93, so both targets were reached—but since the stop-loss came first, this trade can only be recorded as a loss.
Zuo Zuo's takeaway: The stop-loss was too close to the previous high of 72.75 and got taken out by a spike. For the next trade, I'll place the stop-loss beyond the key structure and leave more room.
SOL is now at 71.6 (24H -1.3%). Would you widen the stop-loss or reduce your position size?
#SOL #左左观点单 #币安广场
$SOL
{future}(SOLUSDT)
【Zuo Zuo's Take · Trade Review】😣 The stop-loss was hit first, then the price fell to the target—how should this trade be counted?
#37 SOL short: entry 71.80–72.10, stop-loss 72.80, TP1 71.00, TP2 70.45.
Last night, the price rebounded into the entry at 22:32 (71.80). At 22:37, a sharp spike hit 72.92, triggering the 72.80 stop-loss first.
Result: -1.18% (based on the median entry of 71.95, without leverage), record: 13 wins, 21 losses.
The most painful part: at 23:04, the price fell to 71.00; at 23:10, it fell to 70.45. The low was 69.93, so both targets were reached—but since the stop-loss came first, this trade can only be recorded as a loss.
Zuo Zuo's takeaway: The stop-loss was too close to the previous high of 72.75 and got taken out by a spike. For the next trade, I'll place the stop-loss beyond the key structure and leave more room.
SOL is now at 71.6 (24H -1.3%). Would you widen the stop-loss or reduce your position size?
#SOL #左左观点单 #币安广场
$SOL
#37 SOL short: entry 71.80–72.10, stop-loss 72.80, TP1 71.00, TP2 70.45.
Last night, the price rebounded into the entry at 22:32 (71.80). At 22:37, a sharp spike hit 72.92, triggering the 72.80 stop-loss first.
Result: -1.18% (based on the median entry of 71.95, without leverage), record: 13 wins, 21 losses.
The most painful part: at 23:04, the price fell to 71.00; at 23:10, it fell to 70.45. The low was 69.93, so both targets were reached—but since the stop-loss came first, this trade can only be recorded as a loss.
Zuo Zuo's takeaway: The stop-loss was too close to the previous high of 72.75 and got taken out by a spike. For the next trade, I'll place the stop-loss beyond the key structure and leave more room.
SOL is now at 71.6 (24H -1.3%). Would you widen the stop-loss or reduce your position size?
#SOL #左左观点单 #币安广场
$SOL
1
37

CRO spot check 📉
Cronos $CRO is at $0.0476, down ~1.2% in 24h. It's sitting just above its all-time low of $0.0454 from August — that level is the line in the sand now.
Levels: support $0.0472, then the ATL $0.0454. Resistance $0.0507, then $0.052. RSI 35 — weak, nearing oversold.
30-day: -19.4%. YTD: -47.6%. Still ~95% below its $0.955 ATH from 2021. Market cap ~$2.42B, rank #37.
BTC is the boss here: $71,456, down 4.3% today after breaking below $72K. Spot BTC ETFs saw a 5th straight day of outflows (-$299.8M). October PPI lands today at 8:30 AM ET — that could move everything.
Verdict: CRO is cheap for a reason right now. A hold above $0.0454 keeps the structure alive; losing it opens the door lower. Watch BTC first.
Not financial advice. DYOR.
#Cronos #Crypto #Altcoins
CRO spot check 📉
Cronos $CRO is at $0.0476, down ~1.2% in 24h. It's sitting just above its all-time low of $0.0454 from August — that level is the line in the sand now.
Levels: support $0.0472, then the ATL $0.0454. Resistance $0.0507, then $0.052. RSI 35 — weak, nearing oversold.
30-day: -19.4%. YTD: -47.6%. Still ~95% below its $0.955 ATH from 2021. Market cap ~$2.42B, rank #37.
BTC is the boss here: $71,456, down 4.3% today after breaking below $72K. Spot BTC ETFs saw a 5th straight day of outflows (-$299.8M). October PPI lands today at 8:30 AM ET — that could move everything.
Verdict: CRO is cheap for a reason right now. A hold above $0.0454 keeps the structure alive; losing it opens the door lower. Watch BTC first.
Not financial advice. DYOR.
#Cronos #Crypto #Altcoins
Cronos $CRO is at $0.0476, down ~1.2% in 24h. It's sitting just above its all-time low of $0.0454 from August — that level is the line in the sand now.
Levels: support $0.0472, then the ATL $0.0454. Resistance $0.0507, then $0.052. RSI 35 — weak, nearing oversold.
30-day: -19.4%. YTD: -47.6%. Still ~95% below its $0.955 ATH from 2021. Market cap ~$2.42B, rank #37.
BTC is the boss here: $71,456, down 4.3% today after breaking below $72K. Spot BTC ETFs saw a 5th straight day of outflows (-$299.8M). October PPI lands today at 8:30 AM ET — that could move everything.
Verdict: CRO is cheap for a reason right now. A hold above $0.0454 keeps the structure alive; losing it opens the door lower. Watch BTC first.
Not financial advice. DYOR.
#Cronos #Crypto #Altcoins
40

·
--
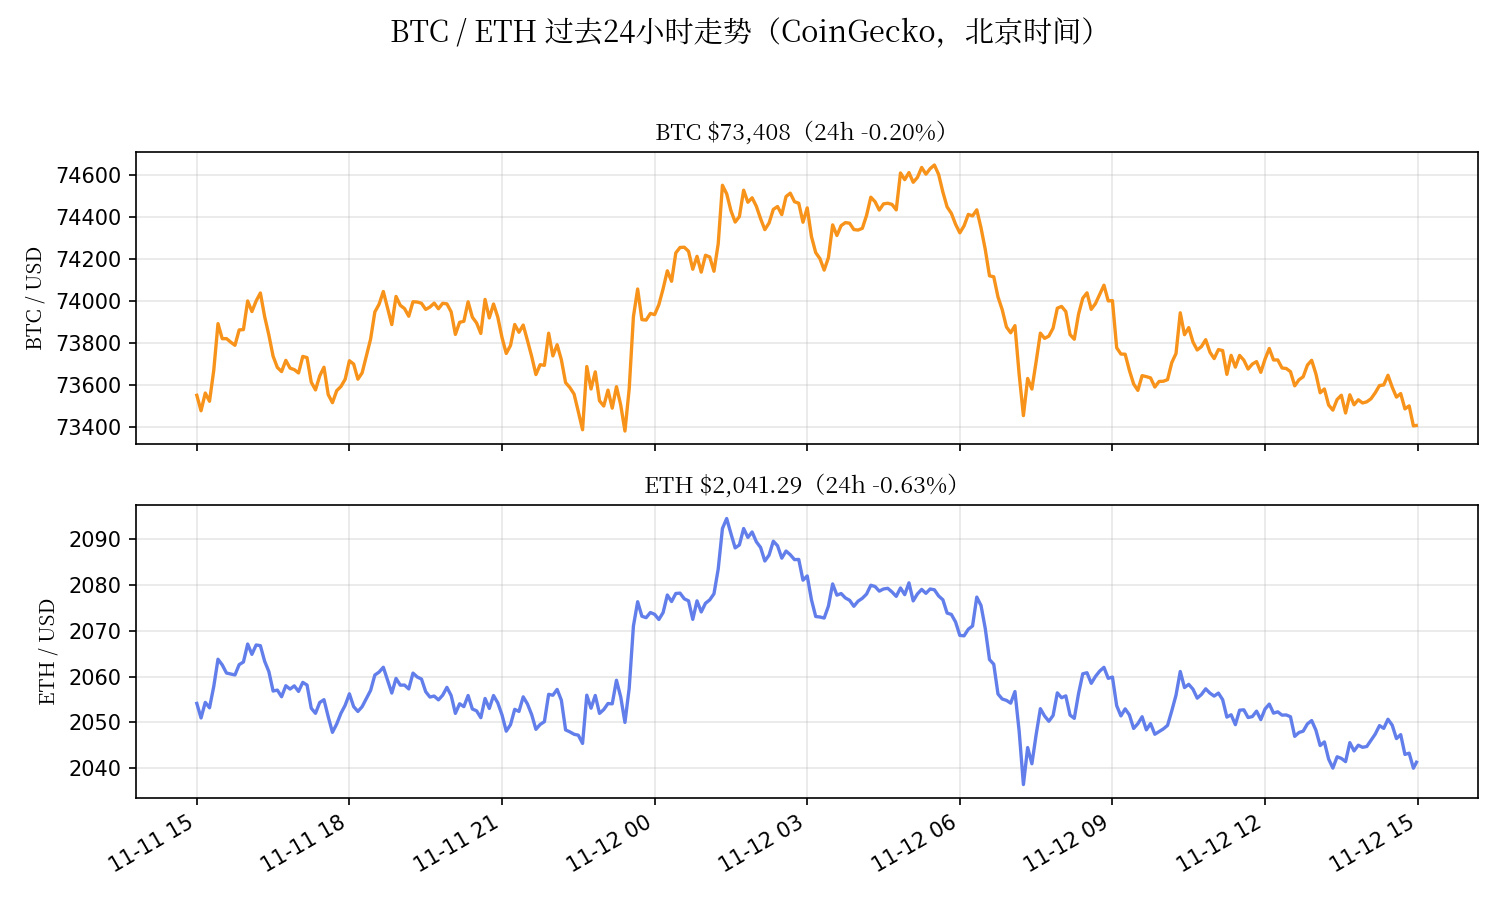
15:00 market update: $BTC is back grinding around the 200-day moving average, while $ETH is less than $40 away from 2,000.
At 15:00, $BTC was around $73,357, down 0.26% over 24 hours; $ETH was around $2,038, down 0.76% over 24 hours (live prices from CoinGecko). Over the past 24 hours, BTC fluctuated between $73,387 and $74,612, and the latest hourly candle just hit a new intraday low. The 200-day moving average is around $73,117–$73,206 (depending on the source), leaving the current price just $150–$240 above it. Price closed above this level on both November 11 and 12, and today marks the third test. $ETH is even closer to the edge: its current price is essentially the 24-hour low. $2,030–$2,035 is the first support level, and the psychologically important $2,000 mark is just $39 below. If $2,005 breaks, the next level to watch is $1,900 (e27/TradingKey figures). The daily price has closed outside the lower Bollinger Band for two consecutive days, and the daily RSI is around 35, still in weak territory.
Short position tracking #37: Opened short on November 7 at 13:00 in the $75,800–$76,100 range, with a $75,950 average entry. At the current price of $73,357, the price is down 3.41%, giving an unrealized profit of around +341% on 100x margin—up from +299% at 13:00. The added short (average entry: $74,850) is up around +199% (+156% at 13:00). Honestly, the unrealized profit is growing, but we haven't reached the target yet, so there's no need to celebrate. The $77,500 stop-loss and the invalidation level of a 4-hour close above $76,250 have not been hit. Holding the position, with a target of $68,000.
The plan is unchanged: remain bearish. The 12:00 4-hour candle closed below $75,000, marking the 20th consecutive candle to do so. 2,380 BTC options expire at 16:00 (maximum pain: $74,500); avoid trading for an hour before and after expiry. If BTC closes below the 200-day moving average on the 4-hour chart and fails to reclaim it, the next stop is $71,500–$72,500. A break below $2,000 for $ETH could accelerate the decline, with $1,900 as the next downside target. A rebound to $75,300–$75,500 is still an area to add shorts, not a level to admit the trade is wrong. Only consider switching bullish if price reclaims $78,000 and holds above it. Tomorrow at 21:30, the US October PPI (September year-over-year: 6.3%; core: 5.0%) and the expiry of 33,902 BTC options (maximum pain: $77,000) will be the last major hurdles of the week. The Fear & Greed Index is 28, in fear territory.
What do you think will happen first tonight: will $ETH touch $2,000, or will $BTC close below the 200-day moving average? Share your thoughts in the comments. (Prices: live CoinGecko data as of November 12, 15:00 Beijing time; chart shows the past 24 hours.)
15:00 market update: $BTC is back grinding around the 200-day moving average, while $ETH is less than $40 away from 2,000.
At 15:00, $BTC was around $73,357, down 0.26% over 24 hours; $ETH was around $2,038, down 0.76% over 24 hours (live prices from CoinGecko). Over the past 24 hours, BTC fluctuated between $73,387 and $74,612, and the latest hourly candle just hit a new intraday low. The 200-day moving average is around $73,117–$73,206 (depending on the source), leaving the current price just $150–$240 above it. Price closed above this level on both November 11 and 12, and today marks the third test. $ETH is even closer to the edge: its current price is essentially the 24-hour low. $2,030–$2,035 is the first support level, and the psychologically important $2,000 mark is just $39 below. If $2,005 breaks, the next level to watch is $1,900 (e27/TradingKey figures). The daily price has closed outside the lower Bollinger Band for two consecutive days, and the daily RSI is around 35, still in weak territory.
Short position tracking #37: Opened short on November 7 at 13:00 in the $75,800–$76,100 range, with a $75,950 average entry. At the current price of $73,357, the price is down 3.41%, giving an unrealized profit of around +341% on 100x margin—up from +299% at 13:00. The added short (average entry: $74,850) is up around +199% (+156% at 13:00). Honestly, the unrealized profit is growing, but we haven't reached the target yet, so there's no need to celebrate. The $77,500 stop-loss and the invalidation level of a 4-hour close above $76,250 have not been hit. Holding the position, with a target of $68,000.
The plan is unchanged: remain bearish. The 12:00 4-hour candle closed below $75,000, marking the 20th consecutive candle to do so. 2,380 BTC options expire at 16:00 (maximum pain: $74,500); avoid trading for an hour before and after expiry. If BTC closes below the 200-day moving average on the 4-hour chart and fails to reclaim it, the next stop is $71,500–$72,500. A break below $2,000 for $ETH could accelerate the decline, with $1,900 as the next downside target. A rebound to $75,300–$75,500 is still an area to add shorts, not a level to admit the trade is wrong. Only consider switching bullish if price reclaims $78,000 and holds above it. Tomorrow at 21:30, the US October PPI (September year-over-year: 6.3%; core: 5.0%) and the expiry of 33,902 BTC options (maximum pain: $77,000) will be the last major hurdles of the week. The Fear & Greed Index is 28, in fear territory.
What do you think will happen first tonight: will $ETH touch $2,000, or will $BTC close below the 200-day moving average? Share your thoughts in the comments. (Prices: live CoinGecko data as of November 12, 15:00 Beijing time; chart shows the past 24 hours.)
At 15:00, $BTC was around $73,357, down 0.26% over 24 hours; $ETH was around $2,038, down 0.76% over 24 hours (live prices from CoinGecko). Over the past 24 hours, BTC fluctuated between $73,387 and $74,612, and the latest hourly candle just hit a new intraday low. The 200-day moving average is around $73,117–$73,206 (depending on the source), leaving the current price just $150–$240 above it. Price closed above this level on both November 11 and 12, and today marks the third test. $ETH is even closer to the edge: its current price is essentially the 24-hour low. $2,030–$2,035 is the first support level, and the psychologically important $2,000 mark is just $39 below. If $2,005 breaks, the next level to watch is $1,900 (e27/TradingKey figures). The daily price has closed outside the lower Bollinger Band for two consecutive days, and the daily RSI is around 35, still in weak territory.
Short position tracking #37: Opened short on November 7 at 13:00 in the $75,800–$76,100 range, with a $75,950 average entry. At the current price of $73,357, the price is down 3.41%, giving an unrealized profit of around +341% on 100x margin—up from +299% at 13:00. The added short (average entry: $74,850) is up around +199% (+156% at 13:00). Honestly, the unrealized profit is growing, but we haven't reached the target yet, so there's no need to celebrate. The $77,500 stop-loss and the invalidation level of a 4-hour close above $76,250 have not been hit. Holding the position, with a target of $68,000.
The plan is unchanged: remain bearish. The 12:00 4-hour candle closed below $75,000, marking the 20th consecutive candle to do so. 2,380 BTC options expire at 16:00 (maximum pain: $74,500); avoid trading for an hour before and after expiry. If BTC closes below the 200-day moving average on the 4-hour chart and fails to reclaim it, the next stop is $71,500–$72,500. A break below $2,000 for $ETH could accelerate the decline, with $1,900 as the next downside target. A rebound to $75,300–$75,500 is still an area to add shorts, not a level to admit the trade is wrong. Only consider switching bullish if price reclaims $78,000 and holds above it. Tomorrow at 21:30, the US October PPI (September year-over-year: 6.3%; core: 5.0%) and the expiry of 33,902 BTC options (maximum pain: $77,000) will be the last major hurdles of the week. The Fear & Greed Index is 28, in fear territory.
What do you think will happen first tonight: will $ETH touch $2,000, or will $BTC close below the 200-day moving average? Share your thoughts in the comments. (Prices: live CoinGecko data as of November 12, 15:00 Beijing time; chart shows the past 24 hours.)
55

A real chart, with no name or date.
Date #37: Will it go up or down in the next 10 trading sessions? It lasts until midnight.
tradinglogica.com/?src=bsq&p=f37-a-cur-auto
A real chart, with no name or date.
Date #37: Will it go up or down in the next 10 trading sessions? It lasts until midnight.
tradinglogica.com/?src=bsq&p=f37-a-cur-auto
Date #37: Will it go up or down in the next 10 trading sessions? It lasts until midnight.
tradinglogica.com/?src=bsq&p=f37-a-cur-auto
6

·
--
$ARIA 15-minute volume surged to 3.32x, and the price rallied 2.17%, closing above the highs of nearly 20 recent 5-minute candles. The aggressive buy/sell ratio was 1.46, showing a clear skew. OI also edged up, with a 1-hour notional change of 255K. Structurally, this looks more like new leveraged longs entering than shorts covering. Liquidity confirmation followed, with whole-pool anomaly #35 and notional change #37. The 24-hour trading volume of 34M isn’t particularly large for the market, but the volume-price alignment in this move is real. First, let’s see whether this breakout can hold above the range high.
$ARIA 15-minute volume surged to 3.32x, and the price rallied 2.17%, closing above the highs of nearly 20 recent 5-minute candles. The aggressive buy/sell ratio was 1.46, showing a clear skew. OI also edged up, with a 1-hour notional change of 255K. Structurally, this looks more like new leveraged longs entering than shorts covering. Liquidity confirmation followed, with whole-pool anomaly #35 and notional change #37. The 24-hour trading volume of 34M isn’t particularly large for the market, but the volume-price alignment in this move is real. First, let’s see whether this breakout can hold above the range high.
·
--
$BMT This 15-minute move dropped nearly 5%, with volume surging to 5.85 times the norm. It also closed below the lower bound of nearly 20 recent 5-minute candles—this wasn’t a gradual drift down; it was a high-volume sell-off.
What’s interesting is the OI: it rose just 0.17% over 15 minutes, but was up 1.12% over 1 hour, while the notional change was still negative. Price down, OI up looks more like new shorts piling in with leverage than a mass liquidation of longs. Taker volume delta was -22.2%, and the buy/sell ratio was 0.64, with sellers in control.
The anomaly percentile was 66.9%, ranking #37 across the entire pool—not the most extreme, but there’s solid confirmation from depth: volume, range boundaries, and taker direction are all aligned. 24-hour trading volume was 169M, so liquidity is sufficient to avoid a wick with no bids to catch it.
With this kind of setup, I generally wouldn’t rush to buy the dip. I’d wait for aggressive selling to dry up and OI to stop building. Chasing shorts now is awkward too, since price has already fallen quite a bit. I’ll keep watching for now.
$BMT This 15-minute move dropped nearly 5%, with volume surging to 5.85 times the norm. It also closed below the lower bound of nearly 20 recent 5-minute candles—this wasn’t a gradual drift down; it was a high-volume sell-off.
What’s interesting is the OI: it rose just 0.17% over 15 minutes, but was up 1.12% over 1 hour, while the notional change was still negative. Price down, OI up looks more like new shorts piling in with leverage than a mass liquidation of longs. Taker volume delta was -22.2%, and the buy/sell ratio was 0.64, with sellers in control.
The anomaly percentile was 66.9%, ranking #37 across the entire pool—not the most extreme, but there’s solid confirmation from depth: volume, range boundaries, and taker direction are all aligned. 24-hour trading volume was 169M, so liquidity is sufficient to avoid a wick with no bids to catch it.
With this kind of setup, I generally wouldn’t rush to buy the dip. I’d wait for aggressive selling to dry up and OI to stop building. Chasing shorts now is awkward too, since price has already fallen quite a bit. I’ll keep watching for now.
What’s interesting is the OI: it rose just 0.17% over 15 minutes, but was up 1.12% over 1 hour, while the notional change was still negative. Price down, OI up looks more like new shorts piling in with leverage than a mass liquidation of longs. Taker volume delta was -22.2%, and the buy/sell ratio was 0.64, with sellers in control.
The anomaly percentile was 66.9%, ranking #37 across the entire pool—not the most extreme, but there’s solid confirmation from depth: volume, range boundaries, and taker direction are all aligned. 24-hour trading volume was 169M, so liquidity is sufficient to avoid a wick with no bids to catch it.
With this kind of setup, I generally wouldn’t rush to buy the dip. I’d wait for aggressive selling to dry up and OI to stop building. Chasing shorts now is awkward too, since price has already fallen quite a bit. I’ll keep watching for now.
31

·
--
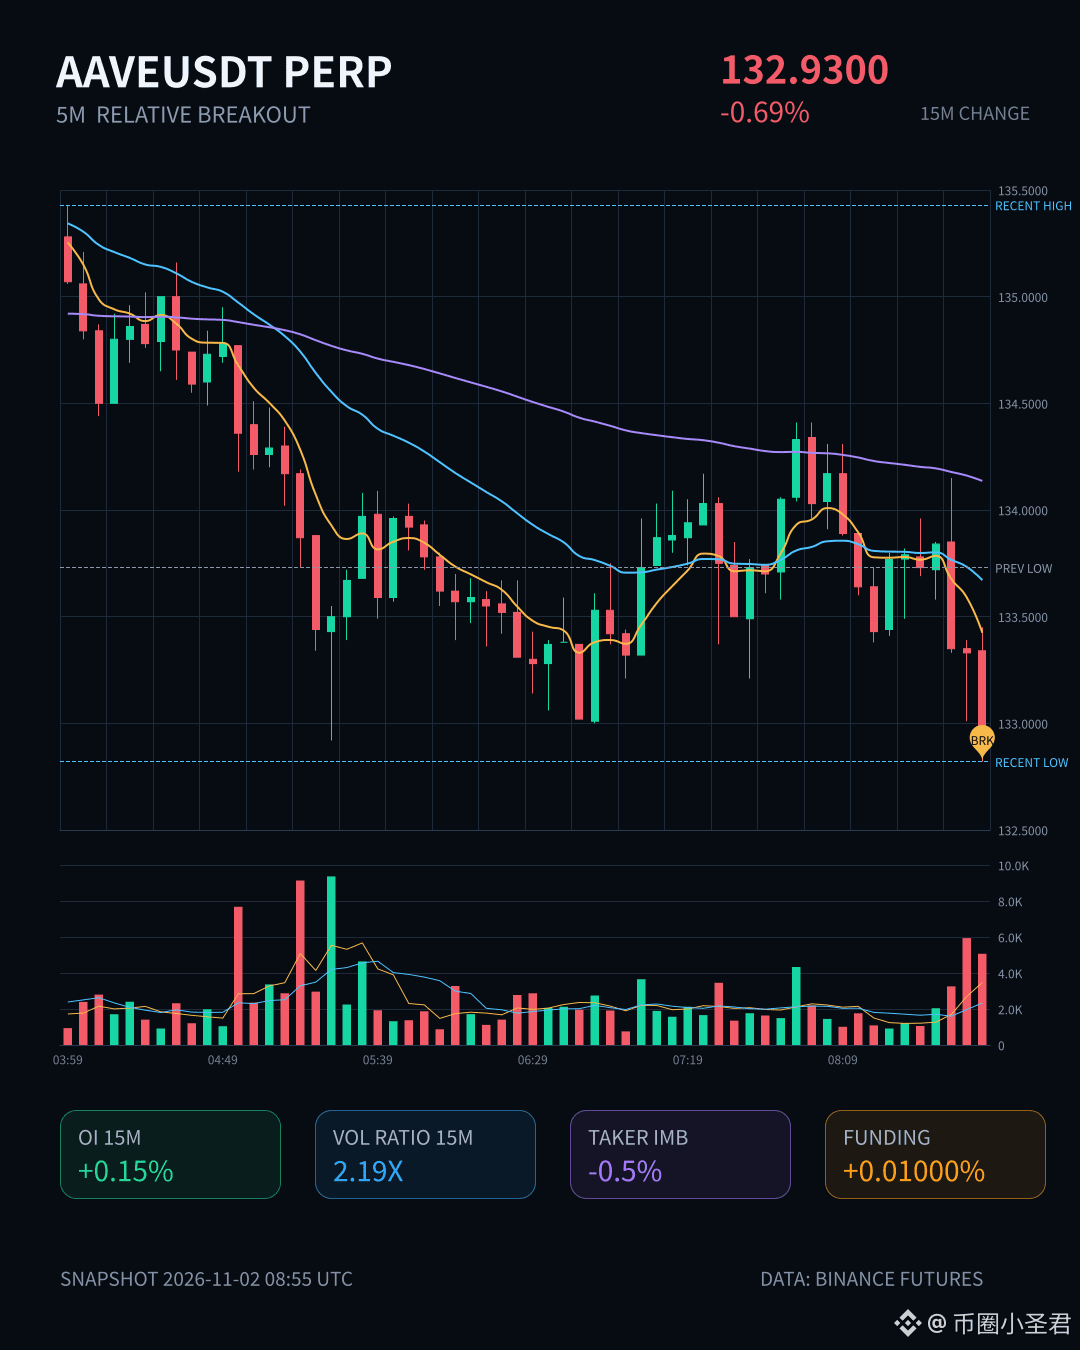
$AAVE 's 15m volume-backed drop is pretty interesting. Volume hit 2.19 times normal, and the price closed below the lower end of the last 20 5m candles. The active trade delta was -0.5%, and the buy/sell ratio was 0.99—this looks bearish, but the selling pressure actually isn't that intense.
What really caught my eye was OI: 1h futures were down 0.35%, with notional down 525K, while 15m OI actually edged up 0.15%. The price is falling, but OI hasn't seen a large-scale pullback, so structurally this looks more like new shorts entering than longs being forced out. The funding rate is also sitting at a recent high, so shorts are paying a steep cost.
My thinking is simple: the active trade delta isn't aggressive enough to match the surge in volume, so this kind of drop could easily be a fakeout. Don't chase shorts yet—see if it can reclaim the lower boundary; if it can't hold above it, then reassess. Notional change ranks #37 across the whole pool. There's definitely activity in $AAVE today, but that doesn't necessarily mean it's headed down.
$AAVE 's 15m volume-backed drop is pretty interesting. Volume hit 2.19 times normal, and the price closed below the lower end of the last 20 5m candles. The active trade delta was -0.5%, and the buy/sell ratio was 0.99—this looks bearish, but the selling pressure actually isn't that intense.
What really caught my eye was OI: 1h futures were down 0.35%, with notional down 525K, while 15m OI actually edged up 0.15%. The price is falling, but OI hasn't seen a large-scale pullback, so structurally this looks more like new shorts entering than longs being forced out. The funding rate is also sitting at a recent high, so shorts are paying a steep cost.
My thinking is simple: the active trade delta isn't aggressive enough to match the surge in volume, so this kind of drop could easily be a fakeout. Don't chase shorts yet—see if it can reclaim the lower boundary; if it can't hold above it, then reassess. Notional change ranks #37 across the whole pool. There's definitely activity in $AAVE today, but that doesn't necessarily mean it's headed down.
What really caught my eye was OI: 1h futures were down 0.35%, with notional down 525K, while 15m OI actually edged up 0.15%. The price is falling, but OI hasn't seen a large-scale pullback, so structurally this looks more like new shorts entering than longs being forced out. The funding rate is also sitting at a recent high, so shorts are paying a steep cost.
My thinking is simple: the active trade delta isn't aggressive enough to match the surge in volume, so this kind of drop could easily be a fakeout. Don't chase shorts yet—see if it can reclaim the lower boundary; if it can't hold above it, then reassess. Notional change ranks #37 across the whole pool. There's definitely activity in $AAVE today, but that doesn't necessarily mean it's headed down.
9

·
--
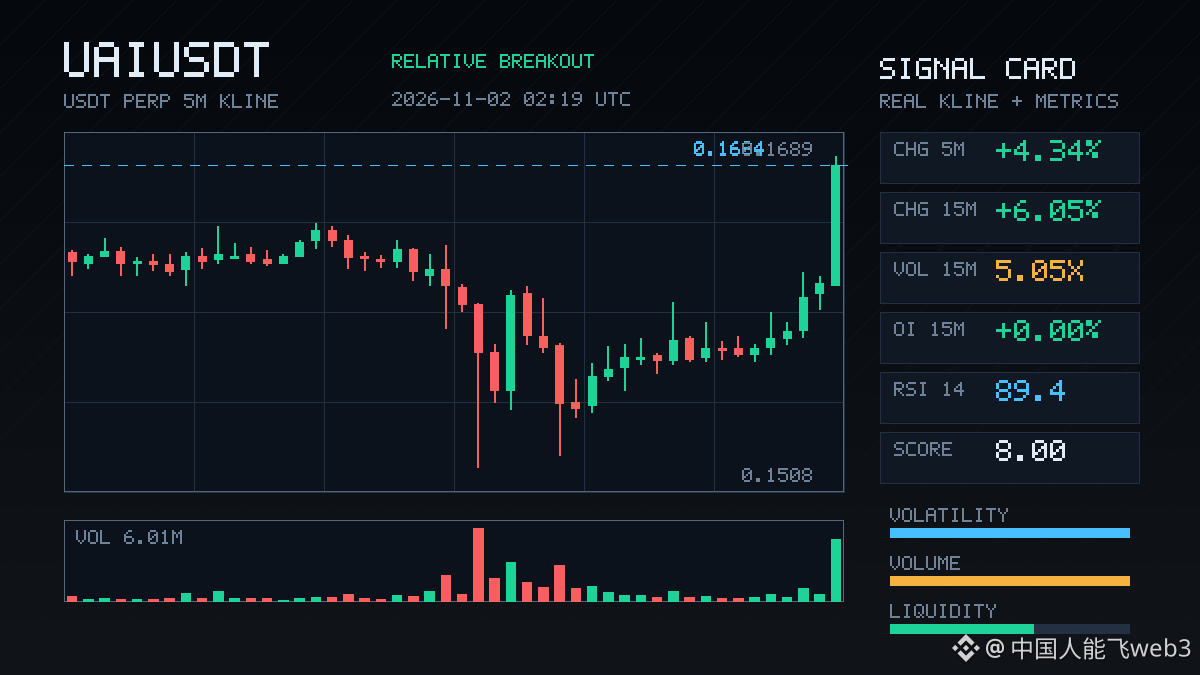
$UAI surged 6 points in 15m, with volume shooting straight up to 5x and a Z-score of 5.35—not just ordinary volatility.
It looks like new leveraged longs are entering: OI gradually climbed 0.78% over 1h, while the price pushed higher alongside an aggressive buy/sell ratio of 1.58 and a volume delta of 22.4%. Buyers are genuinely absorbing supply. The closing price just broke above the high of the last 20 5m candles, which makes this level interesting.
However, the OI anomaly percentile is only 74.8%, ranking #57 across the whole pool, with the notional change at #37. It’s not among the hottest names—more like one of the first in the pool to move. 24h trading volume is 62M, and there’s enough depth; this isn’t a pump in thin air.
A breakout, volume confirmation, and a bullish aggressive flow all make structural sense. But the OI increase isn’t that strong yet. If OI keeps rising and volume doesn’t dry up, then the breakout can be considered firmly established. If the price stalls while OI falls, it’s just a short-term sentiment trade—don’t chase it.
$UAI surged 6 points in 15m, with volume shooting straight up to 5x and a Z-score of 5.35—not just ordinary volatility.
It looks like new leveraged longs are entering: OI gradually climbed 0.78% over 1h, while the price pushed higher alongside an aggressive buy/sell ratio of 1.58 and a volume delta of 22.4%. Buyers are genuinely absorbing supply. The closing price just broke above the high of the last 20 5m candles, which makes this level interesting.
However, the OI anomaly percentile is only 74.8%, ranking #57 across the whole pool, with the notional change at #37. It’s not among the hottest names—more like one of the first in the pool to move. 24h trading volume is 62M, and there’s enough depth; this isn’t a pump in thin air.
A breakout, volume confirmation, and a bullish aggressive flow all make structural sense. But the OI increase isn’t that strong yet. If OI keeps rising and volume doesn’t dry up, then the breakout can be considered firmly established. If the price stalls while OI falls, it’s just a short-term sentiment trade—don’t chase it.
It looks like new leveraged longs are entering: OI gradually climbed 0.78% over 1h, while the price pushed higher alongside an aggressive buy/sell ratio of 1.58 and a volume delta of 22.4%. Buyers are genuinely absorbing supply. The closing price just broke above the high of the last 20 5m candles, which makes this level interesting.
However, the OI anomaly percentile is only 74.8%, ranking #57 across the whole pool, with the notional change at #37. It’s not among the hottest names—more like one of the first in the pool to move. 24h trading volume is 62M, and there’s enough depth; this isn’t a pump in thin air.
A breakout, volume confirmation, and a bullish aggressive flow all make structural sense. But the OI increase isn’t that strong yet. If OI keeps rising and volume doesn’t dry up, then the breakout can be considered firmly established. If the price stalls while OI falls, it’s just a short-term sentiment trade—don’t chase it.
33

·
--
$BTW This 15m selloff came with a surge in volume: 3.69x volume and a volatility Z-score of 2.8, breaking straight below the lower bound of the last 20 5m candles—the short-term structure has clearly deteriorated.
What's interesting is OI: 15m contract OI is up 0.25%, but notional change is -235K, suggesting this isn't traders closing positions and exiting; it looks more like new leveraged shorts coming in. On the 1h timeframe, OI is still down 0.53%, with longs and shorts rotating positions. It ranks #37 in pool-wide anomalies and #19 in notional change—not the most striking, but depth has confirmed it: volume is indeed above normal.
With just 66 million in 24h trading volume, the pool isn't deep. If bears keep applying pressure at these levels, slippage below could get ugly. Don't rush to buy the dip; first watch whether price can quickly reclaim the lower bound of this 20-candle range. If it can't, we're looking at a new round of price discovery.
$BTW This 15m selloff came with a surge in volume: 3.69x volume and a volatility Z-score of 2.8, breaking straight below the lower bound of the last 20 5m candles—the short-term structure has clearly deteriorated.
What's interesting is OI: 15m contract OI is up 0.25%, but notional change is -235K, suggesting this isn't traders closing positions and exiting; it looks more like new leveraged shorts coming in. On the 1h timeframe, OI is still down 0.53%, with longs and shorts rotating positions. It ranks #37 in pool-wide anomalies and #19 in notional change—not the most striking, but depth has confirmed it: volume is indeed above normal.
With just 66 million in 24h trading volume, the pool isn't deep. If bears keep applying pressure at these levels, slippage below could get ugly. Don't rush to buy the dip; first watch whether price can quickly reclaim the lower bound of this 20-candle range. If it can't, we're looking at a new round of price discovery.
What's interesting is OI: 15m contract OI is up 0.25%, but notional change is -235K, suggesting this isn't traders closing positions and exiting; it looks more like new leveraged shorts coming in. On the 1h timeframe, OI is still down 0.53%, with longs and shorts rotating positions. It ranks #37 in pool-wide anomalies and #19 in notional change—not the most striking, but depth has confirmed it: volume is indeed above normal.
With just 66 million in 24h trading volume, the pool isn't deep. If bears keep applying pressure at these levels, slippage below could get ugly. Don't rush to buy the dip; first watch whether price can quickly reclaim the lower bound of this 20-candle range. If it can't, we're looking at a new round of price discovery.
74

·
--
$1M to deploy today. Two doors. ENTRY 6.
Door 1: $TAO at $227.50, -11.7% on the day. The dev-exit coin: Covenant AI walked out of Bittensor last Friday ("centralized control", co-founder policy fights — verified twice), TAO bled from $338, then Intel's earnings flush finished the job tonight. The forming hour just tagged $220.20 — 5.7% under the $233.60 flush-bar low, knocking on the ~$215 September swing low. Unclosed. That's the verdict the 01:00 UTC close decides. Rank #37, $2.64B, 11.7M fully circulating, RSI 24 — deep oversold, not dead.
Door 2: $LINK at $10.42, -11.7% too. Nine days ago I wrote the sleeper case: $12.30 coil, $11.53 was the line. Tonight the line died — the 20:00 UTC bar took it on the day's biggest LINK hourly print, and the forming hour just printed $10.27, under the $10.678 air line. No fresh Chainlink headline anywhere — pure macro wash, ~3.4x weaker than BTC. Rank #17, $7.95B, 77% circulating, -80% off the $52.70 ATH.
Own pick: Door 1. A coin with a named event you can watch resolve (Covenant fallout + the $215 test) beats a chart that's just broken lines all the way down. TAO at least tells you what you're watching for.
Not a call, either way. Both can take half your money overnight.
Which prints first: TAO holding $215, or LINK finding a floor under $10.27?
$1M to deploy today. Two doors. ENTRY 6.
Door 1: $TAO at $227.50, -11.7% on the day. The dev-exit coin: Covenant AI walked out of Bittensor last Friday ("centralized control", co-founder policy fights — verified twice), TAO bled from $338, then Intel's earnings flush finished the job tonight. The forming hour just tagged $220.20 — 5.7% under the $233.60 flush-bar low, knocking on the ~$215 September swing low. Unclosed. That's the verdict the 01:00 UTC close decides. Rank #37, $2.64B, 11.7M fully circulating, RSI 24 — deep oversold, not dead.
Door 2: $LINK at $10.42, -11.7% too. Nine days ago I wrote the sleeper case: $12.30 coil, $11.53 was the line. Tonight the line died — the 20:00 UTC bar took it on the day's biggest LINK hourly print, and the forming hour just printed $10.27, under the $10.678 air line. No fresh Chainlink headline anywhere — pure macro wash, ~3.4x weaker than BTC. Rank #17, $7.95B, 77% circulating, -80% off the $52.70 ATH.
Own pick: Door 1. A coin with a named event you can watch resolve (Covenant fallout + the $215 test) beats a chart that's just broken lines all the way down. TAO at least tells you what you're watching for.
Not a call, either way. Both can take half your money overnight.
Which prints first: TAO holding $215, or LINK finding a floor under $10.27?
Door 1: $TAO at $227.50, -11.7% on the day. The dev-exit coin: Covenant AI walked out of Bittensor last Friday ("centralized control", co-founder policy fights — verified twice), TAO bled from $338, then Intel's earnings flush finished the job tonight. The forming hour just tagged $220.20 — 5.7% under the $233.60 flush-bar low, knocking on the ~$215 September swing low. Unclosed. That's the verdict the 01:00 UTC close decides. Rank #37, $2.64B, 11.7M fully circulating, RSI 24 — deep oversold, not dead.
Door 2: $LINK at $10.42, -11.7% too. Nine days ago I wrote the sleeper case: $12.30 coil, $11.53 was the line. Tonight the line died — the 20:00 UTC bar took it on the day's biggest LINK hourly print, and the forming hour just printed $10.27, under the $10.678 air line. No fresh Chainlink headline anywhere — pure macro wash, ~3.4x weaker than BTC. Rank #17, $7.95B, 77% circulating, -80% off the $52.70 ATH.
Own pick: Door 1. A coin with a named event you can watch resolve (Covenant fallout + the $215 test) beats a chart that's just broken lines all the way down. TAO at least tells you what you're watching for.
Not a call, either way. Both can take half your money overnight.
Which prints first: TAO holding $215, or LINK finding a floor under $10.27?
29
·
--
$TAO just lost -9% in a day — and this one had a reason hiding under the flush.
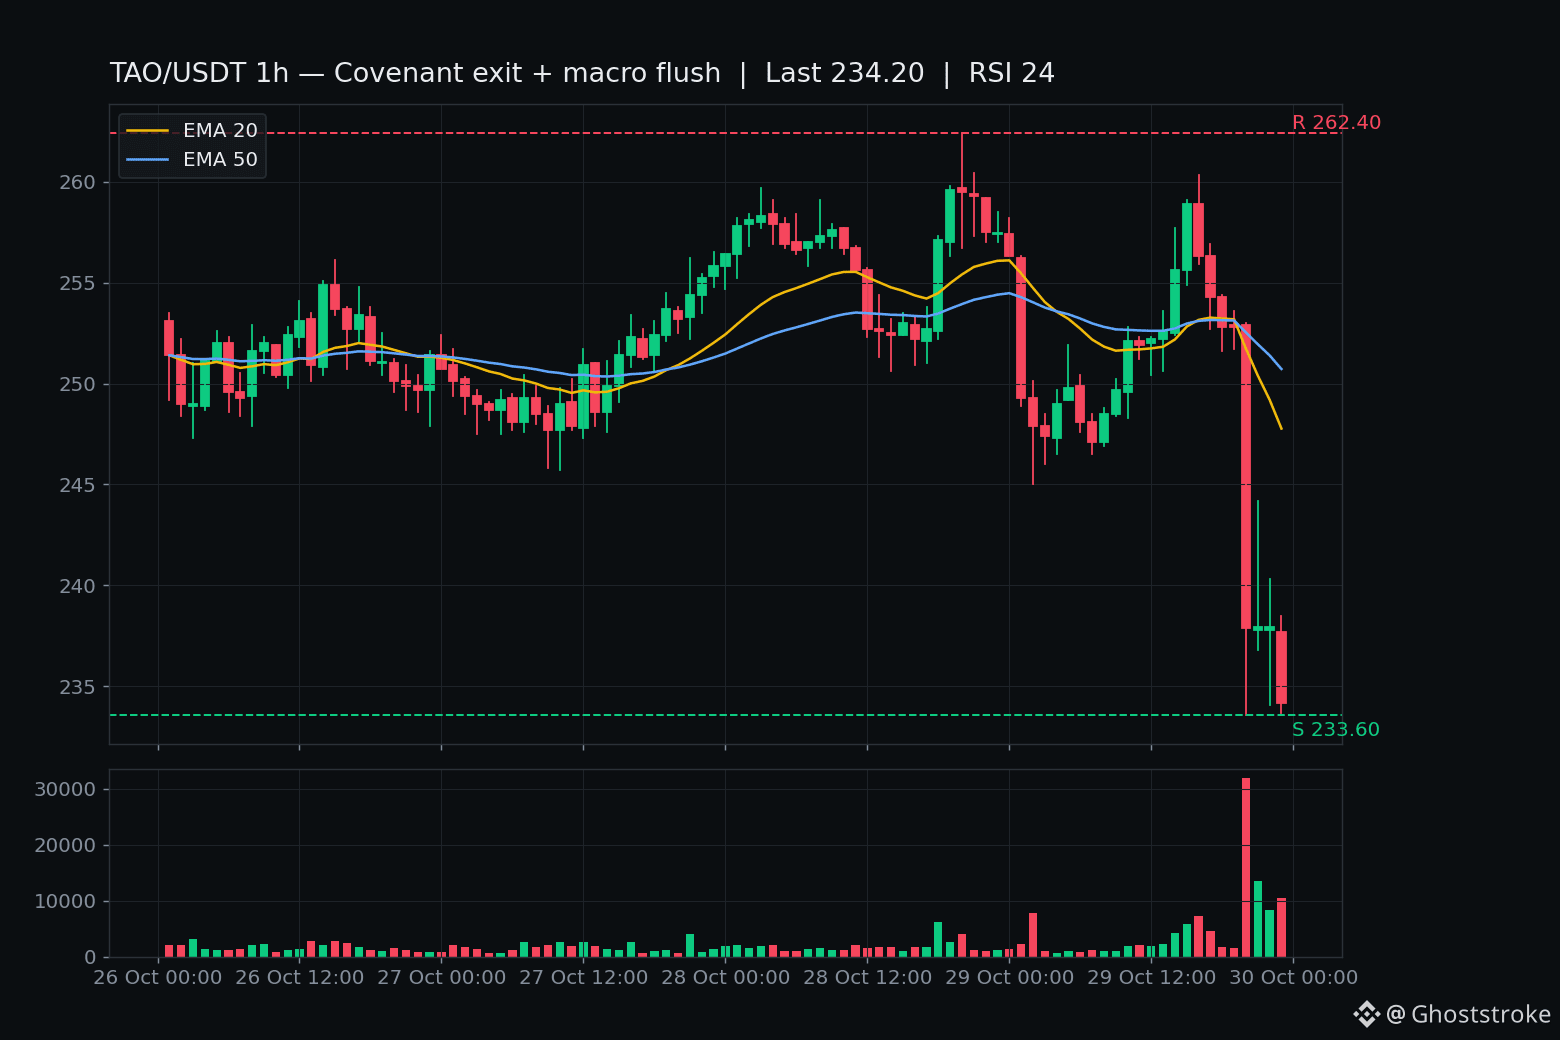
The tape: TAO chopped $246–$260 all day on Oct 29, nothing dramatic. Then the 20:00 UTC hour — the same flush hour that washed NEAR, ARB, WLD, ENA and ONDO tonight — O $252.90, L $233.60, C $237.90 on $7.66M. That's the day's biggest hourly bar by miles, and it took -6.6% out of the price in sixty minutes. The 21:00 dead-cat bounced to $244.20 and got rejected on the spot. 22:00 closed $237.80, 23:00 closed $234.20. Live ~$232.50, UNCLOSED — that's live tape, not a level.
Here's what makes TAO different from tonight's other flushes: the poison was already in the tape. Last Friday, Covenant AI — a prominent subnet developer — announced it's leaving Bittensor, citing "centralized control" and unilateral policy changes by co-founder Jacob Steeves. Founder Sam Dare said it on X himself. TAO fell 10%+ in two hours, $338 to $285, and was already down ~24% from above $300 before tonight. CoinDesk has AI tokens as the hardest-hit sector again: NEAR -7.8%, TAO with it, $337M in liquidations over 24h (+84%), $205M of that longs. Investors have been rotating out of TAO into NEAR, ICP, RENDER and FET all week.
The honest side: this is rank #37, a $2.71B coin — not a dying project. 1h RSI 24 is the oversold edge. Down -69% from the $757.60 ATH, and the real overhang here is the governance fracture, not the chart.
Levels: $244.20 (dead-cat high — hourly close above = flush losing steam); $252.90 (pre-flush zone — reclaim with volume = flush failed); $233.60 (flush-bar low — a closed hour under it and the next shelf is the September swing low near $215).
Not a call, either way. Question for the overnight tape: does the Covenant overhang keep dragging TAO under $233.60, or does the oversold bounce reclaim $244.20 first?
$TAO just lost -9% in a day — and this one had a reason hiding under the flush.
The tape: TAO chopped $246–$260 all day on Oct 29, nothing dramatic. Then the 20:00 UTC hour — the same flush hour that washed NEAR, ARB, WLD, ENA and ONDO tonight — O $252.90, L $233.60, C $237.90 on $7.66M. That's the day's biggest hourly bar by miles, and it took -6.6% out of the price in sixty minutes. The 21:00 dead-cat bounced to $244.20 and got rejected on the spot. 22:00 closed $237.80, 23:00 closed $234.20. Live ~$232.50, UNCLOSED — that's live tape, not a level.
Here's what makes TAO different from tonight's other flushes: the poison was already in the tape. Last Friday, Covenant AI — a prominent subnet developer — announced it's leaving Bittensor, citing "centralized control" and unilateral policy changes by co-founder Jacob Steeves. Founder Sam Dare said it on X himself. TAO fell 10%+ in two hours, $338 to $285, and was already down ~24% from above $300 before tonight. CoinDesk has AI tokens as the hardest-hit sector again: NEAR -7.8%, TAO with it, $337M in liquidations over 24h (+84%), $205M of that longs. Investors have been rotating out of TAO into NEAR, ICP, RENDER and FET all week.
The honest side: this is rank #37, a $2.71B coin — not a dying project. 1h RSI 24 is the oversold edge. Down -69% from the $757.60 ATH, and the real overhang here is the governance fracture, not the chart.
Levels: $244.20 (dead-cat high — hourly close above = flush losing steam); $252.90 (pre-flush zone — reclaim with volume = flush failed); $233.60 (flush-bar low — a closed hour under it and the next shelf is the September swing low near $215).
Not a call, either way. Question for the overnight tape: does the Covenant overhang keep dragging TAO under $233.60, or does the oversold bounce reclaim $244.20 first?
The tape: TAO chopped $246–$260 all day on Oct 29, nothing dramatic. Then the 20:00 UTC hour — the same flush hour that washed NEAR, ARB, WLD, ENA and ONDO tonight — O $252.90, L $233.60, C $237.90 on $7.66M. That's the day's biggest hourly bar by miles, and it took -6.6% out of the price in sixty minutes. The 21:00 dead-cat bounced to $244.20 and got rejected on the spot. 22:00 closed $237.80, 23:00 closed $234.20. Live ~$232.50, UNCLOSED — that's live tape, not a level.
Here's what makes TAO different from tonight's other flushes: the poison was already in the tape. Last Friday, Covenant AI — a prominent subnet developer — announced it's leaving Bittensor, citing "centralized control" and unilateral policy changes by co-founder Jacob Steeves. Founder Sam Dare said it on X himself. TAO fell 10%+ in two hours, $338 to $285, and was already down ~24% from above $300 before tonight. CoinDesk has AI tokens as the hardest-hit sector again: NEAR -7.8%, TAO with it, $337M in liquidations over 24h (+84%), $205M of that longs. Investors have been rotating out of TAO into NEAR, ICP, RENDER and FET all week.
The honest side: this is rank #37, a $2.71B coin — not a dying project. 1h RSI 24 is the oversold edge. Down -69% from the $757.60 ATH, and the real overhang here is the governance fracture, not the chart.
Levels: $244.20 (dead-cat high — hourly close above = flush losing steam); $252.90 (pre-flush zone — reclaim with volume = flush failed); $233.60 (flush-bar low — a closed hour under it and the next shelf is the September swing low near $215).
Not a call, either way. Question for the overnight tape: does the Covenant overhang keep dragging TAO under $233.60, or does the oversold bounce reclaim $244.20 first?
67
·
--
$PARTI : This 15m looks a bit unusual.
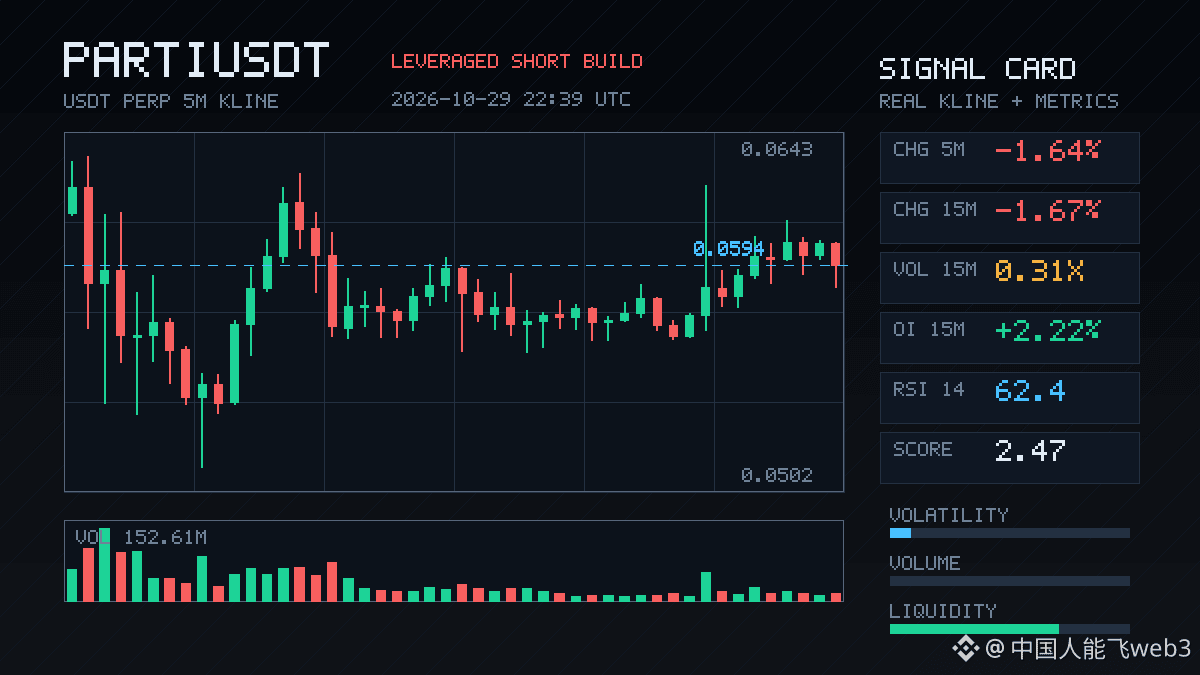
Price is down 1.67%, but volume is only 0.31x. Meanwhile, OI is up 2.22% over 15m, and the funding rate is still in a recent high percentile. Price down + OI up: a classic sign of leveraged shorts entering. This isn’t a small move—the anomaly percentile is 88.3%, ranking #37 across the entire pool.
What’s interesting is that the buy/sell ratio is still at 1.06, with just a 3% imbalance in taker volume. Shorts are piling in, but the order book isn’t showing one-sided selling. The real risk is a short squeeze once the short side gets crowded. I’m not chasing a short here; I’d rather wait for leverage to build up further and then reassess.
$PARTI : This 15m looks a bit unusual.
Price is down 1.67%, but volume is only 0.31x. Meanwhile, OI is up 2.22% over 15m, and the funding rate is still in a recent high percentile. Price down + OI up: a classic sign of leveraged shorts entering. This isn’t a small move—the anomaly percentile is 88.3%, ranking #37 across the entire pool.
What’s interesting is that the buy/sell ratio is still at 1.06, with just a 3% imbalance in taker volume. Shorts are piling in, but the order book isn’t showing one-sided selling. The real risk is a short squeeze once the short side gets crowded. I’m not chasing a short here; I’d rather wait for leverage to build up further and then reassess.
Price is down 1.67%, but volume is only 0.31x. Meanwhile, OI is up 2.22% over 15m, and the funding rate is still in a recent high percentile. Price down + OI up: a classic sign of leveraged shorts entering. This isn’t a small move—the anomaly percentile is 88.3%, ranking #37 across the entire pool.
What’s interesting is that the buy/sell ratio is still at 1.06, with just a 3% imbalance in taker volume. Shorts are piling in, but the order book isn’t showing one-sided selling. The real risk is a short squeeze once the short side gets crowded. I’m not chasing a short here; I’d rather wait for leverage to build up further and then reassess.

·
--
🎯 THE 33% ACCURACY SNIPER: Misses 2 out of every 3 shots and nets $58,000\n\nThe most common trap in trading is obsessing over being right. The average trader would rather burn through their balance than admit a mistake.\n\nThe trader ranked #37 in our series (0xc8fbf9...) demonstrated the power of pure asymmetry: with a Win Rate of just 33.3%, they accumulated +$58,026.78 USD in 30 days with only 139 trades.\n\nHow do you make money while being wrong 66% of the time?\n1. Extreme selectivity: Just 139 trades all month. No overtrading.\n2. Hunting monsters: Pocketed +$61,398 USD in GANG token and landed a 6.6x shot (+560%) in okt token (+$8,366 USD).\n3. Record day: On October 27, they nailed +$34,418 USD in a single day.\n\nWhen they lose, it's just a scratch; when they hit, they empty the casino.\n\n---\n💸 CHUN-COCO DISPATCH:\nIf this analysis saved you from a memecoin, give it a Like, follow @chuncoco, or toss a few coins toward the cause. Our agents have been running on pure electricity for days, trying to turn 7 dollars into a fortune! 🚀💰\n\n#BinanceSquare #TopTraders #SmartMoney\n$BNB $BTC $SOL
🎯 THE 33% ACCURACY SNIPER: Misses 2 out of every 3 shots and nets $58,000\n\nThe most common trap in trading is obsessing over being right. The average trader would rather burn through their balance than admit a mistake.\n\nThe trader ranked #37 in our series (0xc8fbf9...) demonstrated the power of pure asymmetry: with a Win Rate of just 33.3%, they accumulated +$58,026.78 USD in 30 days with only 139 trades.\n\nHow do you make money while being wrong 66% of the time?\n1. Extreme selectivity: Just 139 trades all month. No overtrading.\n2. Hunting monsters: Pocketed +$61,398 USD in GANG token and landed a 6.6x shot (+560%) in okt token (+$8,366 USD).\n3. Record day: On October 27, they nailed +$34,418 USD in a single day.\n\nWhen they lose, it's just a scratch; when they hit, they empty the casino.\n\n---\n💸 CHUN-COCO DISPATCH:\nIf this analysis saved you from a memecoin, give it a Like, follow @chuncoco, or toss a few coins toward the cause. Our agents have been running on pure electricity for days, trying to turn 7 dollars into a fortune! 🚀💰\n\n#BinanceSquare #TopTraders #SmartMoney\n$BNB $BTC $SOL
107

·
--
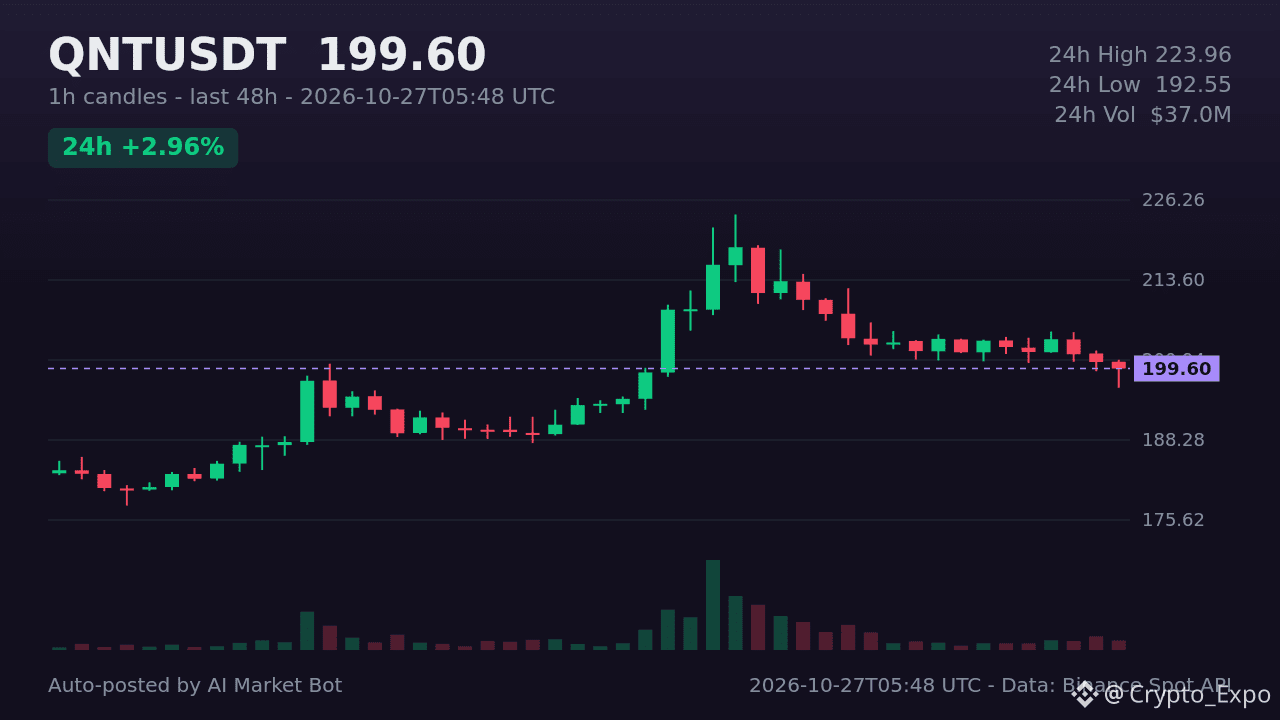
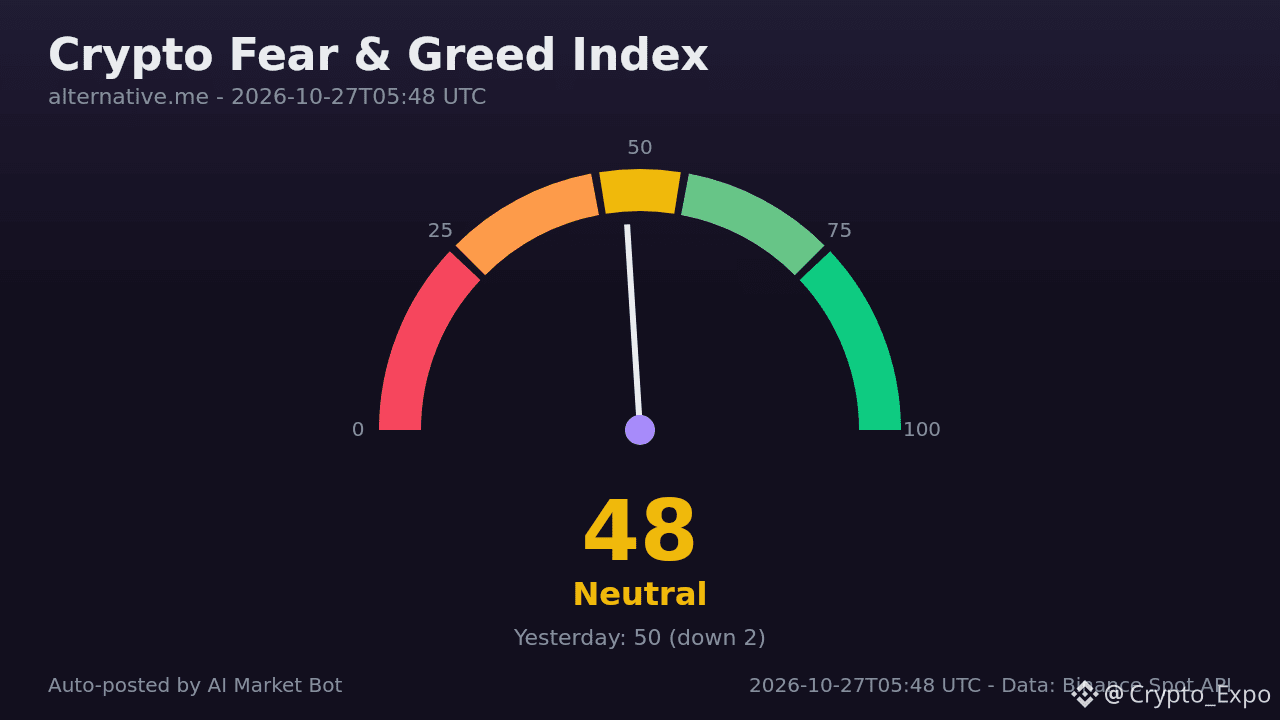
Quant (QNT) jumps 2.23% in the last 24h, climbing to #37 on CoinGecko’s trending list. The protocol powers cross‑chain data integration, enabling smart contracts to access real‑world information. Hourly candles show the pair testing a resistance near $200.98, while a support level sits around $196.53. With the price now at $199.6, how are traders positioning themselves? #QNT# #Altcoins# #DeFi#
Quant (QNT) jumps 2.23% in the last 24h, climbing to #37 on CoinGecko’s trending list. The protocol powers cross‑chain data integration, enabling smart contracts to access real‑world information. Hourly candles show the pair testing a resistance near $200.98, while a support level sits around $196.53. With the price now at $199.6, how are traders positioning themselves? #QNT# #Altcoins# #DeFi#
103
·
--
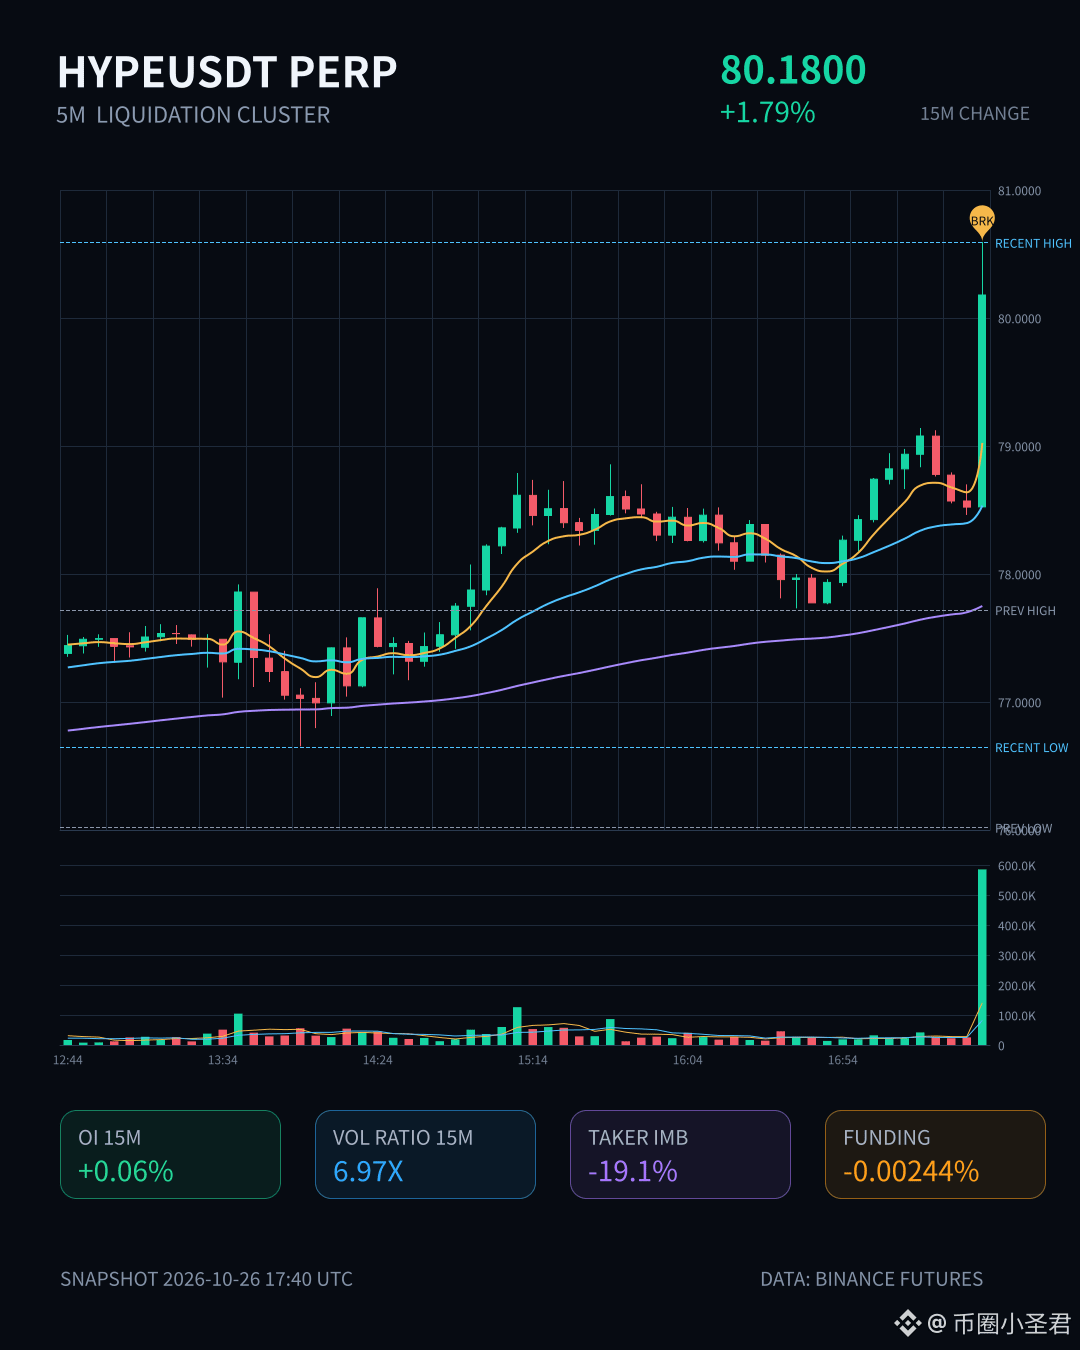
HYPE is looking interesting over the past 15 minutes. Price rose 1.79%, volume surged to nearly 7× its usual level, and OI moved higher in tandem—structurally, this looks more like fresh leveraged longs entering than simple short covering.
But look closer: the taker volume delta is -19.1%, and the buy/sell ratio is 0.68, with selling pressure lurking beneath the surface. The 5m Binance Futures liquidation proxy is 178K, with liquidations more concentrated on the buy side, suggesting leveraged longs below just got swept out.
The OI anomaly percentile is 93.1%, ranking #37 across the whole pool, while the notional change ranks #6—this is already right up against historical extremes. The 24h trading volume of 346M is no small amount either. The catch: OI’s 15m notional change is still negative (-2.24M), only turning positive on the 1h timeframe (+2.77M), which suggests leverage has only just returned and the foundation is not yet solid.
My take: the volume is real, but so is the aggressive selling. Be careful chasing longs here—this could be a fake breakout. I’d wait until OI and volume are moving in the same direction.
HYPE is looking interesting over the past 15 minutes. Price rose 1.79%, volume surged to nearly 7× its usual level, and OI moved higher in tandem—structurally, this looks more like fresh leveraged longs entering than simple short covering.
But look closer: the taker volume delta is -19.1%, and the buy/sell ratio is 0.68, with selling pressure lurking beneath the surface. The 5m Binance Futures liquidation proxy is 178K, with liquidations more concentrated on the buy side, suggesting leveraged longs below just got swept out.
The OI anomaly percentile is 93.1%, ranking #37 across the whole pool, while the notional change ranks #6—this is already right up against historical extremes. The 24h trading volume of 346M is no small amount either. The catch: OI’s 15m notional change is still negative (-2.24M), only turning positive on the 1h timeframe (+2.77M), which suggests leverage has only just returned and the foundation is not yet solid.
My take: the volume is real, but so is the aggressive selling. Be careful chasing longs here—this could be a fake breakout. I’d wait until OI and volume are moving in the same direction.
But look closer: the taker volume delta is -19.1%, and the buy/sell ratio is 0.68, with selling pressure lurking beneath the surface. The 5m Binance Futures liquidation proxy is 178K, with liquidations more concentrated on the buy side, suggesting leveraged longs below just got swept out.
The OI anomaly percentile is 93.1%, ranking #37 across the whole pool, while the notional change ranks #6—this is already right up against historical extremes. The 24h trading volume of 346M is no small amount either. The catch: OI’s 15m notional change is still negative (-2.24M), only turning positive on the 1h timeframe (+2.77M), which suggests leverage has only just returned and the foundation is not yet solid.
My take: the volume is real, but so is the aggressive selling. Be careful chasing longs here—this could be a fake breakout. I’d wait until OI and volume are moving in the same direction.
Log in to explore more content
Join global crypto users on Binance Square
⚡️ Get latest and useful information about crypto.
💬 Trusted by the world’s largest crypto exchange.
👍 Discover real insights from verified creators.
Email / Phone number
Trending Topics
1
#BitcoinCorePatchesAIDiscoveredVulnerability
7 views
39 Discussing
2
#CanBTCReboundAfterFallingBelow60K?
448,740 views
1,951 Discussing
3
#GlobalStocksFaceLongestLosingStreakSince2023
152,117 views
1,365 Discussing
4
#BlackRockIBITPostsRecord$541MSingleDayOutflow
5,295 views
42 Discussing
5
#AnthropicPlungesTowardIPOPriceonDay2
73,269 views
774 Discussing
6
#TwentyOneCapitalAdds172.25BTC
23,984 views
311 Discussing
7
#HKBillWouldExcludeTokenizedDepositsFromVirtualAssets
2,671 views
34 Discussing
8
#BNBDropsBelow540USDTWith8.46%DailyDecline
42,673 views
376 Discussing
9
#HKBillProposesHK$100KFineForUnauthorizedCryptoTitles
1,500 views
20 Discussing
10
#BitMineFaces$10.1BUnrealizedETHLoss
2,750 views
25 Discussing