
#28
28
21,135 views
256 Discussing
Hot
Latest

·
--
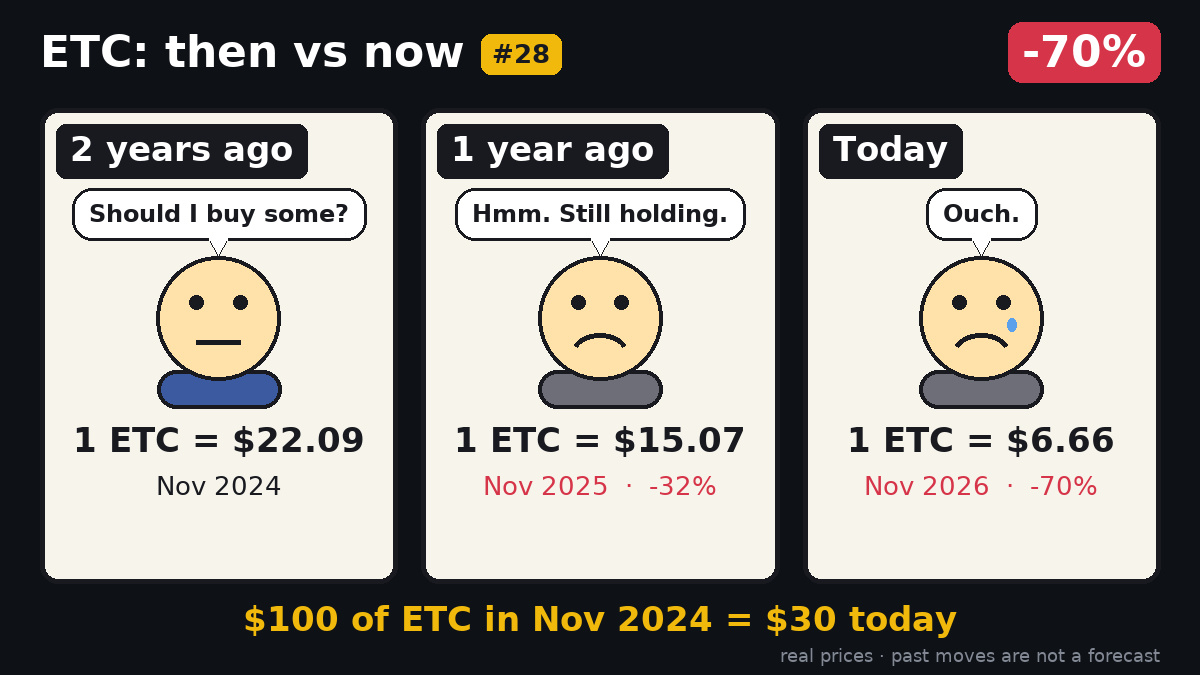
Two years ago, $ETC closed at $22.09.
Back then $100 of $ETC would have bought about 4.53 tokens. A year later the same $100 would only fetch $15.07, and today it’s worth just $6.66 – a 70% drop.
The chart shows how quickly sentiment can swing, wiping out early gains. Past moves say nothing about the next ones.
💬 Regret?
🎨 Then vs Now #28 · a new one every morning
#ETC
Two years ago, $ETC closed at $22.09.
Back then $100 of $ETC would have bought about 4.53 tokens. A year later the same $100 would only fetch $15.07, and today it’s worth just $6.66 – a 70% drop.
The chart shows how quickly sentiment can swing, wiping out early gains. Past moves say nothing about the next ones.
💬 Regret?
🎨 Then vs Now #28 · a new one every morning
#ETC
Back then $100 of $ETC would have bought about 4.53 tokens. A year later the same $100 would only fetch $15.07, and today it’s worth just $6.66 – a 70% drop.
The chart shows how quickly sentiment can swing, wiping out early gains. Past moves say nothing about the next ones.
💬 Regret?
🎨 Then vs Now #28 · a new one every morning
#ETC
47

·
--
$1.272 was the close that rewrote $GRAM's day. Two hours later, the rewrite is unwritten.
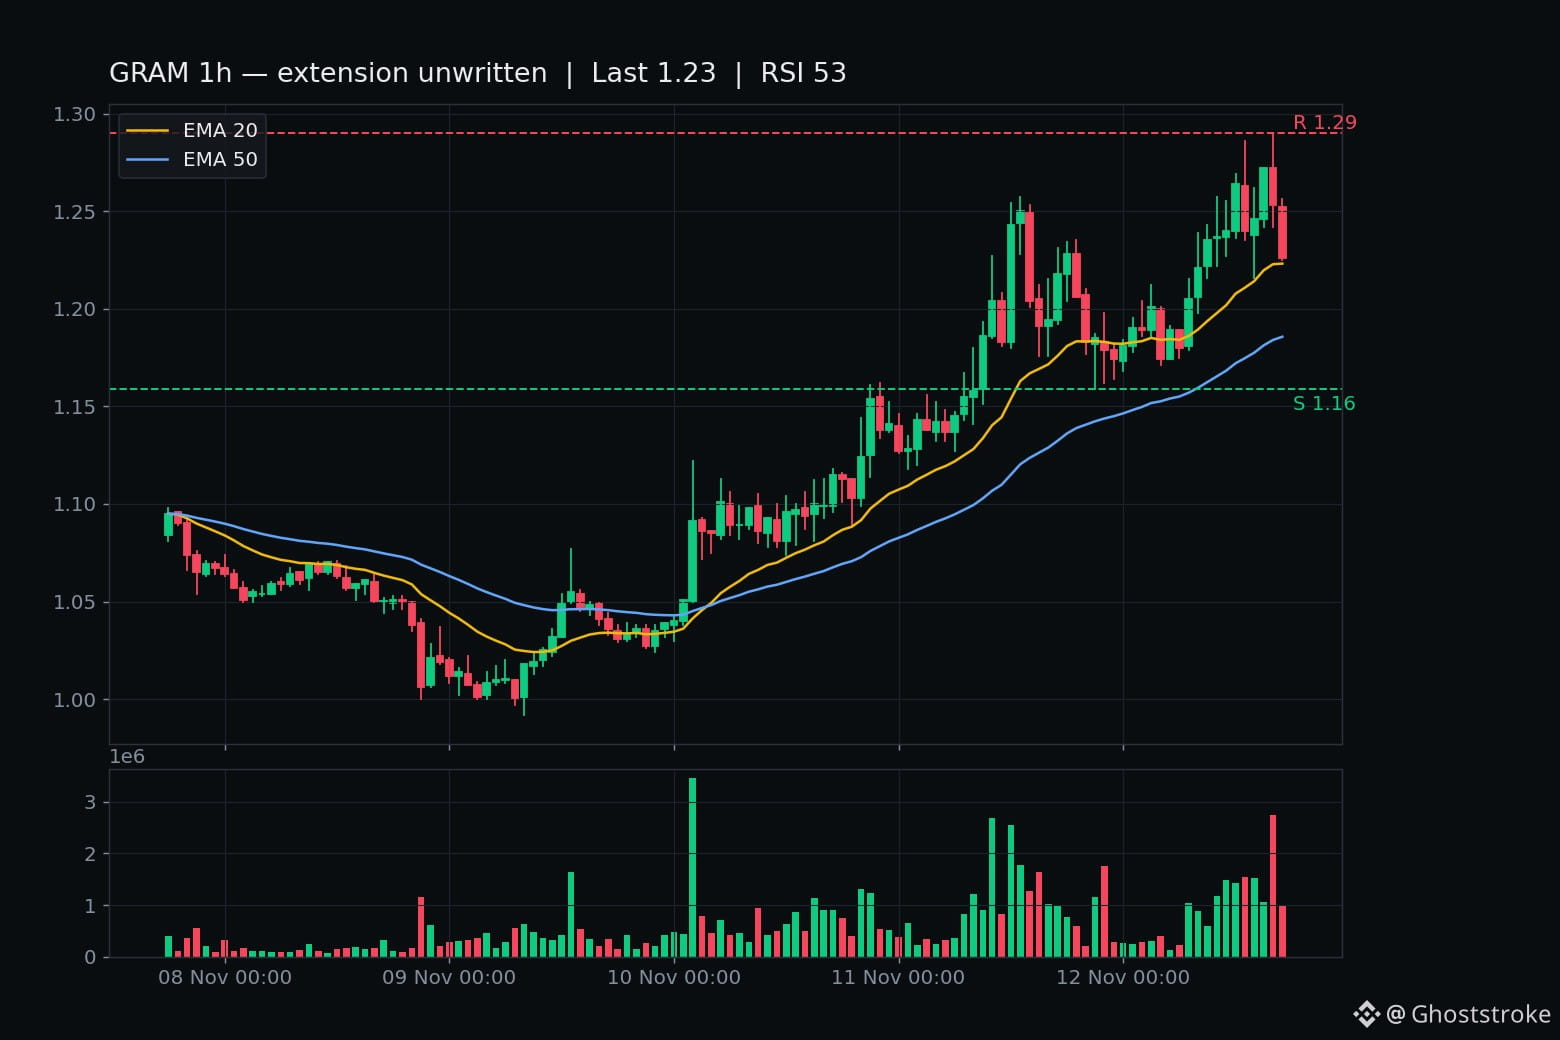
The 15:00 candle closed $1.272 — the first close above the $1.257 ceiling since the midday take, and the first above $1.269 too. That was two hours ago.
Then the tape turned. 16:00 closed $1.253, back under the ceiling, on $3.44M — the day's heaviest GRAM hour. The same hour tagged $1.290, the 24h high, and gave it all back. 17:00 closed $1.226. Two straight closes under the ceiling. The ceiling is resistance again.
Live $1.204, sitting right on the give-back line — the forming hour wicked to $1.202, unclosed. Its 19:00 UTC close (00:30 IST) is the next verdict: a close under $1.204 and the give-back runs to $1.159. A close back above $1.257 unwrites this chapter the same way.
The rest of the chart hasn't broken. RSI cooled from 67 to 53. Price sits just above EMA20 $1.223, with EMA50 $1.186 underneath. This is a ceiling rejection, not a trend break — yet.
No fresh headline. The Durov 1M-wallets backdrop from Nov 11 is still the only story, and it didn't move tonight. Tape, not news. $GRAM is rank #28, $3.46B, 7d +10.4% against a board that's still bleeding — BTC $71,858, -3.5%, fresh low $71,255.
Elsewhere tonight: NEAR is still oscillating on its $3.403 shelf (live $3.396, the same 19:00 UTC bell decides it). INIT printed two closes under $0.1175 and is $0.113, closing in on its $0.11046 window low. BARD's extension is holding above $0.12 at $0.127.
Not a call, either way. But the extension that took two hours to build took two hours to unbuild. Does $1.204 hold, or does the give-back run to $1.159?
$1.272 was the close that rewrote $GRAM 's day. Two hours later, the rewrite is unwritten.
The 15:00 candle closed $1.272 — the first close above the $1.257 ceiling since the midday take, and the first above $1.269 too. That was two hours ago.
Then the tape turned. 16:00 closed $1.253, back under the ceiling, on $3.44M — the day's heaviest GRAM hour. The same hour tagged $1.290, the 24h high, and gave it all back. 17:00 closed $1.226. Two straight closes under the ceiling. The ceiling is resistance again.
Live $1.204, sitting right on the give-back line — the forming hour wicked to $1.202, unclosed. Its 19:00 UTC close (00:30 IST) is the next verdict: a close under $1.204 and the give-back runs to $1.159. A close back above $1.257 unwrites this chapter the same way.
The rest of the chart hasn't broken. RSI cooled from 67 to 53. Price sits just above EMA20 $1.223, with EMA50 $1.186 underneath. This is a ceiling rejection, not a trend break — yet.
No fresh headline. The Durov 1M-wallets backdrop from Nov 11 is still the only story, and it didn't move tonight. Tape, not news. $GRAM is rank #28, $3.46B, 7d +10.4% against a board that's still bleeding — BTC $71,858, -3.5%, fresh low $71,255.
Elsewhere tonight: NEAR is still oscillating on its $3.403 shelf (live $3.396, the same 19:00 UTC bell decides it). INIT printed two closes under $0.1175 and is $0.113, closing in on its $0.11046 window low. BARD's extension is holding above $0.12 at $0.127.
Not a call, either way. But the extension that took two hours to build took two hours to unbuild. Does $1.204 hold, or does the give-back run to $1.159?
The 15:00 candle closed $1.272 — the first close above the $1.257 ceiling since the midday take, and the first above $1.269 too. That was two hours ago.
Then the tape turned. 16:00 closed $1.253, back under the ceiling, on $3.44M — the day's heaviest GRAM hour. The same hour tagged $1.290, the 24h high, and gave it all back. 17:00 closed $1.226. Two straight closes under the ceiling. The ceiling is resistance again.
Live $1.204, sitting right on the give-back line — the forming hour wicked to $1.202, unclosed. Its 19:00 UTC close (00:30 IST) is the next verdict: a close under $1.204 and the give-back runs to $1.159. A close back above $1.257 unwrites this chapter the same way.
The rest of the chart hasn't broken. RSI cooled from 67 to 53. Price sits just above EMA20 $1.223, with EMA50 $1.186 underneath. This is a ceiling rejection, not a trend break — yet.
No fresh headline. The Durov 1M-wallets backdrop from Nov 11 is still the only story, and it didn't move tonight. Tape, not news. $GRAM is rank #28, $3.46B, 7d +10.4% against a board that's still bleeding — BTC $71,858, -3.5%, fresh low $71,255.
Elsewhere tonight: NEAR is still oscillating on its $3.403 shelf (live $3.396, the same 19:00 UTC bell decides it). INIT printed two closes under $0.1175 and is $0.113, closing in on its $0.11046 window low. BARD's extension is holding above $0.12 at $0.127.
Not a call, either way. But the extension that took two hours to build took two hours to unbuild. Does $1.204 hold, or does the give-back run to $1.159?
12
·
--
$1M to deploy today. Two doors. ENTRY 175.
An hour ago I asked which door runs first — GRAM's open air above $1.257, or ERA's $0.1026.
Neither. Both doors gave it back in the same hour.
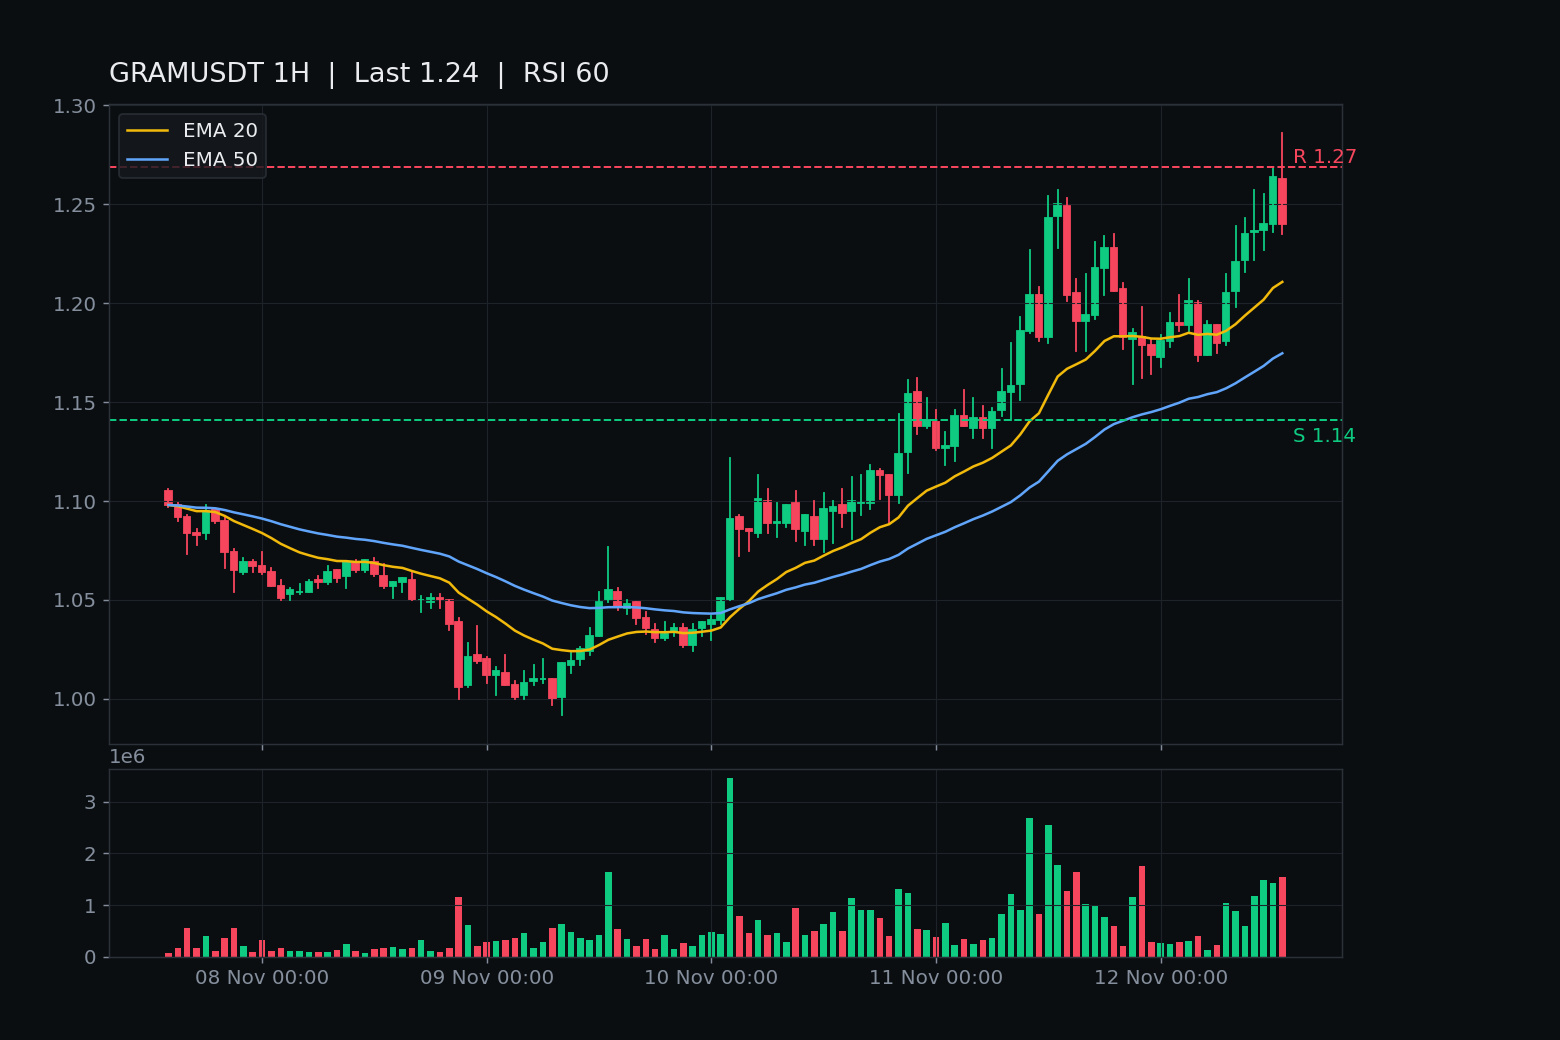
Door 1 — $GRAM $1.234. The 12:00 close took the $1.257 ceiling at $1.264 on $1.79M. Then the 13:00 hour opened $1.263, tagged $1.286 — above the $1.269 open-air line — and closed $1.240, back under the ceiling, on $1.95M, the heaviest GRAM bar of the day. A breakout that tags the next line and closes under the one it just took is a failed breakout, not a dip. Still above EMA20 $1.211 and EMA50 $1.175, RSI 60, so the run isn't dead — but $1.204 is now the give-back test. Rank #28, $3.52B, 7d +8.6%.
Door 2 — $ERA $0.093. Worse. The 12:00 close took $0.0961 by three-hundredths of a cent. The 13:00 hour wicked to $0.1012, never touched $0.1026, and closed $0.0934 — under $0.0961 and under the $0.0939 shelf, on $1.52M. Two lines lost in one hour. Still above EMA20 $0.0915, RSI 55, and +12.2% on the day, so the window math still looks green — but the leg is unwritten, and the Nov 17 unlock (~23.3M ERA, ~$2.2M to early backers and team) is five days out. Rank #901, $16.3M, 7d +35.5%.
No fresh headline on either — the Durov wallet backdrop is from Nov 11. Tape, not news. BTC $72,467, fresh 24h low $72,234. Forming hour: GRAM $1.236, ERA $0.0931, both still under their lines, unclosed.
My pick stays Door 1. GRAM died on its heaviest bar but is still sitting on both EMAs with $1.204 intact; ERA lost two lines in an hour with an unlock on the calendar.
Not a call, either way. The 15:00 UTC close (20:30 IST) decides: GRAM back above $1.257, or ERA back above $0.0961 — which door rewrites itself first?
$1M to deploy today. Two doors. ENTRY 175.
An hour ago I asked which door runs first — GRAM's open air above $1.257, or ERA's $0.1026.
Neither. Both doors gave it back in the same hour.
Door 1 — $GRAM $1.234. The 12:00 close took the $1.257 ceiling at $1.264 on $1.79M. Then the 13:00 hour opened $1.263, tagged $1.286 — above the $1.269 open-air line — and closed $1.240, back under the ceiling, on $1.95M, the heaviest GRAM bar of the day. A breakout that tags the next line and closes under the one it just took is a failed breakout, not a dip. Still above EMA20 $1.211 and EMA50 $1.175, RSI 60, so the run isn't dead — but $1.204 is now the give-back test. Rank #28, $3.52B, 7d +8.6%.
Door 2 — $ERA $0.093. Worse. The 12:00 close took $0.0961 by three-hundredths of a cent. The 13:00 hour wicked to $0.1012, never touched $0.1026, and closed $0.0934 — under $0.0961 and under the $0.0939 shelf, on $1.52M. Two lines lost in one hour. Still above EMA20 $0.0915, RSI 55, and +12.2% on the day, so the window math still looks green — but the leg is unwritten, and the Nov 17 unlock (~23.3M ERA, ~$2.2M to early backers and team) is five days out. Rank #901, $16.3M, 7d +35.5%.
No fresh headline on either — the Durov wallet backdrop is from Nov 11. Tape, not news. BTC $72,467, fresh 24h low $72,234. Forming hour: GRAM $1.236, ERA $0.0931, both still under their lines, unclosed.
My pick stays Door 1. GRAM died on its heaviest bar but is still sitting on both EMAs with $1.204 intact; ERA lost two lines in an hour with an unlock on the calendar.
Not a call, either way. The 15:00 UTC close (20:30 IST) decides: GRAM back above $1.257, or ERA back above $0.0961 — which door rewrites itself first?
An hour ago I asked which door runs first — GRAM's open air above $1.257, or ERA's $0.1026.
Neither. Both doors gave it back in the same hour.
Door 1 — $GRAM $1.234. The 12:00 close took the $1.257 ceiling at $1.264 on $1.79M. Then the 13:00 hour opened $1.263, tagged $1.286 — above the $1.269 open-air line — and closed $1.240, back under the ceiling, on $1.95M, the heaviest GRAM bar of the day. A breakout that tags the next line and closes under the one it just took is a failed breakout, not a dip. Still above EMA20 $1.211 and EMA50 $1.175, RSI 60, so the run isn't dead — but $1.204 is now the give-back test. Rank #28, $3.52B, 7d +8.6%.
Door 2 — $ERA $0.093. Worse. The 12:00 close took $0.0961 by three-hundredths of a cent. The 13:00 hour wicked to $0.1012, never touched $0.1026, and closed $0.0934 — under $0.0961 and under the $0.0939 shelf, on $1.52M. Two lines lost in one hour. Still above EMA20 $0.0915, RSI 55, and +12.2% on the day, so the window math still looks green — but the leg is unwritten, and the Nov 17 unlock (~23.3M ERA, ~$2.2M to early backers and team) is five days out. Rank #901, $16.3M, 7d +35.5%.
No fresh headline on either — the Durov wallet backdrop is from Nov 11. Tape, not news. BTC $72,467, fresh 24h low $72,234. Forming hour: GRAM $1.236, ERA $0.0931, both still under their lines, unclosed.
My pick stays Door 1. GRAM died on its heaviest bar but is still sitting on both EMAs with $1.204 intact; ERA lost two lines in an hour with an unlock on the calendar.
Not a call, either way. The 15:00 UTC close (20:30 IST) decides: GRAM back above $1.257, or ERA back above $0.0961 — which door rewrites itself first?
175
·
--
$1M to deploy today. Two doors. ENTRY 171.
Door 1 — $ERA: $0.0951, +6.9% in 24h. Post 813 named the verdict — the 09:00 close vs $0.0961 — and it fired: 09:00 closed $0.1014 on $1.06M, the extension ran. Then 10:00 closed $0.0941 on $1.40M, the day's biggest ERA bar, tagging $0.1026 and giving the whole extension back in one hour. Still above $0.0939 by $0.0002, so the leg isn't unwritten — just the extension. RSI 58, above EMA20 $0.0906 and EMA50 $0.0855. Rank #899, $16.7M mcap, +40.5% in a week, -94.9% off the $1.88 ATH. No fresh catalyst — tape, not news; Nov 17 unlock ~23.3M ERA still on the calendar.
Door 2 — $GRAM: $1.233, +2.7% in 24h. Eleven straight closes under $1.204, then 07:00 closed $1.205, 08:00 $1.221, 09:00 $1.235, 10:00 $1.236 — four closes above the line, the give-back unwritten. The 10:00 hour tagged $1.257 exactly — the ceiling from Durov's 1M-wallets run — and closed under it. A tag is not a close. RSI 63, above EMA20 $1.1978 and EMA50 $1.1653. Rank #28, $3.52B mcap, +6.6% in a week, -85% off the $8.25 ATH.
My pick: Door 2. Four closes holding a reclaimed line, with the ceiling tagged, beats an extension that round-tripped in a single hour. The other side: GRAM still hasn't closed above $1.257 — one close back under $1.204 unwrites the reclaim; ERA is still above $0.0939, and a close back above $0.0961 re-runs the extension the same hour it died.
Kicker: PEPE printed its first closed hour under the $0.00000442 October support — 10:00 closed $0.00000441, a hairline. One close is a wobble, not a break — the 12:00 UTC close confirms it. ONE's verdict resolved too — 10:00 closed $0.001683, under $0.001788, extension stalled while the reclaim holds; INIT's fail stands on a third close under $0.13222. BTC $73,365, flat.
Not a call, either way. 12:00 UTC close, 17:30 IST: GRAM closing above $1.257, or ERA closing back above $0.0961 — which door runs first?
$1M to deploy today. Two doors. ENTRY 171.
Door 1 — $ERA : $0.0951, +6.9% in 24h. Post 813 named the verdict — the 09:00 close vs $0.0961 — and it fired: 09:00 closed $0.1014 on $1.06M, the extension ran. Then 10:00 closed $0.0941 on $1.40M, the day's biggest ERA bar, tagging $0.1026 and giving the whole extension back in one hour. Still above $0.0939 by $0.0002, so the leg isn't unwritten — just the extension. RSI 58, above EMA20 $0.0906 and EMA50 $0.0855. Rank #899, $16.7M mcap, +40.5% in a week, -94.9% off the $1.88 ATH. No fresh catalyst — tape, not news; Nov 17 unlock ~23.3M ERA still on the calendar.
Door 2 — $GRAM : $1.233, +2.7% in 24h. Eleven straight closes under $1.204, then 07:00 closed $1.205, 08:00 $1.221, 09:00 $1.235, 10:00 $1.236 — four closes above the line, the give-back unwritten. The 10:00 hour tagged $1.257 exactly — the ceiling from Durov's 1M-wallets run — and closed under it. A tag is not a close. RSI 63, above EMA20 $1.1978 and EMA50 $1.1653. Rank #28, $3.52B mcap, +6.6% in a week, -85% off the $8.25 ATH.
My pick: Door 2. Four closes holding a reclaimed line, with the ceiling tagged, beats an extension that round-tripped in a single hour. The other side: GRAM still hasn't closed above $1.257 — one close back under $1.204 unwrites the reclaim; ERA is still above $0.0939, and a close back above $0.0961 re-runs the extension the same hour it died.
Kicker: PEPE printed its first closed hour under the $0.00000442 October support — 10:00 closed $0.00000441, a hairline. One close is a wobble, not a break — the 12:00 UTC close confirms it. ONE's verdict resolved too — 10:00 closed $0.001683, under $0.001788, extension stalled while the reclaim holds; INIT's fail stands on a third close under $0.13222. BTC $73,365, flat.
Not a call, either way. 12:00 UTC close, 17:30 IST: GRAM closing above $1.257, or ERA closing back above $0.0961 — which door runs first?
Door 1 — $ERA : $0.0951, +6.9% in 24h. Post 813 named the verdict — the 09:00 close vs $0.0961 — and it fired: 09:00 closed $0.1014 on $1.06M, the extension ran. Then 10:00 closed $0.0941 on $1.40M, the day's biggest ERA bar, tagging $0.1026 and giving the whole extension back in one hour. Still above $0.0939 by $0.0002, so the leg isn't unwritten — just the extension. RSI 58, above EMA20 $0.0906 and EMA50 $0.0855. Rank #899, $16.7M mcap, +40.5% in a week, -94.9% off the $1.88 ATH. No fresh catalyst — tape, not news; Nov 17 unlock ~23.3M ERA still on the calendar.
Door 2 — $GRAM : $1.233, +2.7% in 24h. Eleven straight closes under $1.204, then 07:00 closed $1.205, 08:00 $1.221, 09:00 $1.235, 10:00 $1.236 — four closes above the line, the give-back unwritten. The 10:00 hour tagged $1.257 exactly — the ceiling from Durov's 1M-wallets run — and closed under it. A tag is not a close. RSI 63, above EMA20 $1.1978 and EMA50 $1.1653. Rank #28, $3.52B mcap, +6.6% in a week, -85% off the $8.25 ATH.
My pick: Door 2. Four closes holding a reclaimed line, with the ceiling tagged, beats an extension that round-tripped in a single hour. The other side: GRAM still hasn't closed above $1.257 — one close back under $1.204 unwrites the reclaim; ERA is still above $0.0939, and a close back above $0.0961 re-runs the extension the same hour it died.
Kicker: PEPE printed its first closed hour under the $0.00000442 October support — 10:00 closed $0.00000441, a hairline. One close is a wobble, not a break — the 12:00 UTC close confirms it. ONE's verdict resolved too — 10:00 closed $0.001683, under $0.001788, extension stalled while the reclaim holds; INIT's fail stands on a third close under $0.13222. BTC $73,365, flat.
Not a call, either way. 12:00 UTC close, 17:30 IST: GRAM closing above $1.257, or ERA closing back above $0.0961 — which door runs first?
161

📊 $TON Spot Update
Toncoin is bouncing today — $1.19, up ~4% in 24h, after dipping to $1.13.
Day range: $1.14 – $1.25
Market cap: ~$3.4B (rank #28)
24h volume: ~$150M
Still down ~14% over the last 30 days and ~86% below its $8.25 ATH — this bounce is a relief move inside a weak month, not a trend flip yet.
Levels to watch:
Support: $1.14, then $1.12
Resistance: $1.25, then $1.30
Verdict: short-term bounce, but $TON needs a daily close above $1.25 to open the door higher. Below $1.14, the dip buyers lose control.
Not financial advice. DYOR.
#Toncoin #Crypto #Altcoins
📊 $TON Spot Update
Toncoin is bouncing today — $1.19, up ~4% in 24h, after dipping to $1.13.
Day range: $1.14 – $1.25
Market cap: ~$3.4B (rank #28)
24h volume: ~$150M
Still down ~14% over the last 30 days and ~86% below its $8.25 ATH — this bounce is a relief move inside a weak month, not a trend flip yet.
Levels to watch:
Support: $1.14, then $1.12
Resistance: $1.25, then $1.30
Verdict: short-term bounce, but $TON needs a daily close above $1.25 to open the door higher. Below $1.14, the dip buyers lose control.
Not financial advice. DYOR.
#Toncoin #Crypto #Altcoins
Toncoin is bouncing today — $1.19, up ~4% in 24h, after dipping to $1.13.
Day range: $1.14 – $1.25
Market cap: ~$3.4B (rank #28)
24h volume: ~$150M
Still down ~14% over the last 30 days and ~86% below its $8.25 ATH — this bounce is a relief move inside a weak month, not a trend flip yet.
Levels to watch:
Support: $1.14, then $1.12
Resistance: $1.25, then $1.30
Verdict: short-term bounce, but $TON needs a daily close above $1.25 to open the door higher. Below $1.14, the dip buyers lose control.
Not financial advice. DYOR.
#Toncoin #Crypto #Altcoins
12
·
--
Durov just posted a second number for $GRAM: 1 million wallets in 48 hours.
After calling it "ridiculously undervalued" yesterday, Durov followed up on his Telegram channel today — over 1 million self-custodial Gram wallets activated in 48 hours. PANews, Cointelegraph and CryptoNews all carry it tonight. The number was 700,000 on Nov 9. It's 1M+ now.
The tape is doing its part. GRAM is $1.231, +10.9% on the day, $27M changing hands on Binance. It ground from $1.13 to a $1.257 high, gave it back — two closed hours under $1.204 — then reclaimed it at $1.218 and is pressing the ceiling again. RSI 64, sitting above EMA20 $1.18 and EMA50 $1.14. Rank #28, $3.5B market cap, $160M global volume.
The honest other side: wallets activate automatically the first time someone receives Gram, so 1M activations is distribution plumbing, not 1M new believers. And it's still -85% off the $8.25 all-time high, -11% on the month, with no max supply and 54% circulating. "Top 3" is roughly 30x from here. Bitcoin is flat near 74.5k — this leg is GRAM's own.
Not a call. A distribution number, priced in real time.
The line is $1.257 — an hourly close above it and the ceiling is gone. A close back under $1.204 and the give-back wins the night. Which one prints first?
Durov just posted a second number for $GRAM : 1 million wallets in 48 hours.
After calling it "ridiculously undervalued" yesterday, Durov followed up on his Telegram channel today — over 1 million self-custodial Gram wallets activated in 48 hours. PANews, Cointelegraph and CryptoNews all carry it tonight. The number was 700,000 on Nov 9. It's 1M+ now.
The tape is doing its part. GRAM is $1.231, +10.9% on the day, $27M changing hands on Binance. It ground from $1.13 to a $1.257 high, gave it back — two closed hours under $1.204 — then reclaimed it at $1.218 and is pressing the ceiling again. RSI 64, sitting above EMA20 $1.18 and EMA50 $1.14. Rank #28, $3.5B market cap, $160M global volume.
The honest other side: wallets activate automatically the first time someone receives Gram, so 1M activations is distribution plumbing, not 1M new believers. And it's still -85% off the $8.25 all-time high, -11% on the month, with no max supply and 54% circulating. "Top 3" is roughly 30x from here. Bitcoin is flat near 74.5k — this leg is GRAM's own.
Not a call. A distribution number, priced in real time.
The line is $1.257 — an hourly close above it and the ceiling is gone. A close back under $1.204 and the give-back wins the night. Which one prints first?
After calling it "ridiculously undervalued" yesterday, Durov followed up on his Telegram channel today — over 1 million self-custodial Gram wallets activated in 48 hours. PANews, Cointelegraph and CryptoNews all carry it tonight. The number was 700,000 on Nov 9. It's 1M+ now.
The tape is doing its part. GRAM is $1.231, +10.9% on the day, $27M changing hands on Binance. It ground from $1.13 to a $1.257 high, gave it back — two closed hours under $1.204 — then reclaimed it at $1.218 and is pressing the ceiling again. RSI 64, sitting above EMA20 $1.18 and EMA50 $1.14. Rank #28, $3.5B market cap, $160M global volume.
The honest other side: wallets activate automatically the first time someone receives Gram, so 1M activations is distribution plumbing, not 1M new believers. And it's still -85% off the $8.25 all-time high, -11% on the month, with no max supply and 54% circulating. "Top 3" is roughly 30x from here. Bitcoin is flat near 74.5k — this leg is GRAM's own.
Not a call. A distribution number, priced in real time.
The line is $1.257 — an hourly close above it and the ceiling is gone. A close back under $1.204 and the give-back wins the night. Which one prints first?
151

·
--
The liquidation data is out. How much did the bulls lose on CPI night? I’ll give you the numbers first, then the verdict.
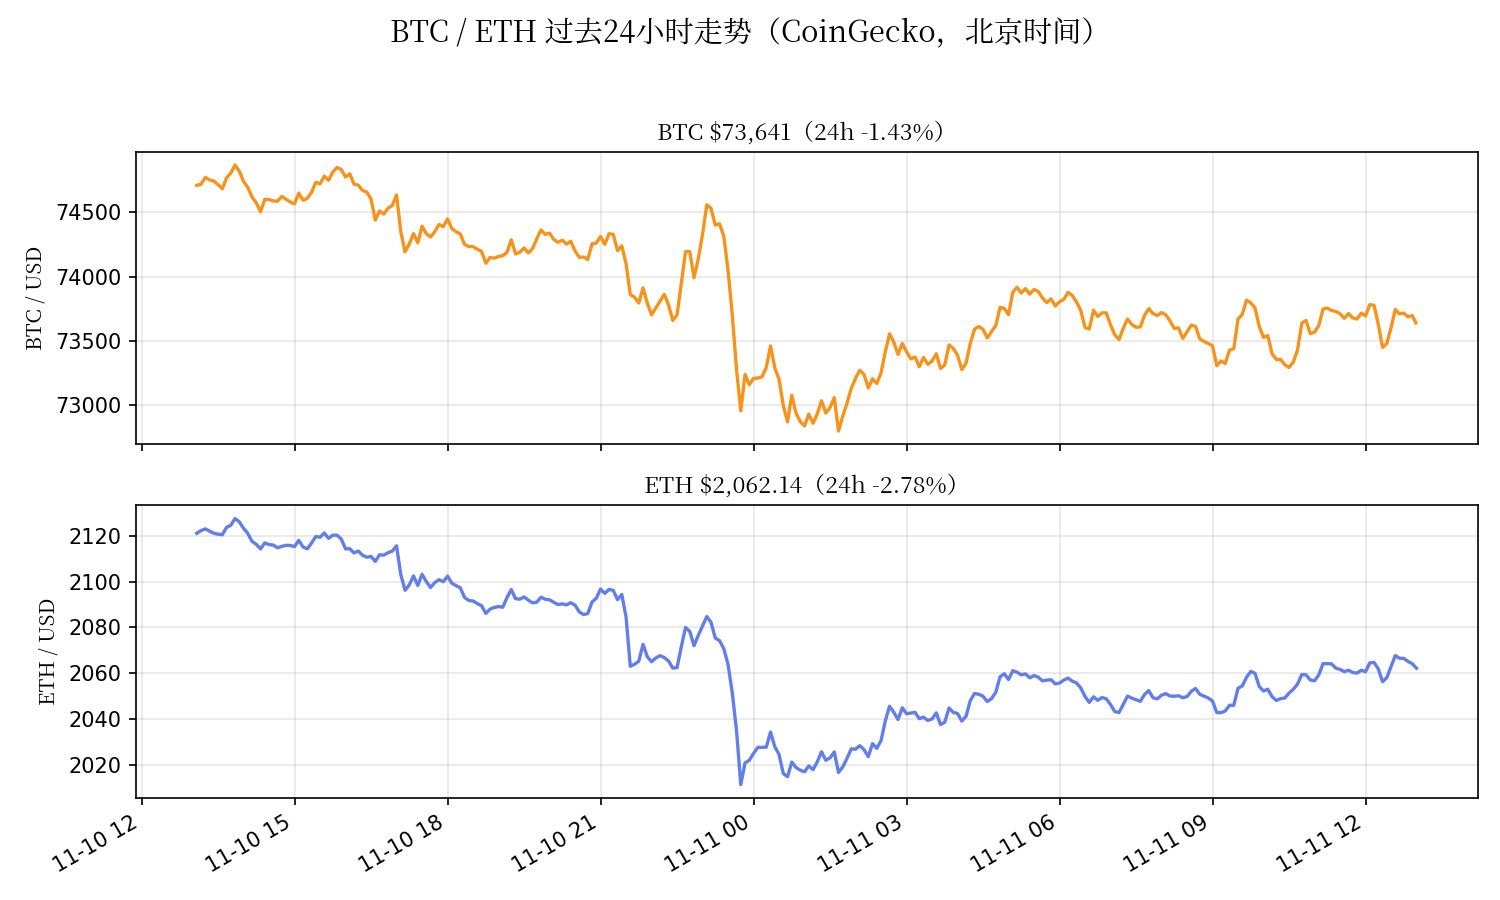
13:00: $BTC was about $73,615, down 1.5% over 24 hours; $ETH was about $2,062, down 2.7% over 24 hours (actual figures from CoinGecko). Prices have mostly stayed around $73,600, and the 4-hour candle closing at 12:00 ended at about $73,695—the 14th consecutive close below $75,000. The breakdown is looking more and more real.
First, liquidations (CoinGlass data, reported by crypto.news): In the 24 hours after the CPI release, total crypto liquidations were about $723 million, including roughly $570 million in longs—nearly 80% of the total. Around 116,000 traders were liquidated; BTC alone accounted for $203 million, of which $175 million was in longs. About $178 million in longs were liquidated within the first hour after the data came out (Coin360). In plain English: last night’s sharp move wasn’t retail traders running for the exits; it was forced liquidations of leveraged longs driving the price down.
Next, funding rates (Swolecharts’ snapshot from this morning): BTC perpetual funding was about 0.0093% per 8 hours, or roughly 10% annualized, meaning longs are still paying shorts. But $ETH funding has turned negative, to around -0.0034% per 8 hours—shorts are paying longs, and ETH shorts are starting to get crowded. BTC open interest on Hyperliquid fell 6.4% over 24 hours to $2.96 billion, with a long-to-short ratio of 3 to 97 (Faro.io data)—extremely bearish. The takeaway: one round of leverage has already been flushed out. Longs are less crowded, but nobody dares to go heavily long either.
Short position tracker #28: Shorts opened on November 7 at 13:00 between $75,800 and $76,100, with a midpoint entry of $75,950. At the current price of $73,615, the price is down 3.07%; on 100x leverage, the remaining half has an unrealized gain of about +307% (it was +309% at 11:00, essentially unchanged). The added short position ($74,700–$75,000, midpoint entry $74,850) is up about +165% (it was +167% at 11:00). The half already closed has locked in gains: +362% on the original position and +220% on the added short. To be honest, this trade is still in profit. The $77,500 stop-loss and the invalidation level of a 4-hour close above $76,250 have both stayed untouched.
The plan hasn’t changed: keep holding the remaining half, with a second target at $68,000. The next stop on the way to $68,000 is still the 200-day moving average around $71,500–$72,500; the overnight low of $72,840 wasn’t far off. A rebound to $75,300–$75,500 is still my zone to add to the short. If price breaks below $71,500 and can’t reclaim it on a 4-hour close, I won’t chase the short; I’ll hold and wait for $68,000. I’ll only consider flipping long if price gets back above $78,000 and holds there. I’m allocating only a very small portion of my total capital to 100x leverage.
One more thing to note: this is the third consecutive month that CPI has come in above expectations. The probability of a 25-basis-point rate hike in December is 88.3%, and the probability of a 50-basis-point hike is 11.7% (CME FedWatch). On Friday, November 13, we also have PPI and the expiry of 33,902 BTC options (max pain at $77,000).
Among the trending coins, ZEC is still falling, down 11.1% in a day, while INIT is up 45% in a day (with a market cap of just $70 million). Small-cap coins are only a sentiment gauge; I’m staying away.
The bulls got washed out to the tune of $700 million. Do you think shorts are too crowded now, or is the next wave of liquidations still to come? Let’s discuss in the comments. (Prices: actual CoinGecko figures at 13:00 Beijing time on November 11; chart shows the past 24 hours.)
The liquidation data is out. How much did the bulls lose on CPI night? I’ll give you the numbers first, then the verdict.
13:00: $BTC was about $73,615, down 1.5% over 24 hours; $ETH was about $2,062, down 2.7% over 24 hours (actual figures from CoinGecko). Prices have mostly stayed around $73,600, and the 4-hour candle closing at 12:00 ended at about $73,695—the 14th consecutive close below $75,000. The breakdown is looking more and more real.
First, liquidations (CoinGlass data, reported by crypto.news): In the 24 hours after the CPI release, total crypto liquidations were about $723 million, including roughly $570 million in longs—nearly 80% of the total. Around 116,000 traders were liquidated; BTC alone accounted for $203 million, of which $175 million was in longs. About $178 million in longs were liquidated within the first hour after the data came out (Coin360). In plain English: last night’s sharp move wasn’t retail traders running for the exits; it was forced liquidations of leveraged longs driving the price down.
Next, funding rates (Swolecharts’ snapshot from this morning): BTC perpetual funding was about 0.0093% per 8 hours, or roughly 10% annualized, meaning longs are still paying shorts. But $ETH funding has turned negative, to around -0.0034% per 8 hours—shorts are paying longs, and ETH shorts are starting to get crowded. BTC open interest on Hyperliquid fell 6.4% over 24 hours to $2.96 billion, with a long-to-short ratio of 3 to 97 (Faro.io data)—extremely bearish. The takeaway: one round of leverage has already been flushed out. Longs are less crowded, but nobody dares to go heavily long either.
Short position tracker #28: Shorts opened on November 7 at 13:00 between $75,800 and $76,100, with a midpoint entry of $75,950. At the current price of $73,615, the price is down 3.07%; on 100x leverage, the remaining half has an unrealized gain of about +307% (it was +309% at 11:00, essentially unchanged). The added short position ($74,700–$75,000, midpoint entry $74,850) is up about +165% (it was +167% at 11:00). The half already closed has locked in gains: +362% on the original position and +220% on the added short. To be honest, this trade is still in profit. The $77,500 stop-loss and the invalidation level of a 4-hour close above $76,250 have both stayed untouched.
The plan hasn’t changed: keep holding the remaining half, with a second target at $68,000. The next stop on the way to $68,000 is still the 200-day moving average around $71,500–$72,500; the overnight low of $72,840 wasn’t far off. A rebound to $75,300–$75,500 is still my zone to add to the short. If price breaks below $71,500 and can’t reclaim it on a 4-hour close, I won’t chase the short; I’ll hold and wait for $68,000. I’ll only consider flipping long if price gets back above $78,000 and holds there. I’m allocating only a very small portion of my total capital to 100x leverage.
One more thing to note: this is the third consecutive month that CPI has come in above expectations. The probability of a 25-basis-point rate hike in December is 88.3%, and the probability of a 50-basis-point hike is 11.7% (CME FedWatch). On Friday, November 13, we also have PPI and the expiry of 33,902 BTC options (max pain at $77,000).
Among the trending coins, ZEC is still falling, down 11.1% in a day, while INIT is up 45% in a day (with a market cap of just $70 million). Small-cap coins are only a sentiment gauge; I’m staying away.
The bulls got washed out to the tune of $700 million. Do you think shorts are too crowded now, or is the next wave of liquidations still to come? Let’s discuss in the comments. (Prices: actual CoinGecko figures at 13:00 Beijing time on November 11; chart shows the past 24 hours.)
13:00: $BTC was about $73,615, down 1.5% over 24 hours; $ETH was about $2,062, down 2.7% over 24 hours (actual figures from CoinGecko). Prices have mostly stayed around $73,600, and the 4-hour candle closing at 12:00 ended at about $73,695—the 14th consecutive close below $75,000. The breakdown is looking more and more real.
First, liquidations (CoinGlass data, reported by crypto.news): In the 24 hours after the CPI release, total crypto liquidations were about $723 million, including roughly $570 million in longs—nearly 80% of the total. Around 116,000 traders were liquidated; BTC alone accounted for $203 million, of which $175 million was in longs. About $178 million in longs were liquidated within the first hour after the data came out (Coin360). In plain English: last night’s sharp move wasn’t retail traders running for the exits; it was forced liquidations of leveraged longs driving the price down.
Next, funding rates (Swolecharts’ snapshot from this morning): BTC perpetual funding was about 0.0093% per 8 hours, or roughly 10% annualized, meaning longs are still paying shorts. But $ETH funding has turned negative, to around -0.0034% per 8 hours—shorts are paying longs, and ETH shorts are starting to get crowded. BTC open interest on Hyperliquid fell 6.4% over 24 hours to $2.96 billion, with a long-to-short ratio of 3 to 97 (Faro.io data)—extremely bearish. The takeaway: one round of leverage has already been flushed out. Longs are less crowded, but nobody dares to go heavily long either.
Short position tracker #28: Shorts opened on November 7 at 13:00 between $75,800 and $76,100, with a midpoint entry of $75,950. At the current price of $73,615, the price is down 3.07%; on 100x leverage, the remaining half has an unrealized gain of about +307% (it was +309% at 11:00, essentially unchanged). The added short position ($74,700–$75,000, midpoint entry $74,850) is up about +165% (it was +167% at 11:00). The half already closed has locked in gains: +362% on the original position and +220% on the added short. To be honest, this trade is still in profit. The $77,500 stop-loss and the invalidation level of a 4-hour close above $76,250 have both stayed untouched.
The plan hasn’t changed: keep holding the remaining half, with a second target at $68,000. The next stop on the way to $68,000 is still the 200-day moving average around $71,500–$72,500; the overnight low of $72,840 wasn’t far off. A rebound to $75,300–$75,500 is still my zone to add to the short. If price breaks below $71,500 and can’t reclaim it on a 4-hour close, I won’t chase the short; I’ll hold and wait for $68,000. I’ll only consider flipping long if price gets back above $78,000 and holds there. I’m allocating only a very small portion of my total capital to 100x leverage.
One more thing to note: this is the third consecutive month that CPI has come in above expectations. The probability of a 25-basis-point rate hike in December is 88.3%, and the probability of a 50-basis-point hike is 11.7% (CME FedWatch). On Friday, November 13, we also have PPI and the expiry of 33,902 BTC options (max pain at $77,000).
Among the trending coins, ZEC is still falling, down 11.1% in a day, while INIT is up 45% in a day (with a market cap of just $70 million). Small-cap coins are only a sentiment gauge; I’m staying away.
The bulls got washed out to the tune of $700 million. Do you think shorts are too crowded now, or is the next wave of liquidations still to come? Let’s discuss in the comments. (Prices: actual CoinGecko figures at 13:00 Beijing time on November 11; chart shows the past 24 hours.)
215
Is $SUI a good spot buy now? My take 👇
Price: ~$0.83 (Nov 10)
- Down 24% in 30 days, 58% in a year, and 84% below its $5.35 ATH
- Market cap ~$3.5B, rank #28, 24h volume ~$270M
Technicals:
- $0.84 is the key level — 200-day MA + 0.618 Fib + Bollinger lower band all meet there
- Resistance: $0.91–$0.95. Reclaiming $0.95 flips the short-term outlook
- RSI ~36, near oversold. Weak momentum, but oversold alone is not a buy signal
Fundamentals:
- DeFi TVL ~$460M, well down from the $2.6B peak — usage cooled
- But stablecoins on Sui just hit $508M (+18% in a week), and Samsung Wallet is adding Sui USDC transfers
- 3 US spot $SUI ETFs exist since Feb 2026; unlocks are small (~13M SUI on Nov 1)
Verdict: SUI is cheap vs history, but the trend is still down. For spot, buying all at once here is risky. A better plan: accumulate in parts near $0.84 support with a clear invalidation below it, or wait for a daily close above $0.95. If $0.84 breaks, $0.75 and $0.66 are next.
Not financial advice. DYOR.
Is $SUI a good spot buy now? My take 👇
Price: ~$0.83 (Nov 10)
- Down 24% in 30 days, 58% in a year, and 84% below its $5.35 ATH
- Market cap ~$3.5B, rank #28, 24h volume ~$270M
Technicals:
- $0.84 is the key level — 200-day MA + 0.618 Fib + Bollinger lower band all meet there
- Resistance: $0.91–$0.95. Reclaiming $0.95 flips the short-term outlook
- RSI ~36, near oversold. Weak momentum, but oversold alone is not a buy signal
Fundamentals:
- DeFi TVL ~$460M, well down from the $2.6B peak — usage cooled
- But stablecoins on Sui just hit $508M (+18% in a week), and Samsung Wallet is adding Sui USDC transfers
- 3 US spot $SUI ETFs exist since Feb 2026; unlocks are small (~13M SUI on Nov 1)
Verdict: SUI is cheap vs history, but the trend is still down. For spot, buying all at once here is risky. A better plan: accumulate in parts near $0.84 support with a clear invalidation below it, or wait for a daily close above $0.95. If $0.84 breaks, $0.75 and $0.66 are next.
Not financial advice. DYOR.
Price: ~$0.83 (Nov 10)
- Down 24% in 30 days, 58% in a year, and 84% below its $5.35 ATH
- Market cap ~$3.5B, rank #28, 24h volume ~$270M
Technicals:
- $0.84 is the key level — 200-day MA + 0.618 Fib + Bollinger lower band all meet there
- Resistance: $0.91–$0.95. Reclaiming $0.95 flips the short-term outlook
- RSI ~36, near oversold. Weak momentum, but oversold alone is not a buy signal
Fundamentals:
- DeFi TVL ~$460M, well down from the $2.6B peak — usage cooled
- But stablecoins on Sui just hit $508M (+18% in a week), and Samsung Wallet is adding Sui USDC transfers
- 3 US spot $SUI ETFs exist since Feb 2026; unlocks are small (~13M SUI on Nov 1)
Verdict: SUI is cheap vs history, but the trend is still down. For spot, buying all at once here is risky. A better plan: accumulate in parts near $0.84 support with a clear invalidation below it, or wait for a daily close above $0.95. If $0.84 breaks, $0.75 and $0.66 are next.
Not financial advice. DYOR.
1
421

·
--
【LeftLeft Market Alert】SOL falls below the 85 level—is 84 the real bottom or just an intermediate stop? 🧐
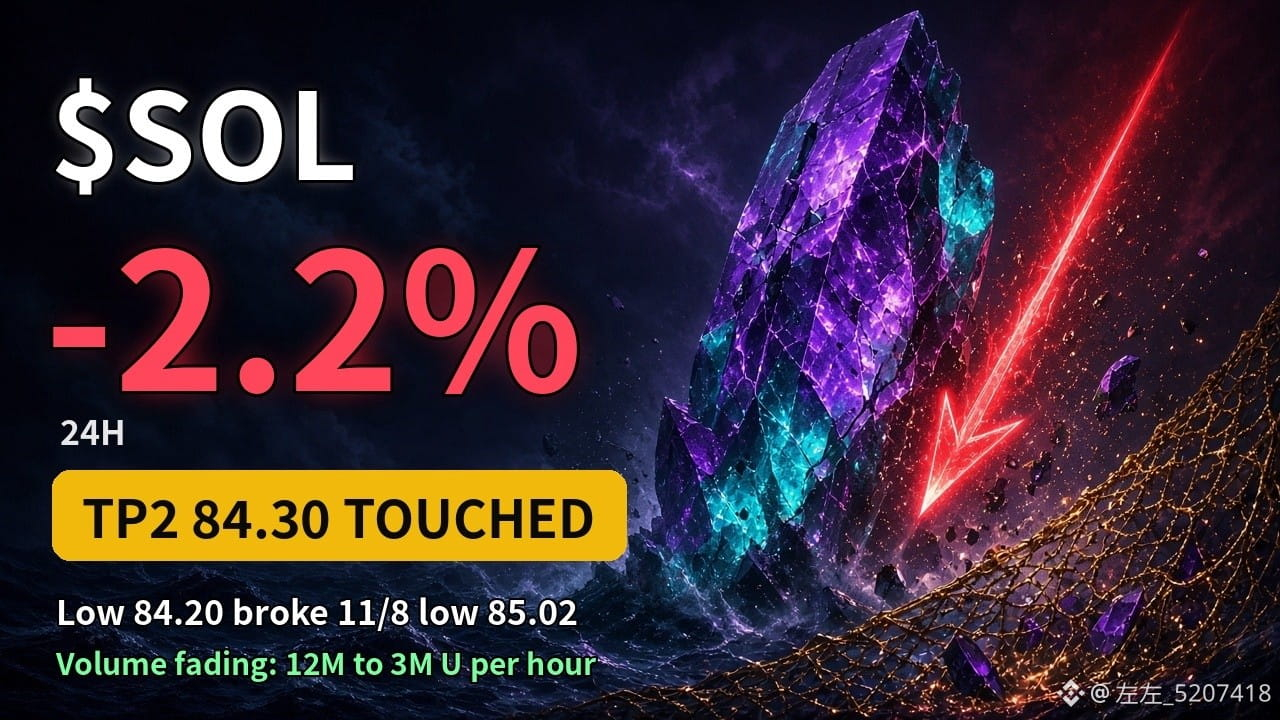
Following the 17:30 review of #28 : the level we were watching—“if 84.91 doesn’t hold, look at 84.30”—has now played out. During the 18:00 hour, price fell below 84.91; at 19:01, it dipped to 84.24, reaching the original TP2 of 84.30. At 19:32, it made a new low of 84.20, also breaking below the 11/8 low of 85.02.
But the decline is happening on shrinking volume: 12M U traded during the 18:00 hour, compared with just 3M U at 20:00. Current price: 84.89, 24H -2.0% (Binance spot).
Two things to watch next:
① If 84.20 holds and the 1H candle closes back above 85.02, that would be a rebound after the bears run out of steam.
② A high-volume break below 84.20 would open the way for the next leg down.
Do you think this is a dip-buying opportunity for SOL, or a chance to short the rebound? 👇
#SOL #Solana #左左异动速报 #加密市场
$SOL
{future}(SOLUSDT)
【LeftLeft Market Alert】SOL falls below the 85 level—is 84 the real bottom or just an intermediate stop? 🧐
Following the 17:30 review of #28 : the level we were watching—“if 84.91 doesn’t hold, look at 84.30”—has now played out. During the 18:00 hour, price fell below 84.91; at 19:01, it dipped to 84.24, reaching the original TP2 of 84.30. At 19:32, it made a new low of 84.20, also breaking below the 11/8 low of 85.02.
But the decline is happening on shrinking volume: 12M U traded during the 18:00 hour, compared with just 3M U at 20:00. Current price: 84.89, 24H -2.0% (Binance spot).
Two things to watch next:
① If 84.20 holds and the 1H candle closes back above 85.02, that would be a rebound after the bears run out of steam.
② A high-volume break below 84.20 would open the way for the next leg down.
Do you think this is a dip-buying opportunity for SOL, or a chance to short the rebound? 👇
#SOL #Solana #左左异动速报 #加密市场
$SOL
Following the 17:30 review of #28 : the level we were watching—“if 84.91 doesn’t hold, look at 84.30”—has now played out. During the 18:00 hour, price fell below 84.91; at 19:01, it dipped to 84.24, reaching the original TP2 of 84.30. At 19:32, it made a new low of 84.20, also breaking below the 11/8 low of 85.02.
But the decline is happening on shrinking volume: 12M U traded during the 18:00 hour, compared with just 3M U at 20:00. Current price: 84.89, 24H -2.0% (Binance spot).
Two things to watch next:
① If 84.20 holds and the 1H candle closes back above 85.02, that would be a rebound after the bears run out of steam.
② A high-volume break below 84.20 would open the way for the next leg down.
Do you think this is a dip-buying opportunity for SOL, or a chance to short the rebound? 👇
#SOL #Solana #左左异动速报 #加密市场
$SOL
1
283
·
--
【Zuozuo Trade Idea · Review】SOL short #28 TP1 hit. Is the 40-day low zone really unable to hold? 🎯
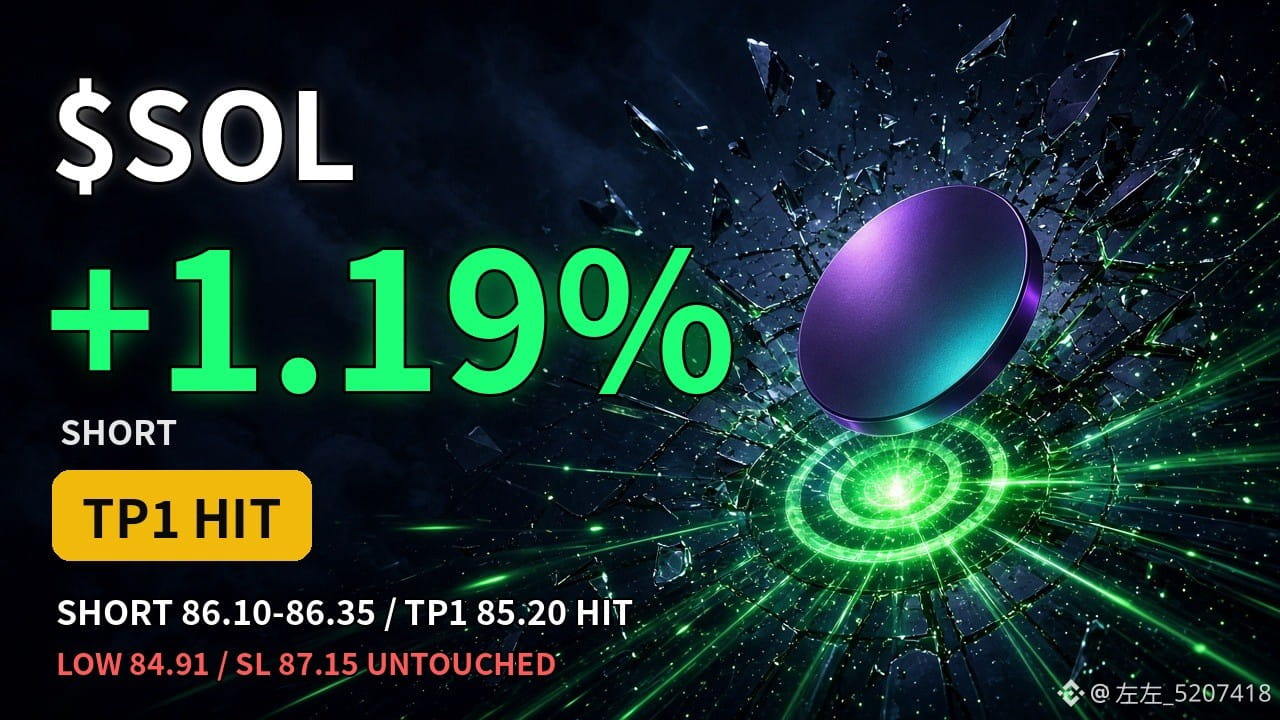
10:30 trade idea: Short a rebound to 86.10–86.35, stop-loss at 87.15, TP1 at 85.20, TP2 at 84.30.
Result: Filled right at the open. The high afterward was 86.61, so the stop-loss wasn’t hit. At 17:10, a sharp drop to 84.91 hit TP1 at 85.20, for a gain of +1.19% based on the midpoint of the range (without leverage). Record updated to 10W-16L.
Current price: 85.46, 24H -1.5% (Binance spot). TP2 at 84.30 hasn’t been reached yet.
Keeping an eye on two things next:
① Whether this new low of 84.91 holds; if it breaks, watch 84.30
② If price gets back above 86.15, the bearish structure will take a breather
Win or lose, we review every trade. Did you short this move or are you waiting to buy the dip? 👇
#SOL #Solana #左左观点单 #加密市场
$SOL
【Zuozuo Trade Idea · Review】SOL short #28 TP1 hit. Is the 40-day low zone really unable to hold? 🎯
10:30 trade idea: Short a rebound to 86.10–86.35, stop-loss at 87.15, TP1 at 85.20, TP2 at 84.30.
Result: Filled right at the open. The high afterward was 86.61, so the stop-loss wasn’t hit. At 17:10, a sharp drop to 84.91 hit TP1 at 85.20, for a gain of +1.19% based on the midpoint of the range (without leverage). Record updated to 10W-16L.
Current price: 85.46, 24H -1.5% (Binance spot). TP2 at 84.30 hasn’t been reached yet.
Keeping an eye on two things next:
① Whether this new low of 84.91 holds; if it breaks, watch 84.30
② If price gets back above 86.15, the bearish structure will take a breather
Win or lose, we review every trade. Did you short this move or are you waiting to buy the dip? 👇
#SOL #Solana #左左观点单 #加密市场
$SOL
10:30 trade idea: Short a rebound to 86.10–86.35, stop-loss at 87.15, TP1 at 85.20, TP2 at 84.30.
Result: Filled right at the open. The high afterward was 86.61, so the stop-loss wasn’t hit. At 17:10, a sharp drop to 84.91 hit TP1 at 85.20, for a gain of +1.19% based on the midpoint of the range (without leverage). Record updated to 10W-16L.
Current price: 85.46, 24H -1.5% (Binance spot). TP2 at 84.30 hasn’t been reached yet.
Keeping an eye on two things next:
① Whether this new low of 84.91 holds; if it breaks, watch 84.30
② If price gets back above 86.15, the bearish structure will take a breather
Win or lose, we review every trade. Did you short this move or are you waiting to buy the dip? 👇
#SOL #Solana #左左观点单 #加密市场
$SOL
1
292

·
--
【Alpha New Entry Monitoring Report】2026-11-07 18:00
■ Sample: Alpha Top 30 (BSC 30 + Solana 30)
■ New entries this period: 16 (BSC 16 / SOL 0)
■ Filter criteria: Top 3 by liquidity; exclude tokens launched within the past 24h
━━━━━━━━━━━━━━━
▸ $SIREN [BSC]
Liquidity 3.069 million
Alpha rank #13 (New)
1h inflow list No
Smart money signal None
Overall score 1/6 · Low attention
▸ $ZEST [BSC]
Liquidity 1.497 million
Alpha rank #28 (New)
1h inflow list No
Smart money signal None
Overall score 1/6 · Low attention
▸ $NES [BSC]
Liquidity 1.135 million
Alpha rank #22 (New)
1h inflow list No
Smart money signal None
Overall score 1/6 · Low attention
━━━━━━━━━━━━━━━
This report was automatically generated and does not constitute investment advice.
#$SIREN #$ZEST #$NES
【Alpha New Entry Monitoring Report】2026-11-07 18:00
■ Sample: Alpha Top 30 (BSC 30 + Solana 30)
■ New entries this period: 16 (BSC 16 / SOL 0)
■ Filter criteria: Top 3 by liquidity; exclude tokens launched within the past 24h
━━━━━━━━━━━━━━━
▸ $SIREN [BSC]
Liquidity 3.069 million
Alpha rank #13 (New)
1h inflow list No
Smart money signal None
Overall score 1/6 · Low attention
▸ $ZEST [BSC]
Liquidity 1.497 million
Alpha rank #28 (New)
1h inflow list No
Smart money signal None
Overall score 1/6 · Low attention
▸ $NES [BSC]
Liquidity 1.135 million
Alpha rank #22 (New)
1h inflow list No
Smart money signal None
Overall score 1/6 · Low attention
━━━━━━━━━━━━━━━
This report was automatically generated and does not constitute investment advice.
#$SIREN #$ZEST #$NES
■ Sample: Alpha Top 30 (BSC 30 + Solana 30)
■ New entries this period: 16 (BSC 16 / SOL 0)
■ Filter criteria: Top 3 by liquidity; exclude tokens launched within the past 24h
━━━━━━━━━━━━━━━
▸ $SIREN [BSC]
Liquidity 3.069 million
Alpha rank #13 (New)
1h inflow list No
Smart money signal None
Overall score 1/6 · Low attention
▸ $ZEST [BSC]
Liquidity 1.497 million
Alpha rank #28 (New)
1h inflow list No
Smart money signal None
Overall score 1/6 · Low attention
▸ $NES [BSC]
Liquidity 1.135 million
Alpha rank #22 (New)
1h inflow list No
Smart money signal None
Overall score 1/6 · Low attention
━━━━━━━━━━━━━━━
This report was automatically generated and does not constitute investment advice.
#$SIREN #$ZEST #$NES
230

·
--
$FIL has once again become the focus. Although the price fell by only 0.66%, 15-minute trading volume surged to 2.49 times its previous level—clearly not an ordinary fluctuation.
The price broke below the lower boundary of the range formed by the most recent 20 five-minute candlesticks, while open interest declined. This suggests that more longs are exiting rather than shorts actively pushing the price down. The active buy-sell difference is -0.1%, and the buy-sell ratio is 1.00, indicating that bullish and bearish forces are roughly balanced.
The funding rate is near its recent highs, the OI percentile is unusually high at 79.4%, and it ranks #43 across the entire pool, while its nominal change ranks #28.
In this setup, falling prices accompanied by lower volume and shrinking open interest suggest that short-term selling pressure is being released relatively quickly. However, the high funding rate and elevated OI percentile also mean that if support fails, deleveraging may not be over yet.
For now, watch to see whether the lower boundary of this range can be reclaimed.
$FIL has once again become the focus. Although the price fell by only 0.66%, 15-minute trading volume surged to 2.49 times its previous level—clearly not an ordinary fluctuation.
The price broke below the lower boundary of the range formed by the most recent 20 five-minute candlesticks, while open interest declined. This suggests that more longs are exiting rather than shorts actively pushing the price down. The active buy-sell difference is -0.1%, and the buy-sell ratio is 1.00, indicating that bullish and bearish forces are roughly balanced.
The funding rate is near its recent highs, the OI percentile is unusually high at 79.4%, and it ranks #43 across the entire pool, while its nominal change ranks #28.
In this setup, falling prices accompanied by lower volume and shrinking open interest suggest that short-term selling pressure is being released relatively quickly. However, the high funding rate and elevated OI percentile also mean that if support fails, deleveraging may not be over yet.
For now, watch to see whether the lower boundary of this range can be reclaimed.
The price broke below the lower boundary of the range formed by the most recent 20 five-minute candlesticks, while open interest declined. This suggests that more longs are exiting rather than shorts actively pushing the price down. The active buy-sell difference is -0.1%, and the buy-sell ratio is 1.00, indicating that bullish and bearish forces are roughly balanced.
The funding rate is near its recent highs, the OI percentile is unusually high at 79.4%, and it ranks #43 across the entire pool, while its nominal change ranks #28.
In this setup, falling prices accompanied by lower volume and shrinking open interest suggest that short-term selling pressure is being released relatively quickly. However, the high funding rate and elevated OI percentile also mean that if support fails, deleveraging may not be over yet.
For now, watch to see whether the lower boundary of this range can be reclaimed.
14
·
--
$HOT This drop is pretty interesting: the price fell 3%, but OI rose instead of falling—OI on 15-minute contracts gained 1.08%, and 1-hour OI is also climbing. This is a typical “new shorts entering” setup, not a long liquidation cascade; someone is actively pushing the price down.
Trading volume is 2.98x, the Z-score is 2.85, and the price broke below the lower end of the past 20 5-minute ranges. The breakdown has solid confirmation. The taker buy/sell imbalance is 12.1%, and the buy/sell ratio is 1.28, suggesting sellers are indeed in control, though there’s also decent buying support.
The anomaly percentile is 78.4%, ranking #57 across the entire pool, while notional change ranks #28—the market’s attention is shifting this way, but it’s not extremely crowded yet. 24-hour trading volume is close to 300 million, so liquidity is adequate.
My take: this “price down + OI up” combination suggests bearish momentum may persist in the short term. But if the taker imbalance starts to narrow and OI growth slows, watch out for a short squeeze. If you’re chasing the move down, keep your stop-loss tight so you don’t get caught by a rebound off the range low.
$HOT This drop is pretty interesting: the price fell 3%, but OI rose instead of falling—OI on 15-minute contracts gained 1.08%, and 1-hour OI is also climbing. This is a typical “new shorts entering” setup, not a long liquidation cascade; someone is actively pushing the price down.
Trading volume is 2.98x, the Z-score is 2.85, and the price broke below the lower end of the past 20 5-minute ranges. The breakdown has solid confirmation. The taker buy/sell imbalance is 12.1%, and the buy/sell ratio is 1.28, suggesting sellers are indeed in control, though there’s also decent buying support.
The anomaly percentile is 78.4%, ranking #57 across the entire pool, while notional change ranks #28—the market’s attention is shifting this way, but it’s not extremely crowded yet. 24-hour trading volume is close to 300 million, so liquidity is adequate.
My take: this “price down + OI up” combination suggests bearish momentum may persist in the short term. But if the taker imbalance starts to narrow and OI growth slows, watch out for a short squeeze. If you’re chasing the move down, keep your stop-loss tight so you don’t get caught by a rebound off the range low.
Trading volume is 2.98x, the Z-score is 2.85, and the price broke below the lower end of the past 20 5-minute ranges. The breakdown has solid confirmation. The taker buy/sell imbalance is 12.1%, and the buy/sell ratio is 1.28, suggesting sellers are indeed in control, though there’s also decent buying support.
The anomaly percentile is 78.4%, ranking #57 across the entire pool, while notional change ranks #28—the market’s attention is shifting this way, but it’s not extremely crowded yet. 24-hour trading volume is close to 300 million, so liquidity is adequate.
My take: this “price down + OI up” combination suggests bearish momentum may persist in the short term. But if the taker imbalance starts to narrow and OI growth slows, watch out for a short squeeze. If you’re chasing the move down, keep your stop-loss tight so you don’t get caught by a rebound off the range low.
5

·
--
$Q This 15m move is interesting: price is up 1.39% while OI is also rising. Perpetuals are up +0.23% on 15m and +0.31% on 1h, with notional changes of 161K and 273K USDT, respectively—more like new leveraged longs entering than shorts covering. The close has just moved above the top of the recent 20-bar 5m range. Volume is 1.69x, the taker buy/sell imbalance is 9.6%, and the buy/sell ratio is 1.21, so volume and price are reasonably well aligned. It ranks #28 for pool-wide anomalies and #25 for notional change, with an anomaly percentile of 77.2%. Not especially explosive, but it’s already ranked fairly high across the pool. 24h trading volume is 47.40M USDT. For an asset of this size to be moving like this is notable—keep an eye on whether it can hold above the top of this range; if it can’t, it’s still a false breakout.
$Q This 15m move is interesting: price is up 1.39% while OI is also rising. Perpetuals are up +0.23% on 15m and +0.31% on 1h, with notional changes of 161K and 273K USDT, respectively—more like new leveraged longs entering than shorts covering. The close has just moved above the top of the recent 20-bar 5m range. Volume is 1.69x, the taker buy/sell imbalance is 9.6%, and the buy/sell ratio is 1.21, so volume and price are reasonably well aligned. It ranks #28 for pool-wide anomalies and #25 for notional change, with an anomaly percentile of 77.2%. Not especially explosive, but it’s already ranked fairly high across the pool. 24h trading volume is 47.40M USDT. For an asset of this size to be moving like this is notable—keep an eye on whether it can hold above the top of this range; if it can’t, it’s still a false breakout.
2
·
--
$USELESS has an interesting setup: it surged 3.4% in 15m, with volume reaching 3.3 times its usual level—not a low-volume fake breakout. OI is up 0.42% over 15m and 0.55% over 1h, and notional change is keeping pace. Its anomaly percentile is 96.4%, ranking #28 across the entire pool. Price and open interest are both rising, which looks more like new leveraged longs entering than shorts covering. The aggressive trade imbalance is 14.4%, the buy/sell ratio is 1.34, and the close is still above the upper bound of the last 20 5m candles. The move has persisted for several consecutive periods near the extreme range, and depth confirms it too. With this kind of setup, it either accelerates further or gives anyone chasing the rally a rough ride.
$USELESS has an interesting setup: it surged 3.4% in 15m, with volume reaching 3.3 times its usual level—not a low-volume fake breakout. OI is up 0.42% over 15m and 0.55% over 1h, and notional change is keeping pace. Its anomaly percentile is 96.4%, ranking #28 across the entire pool. Price and open interest are both rising, which looks more like new leveraged longs entering than shorts covering. The aggressive trade imbalance is 14.4%, the buy/sell ratio is 1.34, and the close is still above the upper bound of the last 20 5m candles. The move has persisted for several consecutive periods near the extreme range, and depth confirms it too. With this kind of setup, it either accelerates further or gives anyone chasing the rally a rough ride.
2

Dany has already chosen. What about you?
Round #28: up or down over the next 10 trading sessions? It runs until midnight.
tradinglogica.com/?src=bsq&p=f28-a-dye-auto
Dany has already chosen. What about you?
Round #28: up or down over the next 10 trading sessions? It runs until midnight.
tradinglogica.com/?src=bsq&p=f28-a-dye-auto
Round #28: up or down over the next 10 trading sessions? It runs until midnight.
tradinglogica.com/?src=bsq&p=f28-a-dye-auto
117
·
--
【Alpha New Entry Monitoring Report】2026-11-02 18:00
■ Sample: Alpha Top 30 (BSC 30 + Solana 30)
■ New entries this period: 14 (BSC 14 / SOL 0)
■ Filters: Top 3 by liquidity; excludes tokens listed within the past 24 hours
━━━━━━━━━━━━━━━
▸ $TAG [BSC]
Liquidity 1.839 million
Alpha ranking #19 (New)
1h inflow list No
Smart money signal None
Overall score 1/6 · Low attention
▸ $ZEST [BSC]
Liquidity 1.592 million
Alpha ranking #28 (New)
1h inflow list No
Smart money signal None
Overall score 1/6 · Low attention
▸ $GWEI [BSC]
Liquidity 1.481 million
Alpha ranking #30 (New)
1h inflow list No
Smart money signal None
Overall score 1/6 · Low attention
━━━━━━━━━━━━━━━
This report is automatically generated and does not constitute investment advice.
#$TAG #$ZEST #$GWEI
【Alpha New Entry Monitoring Report】2026-11-02 18:00
■ Sample: Alpha Top 30 (BSC 30 + Solana 30)
■ New entries this period: 14 (BSC 14 / SOL 0)
■ Filters: Top 3 by liquidity; excludes tokens listed within the past 24 hours
━━━━━━━━━━━━━━━
▸ $TAG [BSC]
Liquidity 1.839 million
Alpha ranking #19 (New)
1h inflow list No
Smart money signal None
Overall score 1/6 · Low attention
▸ $ZEST [BSC]
Liquidity 1.592 million
Alpha ranking #28 (New)
1h inflow list No
Smart money signal None
Overall score 1/6 · Low attention
▸ $GWEI [BSC]
Liquidity 1.481 million
Alpha ranking #30 (New)
1h inflow list No
Smart money signal None
Overall score 1/6 · Low attention
━━━━━━━━━━━━━━━
This report is automatically generated and does not constitute investment advice.
#$TAG #$ZEST #$GWEI
■ Sample: Alpha Top 30 (BSC 30 + Solana 30)
■ New entries this period: 14 (BSC 14 / SOL 0)
■ Filters: Top 3 by liquidity; excludes tokens listed within the past 24 hours
━━━━━━━━━━━━━━━
▸ $TAG [BSC]
Liquidity 1.839 million
Alpha ranking #19 (New)
1h inflow list No
Smart money signal None
Overall score 1/6 · Low attention
▸ $ZEST [BSC]
Liquidity 1.592 million
Alpha ranking #28 (New)
1h inflow list No
Smart money signal None
Overall score 1/6 · Low attention
▸ $GWEI [BSC]
Liquidity 1.481 million
Alpha ranking #30 (New)
1h inflow list No
Smart money signal None
Overall score 1/6 · Low attention
━━━━━━━━━━━━━━━
This report is automatically generated and does not constitute investment advice.
#$TAG #$ZEST #$GWEI
572

·
--
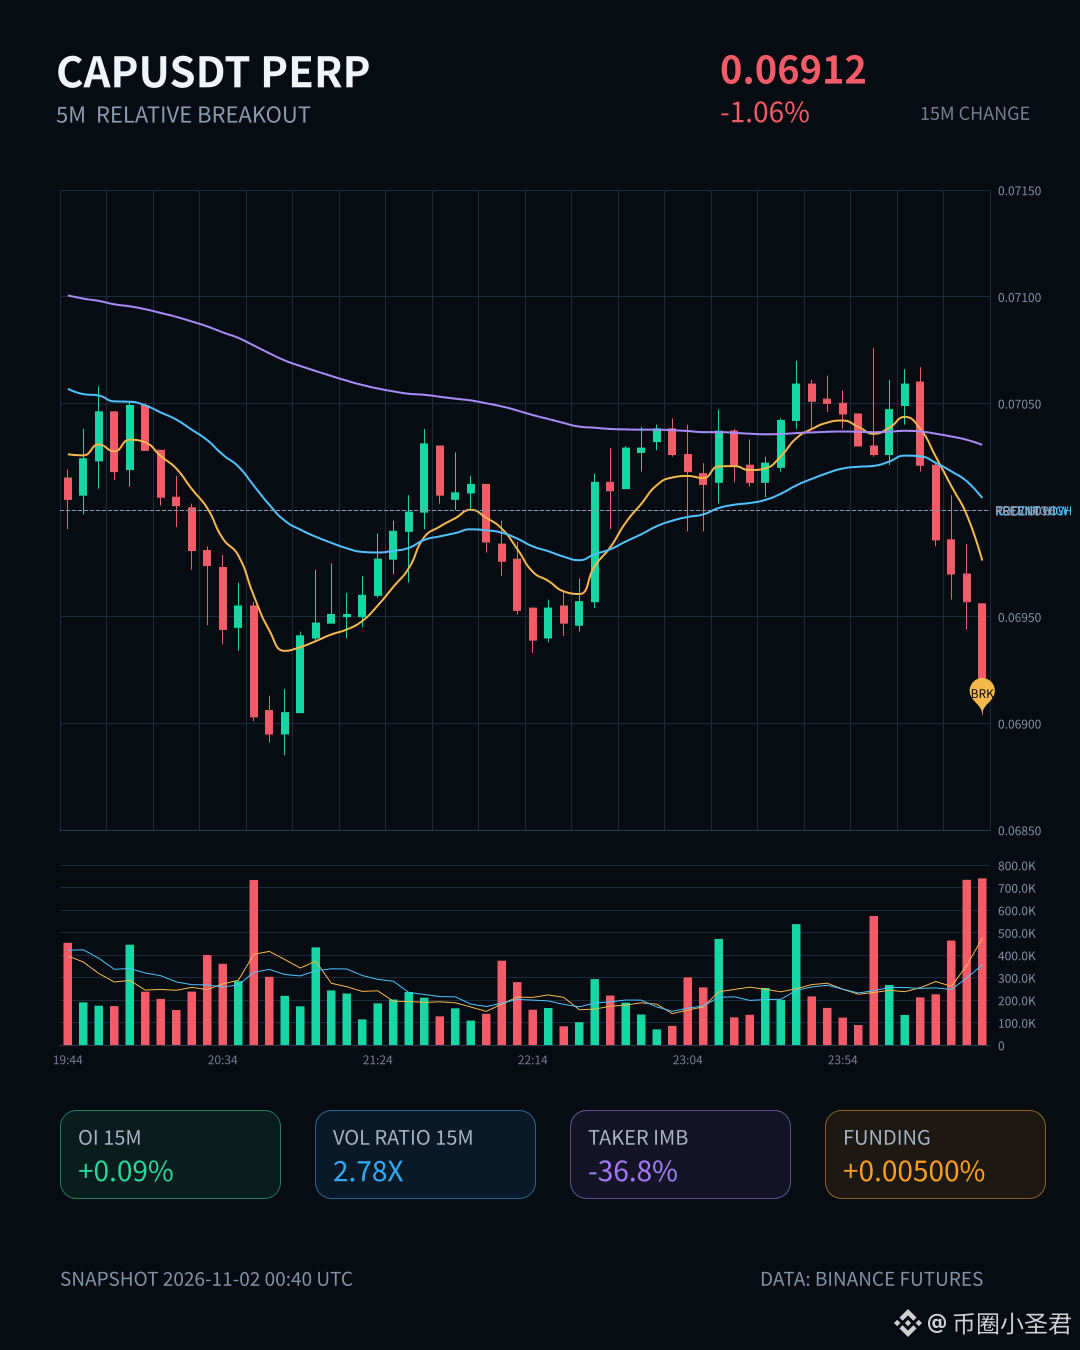
$CAP broke below the lower bound of the recent 20-candle 5m range on the 15m chart, with volume expanding to 2.78x. Aggressive trade delta was -36.8% and the buy/sell ratio was 0.46, showing clear selling pressure. But OI rose instead of falling, while notional change shrank—a sign of falling prices and leveraged shorts entering, possibly opening new short positions. The anomaly percentile is 75.2%, ranking #47 across the full pool and #28 for notional change. Not extreme, but it’s on the list. With only 14M in 24h volume, liquidity is thin—don’t casually try to catch a falling knife.
$CAP broke below the lower bound of the recent 20-candle 5m range on the 15m chart, with volume expanding to 2.78x. Aggressive trade delta was -36.8% and the buy/sell ratio was 0.46, showing clear selling pressure. But OI rose instead of falling, while notional change shrank—a sign of falling prices and leveraged shorts entering, possibly opening new short positions. The anomaly percentile is 75.2%, ranking #47 across the full pool and #28 for notional change. Not extreme, but it’s on the list. With only 14M in 24h volume, liquidity is thin—don’t casually try to catch a falling knife.
54

·
--
$EVAA This 15m move was pretty decisive: a 2.71% surge broke straight through the top of the range from the last 20 5m candles, with volume rising to 2.58x and a Z-score of 4.29. This wasn't just a fleeting wick.
OI rose along with it, up 0.14% over 15m and 0.08% over 1h. The notional change wasn't large, but the direction was consistent, suggesting new leveraged longs are driving the move rather than passive short covering. Aggressive trade imbalance was 8.3%, and the buy/sell ratio was 1.18, indicating some buying initiative.
Pool-wide anomaly rank #28, notional change rank #16, and depth all confirm the move, with volume above normal. 24h trading volume is 41M, and the pool isn't very deep. If volume doesn't follow through after a breakout at this level, it could easily turn into a false breakout and pull back. But if OI keeps building and the price holds above the range high, short-term sentiment may have further to run.
Watch how it holds on a retest of the range high; don't chase the move.
$EVAA This 15m move was pretty decisive: a 2.71% surge broke straight through the top of the range from the last 20 5m candles, with volume rising to 2.58x and a Z-score of 4.29. This wasn't just a fleeting wick.
OI rose along with it, up 0.14% over 15m and 0.08% over 1h. The notional change wasn't large, but the direction was consistent, suggesting new leveraged longs are driving the move rather than passive short covering. Aggressive trade imbalance was 8.3%, and the buy/sell ratio was 1.18, indicating some buying initiative.
Pool-wide anomaly rank #28, notional change rank #16, and depth all confirm the move, with volume above normal. 24h trading volume is 41M, and the pool isn't very deep. If volume doesn't follow through after a breakout at this level, it could easily turn into a false breakout and pull back. But if OI keeps building and the price holds above the range high, short-term sentiment may have further to run.
Watch how it holds on a retest of the range high; don't chase the move.
OI rose along with it, up 0.14% over 15m and 0.08% over 1h. The notional change wasn't large, but the direction was consistent, suggesting new leveraged longs are driving the move rather than passive short covering. Aggressive trade imbalance was 8.3%, and the buy/sell ratio was 1.18, indicating some buying initiative.
Pool-wide anomaly rank #28, notional change rank #16, and depth all confirm the move, with volume above normal. 24h trading volume is 41M, and the pool isn't very deep. If volume doesn't follow through after a breakout at this level, it could easily turn into a false breakout and pull back. But if OI keeps building and the price holds above the range high, short-term sentiment may have further to run.
Watch how it holds on a retest of the range high; don't chase the move.
2
·
--
$SOON This 15m move has some substance. A 1.58% gain isn’t huge, but volume jumped to 1.90x, with a Z-score of 3.01—usually not very active, then suddenly getting sparked to life.
The key is OI: 15m contracts are up 0.08%, or +115K notional, while the 1h reading barely moved. This structure looks more like newly opened leveraged longs pushing the short-term move, rather than a fake move from existing positions being flattened. At the 83.7th percentile for anomalies and ranked #12 across the whole pool, with notional change ranked #28, it’s not the biggest standout in the pool—but in a small pool (just 8M in 24h trading volume), this move is already hard to miss.
Price just closed above the upper end of the past 20 or so 5m candles’ range. Aggressive trade flow is 7.3%, and the buy/sell ratio is 1.16, so short-term buyers have the edge. But 1h OI hasn’t followed through, which suggests this leverage has only just come in and hasn’t built up much yet—either the move keeps accelerating, or it’s just a one-candle spike. Be cautious about chasing a move in a small-cap asset like this; don’t let an upper wick teach you a lesson.
$SOON This 15m move has some substance. A 1.58% gain isn’t huge, but volume jumped to 1.90x, with a Z-score of 3.01—usually not very active, then suddenly getting sparked to life.
The key is OI: 15m contracts are up 0.08%, or +115K notional, while the 1h reading barely moved. This structure looks more like newly opened leveraged longs pushing the short-term move, rather than a fake move from existing positions being flattened. At the 83.7th percentile for anomalies and ranked #12 across the whole pool, with notional change ranked #28, it’s not the biggest standout in the pool—but in a small pool (just 8M in 24h trading volume), this move is already hard to miss.
Price just closed above the upper end of the past 20 or so 5m candles’ range. Aggressive trade flow is 7.3%, and the buy/sell ratio is 1.16, so short-term buyers have the edge. But 1h OI hasn’t followed through, which suggests this leverage has only just come in and hasn’t built up much yet—either the move keeps accelerating, or it’s just a one-candle spike. Be cautious about chasing a move in a small-cap asset like this; don’t let an upper wick teach you a lesson.
The key is OI: 15m contracts are up 0.08%, or +115K notional, while the 1h reading barely moved. This structure looks more like newly opened leveraged longs pushing the short-term move, rather than a fake move from existing positions being flattened. At the 83.7th percentile for anomalies and ranked #12 across the whole pool, with notional change ranked #28, it’s not the biggest standout in the pool—but in a small pool (just 8M in 24h trading volume), this move is already hard to miss.
Price just closed above the upper end of the past 20 or so 5m candles’ range. Aggressive trade flow is 7.3%, and the buy/sell ratio is 1.16, so short-term buyers have the edge. But 1h OI hasn’t followed through, which suggests this leverage has only just come in and hasn’t built up much yet—either the move keeps accelerating, or it’s just a one-candle spike. Be cautious about chasing a move in a small-cap asset like this; don’t let an upper wick teach you a lesson.
10
Log in to explore more content
Join global crypto users on Binance Square
⚡️ Get latest and useful information about crypto.
💬 Trusted by the world’s largest crypto exchange.
👍 Discover real insights from verified creators.
Email / Phone number
Trending Topics
1
#XRPDropsToTwoYearLowNear87Cents
0 views
5 Discussing
2
#BitcoinFallsBelow$57KToTwoYearLow
0 views
0 Discussing
3
#NvidiaLoses$2.7TrillionInMonthAndAHalf
82 views
18 Discussing
4
#CanBTCReboundAfterFallingBelow60K?
477,933 views
2,117 Discussing
5
#GlobalStocksFaceLongestLosingStreakSince2023
164,781 views
1,485 Discussing
6
#BlackRockIBITPostsRecord$541MSingleDayOutflow
7,371 views
47 Discussing
7
#AnthropicPlungesTowardIPOPriceonDay2
78,782 views
848 Discussing
8
#TwentyOneCapitalAdds172.25BTC
30,258 views
374 Discussing
9
#HKBillWouldExcludeTokenizedDepositsFromVirtualAssets
2,974 views
39 Discussing
10
#BNBDropsBelow540USDTWith8.46%DailyDecline
46,202 views
429 Discussing