
#22
22
18,620 views
289 Discussing
Hot
Latest

·
--
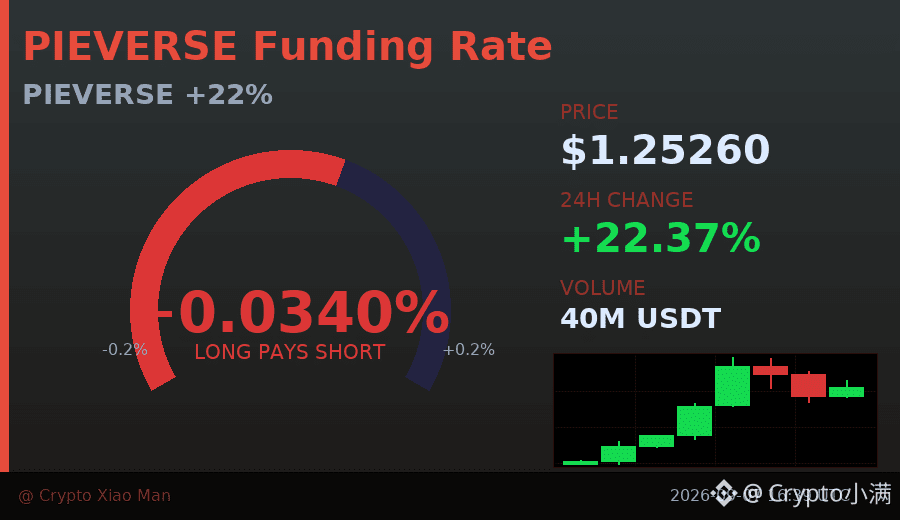
22% rise in price, but the funding rate has already spiked to 0.034%—is this a real breakthrough, or are the longs just too crowded?
PIEVERSE’s trading volume hit 40 million USDT today; in just 8 hours it kept strengthening, climbing from 1.02 to a high of 1.32.
However, the long-to-short ratio is now 48% to 52%, with shorts slightly in the lead. Add the high funding rate, and the risk of chasing longs isn’t small.
I lean toward waiting for the funding rate to pull back, and only then watching after the price holds above 1.25.
In this kind of sharp surge, it’s better to miss the first wave than to become a bag-holder.
$PIEVERSE #资金费率预警 #22%
Click the small card below to quickly check the market 👇
22% rise in price, but the funding rate has already spiked to 0.034%—is this a real breakthrough, or are the longs just too crowded?
PIEVERSE’s trading volume hit 40 million USDT today; in just 8 hours it kept strengthening, climbing from 1.02 to a high of 1.32.
However, the long-to-short ratio is now 48% to 52%, with shorts slightly in the lead. Add the high funding rate, and the risk of chasing longs isn’t small.
I lean toward waiting for the funding rate to pull back, and only then watching after the price holds above 1.25.
In this kind of sharp surge, it’s better to miss the first wave than to become a bag-holder.
$PIEVERSE #资金费率预警 #22%
Click the small card below to quickly check the market 👇
PIEVERSE’s trading volume hit 40 million USDT today; in just 8 hours it kept strengthening, climbing from 1.02 to a high of 1.32.
However, the long-to-short ratio is now 48% to 52%, with shorts slightly in the lead. Add the high funding rate, and the risk of chasing longs isn’t small.
I lean toward waiting for the funding rate to pull back, and only then watching after the price holds above 1.25.
In this kind of sharp surge, it’s better to miss the first wave than to become a bag-holder.
$PIEVERSE #资金费率预警 #22%
Click the small card below to quickly check the market 👇
53

·
--
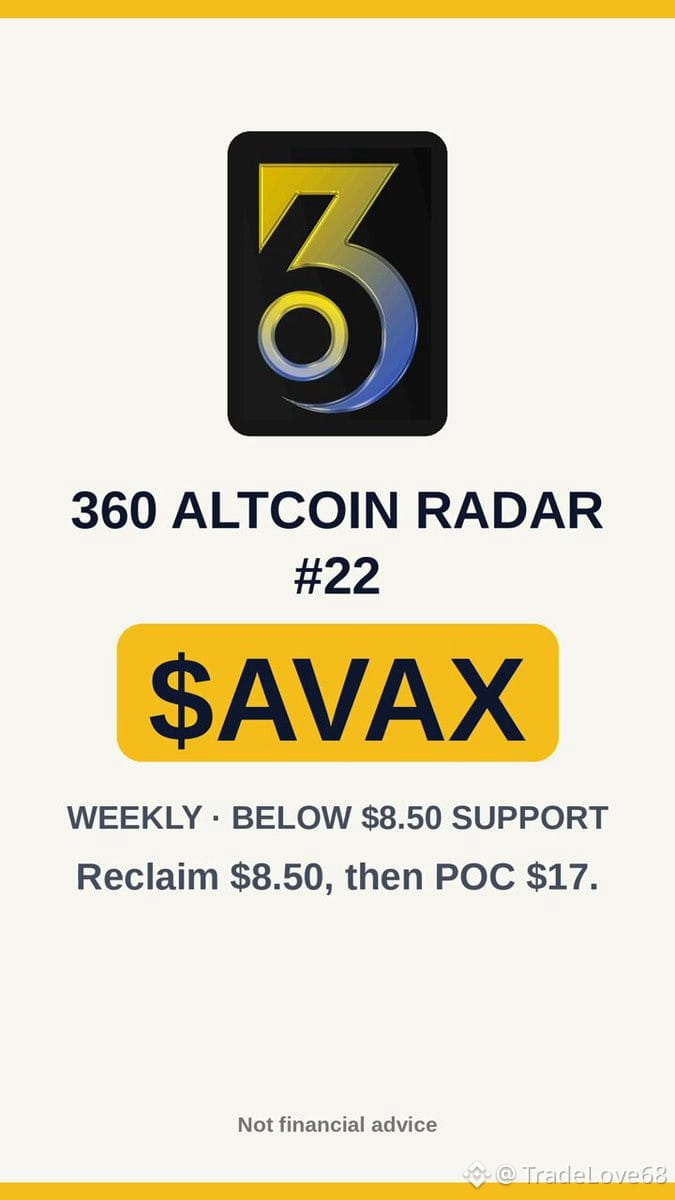
$AVAX is on 360 Altcoin Radar #22. You asked for it.
Weekly chart: well below the $17 POC and under $8.50 support. It’s heading into the sixes, with price around $7.13.
To reverse, AVAX needs to reclaim $8.50. That could set up a decent bottom, followed by a quick move back toward $17.
Right now, it’s waiting on…
$AVAX is on 360 Altcoin Radar #22. You asked for it.
Weekly chart: well below the $17 POC and under $8.50 support. It’s heading into the sixes, with price around $7.13.
To reverse, AVAX needs to reclaim $8.50. That could set up a decent bottom, followed by a quick move back toward $17.
Right now, it’s waiting on…
Weekly chart: well below the $17 POC and under $8.50 support. It’s heading into the sixes, with price around $7.13.
To reverse, AVAX needs to reclaim $8.50. That could set up a decent bottom, followed by a quick move back toward $17.
Right now, it’s waiting on…
KYFKON:
SUBHAN ALLAH 🌟 JAZAK ALLAH 🌟
2
3
1.3k

📚 TRADING LESSON #22 — News trading — don't chase the pump
Big news pumps a coin in minutes — and by the time you see it on social media, the smart money is already selling into your buy. Chasing news pumps is buying someone else's exit. If you trade news, wait for the first pullback and a real setup. Otherwise, let it go. The market will give you another chance — it always does.
❓ Do you trade the news or wait for setups?
🔔 Follow Inam Pro Trader — a new lesson every day.
📅 17 Nov 2026
#LearnTrading #NewsTrading #TradingTips
📚 TRADING LESSON #22 — News trading — don't chase the pump
Big news pumps a coin in minutes — and by the time you see it on social media, the smart money is already selling into your buy. Chasing news pumps is buying someone else's exit. If you trade news, wait for the first pullback and a real setup. Otherwise, let it go. The market will give you another chance — it always does.
❓ Do you trade the news or wait for setups?
🔔 Follow Inam Pro Trader — a new lesson every day.
📅 17 Nov 2026
#LearnTrading #NewsTrading #TradingTips
Big news pumps a coin in minutes — and by the time you see it on social media, the smart money is already selling into your buy. Chasing news pumps is buying someone else's exit. If you trade news, wait for the first pullback and a real setup. Otherwise, let it go. The market will give you another chance — it always does.
❓ Do you trade the news or wait for setups?
🔔 Follow Inam Pro Trader — a new lesson every day.
📅 17 Nov 2026
#LearnTrading #NewsTrading #TradingTips
1

·
--
$NEAR just lost a floor it held for eight days. Fifteen straight hourly closes under $3.69, and it's sitting at $3.44, down 9.1% in 24 hours.
The line was real. $3.69 was the Nov 4 daily low, the level the market had mapped as support all week. Two days ago the coin even took its ceiling back for one hour — the Nov 11 11:00 UTC close printed $3.787, above the $3.756 line — then gave it straight back the next hour.
Then the floor went. 21:00 UTC last night: first close under $3.69 at $3.672. 22:00: $3.601. 23:00: $3.586 on 2.15 million NEAR, the biggest bar of the leg. Since then it's been a grind, not a bounce — every hourly close under the line, fresh 24h low $3.422 today.
The chart agrees: RSI 31, price under EMA20 $3.55 and EMA50 $3.60, resistance $3.815, support $3.422. Rank #22, $4.5B market cap, down 14% this week and 31% this month, 83% off the $20.44 all-time high. Fully circulating — no unlock overhang, so this isn't a supply story.
No fresh NEAR headline either. The driver is the board: BTC printed a fresh low at $72,789. NEAR is just running about 7x BTC's daily loss.
The other side: RSI 31 is where flushes bounce hard, and one hourly close back above $3.69 unwrites the whole chapter. Below, the next shelf is $3.403 — the Sep 19 low, two cents under today's low — then air down to $3.06.
Not a call. A floor breaking on fifteen closes is a fact, not a forecast.
Does $3.40 hold, or are the September levels coming back into play?
$NEAR just lost a floor it held for eight days. Fifteen straight hourly closes under $3.69, and it's sitting at $3.44, down 9.1% in 24 hours.
The line was real. $3.69 was the Nov 4 daily low, the level the market had mapped as support all week. Two days ago the coin even took its ceiling back for one hour — the Nov 11 11:00 UTC close printed $3.787, above the $3.756 line — then gave it straight back the next hour.
Then the floor went. 21:00 UTC last night: first close under $3.69 at $3.672. 22:00: $3.601. 23:00: $3.586 on 2.15 million NEAR, the biggest bar of the leg. Since then it's been a grind, not a bounce — every hourly close under the line, fresh 24h low $3.422 today.
The chart agrees: RSI 31, price under EMA20 $3.55 and EMA50 $3.60, resistance $3.815, support $3.422. Rank #22, $4.5B market cap, down 14% this week and 31% this month, 83% off the $20.44 all-time high. Fully circulating — no unlock overhang, so this isn't a supply story.
No fresh NEAR headline either. The driver is the board: BTC printed a fresh low at $72,789. NEAR is just running about 7x BTC's daily loss.
The other side: RSI 31 is where flushes bounce hard, and one hourly close back above $3.69 unwrites the whole chapter. Below, the next shelf is $3.403 — the Sep 19 low, two cents under today's low — then air down to $3.06.
Not a call. A floor breaking on fifteen closes is a fact, not a forecast.
Does $3.40 hold, or are the September levels coming back into play?
The line was real. $3.69 was the Nov 4 daily low, the level the market had mapped as support all week. Two days ago the coin even took its ceiling back for one hour — the Nov 11 11:00 UTC close printed $3.787, above the $3.756 line — then gave it straight back the next hour.
Then the floor went. 21:00 UTC last night: first close under $3.69 at $3.672. 22:00: $3.601. 23:00: $3.586 on 2.15 million NEAR, the biggest bar of the leg. Since then it's been a grind, not a bounce — every hourly close under the line, fresh 24h low $3.422 today.
The chart agrees: RSI 31, price under EMA20 $3.55 and EMA50 $3.60, resistance $3.815, support $3.422. Rank #22, $4.5B market cap, down 14% this week and 31% this month, 83% off the $20.44 all-time high. Fully circulating — no unlock overhang, so this isn't a supply story.
No fresh NEAR headline either. The driver is the board: BTC printed a fresh low at $72,789. NEAR is just running about 7x BTC's daily loss.
The other side: RSI 31 is where flushes bounce hard, and one hourly close back above $3.69 unwrites the whole chapter. Below, the next shelf is $3.403 — the Sep 19 low, two cents under today's low — then air down to $3.06.
Not a call. A floor breaking on fifteen closes is a fact, not a forecast.
Does $3.40 hold, or are the September levels coming back into play?
78

NOVEMBER SESSION | SIGNAL #22
📊#ACT/USDT
🔼LONG
😮Entry : 0.1050
💡Leverage : 10X to 50X
💵Targets : 0.11 - 0.12 - 0.13
⚠️SL : 0.098
Use 2% Of Your Future Fund 🤝
NOVEMBER SESSION | SIGNAL #22
📊#ACT/USDT
🔼LONG
😮Entry : 0.1050
💡Leverage : 10X to 50X
💵Targets : 0.11 - 0.12 - 0.13
⚠️SL : 0.098
Use 2% Of Your Future Fund 🤝
📊#ACT/USDT
🔼LONG
😮Entry : 0.1050
💡Leverage : 10X to 50X
💵Targets : 0.11 - 0.12 - 0.13
⚠️SL : 0.098
Use 2% Of Your Future Fund 🤝
169

·
--
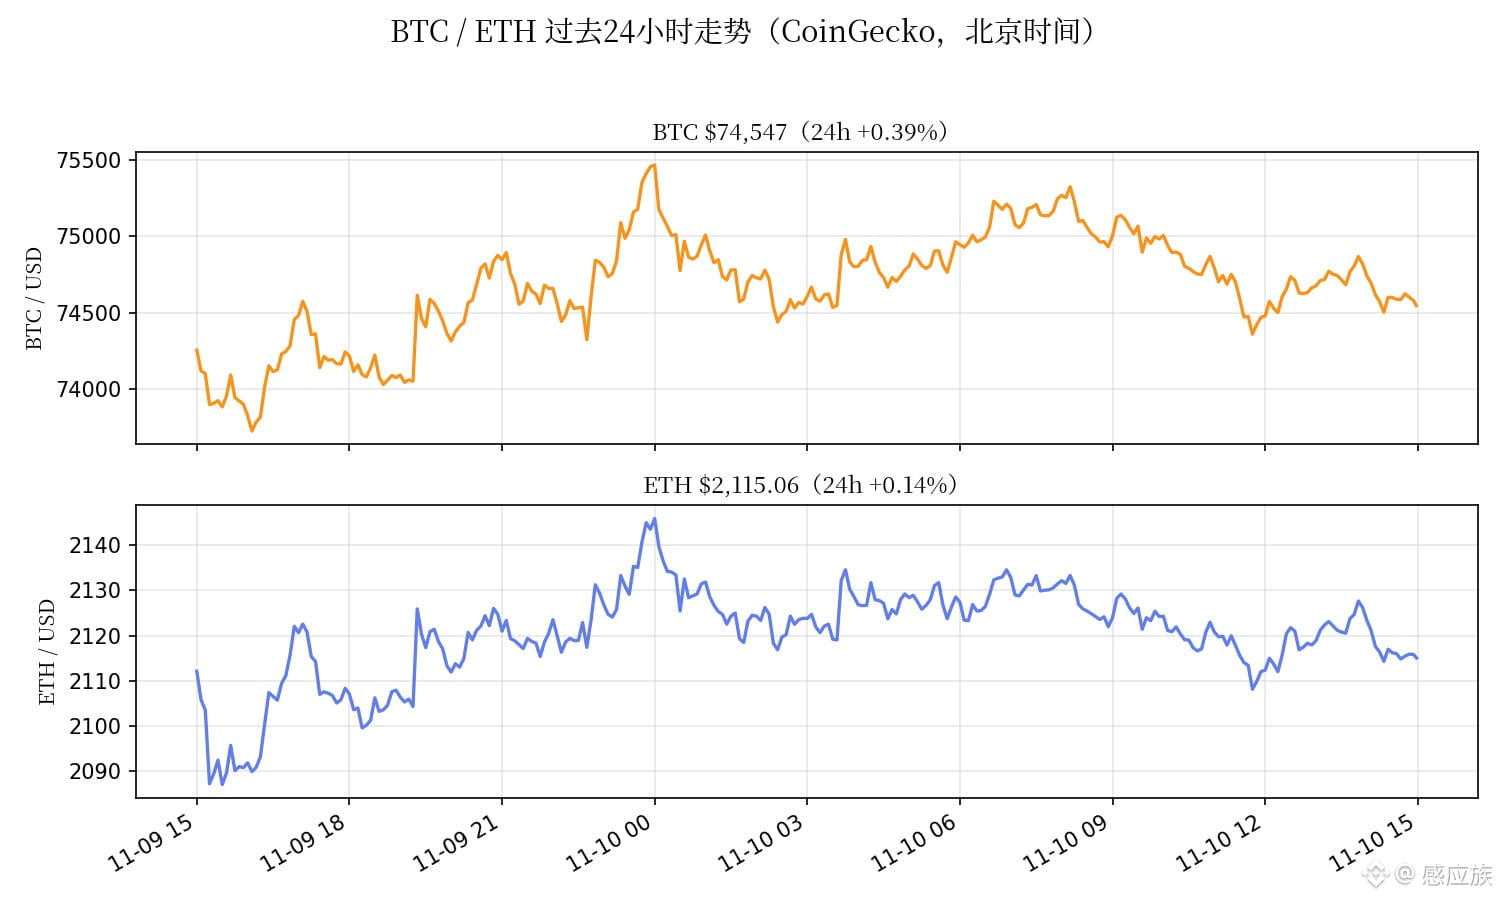
What are derivatives markets saying six and a half hours before CPI? At 15:00, $BTC was about $74,547, up 0.4% over 24 hours; $ETH was about $2,115, up 0.1% over 24 hours (actual CoinGecko data). The 24-hour BTC range was $73,828–$75,465. Price remains pinned below $75,000. If the 16:00 four-hour candle also closes below $75,000, that will make nine consecutive candles.
First, derivatives positioning (CoinGlass/defirate, this morning’s data): BTC perpetual funding rates were about 0.008–0.010% per 8 hours, or around 10% annualized; longs are still paying shorts. Open interest in perpetuals was about $52 billion, still elevated. Total liquidations across the market over the past 24 hours were about $269 million, with more than 60% from longs. The biggest short liquidation cluster on the liquidation heatmap is at $75,696 (about $87.2 million), and the biggest long liquidation cluster is at $73,469 (about $70.8 million). Liquidation orders are stacked on both sides. My first target, $73,200, sits right below the lower cluster, while there’s another cluster above my invalidation level of $76,250.
In plain English: price has fallen, but the bulls haven’t surrendered. Funding is still positive, open interest hasn’t fallen much, and traders are still paying to hold their ground. This is the most grinding kind of setup ahead of CPI: once the data comes out, whichever side gets liquidated first could send the other side moving faster.
Short position update #22: I opened the short on November 7 at 13:00 between $75,800 and $76,100, with a midpoint entry of $75,950. The current price is $74,547, down 1.85%; on 100x margin, that’s an unrealized gain of about +185%—up from +170% at 13:00. The add-on short opened between $74,700 and $75,000, with a midpoint entry of $74,850, is now up about +41%, versus +25% at 13:00. Honestly, this trade is in profit right now. The $77,500 stop-loss and the invalidation level at a four-hour close above $76,250 have not been hit, so I’m holding. Targets remain $73,200 (take half off there first) and $68,000. Spot BTC ETFs saw another net outflow of about $201 million on Monday (Farside data, reported by CryptoTimes); money is still flowing out.
U.S. October CPI is out tonight at 21:30. Core CPI is expected to rise 0.2% month over month. I won’t trade during the hour before or after the release (20:30–22:30). Hotter than expected (core >0.3%) → $75,000 probably won’t hold, and the $73,200 target will be right in sight. Cooler than expected (≤0.1%) → first watch for a rebound to $75,500–$76,250; that’s still my short-add zone, not a spot to flip long. The plan hasn’t changed: keep holding the short; use only a very small portion of total capital as 100x margin. HYPE is trending, AVAX is up 7.4% in a day, and INIT is up 79% in a day (with a market cap of only about $50 million). I treat small caps only as a sentiment gauge and don’t touch them.
The bulls are still paying funding to hold their ground ahead of CPI. Do you think we’ll hit $73,200 first tonight, or bounce back to $75,500 first? Let’s talk in the comments. (Prices: actual CoinGecko data at 15:00 Beijing time on November 10; chart shows the past 24 hours.)
What are derivatives markets saying six and a half hours before CPI? At 15:00, $BTC was about $74,547, up 0.4% over 24 hours; $ETH was about $2,115, up 0.1% over 24 hours (actual CoinGecko data). The 24-hour BTC range was $73,828–$75,465. Price remains pinned below $75,000. If the 16:00 four-hour candle also closes below $75,000, that will make nine consecutive candles.
First, derivatives positioning (CoinGlass/defirate, this morning’s data): BTC perpetual funding rates were about 0.008–0.010% per 8 hours, or around 10% annualized; longs are still paying shorts. Open interest in perpetuals was about $52 billion, still elevated. Total liquidations across the market over the past 24 hours were about $269 million, with more than 60% from longs. The biggest short liquidation cluster on the liquidation heatmap is at $75,696 (about $87.2 million), and the biggest long liquidation cluster is at $73,469 (about $70.8 million). Liquidation orders are stacked on both sides. My first target, $73,200, sits right below the lower cluster, while there’s another cluster above my invalidation level of $76,250.
In plain English: price has fallen, but the bulls haven’t surrendered. Funding is still positive, open interest hasn’t fallen much, and traders are still paying to hold their ground. This is the most grinding kind of setup ahead of CPI: once the data comes out, whichever side gets liquidated first could send the other side moving faster.
Short position update #22: I opened the short on November 7 at 13:00 between $75,800 and $76,100, with a midpoint entry of $75,950. The current price is $74,547, down 1.85%; on 100x margin, that’s an unrealized gain of about +185%—up from +170% at 13:00. The add-on short opened between $74,700 and $75,000, with a midpoint entry of $74,850, is now up about +41%, versus +25% at 13:00. Honestly, this trade is in profit right now. The $77,500 stop-loss and the invalidation level at a four-hour close above $76,250 have not been hit, so I’m holding. Targets remain $73,200 (take half off there first) and $68,000. Spot BTC ETFs saw another net outflow of about $201 million on Monday (Farside data, reported by CryptoTimes); money is still flowing out.
U.S. October CPI is out tonight at 21:30. Core CPI is expected to rise 0.2% month over month. I won’t trade during the hour before or after the release (20:30–22:30). Hotter than expected (core >0.3%) → $75,000 probably won’t hold, and the $73,200 target will be right in sight. Cooler than expected (≤0.1%) → first watch for a rebound to $75,500–$76,250; that’s still my short-add zone, not a spot to flip long. The plan hasn’t changed: keep holding the short; use only a very small portion of total capital as 100x margin. HYPE is trending, AVAX is up 7.4% in a day, and INIT is up 79% in a day (with a market cap of only about $50 million). I treat small caps only as a sentiment gauge and don’t touch them.
The bulls are still paying funding to hold their ground ahead of CPI. Do you think we’ll hit $73,200 first tonight, or bounce back to $75,500 first? Let’s talk in the comments. (Prices: actual CoinGecko data at 15:00 Beijing time on November 10; chart shows the past 24 hours.)
First, derivatives positioning (CoinGlass/defirate, this morning’s data): BTC perpetual funding rates were about 0.008–0.010% per 8 hours, or around 10% annualized; longs are still paying shorts. Open interest in perpetuals was about $52 billion, still elevated. Total liquidations across the market over the past 24 hours were about $269 million, with more than 60% from longs. The biggest short liquidation cluster on the liquidation heatmap is at $75,696 (about $87.2 million), and the biggest long liquidation cluster is at $73,469 (about $70.8 million). Liquidation orders are stacked on both sides. My first target, $73,200, sits right below the lower cluster, while there’s another cluster above my invalidation level of $76,250.
In plain English: price has fallen, but the bulls haven’t surrendered. Funding is still positive, open interest hasn’t fallen much, and traders are still paying to hold their ground. This is the most grinding kind of setup ahead of CPI: once the data comes out, whichever side gets liquidated first could send the other side moving faster.
Short position update #22: I opened the short on November 7 at 13:00 between $75,800 and $76,100, with a midpoint entry of $75,950. The current price is $74,547, down 1.85%; on 100x margin, that’s an unrealized gain of about +185%—up from +170% at 13:00. The add-on short opened between $74,700 and $75,000, with a midpoint entry of $74,850, is now up about +41%, versus +25% at 13:00. Honestly, this trade is in profit right now. The $77,500 stop-loss and the invalidation level at a four-hour close above $76,250 have not been hit, so I’m holding. Targets remain $73,200 (take half off there first) and $68,000. Spot BTC ETFs saw another net outflow of about $201 million on Monday (Farside data, reported by CryptoTimes); money is still flowing out.
U.S. October CPI is out tonight at 21:30. Core CPI is expected to rise 0.2% month over month. I won’t trade during the hour before or after the release (20:30–22:30). Hotter than expected (core >0.3%) → $75,000 probably won’t hold, and the $73,200 target will be right in sight. Cooler than expected (≤0.1%) → first watch for a rebound to $75,500–$76,250; that’s still my short-add zone, not a spot to flip long. The plan hasn’t changed: keep holding the short; use only a very small portion of total capital as 100x margin. HYPE is trending, AVAX is up 7.4% in a day, and INIT is up 79% in a day (with a market cap of only about $50 million). I treat small caps only as a sentiment gauge and don’t touch them.
The bulls are still paying funding to hold their ground ahead of CPI. Do you think we’ll hit $73,200 first tonight, or bounce back to $75,500 first? Let’s talk in the comments. (Prices: actual CoinGecko data at 15:00 Beijing time on November 10; chart shows the past 24 hours.)
125


·
--
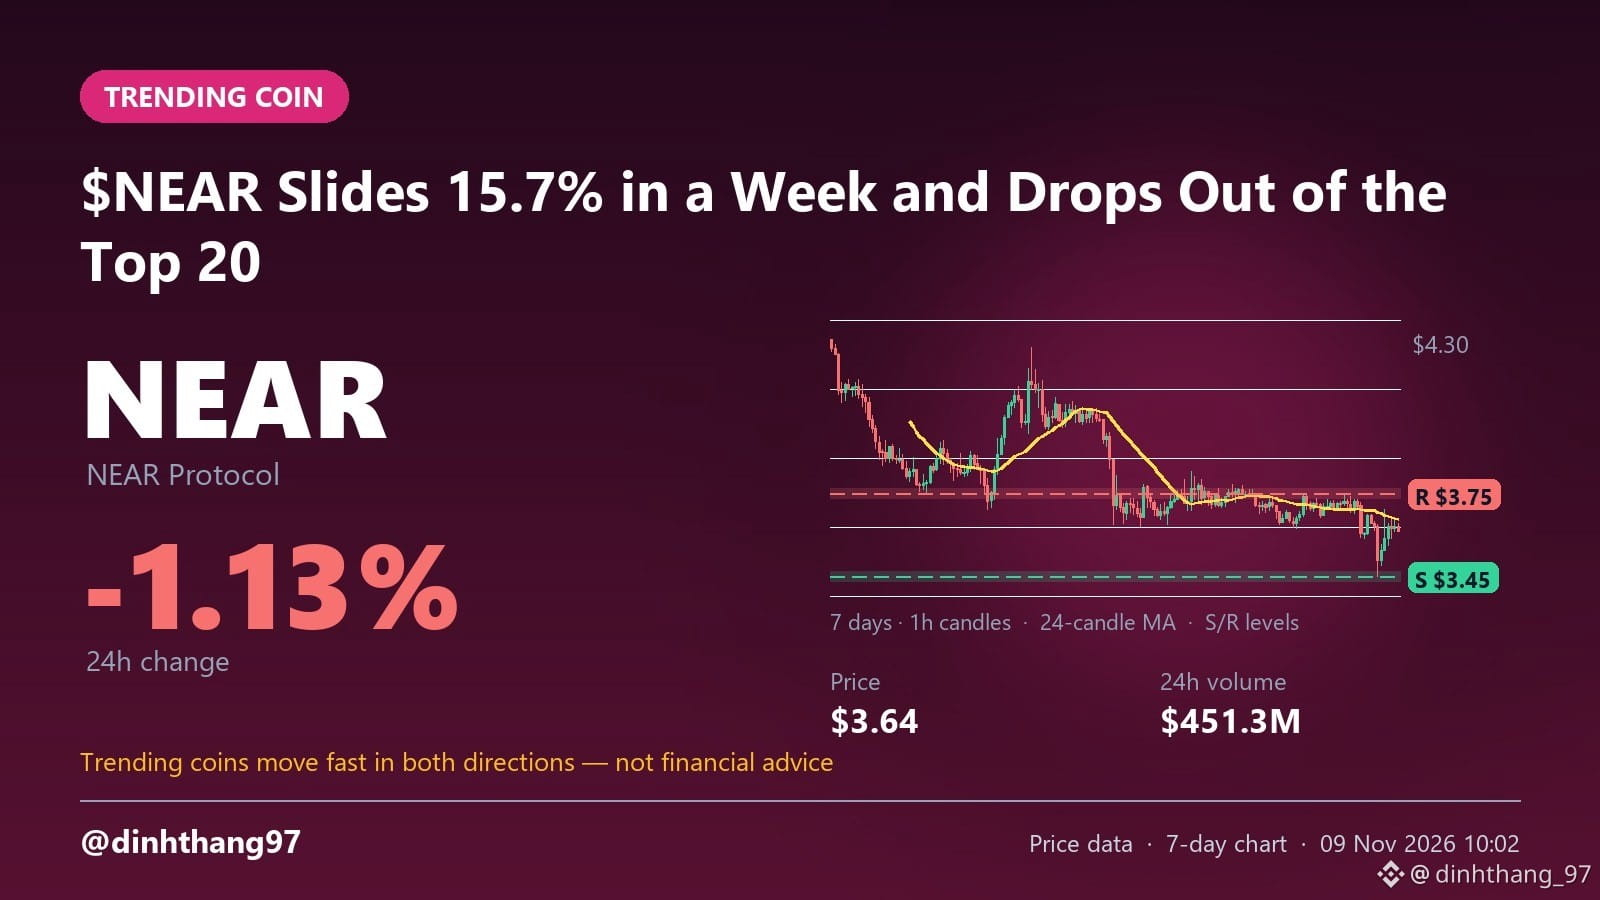
$NEAR Slides 15.7% in a Week and Drops Out of the Top 20
NEAR looks weak even on good news.
✅ Governance passed HSP-029 with about 99.9% support, alongside a plan to cut token issuance
❌ -15.7% in 7 days to $3.63 after an almost 9% drop on Nov 3
❌ Now ranked #22 after falling out of the top 20
❌ The $3.446 weekly low is only 5% away
My call: another test of $3.446 while NEAR stays below $3.746. Not financial advice, DYOR.
$NEAR
$NEAR Slides 15.7% in a Week and Drops Out of the Top 20
NEAR looks weak even on good news.
✅ Governance passed HSP-029 with about 99.9% support, alongside a plan to cut token issuance
❌ -15.7% in 7 days to $3.63 after an almost 9% drop on Nov 3
❌ Now ranked #22 after falling out of the top 20
❌ The $3.446 weekly low is only 5% away
My call: another test of $3.446 while NEAR stays below $3.746. Not financial advice, DYOR.
$NEAR
NEAR looks weak even on good news.
✅ Governance passed HSP-029 with about 99.9% support, alongside a plan to cut token issuance
❌ -15.7% in 7 days to $3.63 after an almost 9% drop on Nov 3
❌ Now ranked #22 after falling out of the top 20
❌ The $3.446 weekly low is only 5% away
My call: another test of $3.446 while NEAR stays below $3.746. Not financial advice, DYOR.
$NEAR
276

·
--
【Alpha New Entry Monitoring Report】2026-11-07 18:00
■ Sample: Alpha Top 30 (BSC 30 + Solana 30)
■ New entries this period: 16 (BSC 16 / SOL 0)
■ Filter criteria: Top 3 by liquidity; exclude tokens launched within the past 24h
━━━━━━━━━━━━━━━
▸ $SIREN [BSC]
Liquidity 3.069 million
Alpha rank #13 (New)
1h inflow list No
Smart money signal None
Overall score 1/6 · Low attention
▸ $ZEST [BSC]
Liquidity 1.497 million
Alpha rank #28 (New)
1h inflow list No
Smart money signal None
Overall score 1/6 · Low attention
▸ $NES [BSC]
Liquidity 1.135 million
Alpha rank #22 (New)
1h inflow list No
Smart money signal None
Overall score 1/6 · Low attention
━━━━━━━━━━━━━━━
This report was automatically generated and does not constitute investment advice.
#$SIREN #$ZEST #$NES
【Alpha New Entry Monitoring Report】2026-11-07 18:00
■ Sample: Alpha Top 30 (BSC 30 + Solana 30)
■ New entries this period: 16 (BSC 16 / SOL 0)
■ Filter criteria: Top 3 by liquidity; exclude tokens launched within the past 24h
━━━━━━━━━━━━━━━
▸ $SIREN [BSC]
Liquidity 3.069 million
Alpha rank #13 (New)
1h inflow list No
Smart money signal None
Overall score 1/6 · Low attention
▸ $ZEST [BSC]
Liquidity 1.497 million
Alpha rank #28 (New)
1h inflow list No
Smart money signal None
Overall score 1/6 · Low attention
▸ $NES [BSC]
Liquidity 1.135 million
Alpha rank #22 (New)
1h inflow list No
Smart money signal None
Overall score 1/6 · Low attention
━━━━━━━━━━━━━━━
This report was automatically generated and does not constitute investment advice.
#$SIREN #$ZEST #$NES
■ Sample: Alpha Top 30 (BSC 30 + Solana 30)
■ New entries this period: 16 (BSC 16 / SOL 0)
■ Filter criteria: Top 3 by liquidity; exclude tokens launched within the past 24h
━━━━━━━━━━━━━━━
▸ $SIREN [BSC]
Liquidity 3.069 million
Alpha rank #13 (New)
1h inflow list No
Smart money signal None
Overall score 1/6 · Low attention
▸ $ZEST [BSC]
Liquidity 1.497 million
Alpha rank #28 (New)
1h inflow list No
Smart money signal None
Overall score 1/6 · Low attention
▸ $NES [BSC]
Liquidity 1.135 million
Alpha rank #22 (New)
1h inflow list No
Smart money signal None
Overall score 1/6 · Low attention
━━━━━━━━━━━━━━━
This report was automatically generated and does not constitute investment advice.
#$SIREN #$ZEST #$NES
230

·
--
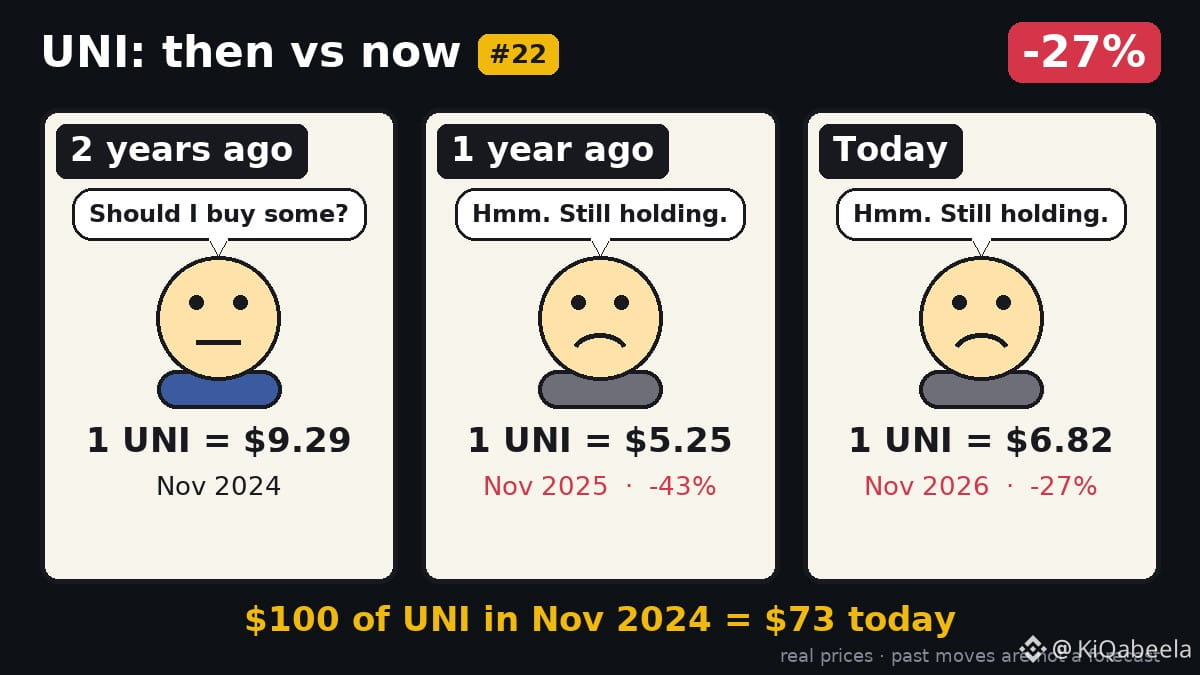
$100 -> $73: UNI since Nov 2024.
A $100 stash bought on 2024‑11‑06 would sit at $73 today – a 27% dip from its peak of $9.29. The token’s daily close slid from $9.29 two years ago to $6.82 now, trimming early gains.
Past moves say nothing about the next ones.
💬 Holder? UNI ThenNow
🎨 Then vs Now #22 · a new one every morning
$UNI
#UNI #ThenNow
$100 -> $73: UNI since Nov 2024.
A $100 stash bought on 2024‑11‑06 would sit at $73 today – a 27% dip from its peak of $9.29. The token’s daily close slid from $9.29 two years ago to $6.82 now, trimming early gains.
Past moves say nothing about the next ones.
💬 Holder? UNI ThenNow
🎨 Then vs Now #22 · a new one every morning
$UNI
#UNI #ThenNow
A $100 stash bought on 2024‑11‑06 would sit at $73 today – a 27% dip from its peak of $9.29. The token’s daily close slid from $9.29 two years ago to $6.82 now, trimming early gains.
Past moves say nothing about the next ones.
💬 Holder? UNI ThenNow
🎨 Then vs Now #22 · a new one every morning
$UNI
#UNI #ThenNow
7

·
--
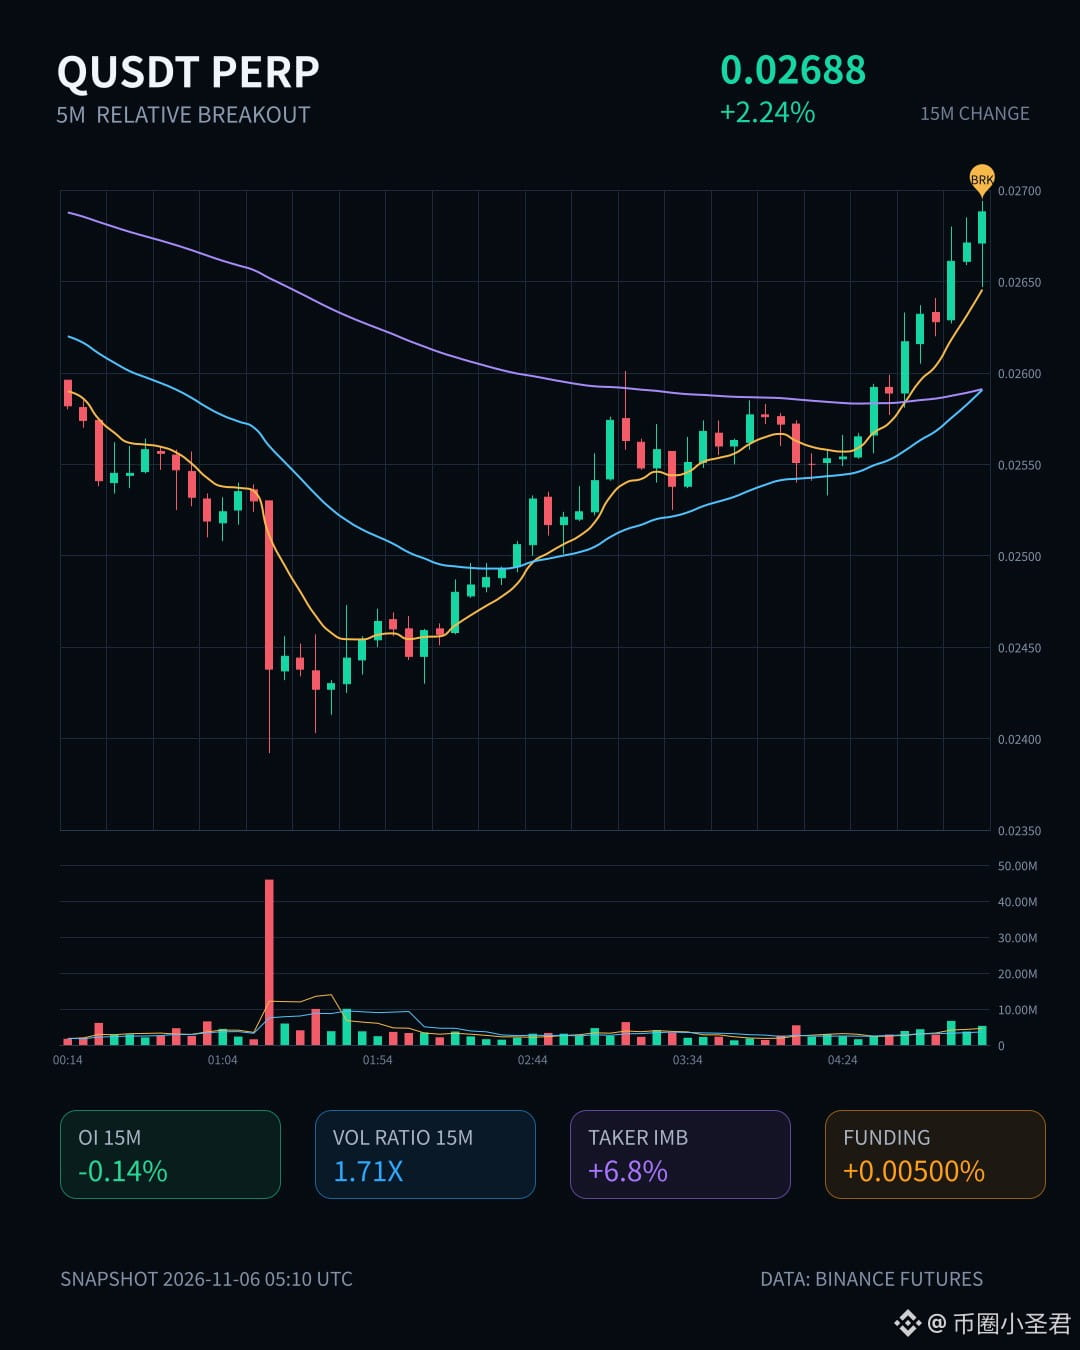
$Q is up 2.24% over 15m, with volume at 1.71x. Price has moved above the top of the recent 20-candle 5m range—but OI is falling: -0.14% over 15m and -0.19% over 1h. Rising price and declining open interest point to a classic short-covering rally, not fresh longs entering.
The active buy/sell delta is 6.8%, and the buy/sell ratio is 1.15, so buyers do have the edge. But without OI backing it up, this looks more like a squeeze-driven bounce than the start of a trend. OI's anomaly percentile is 80.2%, ranking #22 across the pool, which suggests this short-covering move is relatively strong. Worth watching to see whether it can turn into a genuine breakout.
24h trading volume is only a little over 21M, and liquidity is average. Don't chase the price—wait for a pullback and confirmation.
$Q is up 2.24% over 15m, with volume at 1.71x. Price has moved above the top of the recent 20-candle 5m range—but OI is falling: -0.14% over 15m and -0.19% over 1h. Rising price and declining open interest point to a classic short-covering rally, not fresh longs entering.
The active buy/sell delta is 6.8%, and the buy/sell ratio is 1.15, so buyers do have the edge. But without OI backing it up, this looks more like a squeeze-driven bounce than the start of a trend. OI's anomaly percentile is 80.2%, ranking #22 across the pool, which suggests this short-covering move is relatively strong. Worth watching to see whether it can turn into a genuine breakout.
24h trading volume is only a little over 21M, and liquidity is average. Don't chase the price—wait for a pullback and confirmation.
The active buy/sell delta is 6.8%, and the buy/sell ratio is 1.15, so buyers do have the edge. But without OI backing it up, this looks more like a squeeze-driven bounce than the start of a trend. OI's anomaly percentile is 80.2%, ranking #22 across the pool, which suggests this short-covering move is relatively strong. Worth watching to see whether it can turn into a genuine breakout.
24h trading volume is only a little over 21M, and liquidity is average. Don't chase the price—wait for a pullback and confirmation.
11

·
--
$DOT This 15m sell-off was pretty decisive: volume surged to 4.74x, while the price fell 1.1%, the taker flow imbalance hit -34.8%, and the buy/sell ratio was 0.48—sellers were clearly in control. The closing price broke below the lower bound of the past 20 5m ranges, breaking through the short-term structure.
What’s interesting is OI: it rose just 0.08% over 15m and +0.38% over 1h, while notional open interest is still shrinking. That suggests this wasn’t a passive drop caused by liquidations of existing longs; it looks more like new shorts entering in batches with leverage. The anomaly percentile is 64.9%, ranked #22 across the whole pool—not the most extreme, but definitely conspicuous.
24h trading volume is 55.68M, and depth has been confirmed. With volume and price action aligned like this, I’m in no hurry to buy the dip. I’ll wait for bearish momentum to fade or for OI to diverge before making a move.
$DOT This 15m sell-off was pretty decisive: volume surged to 4.74x, while the price fell 1.1%, the taker flow imbalance hit -34.8%, and the buy/sell ratio was 0.48—sellers were clearly in control. The closing price broke below the lower bound of the past 20 5m ranges, breaking through the short-term structure.
What’s interesting is OI: it rose just 0.08% over 15m and +0.38% over 1h, while notional open interest is still shrinking. That suggests this wasn’t a passive drop caused by liquidations of existing longs; it looks more like new shorts entering in batches with leverage. The anomaly percentile is 64.9%, ranked #22 across the whole pool—not the most extreme, but definitely conspicuous.
24h trading volume is 55.68M, and depth has been confirmed. With volume and price action aligned like this, I’m in no hurry to buy the dip. I’ll wait for bearish momentum to fade or for OI to diverge before making a move.
What’s interesting is OI: it rose just 0.08% over 15m and +0.38% over 1h, while notional open interest is still shrinking. That suggests this wasn’t a passive drop caused by liquidations of existing longs; it looks more like new shorts entering in batches with leverage. The anomaly percentile is 64.9%, ranked #22 across the whole pool—not the most extreme, but definitely conspicuous.
24h trading volume is 55.68M, and depth has been confirmed. With volume and price action aligned like this, I’m in no hurry to buy the dip. I’ll wait for bearish momentum to fade or for OI to diverge before making a move.
2

·
--
$PONS 15m surged 1.38%, with volume expanding to 1.96 times normal, and the candle closed above the upper end of the last 20 or so 5m candles. OI was up 0.38% in one hour, with nearly 200,000 U added in notional value. The anomaly percentile was 75.2%, ranking #22 across the entire pool—a price-up, OI-up structure that looks like new longs entering with leverage.
But the aggressive trade imbalance was -2.3%, and the buy/sell ratio was 0.95, so buying into the move was fairly modest. We’ll need to see whether the breakout holds on a pullback before judging its strength. 24h trading volume was 34M, and the pool isn’t very deep. From here, it either keeps climbing or makes a quick spike that leaves buyers stranded at the top. Let’s keep an eye on it.
$PONS 15m surged 1.38%, with volume expanding to 1.96 times normal, and the candle closed above the upper end of the last 20 or so 5m candles. OI was up 0.38% in one hour, with nearly 200,000 U added in notional value. The anomaly percentile was 75.2%, ranking #22 across the entire pool—a price-up, OI-up structure that looks like new longs entering with leverage.
But the aggressive trade imbalance was -2.3%, and the buy/sell ratio was 0.95, so buying into the move was fairly modest. We’ll need to see whether the breakout holds on a pullback before judging its strength. 24h trading volume was 34M, and the pool isn’t very deep. From here, it either keeps climbing or makes a quick spike that leaves buyers stranded at the top. Let’s keep an eye on it.
But the aggressive trade imbalance was -2.3%, and the buy/sell ratio was 0.95, so buying into the move was fairly modest. We’ll need to see whether the breakout holds on a pullback before judging its strength. 24h trading volume was 34M, and the pool isn’t very deep. From here, it either keeps climbing or makes a quick spike that leaves buyers stranded at the top. Let’s keep an eye on it.
55
·
--
$AVAX This 15m move has something going on. Price is up 0.88%, volume has climbed to 1.6x, and the key thing is that OI is rising along with it—1h contracts are up +0.19%, notional change is nearly 930K U, the anomaly percentile is 92.7%, ranking #22 across the entire pool. This isn't just spot-driven; it looks more like new leveraged longs entering.
The closing price has just broken above the upper bound of the recent 20-candle 5m range. Aggressive trade delta is 13.5%, the buy/sell ratio is 1.31, and the directional bias is pretty clear. 24h trading volume is 99M, and depth has confirmed the move too—volume is above normal.
Structurally, this is a price-up + OI-up combination, with short-term sentiment heating up. But note that with a leveraged breakout like this, the next thing to watch is whether price can hold above the upper end of the range. If OI keeps piling up, that could actually be a warning sign of overcrowded late buyers. For now, watch to see if this 15m candle can close firmly.
$AVAX This 15m move has something going on. Price is up 0.88%, volume has climbed to 1.6x, and the key thing is that OI is rising along with it—1h contracts are up +0.19%, notional change is nearly 930K U, the anomaly percentile is 92.7%, ranking #22 across the entire pool. This isn't just spot-driven; it looks more like new leveraged longs entering.
The closing price has just broken above the upper bound of the recent 20-candle 5m range. Aggressive trade delta is 13.5%, the buy/sell ratio is 1.31, and the directional bias is pretty clear. 24h trading volume is 99M, and depth has confirmed the move too—volume is above normal.
Structurally, this is a price-up + OI-up combination, with short-term sentiment heating up. But note that with a leveraged breakout like this, the next thing to watch is whether price can hold above the upper end of the range. If OI keeps piling up, that could actually be a warning sign of overcrowded late buyers. For now, watch to see if this 15m candle can close firmly.
The closing price has just broken above the upper bound of the recent 20-candle 5m range. Aggressive trade delta is 13.5%, the buy/sell ratio is 1.31, and the directional bias is pretty clear. 24h trading volume is 99M, and depth has confirmed the move too—volume is above normal.
Structurally, this is a price-up + OI-up combination, with short-term sentiment heating up. But note that with a leveraged breakout like this, the next thing to watch is whether price can hold above the upper end of the range. If OI keeps piling up, that could actually be a warning sign of overcrowded late buyers. For now, watch to see if this 15m candle can close firmly.
5
·
--
$AGT This drop was pretty decisive: it plunged 3.72% in 15 minutes, with volume climbing to 1.82x and a Z-score of 2.32. This wasn’t a slow, grinding decline—someone was genuinely handing over their position at this level.
Looking at OI, 15-minute contracts were down 0.14%, with $298K in notional volume. OI fell along with the price, which looks more like longs deleveraging and stop-losses getting swept than a wave of new shorts piling in. The taker volume delta was -24.1%, and the buy/sell ratio was 0.61, so selling pressure was clearly dominant. Price also broke below the lower bound of the past 20 or so 5-minute candles, meaning the short-term range has taken a hit to the downside.
However, 1-hour OI is still up 0.73%, with $71K in notional inflows, suggesting this move hasn’t disrupted the overall positioning structure; it’s mostly a short-term contraction. The change in notional volume ranks #22 across the full pool, at the 65.3rd percentile—not extreme, but for an asset with $240M in 24-hour trading volume, this volume accompanying a breakdown is worth watching. The key is whether deleveraging continues or price can reclaim the range’s lower bound.
After a break below the range’s lower bound, I generally don’t like rushing in to buy. I’d wait for OI to stabilize and taker selling to dry up first. $AGT
$AGT This drop was pretty decisive: it plunged 3.72% in 15 minutes, with volume climbing to 1.82x and a Z-score of 2.32. This wasn’t a slow, grinding decline—someone was genuinely handing over their position at this level.
Looking at OI, 15-minute contracts were down 0.14%, with $298K in notional volume. OI fell along with the price, which looks more like longs deleveraging and stop-losses getting swept than a wave of new shorts piling in. The taker volume delta was -24.1%, and the buy/sell ratio was 0.61, so selling pressure was clearly dominant. Price also broke below the lower bound of the past 20 or so 5-minute candles, meaning the short-term range has taken a hit to the downside.
However, 1-hour OI is still up 0.73%, with $71K in notional inflows, suggesting this move hasn’t disrupted the overall positioning structure; it’s mostly a short-term contraction. The change in notional volume ranks #22 across the full pool, at the 65.3rd percentile—not extreme, but for an asset with $240M in 24-hour trading volume, this volume accompanying a breakdown is worth watching. The key is whether deleveraging continues or price can reclaim the range’s lower bound.
After a break below the range’s lower bound, I generally don’t like rushing in to buy. I’d wait for OI to stabilize and taker selling to dry up first. $AGT
Looking at OI, 15-minute contracts were down 0.14%, with $298K in notional volume. OI fell along with the price, which looks more like longs deleveraging and stop-losses getting swept than a wave of new shorts piling in. The taker volume delta was -24.1%, and the buy/sell ratio was 0.61, so selling pressure was clearly dominant. Price also broke below the lower bound of the past 20 or so 5-minute candles, meaning the short-term range has taken a hit to the downside.
However, 1-hour OI is still up 0.73%, with $71K in notional inflows, suggesting this move hasn’t disrupted the overall positioning structure; it’s mostly a short-term contraction. The change in notional volume ranks #22 across the full pool, at the 65.3rd percentile—not extreme, but for an asset with $240M in 24-hour trading volume, this volume accompanying a breakdown is worth watching. The key is whether deleveraging continues or price can reclaim the range’s lower bound.
After a break below the range’s lower bound, I generally don’t like rushing in to buy. I’d wait for OI to stabilize and taker selling to dry up first. $AGT
1
·
--
Rain $RAIN up 9.4% gives holders a quick boost
Rain token catches fresh wind as fear grips market
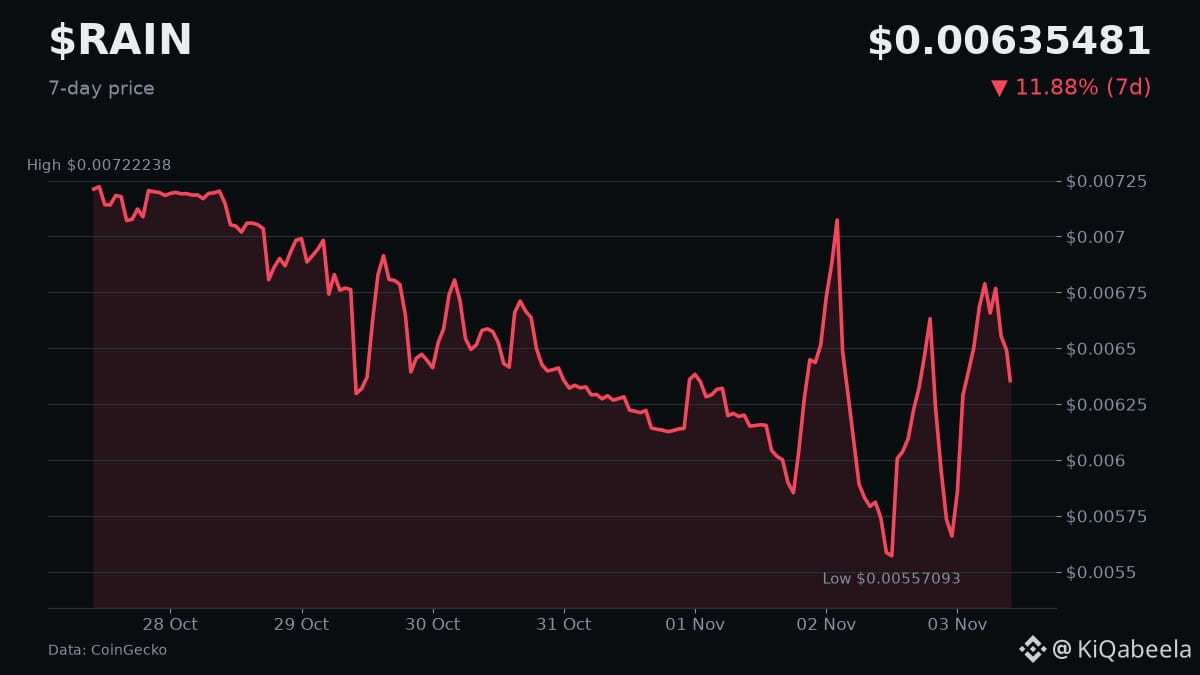
The 24‑hour rally of 9.43% lifts the price to $0.0068822, edging close to its recent high of $0.00692.
Volume surged past $15.6 million, indicating solid buying interest despite a Fear index of 34. Rank #22 shows growing visibility.
💬 Is the momentum sustainable? One word.
#RainToken #FearIndex
Rain $RAIN up 9.4% gives holders a quick boost
Rain token catches fresh wind as fear grips market
The 24‑hour rally of 9.43% lifts the price to $0.0068822, edging close to its recent high of $0.00692.
Volume surged past $15.6 million, indicating solid buying interest despite a Fear index of 34. Rank #22 shows growing visibility.
💬 Is the momentum sustainable? One word.
#RainToken #FearIndex
Rain token catches fresh wind as fear grips market
The 24‑hour rally of 9.43% lifts the price to $0.0068822, edging close to its recent high of $0.00692.
Volume surged past $15.6 million, indicating solid buying interest despite a Fear index of 34. Rank #22 shows growing visibility.
💬 Is the momentum sustainable? One word.
#RainToken #FearIndex
28
·
--
$BTW This move gained 5.88% in 15 minutes, with volume expanding directly to 3.85x and a Z-score of 5.70. It also closed above the upper bound of nearly 20 recent 5m candles—there’s solid confirmation here, not just a fleeting fakeout.
OI is rising too: the 1h notional change is +2.48%. Combined with the price moving up, this looks more like new leveraged longs entering than a rally driven by short covering. The taker volume delta is 0.9%, and the buy/sell ratio is 1.02—buyers have a slight edge, but it’s not one-sided.
Ranked #32 for anomalies across the entire pool and #22 for notional change, it’s not among the most explosive, but it’s already near the top of the current pool. 24h trading volume is 72.77M, so liquidity is sufficient.
With this kind of setup, I’d first watch whether the breakout holds and whether volume continues. Be careful chasing the price higher: OI rising alongside it means leverage is building up, which can make a pullback turn into a pile-on.
$BTW This move gained 5.88% in 15 minutes, with volume expanding directly to 3.85x and a Z-score of 5.70. It also closed above the upper bound of nearly 20 recent 5m candles—there’s solid confirmation here, not just a fleeting fakeout.
OI is rising too: the 1h notional change is +2.48%. Combined with the price moving up, this looks more like new leveraged longs entering than a rally driven by short covering. The taker volume delta is 0.9%, and the buy/sell ratio is 1.02—buyers have a slight edge, but it’s not one-sided.
Ranked #32 for anomalies across the entire pool and #22 for notional change, it’s not among the most explosive, but it’s already near the top of the current pool. 24h trading volume is 72.77M, so liquidity is sufficient.
With this kind of setup, I’d first watch whether the breakout holds and whether volume continues. Be careful chasing the price higher: OI rising alongside it means leverage is building up, which can make a pullback turn into a pile-on.
OI is rising too: the 1h notional change is +2.48%. Combined with the price moving up, this looks more like new leveraged longs entering than a rally driven by short covering. The taker volume delta is 0.9%, and the buy/sell ratio is 1.02—buyers have a slight edge, but it’s not one-sided.
Ranked #32 for anomalies across the entire pool and #22 for notional change, it’s not among the most explosive, but it’s already near the top of the current pool. 24h trading volume is 72.77M, so liquidity is sufficient.
With this kind of setup, I’d first watch whether the breakout holds and whether volume continues. Be careful chasing the price higher: OI rising alongside it means leverage is building up, which can make a pullback turn into a pile-on.
3
·
--
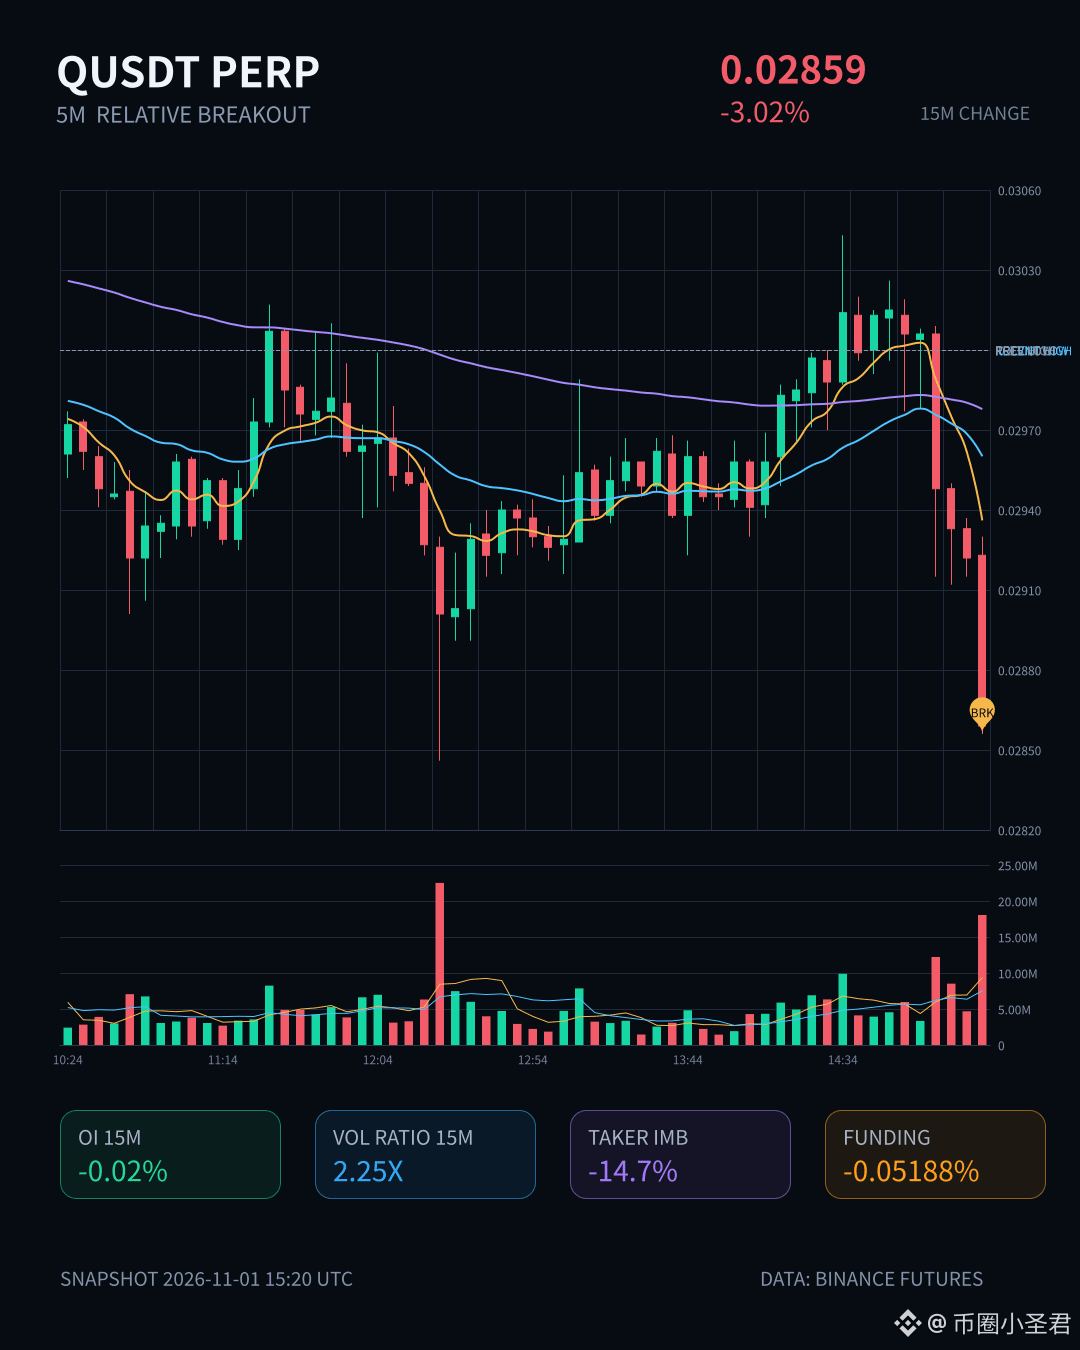
$Q This drop was pretty decisive: the 15m chart plunged 3%, volume hit 2.25× normal, and the close broke below the lows of nearly 20 recent 5m candles.
But on closer inspection, OI actually fell: 1h notional was -227K, 15m was -342K, taker flow delta was -14.7%, and the buy/sell ratio was 0.74. This looks more like bulls giving up and deleveraging, with stop-losses getting swept, rather than fresh shorts coming in to drive the drop.
Anomaly percentile: 88.9%; ranked #22 across the entire pool, #16 for notional change. This has continued for several consecutive periods. Don’t rush to buy the dip here—first see whether OI stabilizes.
$Q This drop was pretty decisive: the 15m chart plunged 3%, volume hit 2.25× normal, and the close broke below the lows of nearly 20 recent 5m candles.
But on closer inspection, OI actually fell: 1h notional was -227K, 15m was -342K, taker flow delta was -14.7%, and the buy/sell ratio was 0.74. This looks more like bulls giving up and deleveraging, with stop-losses getting swept, rather than fresh shorts coming in to drive the drop.
Anomaly percentile: 88.9%; ranked #22 across the entire pool, #16 for notional change. This has continued for several consecutive periods. Don’t rush to buy the dip here—first see whether OI stabilizes.
But on closer inspection, OI actually fell: 1h notional was -227K, 15m was -342K, taker flow delta was -14.7%, and the buy/sell ratio was 0.74. This looks more like bulls giving up and deleveraging, with stop-losses getting swept, rather than fresh shorts coming in to drive the drop.
Anomaly percentile: 88.9%; ranked #22 across the entire pool, #16 for notional change. This has continued for several consecutive periods. Don’t rush to buy the dip here—first see whether OI stabilizes.
6

·
--
$G long position, 50X, entered. ROE +34.6%🔥
🎯 Live Trade
$G GUSDT Perpetual · LONG
Average entry 0.003701 → Current price 0.003957
50X leverage · Unrealized ROE +34.6%
TP1 0.003957 reached · TP2 0.0041326 · SL 0.0035766
🧠 Entry Rationale (LLM strategy #22 confluence confirmed)
1h bullish trend established, RSI 74.1 in strong territory
15m pullback to EMA20 on declining volume, only 1.28% deviation
5m RVOL 0.88x, declining volume + lower-wick Pinbar showing support
Aggressive buying returned at 46.5%, reversal confirmed
Broader market choppy with a bullish bias; score 59.9 passed trend-following validation
Rebounded +11.70% from the low; LIMIT order placed at 0.0037006 to avoid chasing the high
🛡️ Risk Management Rules
Risk/reward ratio 2.8:1; stop-loss is non-negotiable
Hold for 25–45 minutes; circuit breaker if ROE <20% after timeout
Large winning positions are exempt from the holding rule—let profits run
Did you catch this right-side reversal on the low-volume pullback? Share your $G results in the comments👇
#币安合约 #实盘战报 #量化交易 #GUSDT
$G long position, 50X, entered. ROE +34.6%🔥
🎯 Live Trade
$G GUSDT Perpetual · LONG
Average entry 0.003701 → Current price 0.003957
50X leverage · Unrealized ROE +34.6%
TP1 0.003957 reached · TP2 0.0041326 · SL 0.0035766
🧠 Entry Rationale (LLM strategy #22 confluence confirmed)
1h bullish trend established, RSI 74.1 in strong territory
15m pullback to EMA20 on declining volume, only 1.28% deviation
5m RVOL 0.88x, declining volume + lower-wick Pinbar showing support
Aggressive buying returned at 46.5%, reversal confirmed
Broader market choppy with a bullish bias; score 59.9 passed trend-following validation
Rebounded +11.70% from the low; LIMIT order placed at 0.0037006 to avoid chasing the high
🛡️ Risk Management Rules
Risk/reward ratio 2.8:1; stop-loss is non-negotiable
Hold for 25–45 minutes; circuit breaker if ROE <20% after timeout
Large winning positions are exempt from the holding rule—let profits run
Did you catch this right-side reversal on the low-volume pullback? Share your $G results in the comments👇
#币安合约 #实盘战报 #量化交易 #GUSDT
🎯 Live Trade
$G GUSDT Perpetual · LONG
Average entry 0.003701 → Current price 0.003957
50X leverage · Unrealized ROE +34.6%
TP1 0.003957 reached · TP2 0.0041326 · SL 0.0035766
🧠 Entry Rationale (LLM strategy #22 confluence confirmed)
1h bullish trend established, RSI 74.1 in strong territory
15m pullback to EMA20 on declining volume, only 1.28% deviation
5m RVOL 0.88x, declining volume + lower-wick Pinbar showing support
Aggressive buying returned at 46.5%, reversal confirmed
Broader market choppy with a bullish bias; score 59.9 passed trend-following validation
Rebounded +11.70% from the low; LIMIT order placed at 0.0037006 to avoid chasing the high
🛡️ Risk Management Rules
Risk/reward ratio 2.8:1; stop-loss is non-negotiable
Hold for 25–45 minutes; circuit breaker if ROE <20% after timeout
Large winning positions are exempt from the holding rule—let profits run
Did you catch this right-side reversal on the low-volume pullback? Share your $G results in the comments👇
#币安合约 #实盘战报 #量化交易 #GUSDT
264

·
--
Over the past couple of days, I keep seeing replies under Agent-related posts from an account called “契印 AGENT SEAL.” I looked into it: it’s an on-chain stamp NFT on BNB Chain that uses an .ai Agent ID as its entry ticket.
The process is simple: first claim an .ai Agent ID in your Agentic Wallet, put some BNB in the wallet, then mint on the official site. The contract checks directly whether you have an Agent ID, so there’s no whitelist form. The official price is 0.0005 BNB per NFT, with a limit of 5 per wallet. The image is an 8×8 bitmap SVG generated in the contract, reportedly taken from Bitcoin’s genesis block, and everything is on-chain.
Data: supply is capped at 2,100. I just checked the on-chain totalSupply: 277. #1–#21 are the gold Genesis pieces (the official account says they sold out a while ago); #22–#210 are the holographic Pioneer pieces. Based on the current number minted, this tier has also been passed, and all later mints are the regular version. There’s no token or liquidity pool, so there’s no market cap or price movement to track.
Official account: @Handln (the account name is 契印 AGENT SEAL)
Contract: 0x9541eF45e52adcf090543126D1ca2467E505d404 (BSC; the official account says the source code is an exact match on Sourcify)
Risks: most of the buzz seems to come from the official account replying one by one under various posts; there isn’t much genuine discussion, so don’t mistake repeated posts for real hype. It’s just a small collectible NFT, with no airdrop or token promised. Only trust the contract above, and don’t click links in DMs or comments.
After you’ve claimed your Agent ID, would you pay for a small on-chain credential like this, apart from a free mint?
The above is for informational purposes only and does not constitute investment advice.
Over the past couple of days, I keep seeing replies under Agent-related posts from an account called “契印 AGENT SEAL.” I looked into it: it’s an on-chain stamp NFT on BNB Chain that uses an .ai Agent ID as its entry ticket.
The process is simple: first claim an .ai Agent ID in your Agentic Wallet, put some BNB in the wallet, then mint on the official site. The contract checks directly whether you have an Agent ID, so there’s no whitelist form. The official price is 0.0005 BNB per NFT, with a limit of 5 per wallet. The image is an 8×8 bitmap SVG generated in the contract, reportedly taken from Bitcoin’s genesis block, and everything is on-chain.
Data: supply is capped at 2,100. I just checked the on-chain totalSupply: 277. #1–#21 are the gold Genesis pieces (the official account says they sold out a while ago); #22–#210 are the holographic Pioneer pieces. Based on the current number minted, this tier has also been passed, and all later mints are the regular version. There’s no token or liquidity pool, so there’s no market cap or price movement to track.
Official account: @Handln (the account name is 契印 AGENT SEAL)
Contract: 0x9541eF45e52adcf090543126D1ca2467E505d404 (BSC; the official account says the source code is an exact match on Sourcify)
Risks: most of the buzz seems to come from the official account replying one by one under various posts; there isn’t much genuine discussion, so don’t mistake repeated posts for real hype. It’s just a small collectible NFT, with no airdrop or token promised. Only trust the contract above, and don’t click links in DMs or comments.
After you’ve claimed your Agent ID, would you pay for a small on-chain credential like this, apart from a free mint?
The above is for informational purposes only and does not constitute investment advice.
The process is simple: first claim an .ai Agent ID in your Agentic Wallet, put some BNB in the wallet, then mint on the official site. The contract checks directly whether you have an Agent ID, so there’s no whitelist form. The official price is 0.0005 BNB per NFT, with a limit of 5 per wallet. The image is an 8×8 bitmap SVG generated in the contract, reportedly taken from Bitcoin’s genesis block, and everything is on-chain.
Data: supply is capped at 2,100. I just checked the on-chain totalSupply: 277. #1–#21 are the gold Genesis pieces (the official account says they sold out a while ago); #22–#210 are the holographic Pioneer pieces. Based on the current number minted, this tier has also been passed, and all later mints are the regular version. There’s no token or liquidity pool, so there’s no market cap or price movement to track.
Official account: @Handln (the account name is 契印 AGENT SEAL)
Contract: 0x9541eF45e52adcf090543126D1ca2467E505d404 (BSC; the official account says the source code is an exact match on Sourcify)
Risks: most of the buzz seems to come from the official account replying one by one under various posts; there isn’t much genuine discussion, so don’t mistake repeated posts for real hype. It’s just a small collectible NFT, with no airdrop or token promised. Only trust the contract above, and don’t click links in DMs or comments.
After you’ve claimed your Agent ID, would you pay for a small on-chain credential like this, apart from a free mint?
The above is for informational purposes only and does not constitute investment advice.
7

·
--
$PENGU This 15m move higher is pretty interesting. The price is up +1.05%—not a huge move—but OI is rising along with it. The 1h notional change is 444K, which looks like new leveraged longs entering rather than mere short covering. Price broke above the high of the past 20 5m ranges, backed by 1.41x volume, and the funding rate is also at a recent high percentile—it’s getting a bit overheated. However, the aggressive trade imbalance is -4.8% and the buy/sell ratio is 0.91, so buying hasn’t fully caught up. Those chasing the move should be cautious. It ranks #30 for anomalies across the whole pool and #22 for notional change—not the most eye-catching, but still worth watching. 24h trading volume is 115M, so liquidity is decent.
$PENGU This 15m move higher is pretty interesting. The price is up +1.05%—not a huge move—but OI is rising along with it. The 1h notional change is 444K, which looks like new leveraged longs entering rather than mere short covering. Price broke above the high of the past 20 5m ranges, backed by 1.41x volume, and the funding rate is also at a recent high percentile—it’s getting a bit overheated. However, the aggressive trade imbalance is -4.8% and the buy/sell ratio is 0.91, so buying hasn’t fully caught up. Those chasing the move should be cautious. It ranks #30 for anomalies across the whole pool and #22 for notional change—not the most eye-catching, but still worth watching. 24h trading volume is 115M, so liquidity is decent.
13
Log in to explore more content
Join global crypto users on Binance Square
⚡️ Get latest and useful information about crypto.
💬 Trusted by the world’s largest crypto exchange.
👍 Discover real insights from verified creators.
Email / Phone number
Trending Topics
1
#IsAnthropic’s$1.5TMarketCapJustified?
45,734 views
224 Discussing
2
#BTCBelow$62KAmidHikeFearsAndShiftToAnthropic
7,224 views
60 Discussing
3
#NvidiaBoardReportedlySplitOverHuang’sReturn
201,553 views
1,658 Discussing
4
#CanGTA6'sLaunchLiftTTWOShares?
161,781 views
1,196 Discussing
5
#BlackRockBitcoinETFRecordsLargestDailyOutflow
0 views
1 Discussing
6
#LedgerProbesTamperedWalletsInBerlinAndDubai
13,130 views
193 Discussing
7
#13FInstitutionsBitcoinSpotETPHoldingsHitRecord
25,960 views
266 Discussing
8
#BTCRemainsUnderPressureAfterHawkishFOMCMinutes
372,154 views
2,493 Discussing
9
#StrategySTRCPreferredSlips3.65%Below$100Par
12,797 views
98 Discussing
10
#MASToUpgradeSGDTestnetToSGDigitalLedger
49,099 views
454 Discussing