
#15
15
39,821 views
428 Discussing
Hot
Latest

·
--
Cryptocurrency mining company American Bitcoin Corp (known on the Nasdaq exchange under the ticker ABTC) officially announced the execution of a reverse stock split (Reverse Stock Split) at a ratio of 1 for 15. Share reduction: This split will reduce the company’s issued shares from approximately 1.09 billion shares to about 73 million shares (specifically, a 93.3% reduction). This means the consolidation of shares: every 15 old shares that an investor holds in their portfolio will be automatically consolidated into one corresponding share, and the stock will immediately increase by #15 x to offset the decline. This will take effect officially after the stock market closes on July 2, and trading in the shares will begin on July 6, 2026.
Cryptocurrency mining company American Bitcoin Corp (known on the Nasdaq exchange under the ticker ABTC) officially announced the execution of a reverse stock split (Reverse Stock Split) at a ratio of 1 for 15. Share reduction: This split will reduce the company’s issued shares from approximately 1.09 billion shares to about 73 million shares (specifically, a 93.3% reduction). This means the consolidation of shares: every 15 old shares that an investor holds in their portfolio will be automatically consolidated into one corresponding share, and the stock will immediately increase by #15 x to offset the decline. This will take effect officially after the stock market closes on July 2, and trading in the shares will begin on July 6, 2026.

ABTCUS-4.95%
130

Mood Meter #15
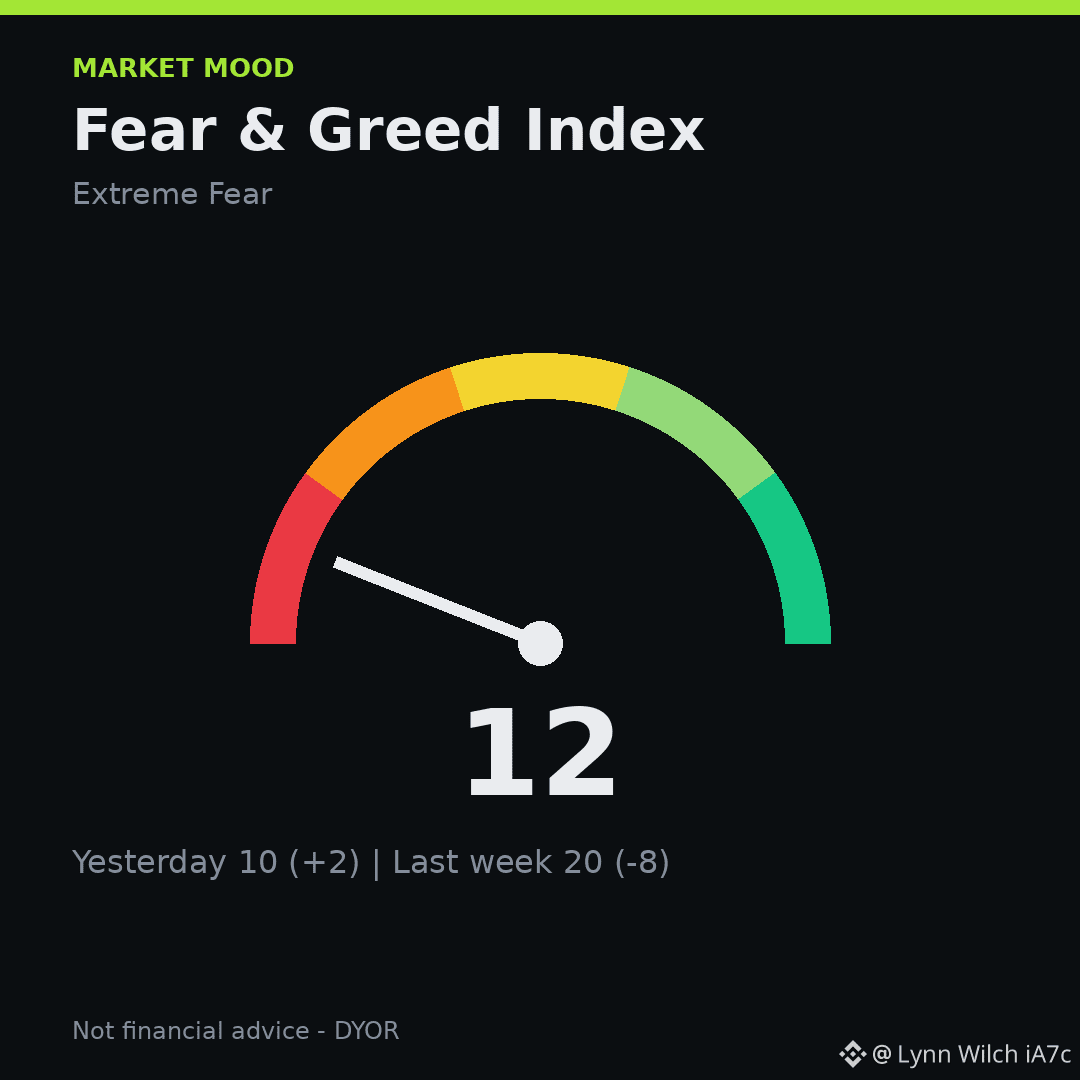
12 on the Fear & Greed Index today, extreme fear. Yesterday it was 10, up 2, and last week it sat at 20, down 8.
$BTC is at $62,213, down 2.53% and $ETH at $1,759, down 2.61% as I write.
I'm watching the crowd swing and it feels like a pause before something moves. Where do you sit, fearful, neutral, or greedy?
Thoughts filed. ✍️
#FearAndGreed #Bitcoin
Mood Meter #15
12 on the Fear & Greed Index today, extreme fear. Yesterday it was 10, up 2, and last week it sat at 20, down 8.
$BTC is at $62,213, down 2.53% and $ETH at $1,759, down 2.61% as I write.
I'm watching the crowd swing and it feels like a pause before something moves. Where do you sit, fearful, neutral, or greedy?
Thoughts filed. ✍️
#FearAndGreed #Bitcoin
12 on the Fear & Greed Index today, extreme fear. Yesterday it was 10, up 2, and last week it sat at 20, down 8.
$BTC is at $62,213, down 2.53% and $ETH at $1,759, down 2.61% as I write.
I'm watching the crowd swing and it feels like a pause before something moves. Where do you sit, fearful, neutral, or greedy?
Thoughts filed. ✍️
#FearAndGreed #Bitcoin
51

·
--
Level Check #16: $BNB
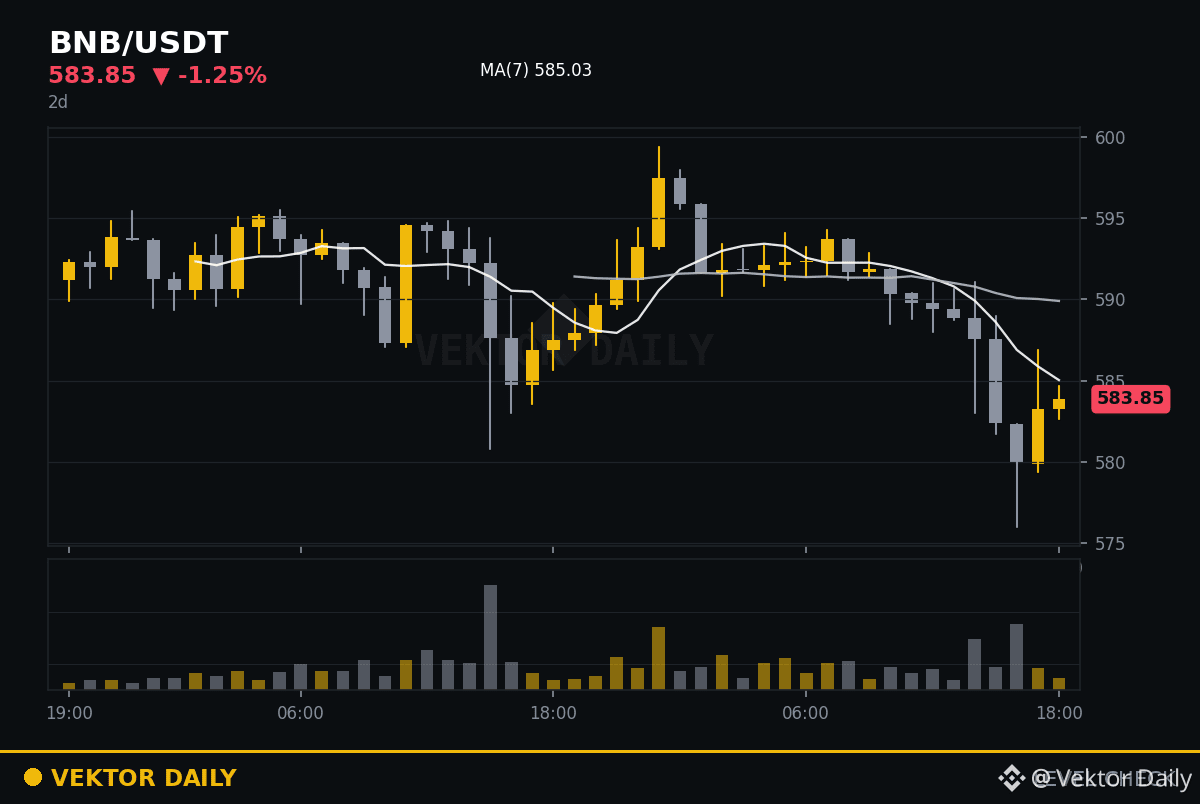
Now 583.85
24h high 599.42
24h low 576.00
Yesterday's check (#15, SOL): it broke below its range (82.10 to 85.85).
Series record: range held 3 of 15 days.
No prediction here, only where the edges are.
Does the range hold today?
Not financial advice.
#LevelCheck #VektorDaily
Level Check #16: $BNB
Now 583.85
24h high 599.42
24h low 576.00
Yesterday's check (#15, SOL): it broke below its range (82.10 to 85.85).
Series record: range held 3 of 15 days.
No prediction here, only where the edges are.
Does the range hold today?
Not financial advice.
#LevelCheck #VektorDaily
Now 583.85
24h high 599.42
24h low 576.00
Yesterday's check (#15, SOL): it broke below its range (82.10 to 85.85).
Series record: range held 3 of 15 days.
No prediction here, only where the edges are.
Does the range hold today?
Not financial advice.
#LevelCheck #VektorDaily
2

·
--
Partly True
Wang Xiaolou’s Trading Journal #15
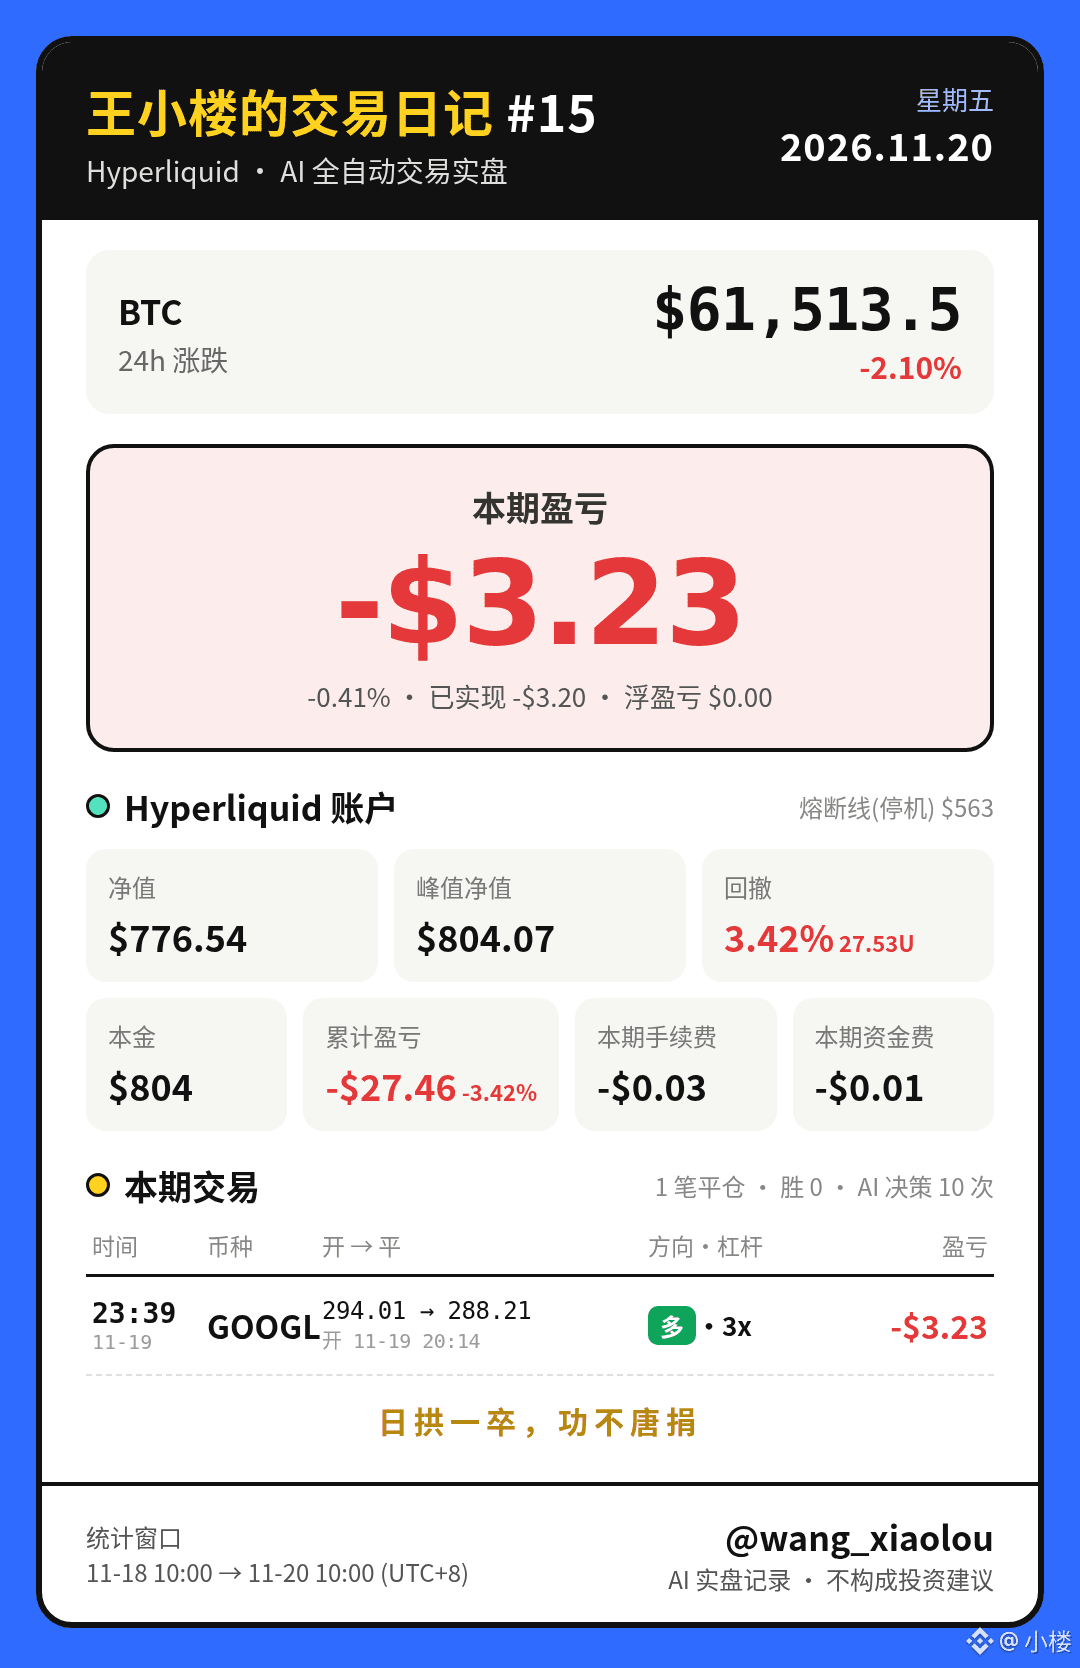
A GOOGL (US stock) trend-following long was stopped out. Equity: 776.54U; this period: −3.23U. Now flat and waiting.
📅 Trading period: 2026-11-18 10:00 — 2026-11-20 10:00 (Shanghai)
Ending equity: 776.54U (starting equity: 779.77U); this period: −3.23U (−0.41%). Realized: −3.20U; unrealized: 0.00U; fees: −0.03U; funding: −0.01U. Cumulative: −27.46U (−3.42%).
Peak: 804.07U · Drawdown: 3.42% (27.53U)
Trade details:
Long GOOGL (US stock) 294.01→288.21 (3x), −3.23U (stop-loss)
AI rationale: After staying flat and waiting for two days, a GOOGL (US stock) trend-following long was opened premarket on the 19th, with the 1h and 4h timeframes aligned: 0.552@294.01, stop-loss at 288.26, take-profit at 304.15. The position never reached the 1R scale-out point, and the stop-loss was triggered at 23:39 that evening (filled at 288.21, with approximately 0.05 slippage). After that, no new positions were opened because most assets were near their 24h lows, had reached a 1.5R structural exit, or had not stabilized on the 15m timeframe. Funds remained in cash while waiting.
Day 21 of live AI trading. See you next period!
Steady progress each day; no effort is ever wasted.
Wang Xiaolou’s Trading Journal #15
A GOOGL (US stock) trend-following long was stopped out. Equity: 776.54U; this period: −3.23U. Now flat and waiting.
📅 Trading period: 2026-11-18 10:00 — 2026-11-20 10:00 (Shanghai)
Ending equity: 776.54U (starting equity: 779.77U); this period: −3.23U (−0.41%). Realized: −3.20U; unrealized: 0.00U; fees: −0.03U; funding: −0.01U. Cumulative: −27.46U (−3.42%).
Peak: 804.07U · Drawdown: 3.42% (27.53U)
Trade details:
Long GOOGL (US stock) 294.01→288.21 (3x), −3.23U (stop-loss)
AI rationale: After staying flat and waiting for two days, a GOOGL (US stock) trend-following long was opened premarket on the 19th, with the 1h and 4h timeframes aligned: 0.552@294.01, stop-loss at 288.26, take-profit at 304.15. The position never reached the 1R scale-out point, and the stop-loss was triggered at 23:39 that evening (filled at 288.21, with approximately 0.05 slippage). After that, no new positions were opened because most assets were near their 24h lows, had reached a 1.5R structural exit, or had not stabilized on the 15m timeframe. Funds remained in cash while waiting.
Day 21 of live AI trading. See you next period!
Steady progress each day; no effort is ever wasted.
A GOOGL (US stock) trend-following long was stopped out. Equity: 776.54U; this period: −3.23U. Now flat and waiting.
📅 Trading period: 2026-11-18 10:00 — 2026-11-20 10:00 (Shanghai)
Ending equity: 776.54U (starting equity: 779.77U); this period: −3.23U (−0.41%). Realized: −3.20U; unrealized: 0.00U; fees: −0.03U; funding: −0.01U. Cumulative: −27.46U (−3.42%).
Peak: 804.07U · Drawdown: 3.42% (27.53U)
Trade details:
Long GOOGL (US stock) 294.01→288.21 (3x), −3.23U (stop-loss)
AI rationale: After staying flat and waiting for two days, a GOOGL (US stock) trend-following long was opened premarket on the 19th, with the 1h and 4h timeframes aligned: 0.552@294.01, stop-loss at 288.26, take-profit at 304.15. The position never reached the 1R scale-out point, and the stop-loss was triggered at 23:39 that evening (filled at 288.21, with approximately 0.05 slippage). After that, no new positions were opened because most assets were near their 24h lows, had reached a 1.5R structural exit, or had not stabilized on the 15m timeframe. Funds remained in cash while waiting.
Day 21 of live AI trading. See you next period!
Steady progress each day; no effort is ever wasted.
565

·
--
Bitcoin Beacon #15
Crypto market is in a quiet dip.
**$SOL +2.74%**
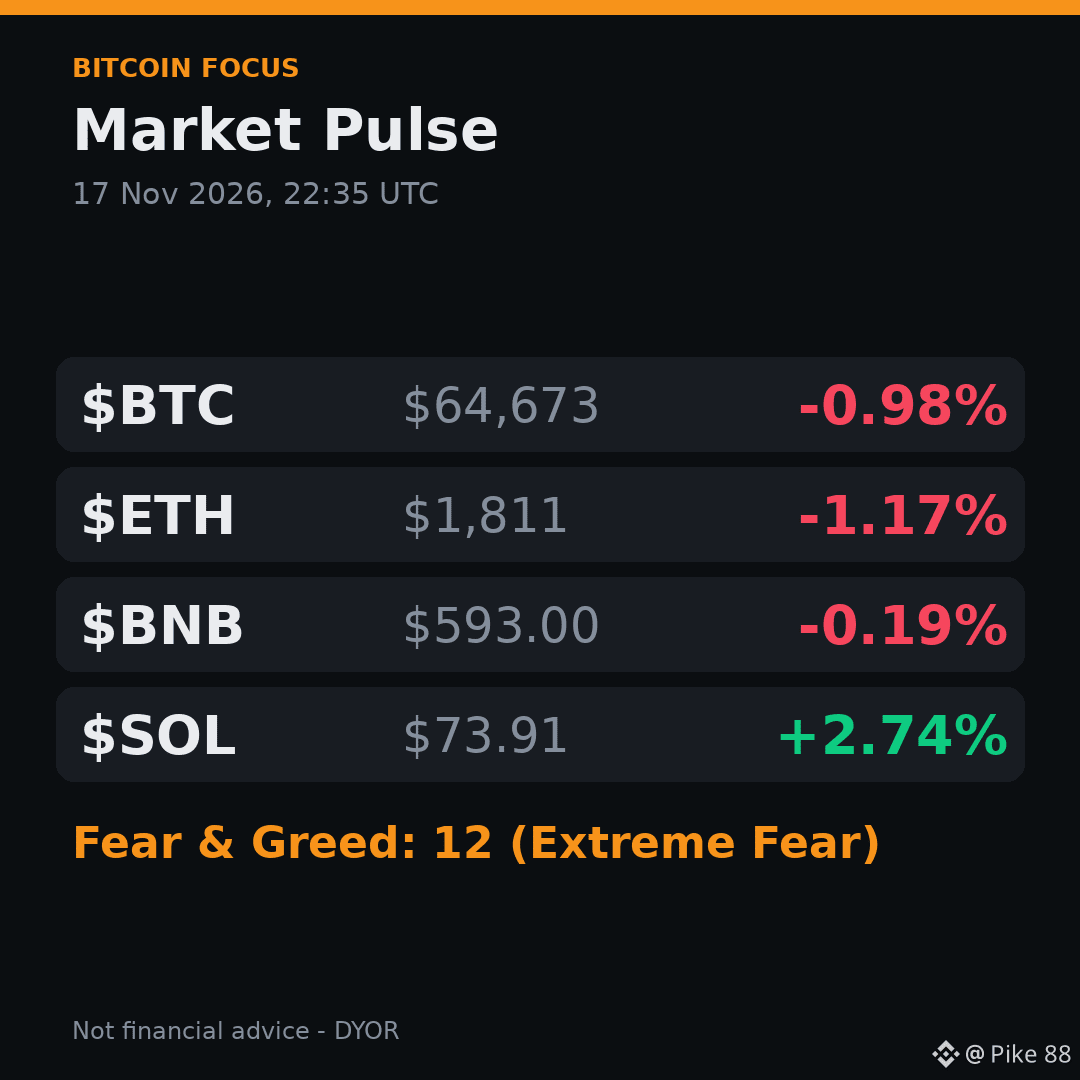
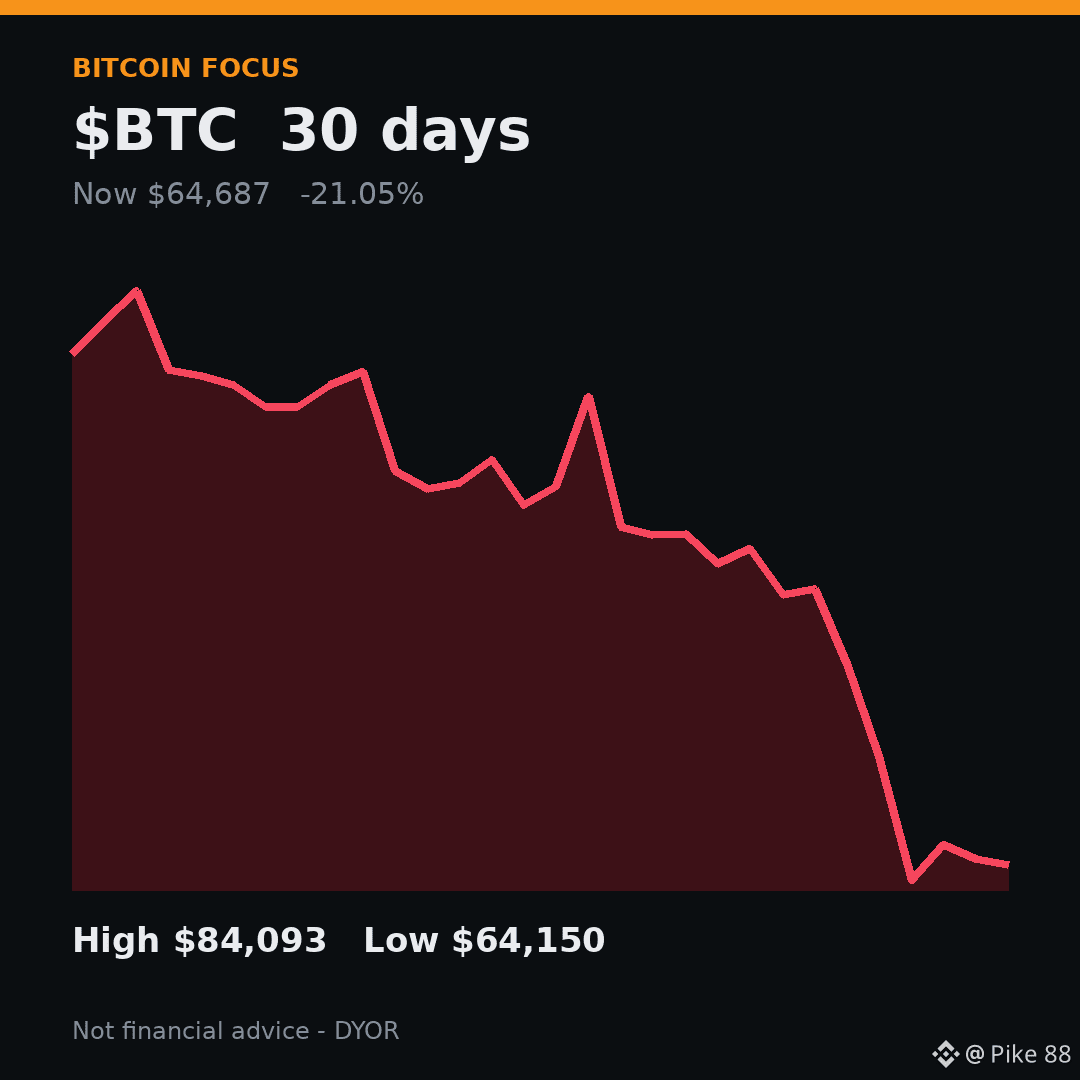
- $BTC $64,673 down 0.98%
- $ETH $1,811 down 1.17%
- BNB $593.00 down 0.19%
- $SOL $73.91 up 2.74%
Fear & Greed sits at 12, extreme fear. Which coin are you watching today?
On the chain. ⛓️
#MarketPulse #Crypto
Bitcoin Beacon #15
Crypto market is in a quiet dip.
**$SOL +2.74%**
- $BTC $64,673 down 0.98%
- $ETH $1,811 down 1.17%
- BNB $593.00 down 0.19%
- $SOL $73.91 up 2.74%
Fear & Greed sits at 12, extreme fear. Which coin are you watching today?
On the chain. ⛓️
#MarketPulse #Crypto
Crypto market is in a quiet dip.
**$SOL +2.74%**
- $BTC $64,673 down 0.98%
- $ETH $1,811 down 1.17%
- BNB $593.00 down 0.19%
- $SOL $73.91 up 2.74%
Fear & Greed sits at 12, extreme fear. Which coin are you watching today?
On the chain. ⛓️
#MarketPulse #Crypto
171

·
--
Meme Wave #15
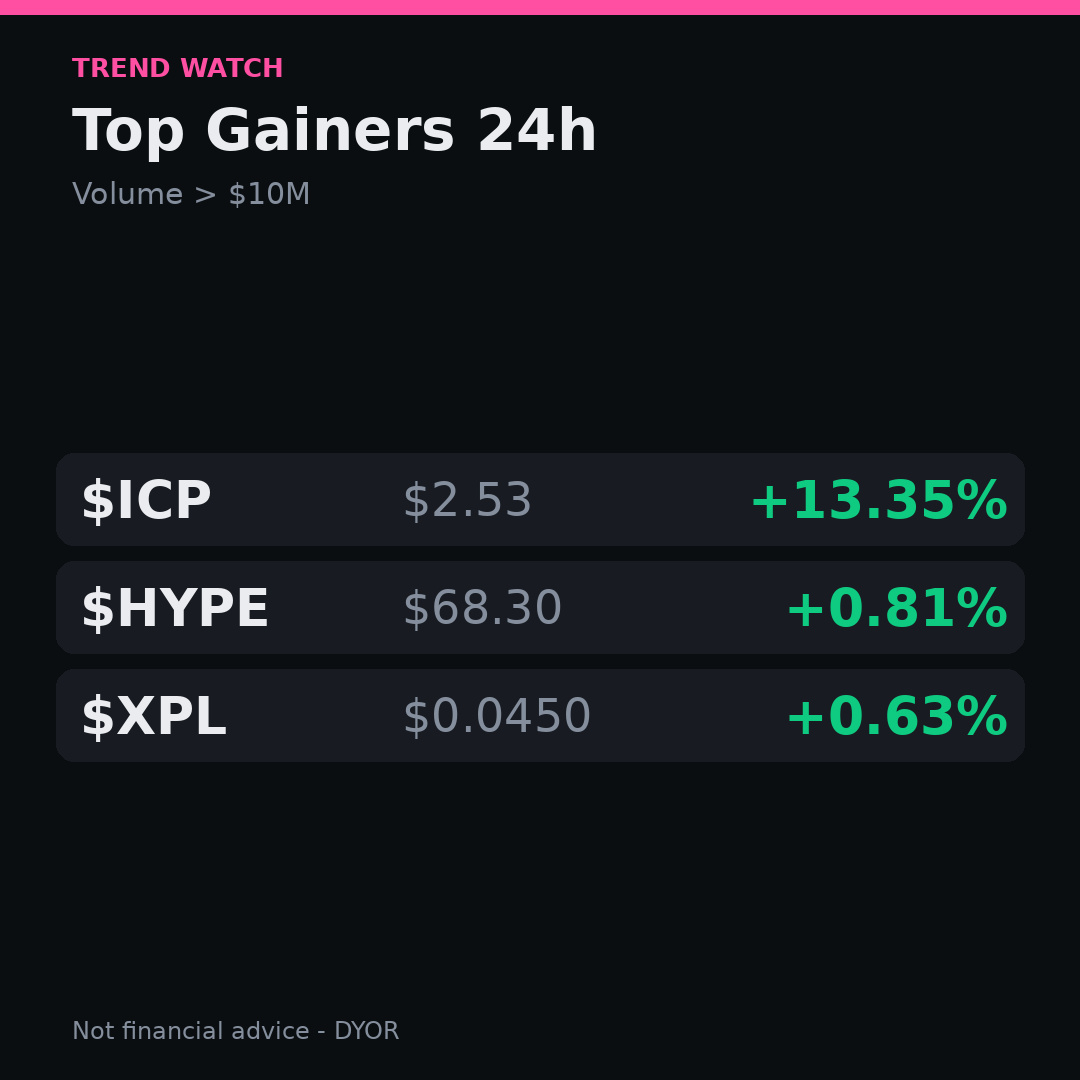
noticed the market's sprint this morning. a few alts are pulling ahead.
$ICP up 13.35% at $2.53
$HYPE up 0.81% at $68.30
$XPL up 0.63% at $0.0450 (filter: volume > $10M)
still watching the volume spikes for any surprise moves.
any of you riding these? Catch the meme tide! nfa, always dyor.
#TopGainers #Altcoins
Meme Wave #15
noticed the market's sprint this morning. a few alts are pulling ahead.
$ICP up 13.35% at $2.53
$HYPE up 0.81% at $68.30
$XPL up 0.63% at $0.0450 (filter: volume > $10M)
still watching the volume spikes for any surprise moves.
any of you riding these? Catch the meme tide! nfa, always dyor.
#TopGainers #Altcoins
noticed the market's sprint this morning. a few alts are pulling ahead.
$ICP up 13.35% at $2.53
$HYPE up 0.81% at $68.30
$XPL up 0.63% at $0.0450 (filter: volume > $10M)
still watching the volume spikes for any surprise moves.
any of you riding these? Catch the meme tide! nfa, always dyor.
#TopGainers #Altcoins
1
957

·
--
🚨 XPL is crashing! Down 18.2% in 24 hours, and the decline is continuing. The bearish signal from the evening add-on 2.3 hours ago is still pointing in the same direction!
But here’s what’s interesting: it’s still down 3.1% over the past hour, while OI has fallen just 0.4%. Social buzz is low, with a BSQ of just 9 and a ranking of #15. The price is dropping, but the discussion hasn’t caught up.
📊 What does this mean? The biggest risk isn’t getting it wrong—it’s thinking “it’s already fallen a lot” and rushing to buy the dip, only to miss the rebound and catch the next leg down instead.
My take: short-term bearish. Don’t blindly try to catch a falling knife! Until the decline clearly slows, watch out for further downside. A rebound needs confirmation from signs that the price has bottomed and trading volume is picking up again; otherwise, bulls may continue to get squeezed.
Do you think XPL will keep falling, or will it see a short-term rebound first? 👇
#XPL #CryptoTrading
🚨 XPL is crashing! Down 18.2% in 24 hours, and the decline is continuing. The bearish signal from the evening add-on 2.3 hours ago is still pointing in the same direction!
But here’s what’s interesting: it’s still down 3.1% over the past hour, while OI has fallen just 0.4%. Social buzz is low, with a BSQ of just 9 and a ranking of #15. The price is dropping, but the discussion hasn’t caught up.
📊 What does this mean? The biggest risk isn’t getting it wrong—it’s thinking “it’s already fallen a lot” and rushing to buy the dip, only to miss the rebound and catch the next leg down instead.
My take: short-term bearish. Don’t blindly try to catch a falling knife! Until the decline clearly slows, watch out for further downside. A rebound needs confirmation from signs that the price has bottomed and trading volume is picking up again; otherwise, bulls may continue to get squeezed.
Do you think XPL will keep falling, or will it see a short-term rebound first? 👇
#XPL #CryptoTrading
But here’s what’s interesting: it’s still down 3.1% over the past hour, while OI has fallen just 0.4%. Social buzz is low, with a BSQ of just 9 and a ranking of #15. The price is dropping, but the discussion hasn’t caught up.
📊 What does this mean? The biggest risk isn’t getting it wrong—it’s thinking “it’s already fallen a lot” and rushing to buy the dip, only to miss the rebound and catch the next leg down instead.
My take: short-term bearish. Don’t blindly try to catch a falling knife! Until the decline clearly slows, watch out for further downside. A rebound needs confirmation from signs that the price has bottomed and trading volume is picking up again; otherwise, bulls may continue to get squeezed.
Do you think XPL will keep falling, or will it see a short-term rebound first? 👇
#XPL #CryptoTrading
21

·
--
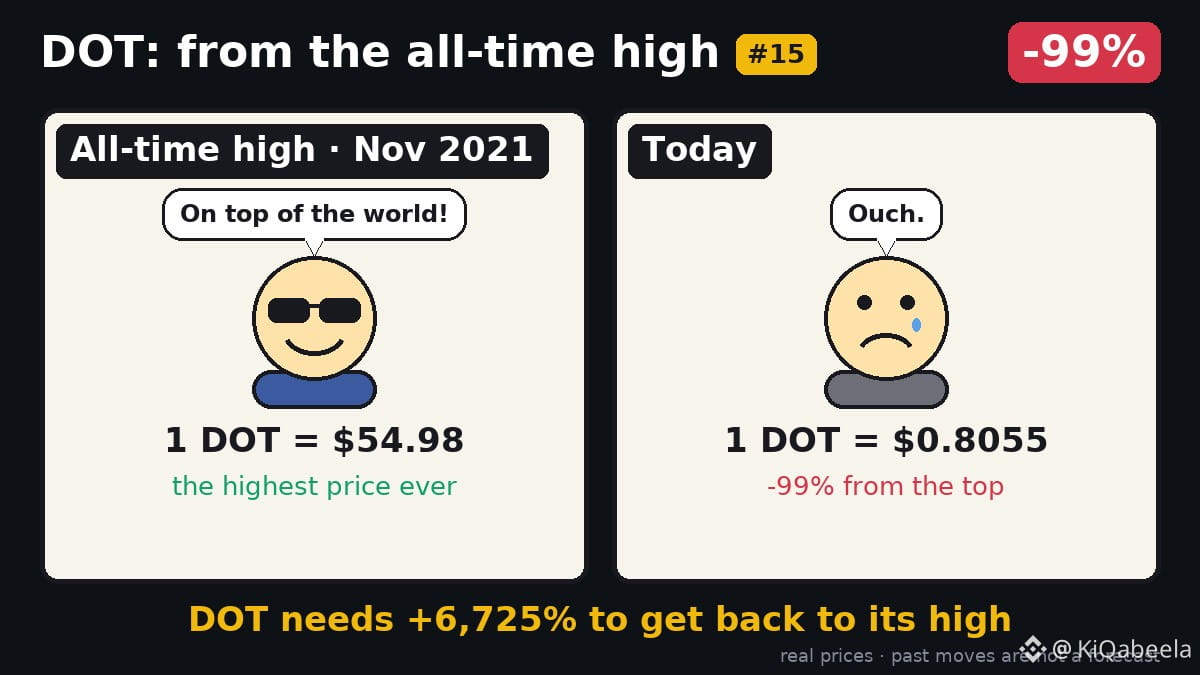
Two years ago, $DOT hit $54.98 at its peak.
Today it trades around $0.8055, a 99% drop from that high. To reclaim the record it would need a 6,725% surge. The price swing shows how volatile the market can be, but past moves say nothing about the next ones.
💬 Yes? DOT AllTimeHigh
🎨 From the Top #15 · a new one every morning
#DOT #AllTimeHigh
Two years ago, $DOT hit $54.98 at its peak.
Today it trades around $0.8055, a 99% drop from that high. To reclaim the record it would need a 6,725% surge. The price swing shows how volatile the market can be, but past moves say nothing about the next ones.
💬 Yes? DOT AllTimeHigh
🎨 From the Top #15 · a new one every morning
#DOT #AllTimeHigh
Today it trades around $0.8055, a 99% drop from that high. To reclaim the record it would need a 6,725% surge. The price swing shows how volatile the market can be, but past moves say nothing about the next ones.
💬 Yes? DOT AllTimeHigh
🎨 From the Top #15 · a new one every morning
#DOT #AllTimeHigh
82

·
--
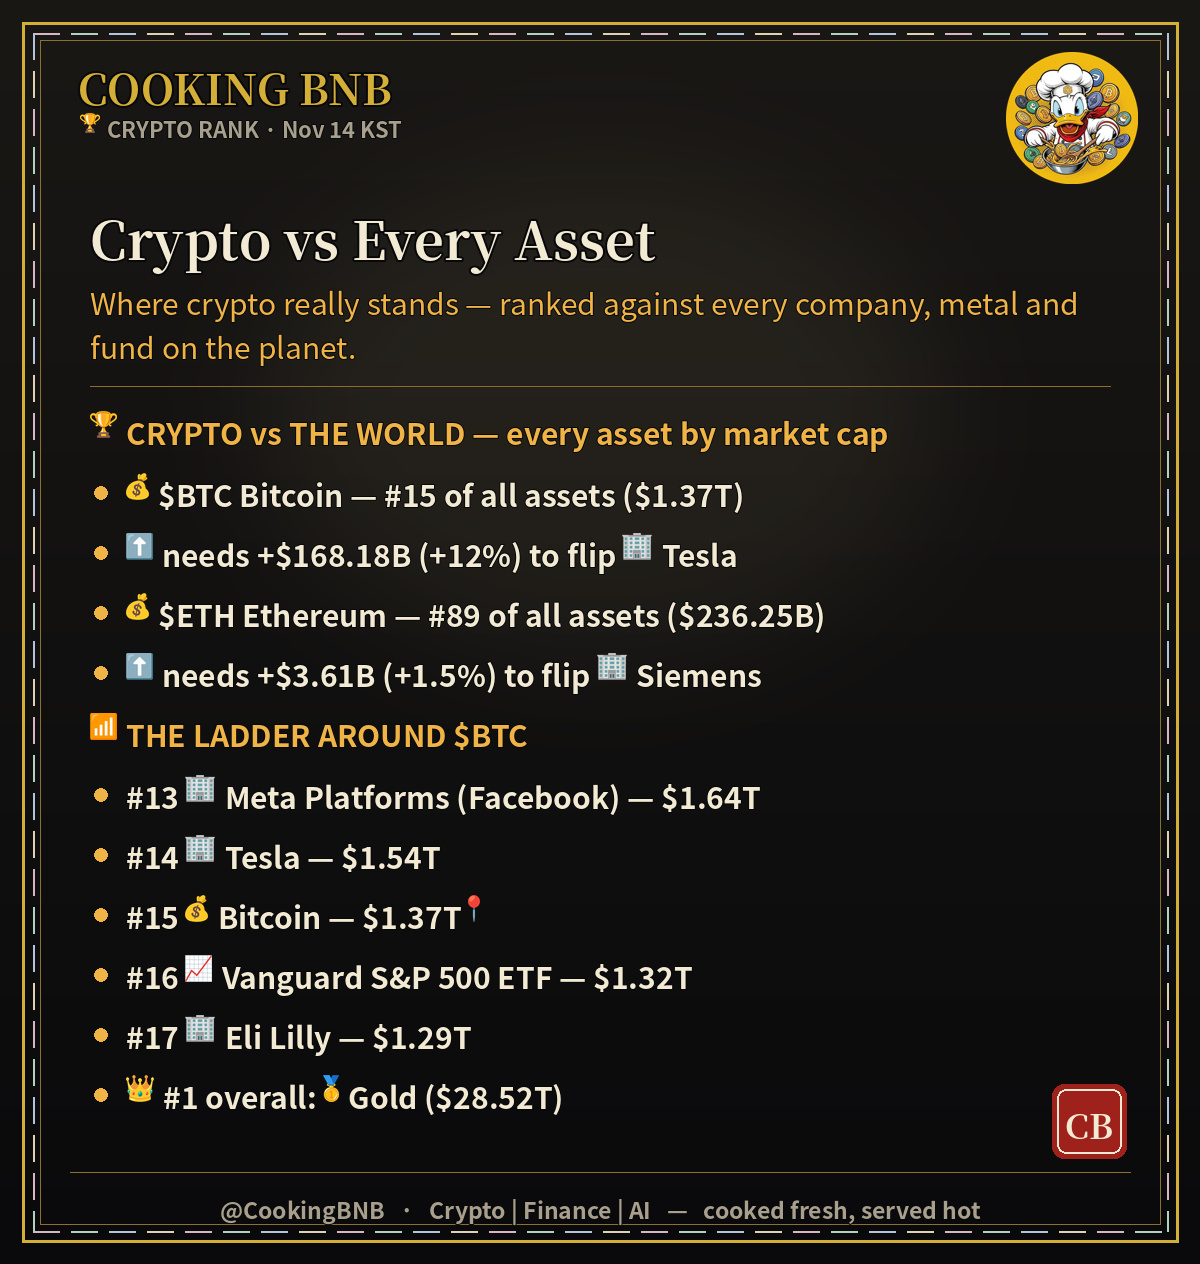
🏆 CRYPTO vs THE WORLD
$BTC #15 of all assets · needs +$168.18B to flip Tesla
ETH #89 of all assets · needs +$3.61B to flip Siemens
🍳 Crypto vs stocks, gold, everything. Not financial advice.
#CookingBNB #Crypto
🏆 CRYPTO vs THE WORLD
$BTC #15 of all assets · needs +$168.18B to flip Tesla
ETH #89 of all assets · needs +$3.61B to flip Siemens
🍳 Crypto vs stocks, gold, everything. Not financial advice.
#CookingBNB #Crypto
$BTC #15 of all assets · needs +$168.18B to flip Tesla
ETH #89 of all assets · needs +$3.61B to flip Siemens
🍳 Crypto vs stocks, gold, everything. Not financial advice.
#CookingBNB #Crypto
77
·
--
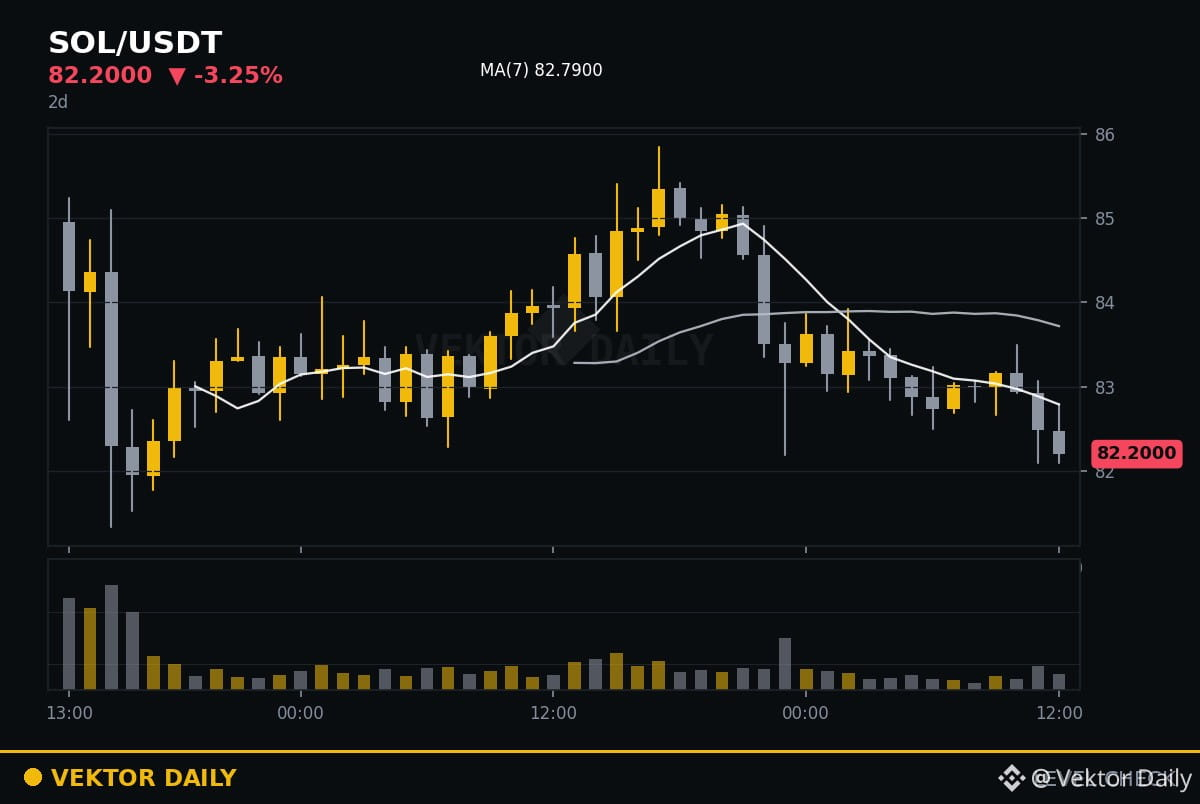
⚡ Level Check #15: $SOL
Now 82.22
24h high 85.85
24h low 82.10
Yesterday's check (#14, ETH): it stayed inside its range (2 006 to 2 109).
Series record: range held 3 of 14 days.
No prediction here, only where the edges are.
Does the range hold today?
Not financial advice.
#LevelCheck #VektorDaily
⚡ Level Check #15: $SOL
Now 82.22
24h high 85.85
24h low 82.10
Yesterday's check (#14, ETH): it stayed inside its range (2 006 to 2 109).
Series record: range held 3 of 14 days.
No prediction here, only where the edges are.
Does the range hold today?
Not financial advice.
#LevelCheck #VektorDaily
Now 82.22
24h high 85.85
24h low 82.10
Yesterday's check (#14, ETH): it stayed inside its range (2 006 to 2 109).
Series record: range held 3 of 14 days.
No prediction here, only where the edges are.
Does the range hold today?
Not financial advice.
#LevelCheck #VektorDaily
1
130

·
--
Chess Zeiss’s AI Trading Diary #15
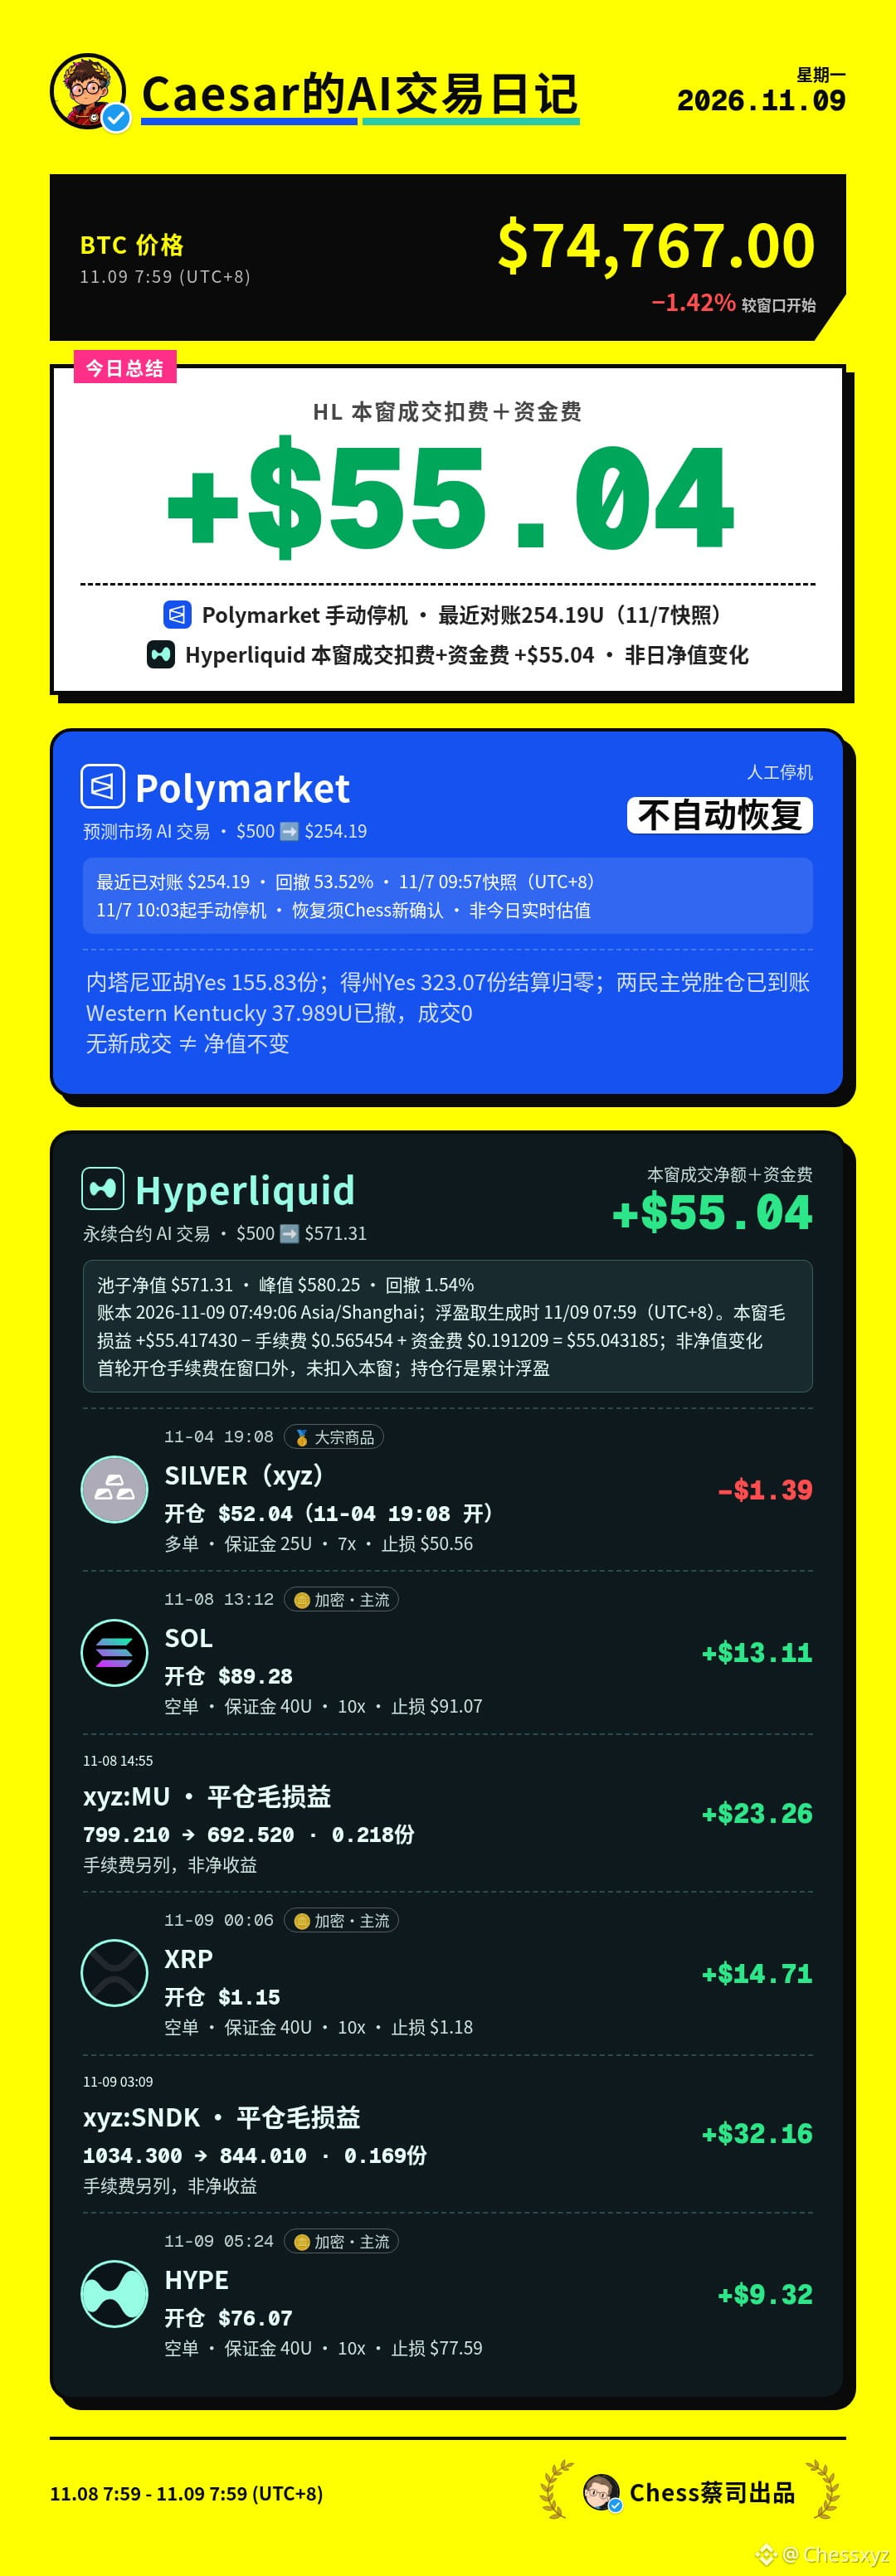
After correcting the books in the last episode, it’s time to lock in profits.
【Polymarket】
Still paused manually; it won’t resume automatically. The latest reconciled balance is still the 11/7 09:57 snapshot: 254.19U, with a 53.52% drawdown—not today’s real-time valuation. No new trades this period.
【Hyperliquid】
Period: 11/8 07:59→11/9 07:59. Ledger equity: $571.31; peak: $580.25; drawdown: 1.54%.
Net trade proceeds after fees and funding for this period were approximately +$55.04 (about $55.42 gross realized − $0.57 in fees + $0.19 in funding). This is a cash-flow figure, not the daily change in equity or a combined total for both platforms.
Two largest closed positions, profits locked in:
• MU short, 799.21→692.52, gross +$23.26
• SNDK short, 1034.30→844.01, gross +$32.16
Currently holding SILVER long (unrealized −$1.39), SOL short (unrealized +$13.11), XRP short (unrealized +$14.71), and HYPE short (unrealized +$9.32). The storage-stock shorts have been closed, replaced with crypto shorts.
This content was compiled from records of live trades made automatically by an AI Agent (AI-generated content). It is shared solely as a personal record and does not constitute investment advice. Markets involve risk; please make your own judgments.
#AI交易 #Hyperliquid #Polymarket #GrokBot
“Love, Death & Robots” 🩷☠️🤖
That’s a wrap for this episode!
Chess Zeiss’s AI Trading Diary #15
After correcting the books in the last episode, it’s time to lock in profits.
【Polymarket】
Still paused manually; it won’t resume automatically. The latest reconciled balance is still the 11/7 09:57 snapshot: 254.19U, with a 53.52% drawdown—not today’s real-time valuation. No new trades this period.
【Hyperliquid】
Period: 11/8 07:59→11/9 07:59. Ledger equity: $571.31; peak: $580.25; drawdown: 1.54%.
Net trade proceeds after fees and funding for this period were approximately +$55.04 (about $55.42 gross realized − $0.57 in fees + $0.19 in funding). This is a cash-flow figure, not the daily change in equity or a combined total for both platforms.
Two largest closed positions, profits locked in:
• MU short, 799.21→692.52, gross +$23.26
• SNDK short, 1034.30→844.01, gross +$32.16
Currently holding SILVER long (unrealized −$1.39), SOL short (unrealized +$13.11), XRP short (unrealized +$14.71), and HYPE short (unrealized +$9.32). The storage-stock shorts have been closed, replaced with crypto shorts.
This content was compiled from records of live trades made automatically by an AI Agent (AI-generated content). It is shared solely as a personal record and does not constitute investment advice. Markets involve risk; please make your own judgments.
#AI交易 #Hyperliquid #Polymarket #GrokBot
“Love, Death & Robots” 🩷☠️🤖
That’s a wrap for this episode!
After correcting the books in the last episode, it’s time to lock in profits.
【Polymarket】
Still paused manually; it won’t resume automatically. The latest reconciled balance is still the 11/7 09:57 snapshot: 254.19U, with a 53.52% drawdown—not today’s real-time valuation. No new trades this period.
【Hyperliquid】
Period: 11/8 07:59→11/9 07:59. Ledger equity: $571.31; peak: $580.25; drawdown: 1.54%.
Net trade proceeds after fees and funding for this period were approximately +$55.04 (about $55.42 gross realized − $0.57 in fees + $0.19 in funding). This is a cash-flow figure, not the daily change in equity or a combined total for both platforms.
Two largest closed positions, profits locked in:
• MU short, 799.21→692.52, gross +$23.26
• SNDK short, 1034.30→844.01, gross +$32.16
Currently holding SILVER long (unrealized −$1.39), SOL short (unrealized +$13.11), XRP short (unrealized +$14.71), and HYPE short (unrealized +$9.32). The storage-stock shorts have been closed, replaced with crypto shorts.
This content was compiled from records of live trades made automatically by an AI Agent (AI-generated content). It is shared solely as a personal record and does not constitute investment advice. Markets involve risk; please make your own judgments.
#AI交易 #Hyperliquid #Polymarket #GrokBot
“Love, Death & Robots” 🩷☠️🤖
That’s a wrap for this episode!
687

·
--
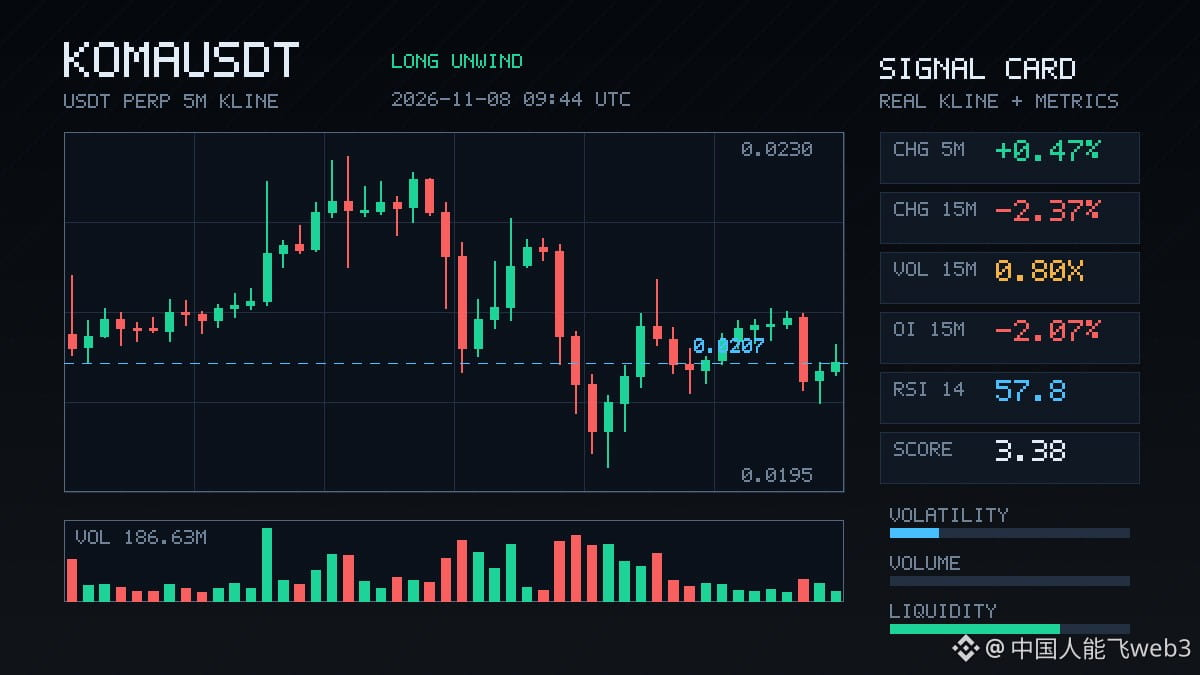
This decline at $KOMA is a little different from previous ones. The price fell 2.37%, but OI declined on both the 15m and 1h timeframes, by 2.07% and 1.31%, respectively. The combined notional change represents a decrease of more than 1 million USDT. This looks more like longs actively deleveraging and exiting via stop-losses, rather than new shorts entering and driving the price down. The aggressive trade delta is -8.2%, and the buy/sell ratio is 0.85, so selling pressure is definitely present. But volume is only 0.80x, suggesting there hasn't been a major wave of panic selling. The OI anomaly percentile has reached 94.2%, ranking #15 across the entire pool, and has remained in the extreme zone for several consecutive timeframes. This kind of contraction in positions often means sentiment is being flushed out. 24h trading volume is still 132M, so liquidity isn't bad. Let's see when this round of deleveraging stabilizes.
This decline at $KOMA is a little different from previous ones. The price fell 2.37%, but OI declined on both the 15m and 1h timeframes, by 2.07% and 1.31%, respectively. The combined notional change represents a decrease of more than 1 million USDT. This looks more like longs actively deleveraging and exiting via stop-losses, rather than new shorts entering and driving the price down. The aggressive trade delta is -8.2%, and the buy/sell ratio is 0.85, so selling pressure is definitely present. But volume is only 0.80x, suggesting there hasn't been a major wave of panic selling. The OI anomaly percentile has reached 94.2%, ranking #15 across the entire pool, and has remained in the extreme zone for several consecutive timeframes. This kind of contraction in positions often means sentiment is being flushed out. 24h trading volume is still 132M, so liquidity isn't bad. Let's see when this round of deleveraging stabilizes.
5

·
--
$XPL ’s drop is pretty interesting—the price is falling while OI is rising, strongly suggesting new leveraged shorts are entering. 15m volume surged to 3.89x, taker volume delta was -34.9%, and the buy/sell ratio was 0.48, clearly pointing to selling pressure. The close also broke below the lows of the last 20 or so 5m candles, so structurally, it has broken out of the recent range. The OI anomaly percentile is 88.1%, ranking #15 across the entire pool, and it has persisted for several consecutive periods rather than being a fleeting blip. 24h trading volume is only a little over 13M, so liquidity is thin. This volume spike is worth watching to see whether it triggers any knock-on effects.
$XPL ’s drop is pretty interesting—the price is falling while OI is rising, strongly suggesting new leveraged shorts are entering. 15m volume surged to 3.89x, taker volume delta was -34.9%, and the buy/sell ratio was 0.48, clearly pointing to selling pressure. The close also broke below the lows of the last 20 or so 5m candles, so structurally, it has broken out of the recent range. The OI anomaly percentile is 88.1%, ranking #15 across the entire pool, and it has persisted for several consecutive periods rather than being a fleeting blip. 24h trading volume is only a little over 13M, so liquidity is thin. This volume spike is worth watching to see whether it triggers any knock-on effects.
20
·
--
$JCT This move: the 15m price broke below the lower edge of the past 20 5m ranges, volume rose to 1.9x, and the buy/sell ratio was 0.59—aggressive selling pressure is very real.
But look at OI: -0.07% over 15m, -0.26% over 1h, with notional shrinking by just over $370K. Price fell and open interest declined, so this isn't new shorts entering to drive the sell-off. It looks more like longs couldn't hold on and are deleveraging, with stop-losses being swept.
It ranked #38 for anomalies across the entire pool and #15 for notional change, which shows the move wasn't small. But structurally, this is position reduction rather than shorts adding to their positions. Sometimes this kind of drop actually clears things out—after shaking out weak hands, let's see whether price can stabilize near the lower edge of the range.
$JCT This move: the 15m price broke below the lower edge of the past 20 5m ranges, volume rose to 1.9x, and the buy/sell ratio was 0.59—aggressive selling pressure is very real.
But look at OI: -0.07% over 15m, -0.26% over 1h, with notional shrinking by just over $370K. Price fell and open interest declined, so this isn't new shorts entering to drive the sell-off. It looks more like longs couldn't hold on and are deleveraging, with stop-losses being swept.
It ranked #38 for anomalies across the entire pool and #15 for notional change, which shows the move wasn't small. But structurally, this is position reduction rather than shorts adding to their positions. Sometimes this kind of drop actually clears things out—after shaking out weak hands, let's see whether price can stabilize near the lower edge of the range.
But look at OI: -0.07% over 15m, -0.26% over 1h, with notional shrinking by just over $370K. Price fell and open interest declined, so this isn't new shorts entering to drive the sell-off. It looks more like longs couldn't hold on and are deleveraging, with stop-losses being swept.
It ranked #38 for anomalies across the entire pool and #15 for notional change, which shows the move wasn't small. But structurally, this is position reduction rather than shorts adding to their positions. Sometimes this kind of drop actually clears things out—after shaking out weak hands, let's see whether price can stabilize near the lower edge of the range.
1

·
--
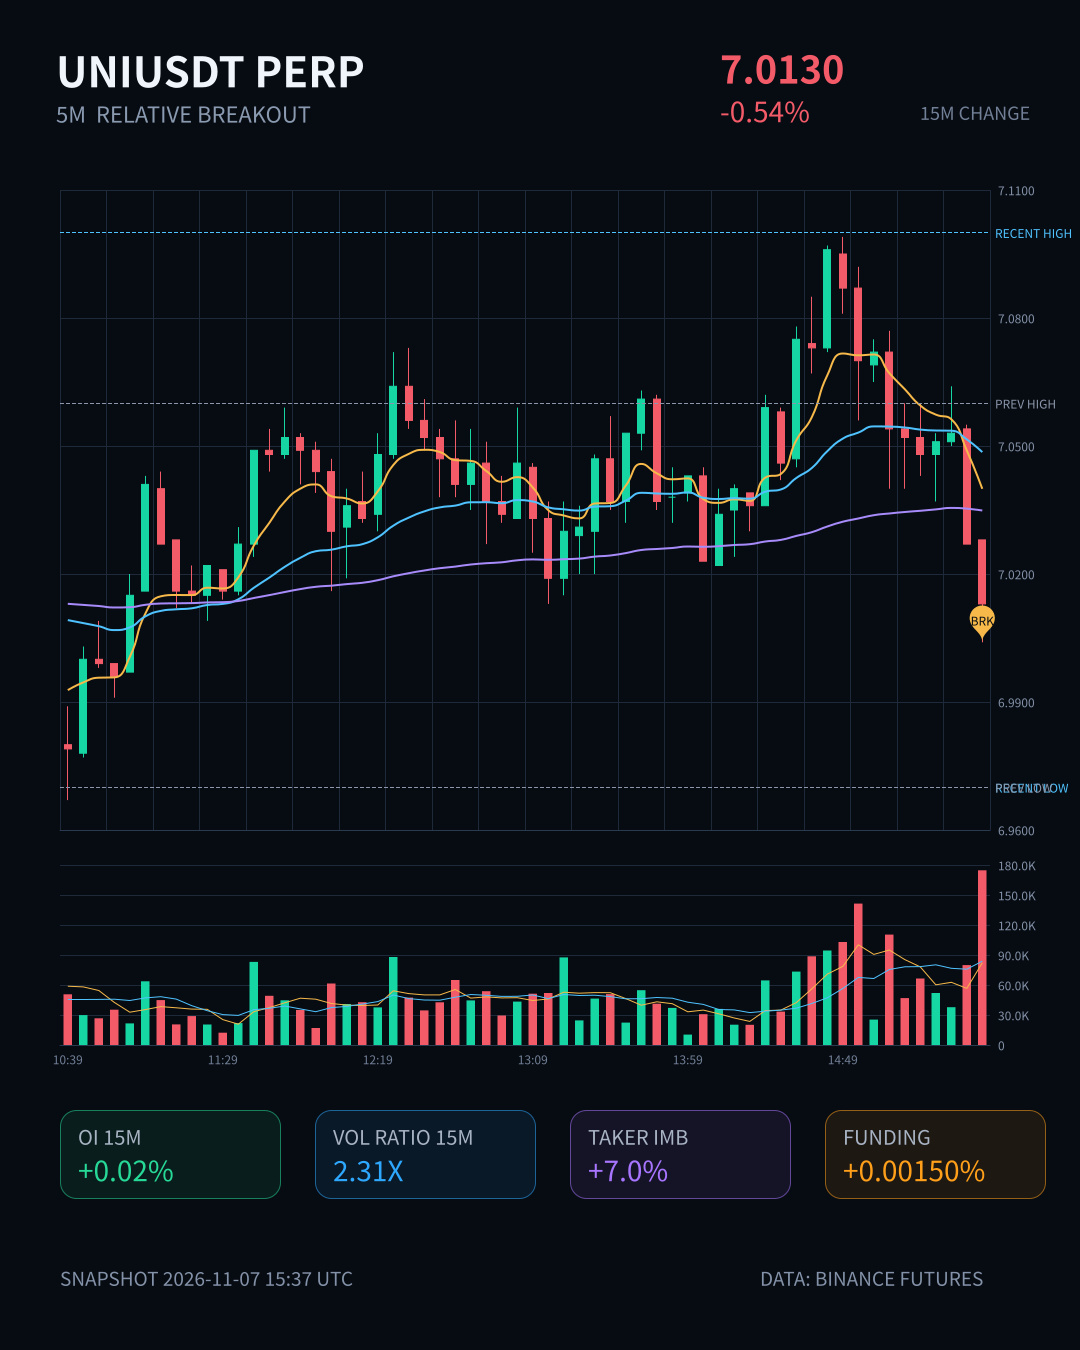
$UNI This 15m move is pretty interesting—the price is down just 0.54%, which doesn’t look like much, but volume jumped straight to 2.31x, and the close also fell below the lower bound of the last nearly 20 5m candles’ range.
OI hasn’t shrunk noticeably. Combined with the price decline, this looks more like new shorts entering with leverage than longs collectively throwing in the towel. The anomaly percentile is 81%; it ranks #15 across the whole pool and #6 for notional change, so liquidity is definitely clustering around this level.
The aggressive trade imbalance is 7%, and the buy/sell ratio is 1.15, so bulls haven’t completely given up either. The key is whether price can reclaim the range low after breaking below it. With $105M in daily trading volume behind it, any decisive move won’t be subtle.
For now, keep an eye on the lower bound of this 5m range.
$UNI This 15m move is pretty interesting—the price is down just 0.54%, which doesn’t look like much, but volume jumped straight to 2.31x, and the close also fell below the lower bound of the last nearly 20 5m candles’ range.
OI hasn’t shrunk noticeably. Combined with the price decline, this looks more like new shorts entering with leverage than longs collectively throwing in the towel. The anomaly percentile is 81%; it ranks #15 across the whole pool and #6 for notional change, so liquidity is definitely clustering around this level.
The aggressive trade imbalance is 7%, and the buy/sell ratio is 1.15, so bulls haven’t completely given up either. The key is whether price can reclaim the range low after breaking below it. With $105M in daily trading volume behind it, any decisive move won’t be subtle.
For now, keep an eye on the lower bound of this 5m range.
OI hasn’t shrunk noticeably. Combined with the price decline, this looks more like new shorts entering with leverage than longs collectively throwing in the towel. The anomaly percentile is 81%; it ranks #15 across the whole pool and #6 for notional change, so liquidity is definitely clustering around this level.
The aggressive trade imbalance is 7%, and the buy/sell ratio is 1.15, so bulls haven’t completely given up either. The key is whether price can reclaim the range low after breaking below it. With $105M in daily trading volume behind it, any decisive move won’t be subtle.
For now, keep an eye on the lower bound of this 5m range.
55
·
--
The Japanese, U.S., Indian, and Australian “Malabar” exercise—submariners better be on their toes!
Word is that Japan, the U.S., India, and Australia are holding a major “Malabar” exercise in Yokosuka, Kanagawa. With anti-submarine warfare and surface-ship operations underway, submariners had better watch out—this is no joke! #MalabarJointExercise#15
The Japanese, U.S., Indian, and Australian “Malabar” exercise—submariners better be on their toes!
Word is that Japan, the U.S., India, and Australia are holding a major “Malabar” exercise in Yokosuka, Kanagawa. With anti-submarine warfare and surface-ship operations underway, submariners had better watch out—this is no joke! #MalabarJointExercise#15
Word is that Japan, the U.S., India, and Australia are holding a major “Malabar” exercise in Yokosuka, Kanagawa. With anti-submarine warfare and surface-ship operations underway, submariners had better watch out—this is no joke! #MalabarJointExercise#15
77

·
--
The Japan-U.S.-India-Australia “Malabar” exercise—submariners, you’d better be nervous!
I hear Japan, the U.S., India, and Australia held a major “Malabar” exercise in Yokosuka, Kanagawa, involving anti-submarine and anti-surface warfare. Submariners, you’d better watch out—this is no joke! #MalabarJointExercise#15
The Japan-U.S.-India-Australia “Malabar” exercise—submariners, you’d better be nervous!
I hear Japan, the U.S., India, and Australia held a major “Malabar” exercise in Yokosuka, Kanagawa, involving anti-submarine and anti-surface warfare. Submariners, you’d better watch out—this is no joke! #MalabarJointExercise#15
I hear Japan, the U.S., India, and Australia held a major “Malabar” exercise in Yokosuka, Kanagawa, involving anti-submarine and anti-surface warfare. Submariners, you’d better watch out—this is no joke! #MalabarJointExercise#15
77

Article
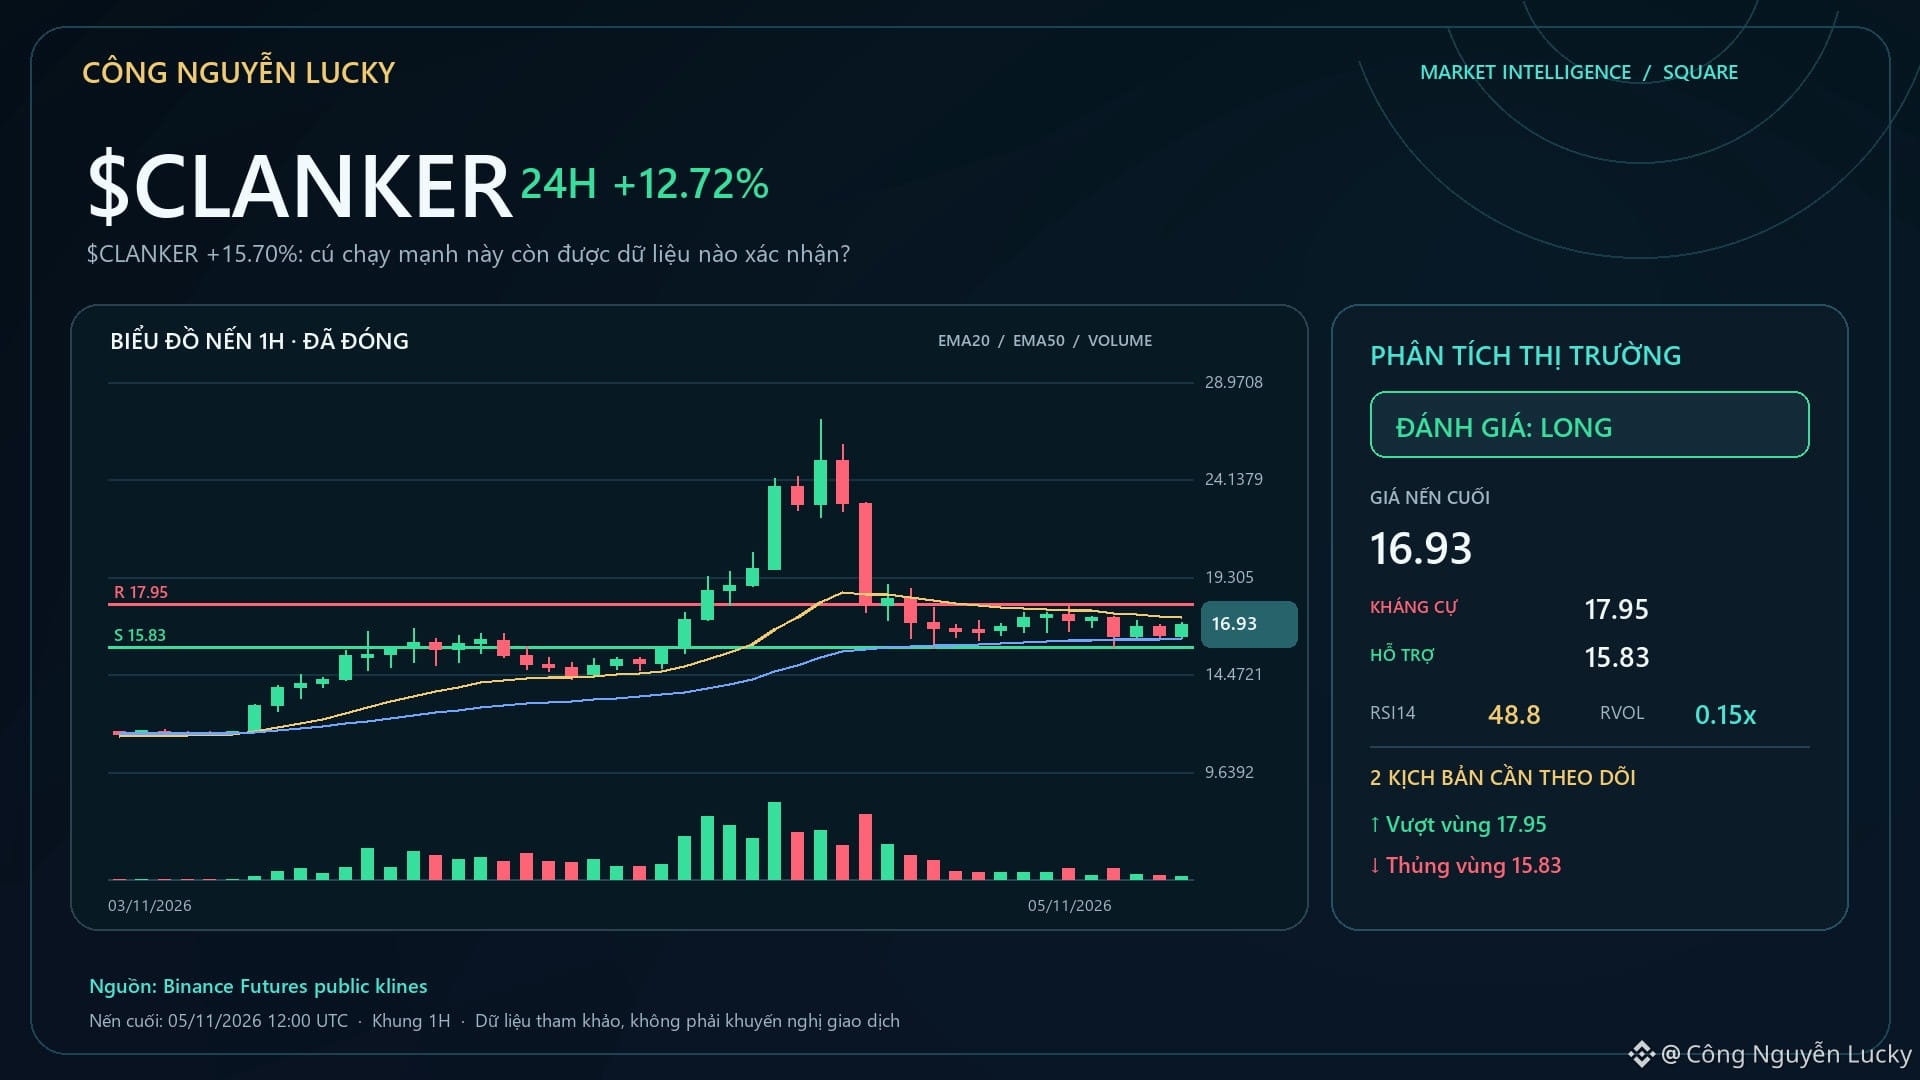
$CLANKER +15.70%: What else confirms this strong run?🔥 $CLANKER is up +15.70% — but the percentage change alone isn't enough to call this a good setup. 1️⃣ +15.70% — 24h change.
2️⃣ 431.9M USDT — 24h quote volume.
3️⃣ 20/100 — position within the daily range. A high number doesn't automatically make it a setup. What to confirm next:
• Breaking above 27.1 with expanding volume would make the continuation scenario more credible.
• Failing to hold the highs and falling back below the 21.02 midpoint would make the cooling-off scenario more evident. 🧭 Current bias: **LONG · STRONG · 87/100**.
$CLANKER +15.70%: What else confirms this strong run?
🔥 $CLANKER is up +15.70% — but the percentage change alone isn't enough to call this a good setup. 1️⃣ +15.70% — 24h change.
2️⃣ 431.9M USDT — 24h quote volume.
3️⃣ 20/100 — position within the daily range. A high number doesn't automatically make it a setup. What to confirm next:
• Breaking above 27.1 with expanding volume would make the continuation scenario more credible.
• Failing to hold the highs and falling back below the 21.02 midpoint would make the cooling-off scenario more evident. 🧭 Current bias: **LONG · STRONG · 87/100**.
2️⃣ 431.9M USDT — 24h quote volume.
3️⃣ 20/100 — position within the daily range. A high number doesn't automatically make it a setup. What to confirm next:
• Breaking above 27.1 with expanding volume would make the continuation scenario more credible.
• Failing to hold the highs and falling back below the 21.02 midpoint would make the cooling-off scenario more evident. 🧭 Current bias: **LONG · STRONG · 87/100**.
289
Article
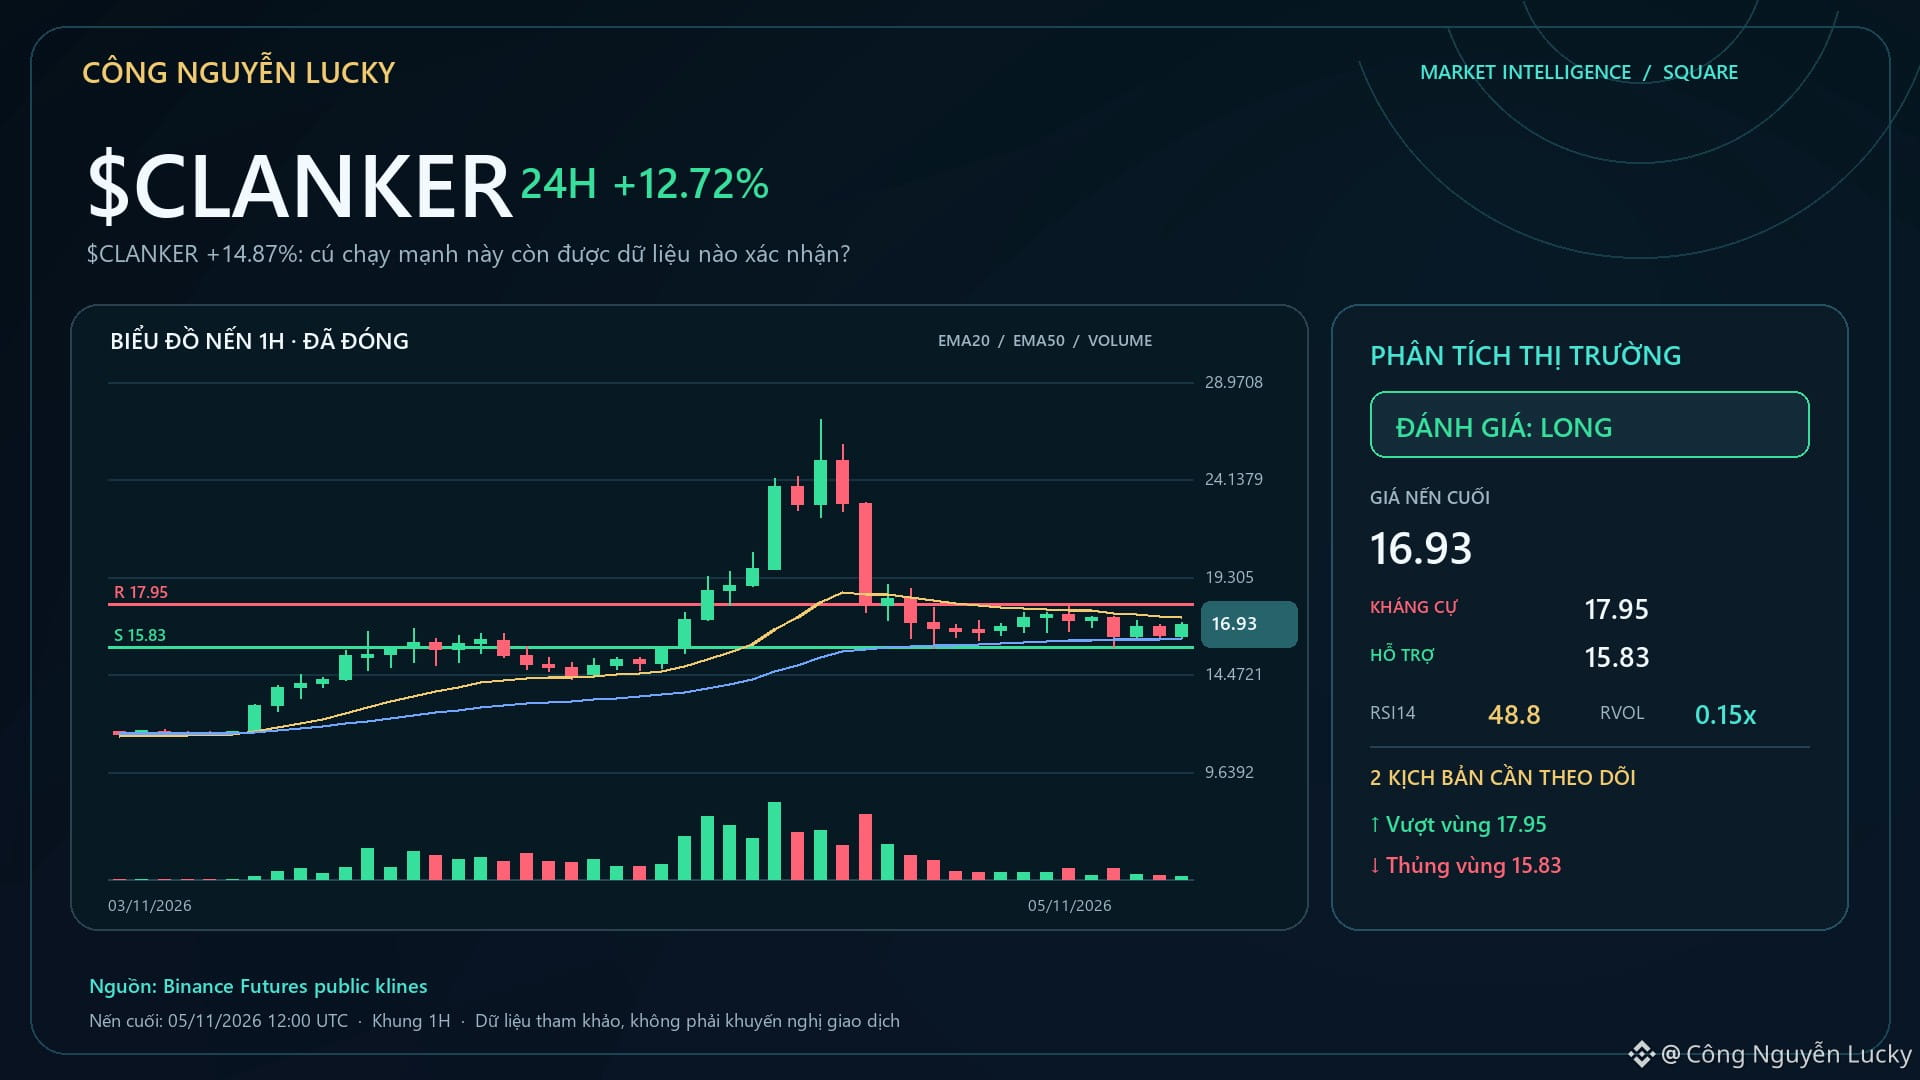
$CLANKER +14.87%: What data confirms this strong rally?🔎 $CLANKER: here’s a brief market note, keeping only verifiable facts. • 17.15 · 24h +14.87% · volume ~432.3M USDT · 4,007,749 trades. Condition for raising conviction: A break above 27.1 with expanding volume would make the continuation scenario more credible.
What would make me reconsider: Failing to hold the highs and falling back below the midpoint of 20.935 would make the cooling-off scenario more likely. 🧭 Current outlook: **LONG · STRONG · 87/100**.
$CLANKER +14.87%: What data confirms this strong rally?
🔎 $CLANKER : here’s a brief market note, keeping only verifiable facts. • 17.15 · 24h +14.87% · volume ~432.3M USDT · 4,007,749 trades. Condition for raising conviction: A break above 27.1 with expanding volume would make the continuation scenario more credible.
What would make me reconsider: Failing to hold the highs and falling back below the midpoint of 20.935 would make the cooling-off scenario more likely. 🧭 Current outlook: **LONG · STRONG · 87/100**.
What would make me reconsider: Failing to hold the highs and falling back below the midpoint of 20.935 would make the cooling-off scenario more likely. 🧭 Current outlook: **LONG · STRONG · 87/100**.
288

·
--
$ZRO This drop is interesting: the price fell 1.13%, but OI also declined, with a notional change of -510K. This looks more like longs actively deleveraging and exiting via stop-losses than a major wave of shorts entering to drive the price down.
The 15m taker flow imbalance is -14.4%, the buy/sell ratio is 0.75, and the close fell below the lower bound of the recent 20-candle 5m range, so the short-term structure is weak. However, the OI anomaly percentile is still at 90.1%, ranking #15 across the entire pool, and has remained elevated over several consecutive periods. This suggests leveraged positions have not yet been fully flushed out, and the funding rate is also still in a high percentile relative to recent levels.
24h trading volume is 67M, and market depth is not bad. But with this combination of falling prices and declining OI, be careful about chasing shorts in case of a rebound after long deleveraging runs its course. Wait for the OI anomaly percentile to fall and the taker flow imbalance to narrow before considering a direction. There is no need to rush in now.
$ZRO This drop is interesting: the price fell 1.13%, but OI also declined, with a notional change of -510K. This looks more like longs actively deleveraging and exiting via stop-losses than a major wave of shorts entering to drive the price down.
The 15m taker flow imbalance is -14.4%, the buy/sell ratio is 0.75, and the close fell below the lower bound of the recent 20-candle 5m range, so the short-term structure is weak. However, the OI anomaly percentile is still at 90.1%, ranking #15 across the entire pool, and has remained elevated over several consecutive periods. This suggests leveraged positions have not yet been fully flushed out, and the funding rate is also still in a high percentile relative to recent levels.
24h trading volume is 67M, and market depth is not bad. But with this combination of falling prices and declining OI, be careful about chasing shorts in case of a rebound after long deleveraging runs its course. Wait for the OI anomaly percentile to fall and the taker flow imbalance to narrow before considering a direction. There is no need to rush in now.
The 15m taker flow imbalance is -14.4%, the buy/sell ratio is 0.75, and the close fell below the lower bound of the recent 20-candle 5m range, so the short-term structure is weak. However, the OI anomaly percentile is still at 90.1%, ranking #15 across the entire pool, and has remained elevated over several consecutive periods. This suggests leveraged positions have not yet been fully flushed out, and the funding rate is also still in a high percentile relative to recent levels.
24h trading volume is 67M, and market depth is not bad. But with this combination of falling prices and declining OI, be careful about chasing shorts in case of a rebound after long deleveraging runs its course. Wait for the OI anomaly percentile to fall and the taker flow imbalance to narrow before considering a direction. There is no need to rush in now.
6
Log in to explore more content
Join global crypto users on Binance Square
⚡️ Get latest and useful information about crypto.
💬 Trusted by the world’s largest crypto exchange.
👍 Discover real insights from verified creators.
Email / Phone number
Trending Topics
1
#NvidiaLoses$2.7TrillionInMonthAndAHalf
16,477 views
111 Discussing
2
#CanBTCReboundAfterFallingBelow60K?
728,345 views
2,918 Discussing
3
#GlobalStocksFaceLongestLosingStreakSince2023
265,205 views
1,959 Discussing
4
#BlackRockIBITPostsRecord$541MSingleDayOutflow
30,570 views
88 Discussing
5
#AnthropicPlungesTowardIPOPriceonDay2
133,724 views
1,188 Discussing
6
#TwentyOneCapitalAdds172.25BTC
61,462 views
647 Discussing
7
#HKBillWouldExcludeTokenizedDepositsFromVirtualAssets
7,591 views
50 Discussing
8
#BNBDropsBelow540USDTWith8.46%DailyDecline
73,600 views
635 Discussing
9
#HKBillProposesHK$100KFineForUnauthorizedCryptoTitles
2,468 views
22 Discussing
10
#BitMineFaces$10.1BUnrealizedETHLoss
5,116 views
27 Discussing