
#14
14
20,671 views
479 Discussing
Hot
Latest

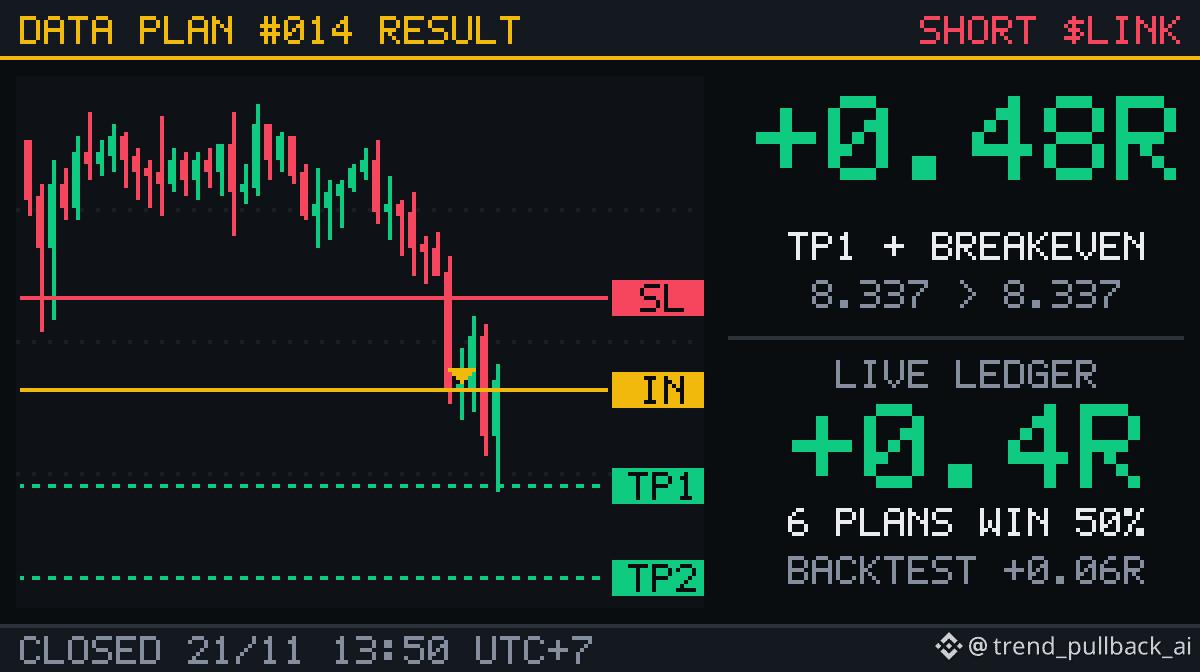
🏁 PLAN #14 · SHORT $LINK: TP1 + BREAKEVEN · +0.48R
Entry 8.337 at 23:00 20/11 → exit 8.337 at 13:50 21/11 (fees included)
First half out at 7.987 (1R), second half came back to entry and closed flat.
Ledger: 6 closed plans, 50% winners, +0.4R total.
Backtest expectation +0.06R per plan. Every plan counts, losers included.
The next plan only goes out when the data gives a signal that passes the bar. Follow to get it.
$LINK #LINK #TradingPlan #KeHoachDuLieu
🏁 PLAN #14 · SHORT $LINK : TP1 + BREAKEVEN · +0.48R
Entry 8.337 at 23:00 20/11 → exit 8.337 at 13:50 21/11 (fees included)
First half out at 7.987 (1R), second half came back to entry and closed flat.
Ledger: 6 closed plans, 50% winners, +0.4R total.
Backtest expectation +0.06R per plan. Every plan counts, losers included.
The next plan only goes out when the data gives a signal that passes the bar. Follow to get it.
$LINK #LINK #TradingPlan #KeHoachDuLieu
Entry 8.337 at 23:00 20/11 → exit 8.337 at 13:50 21/11 (fees included)
First half out at 7.987 (1R), second half came back to entry and closed flat.
Ledger: 6 closed plans, 50% winners, +0.4R total.
Backtest expectation +0.06R per plan. Every plan counts, losers included.
The next plan only goes out when the data gives a signal that passes the bar. Follow to get it.
$LINK #LINK #TradingPlan #KeHoachDuLieu
37


bonuz explained #14 🌴
who is behind bonuz?
our founder Matthias Mende, Professor Mende here on Square, has lived in Dubai since 2007. he co founded the Dubai Blockchain Center.
he knows this city, and you can feel it in Gamify Dubai.
on 1 December he keynotes Blockchain Life in Dubai, about real world quests.
will you be in the room? 👇
bonuz explained #14 🌴
who is behind bonuz?
our founder Matthias Mende, Professor Mende here on Square, has lived in Dubai since 2007. he co founded the Dubai Blockchain Center.
he knows this city, and you can feel it in Gamify Dubai.
on 1 December he keynotes Blockchain Life in Dubai, about real world quests.
will you be in the room? 👇
who is behind bonuz?
our founder Matthias Mende, Professor Mende here on Square, has lived in Dubai since 2007. he co founded the Dubai Blockchain Center.
he knows this city, and you can feel it in Gamify Dubai.
on 1 December he keynotes Blockchain Life in Dubai, about real world quests.
will you be in the room? 👇
88

·
--
Wang Xiaolou’s Trading Journal #14
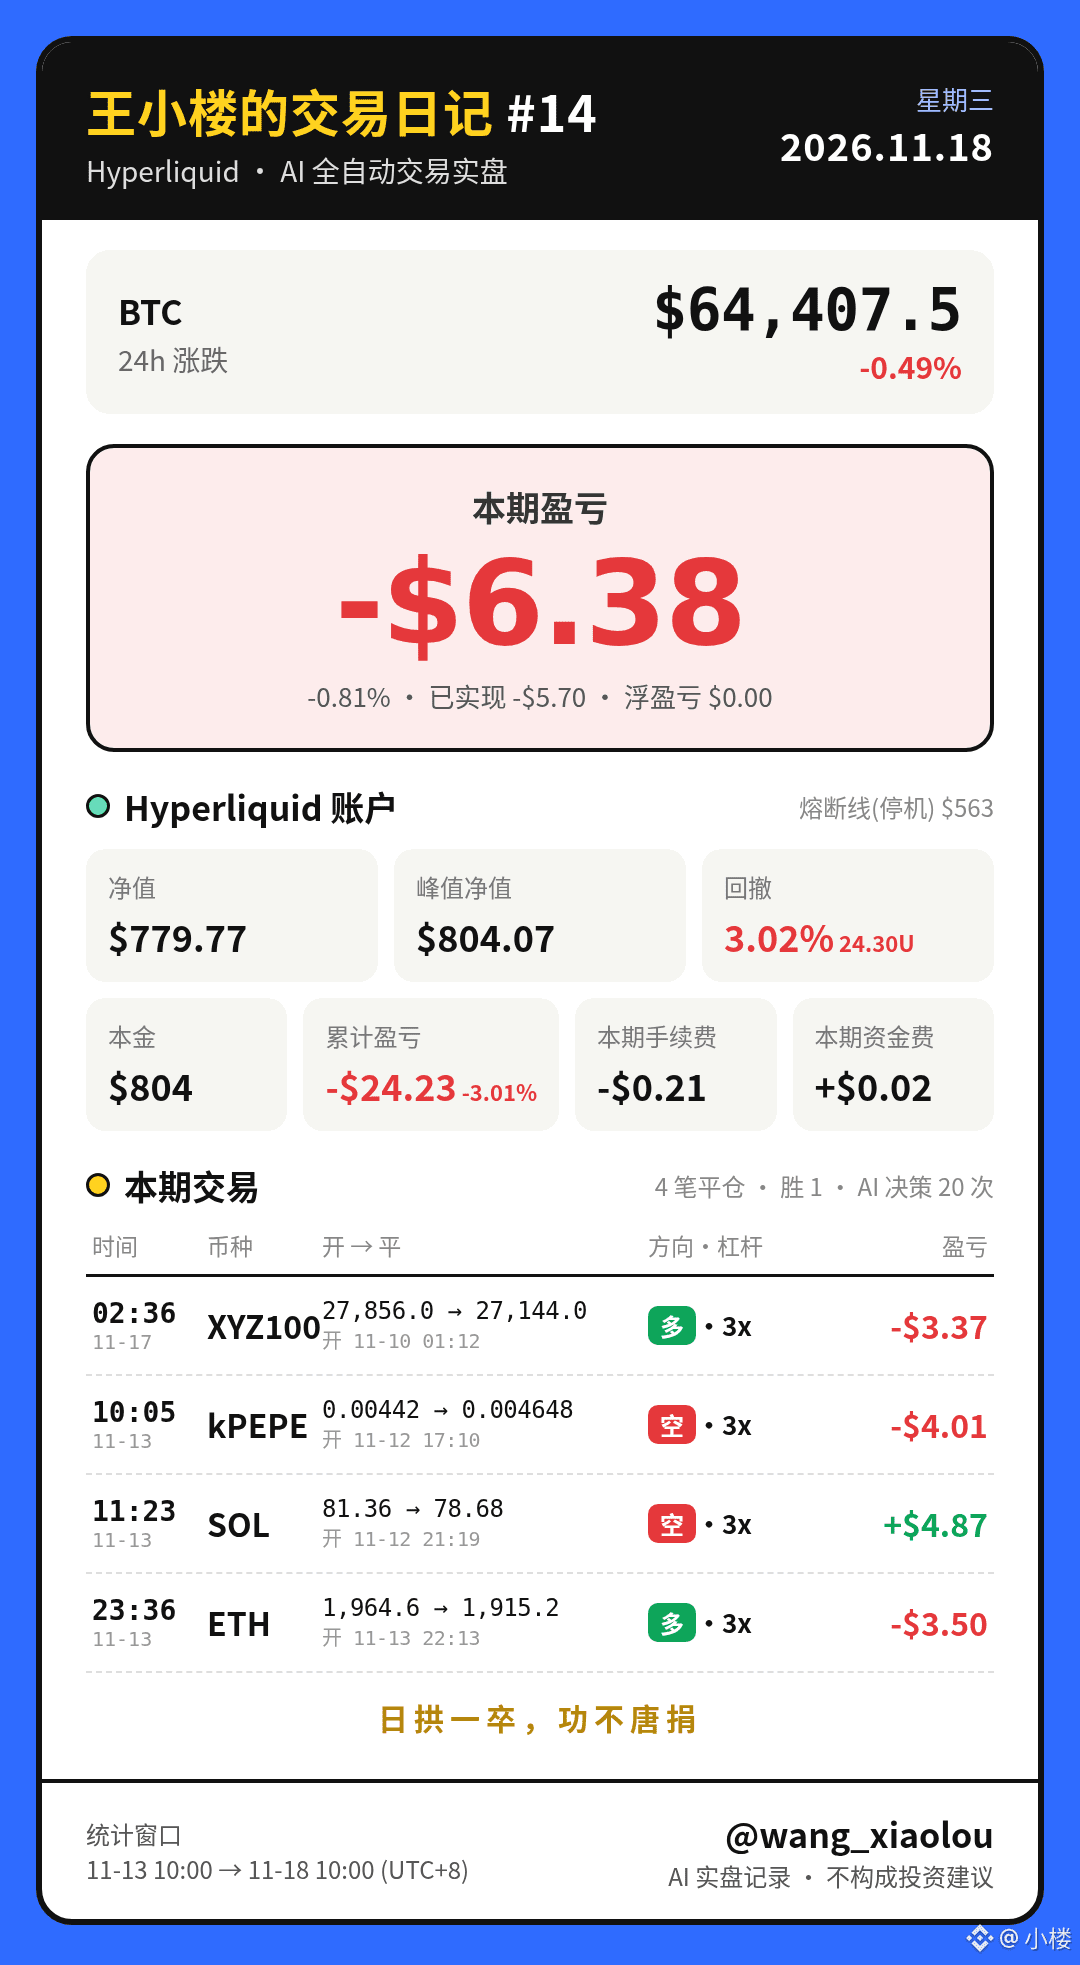
Four closed trades: one win and three losses. Net asset value: 779.77U, down 6.38U this period. Now flat and waiting.
📅 Trading period: 2026-11-13 10:00 — 2026-11-18 10:00 (Shanghai)
No updates were issued for the periods on 11-15 and 11-16, so this period’s window starts from the previous update, #13 (11-13 10:00).
Ending net asset value: 779.77U (opening snapshot: 786.16U, 11-13 10:14), down 6.38U (−0.81%) this period. Realized PnL: −5.70U; unrealized PnL: 0.00U; fees: −0.21U; funding: +0.02U. Cumulative PnL: −24.23U (−3.01%).
Peak: 804.07U · Drawdown: 3.02% (24.30U)
Trade by trade:
Short kPEPE 0.00442→0.004648 (3x), −4.01U (stop-loss)
Short SOL 81.365→78.682 (3x), +4.87U (take-profit)
Long ETH 1964.6→1915.2 (3x), −3.50U (stop-loss)
Long XYZ100 (U.S. stocks) 27856→27144 (3x), −3.37U (stop-loss)
AI’s reasoning: The kPEPE and SOL shorts carried over from the previous period were closed at a stop-loss and take-profit, respectively. On the evening of the 13th, a trend-following ETH long was opened based on 1h+4h alignment, but it hit its stop-loss that same day. The XYZ100 (U.S. stocks) long never reached the 1R reduction point, and the account went flat after the stop-loss was triggered in the early hours of the 17th. After that, no new positions were opened: price was repeatedly near 24h highs or lows, nearby structure for a 1.5R take-profit was lacking, or tech-stock group constraints and U.S. market closures prevented entries. Funds remained in cash while waiting.
Day 19 of AI live trading. See you next time!
Steady progress, one step at a time; no effort is ever wasted.
Wang Xiaolou’s Trading Journal #14
Four closed trades: one win and three losses. Net asset value: 779.77U, down 6.38U this period. Now flat and waiting.
📅 Trading period: 2026-11-13 10:00 — 2026-11-18 10:00 (Shanghai)
No updates were issued for the periods on 11-15 and 11-16, so this period’s window starts from the previous update, #13 (11-13 10:00).
Ending net asset value: 779.77U (opening snapshot: 786.16U, 11-13 10:14), down 6.38U (−0.81%) this period. Realized PnL: −5.70U; unrealized PnL: 0.00U; fees: −0.21U; funding: +0.02U. Cumulative PnL: −24.23U (−3.01%).
Peak: 804.07U · Drawdown: 3.02% (24.30U)
Trade by trade:
Short kPEPE 0.00442→0.004648 (3x), −4.01U (stop-loss)
Short SOL 81.365→78.682 (3x), +4.87U (take-profit)
Long ETH 1964.6→1915.2 (3x), −3.50U (stop-loss)
Long XYZ100 (U.S. stocks) 27856→27144 (3x), −3.37U (stop-loss)
AI’s reasoning: The kPEPE and SOL shorts carried over from the previous period were closed at a stop-loss and take-profit, respectively. On the evening of the 13th, a trend-following ETH long was opened based on 1h+4h alignment, but it hit its stop-loss that same day. The XYZ100 (U.S. stocks) long never reached the 1R reduction point, and the account went flat after the stop-loss was triggered in the early hours of the 17th. After that, no new positions were opened: price was repeatedly near 24h highs or lows, nearby structure for a 1.5R take-profit was lacking, or tech-stock group constraints and U.S. market closures prevented entries. Funds remained in cash while waiting.
Day 19 of AI live trading. See you next time!
Steady progress, one step at a time; no effort is ever wasted.
Four closed trades: one win and three losses. Net asset value: 779.77U, down 6.38U this period. Now flat and waiting.
📅 Trading period: 2026-11-13 10:00 — 2026-11-18 10:00 (Shanghai)
No updates were issued for the periods on 11-15 and 11-16, so this period’s window starts from the previous update, #13 (11-13 10:00).
Ending net asset value: 779.77U (opening snapshot: 786.16U, 11-13 10:14), down 6.38U (−0.81%) this period. Realized PnL: −5.70U; unrealized PnL: 0.00U; fees: −0.21U; funding: +0.02U. Cumulative PnL: −24.23U (−3.01%).
Peak: 804.07U · Drawdown: 3.02% (24.30U)
Trade by trade:
Short kPEPE 0.00442→0.004648 (3x), −4.01U (stop-loss)
Short SOL 81.365→78.682 (3x), +4.87U (take-profit)
Long ETH 1964.6→1915.2 (3x), −3.50U (stop-loss)
Long XYZ100 (U.S. stocks) 27856→27144 (3x), −3.37U (stop-loss)
AI’s reasoning: The kPEPE and SOL shorts carried over from the previous period were closed at a stop-loss and take-profit, respectively. On the evening of the 13th, a trend-following ETH long was opened based on 1h+4h alignment, but it hit its stop-loss that same day. The XYZ100 (U.S. stocks) long never reached the 1R reduction point, and the account went flat after the stop-loss was triggered in the early hours of the 17th. After that, no new positions were opened: price was repeatedly near 24h highs or lows, nearby structure for a 1.5R take-profit was lacking, or tech-stock group constraints and U.S. market closures prevented entries. Funds remained in cash while waiting.
Day 19 of AI live trading. See you next time!
Steady progress, one step at a time; no effort is ever wasted.
284

·
--
10-year at 5.13% — highest since mid-October. That's what pushed BTC to #14 with a $1.39T cap, down 6.8% while the 2-year posted its biggest two-session jump since March 2023. Macro wreck or whale panic?
10-year at 5.13% — highest since mid-October. That's what pushed BTC to #14 with a $1.39T cap, down 6.8% while the 2-year posted its biggest two-session jump since March 2023. Macro wreck or whale panic?
33

·
--
$956 → $3192: ZEC since 2016‑10‑28
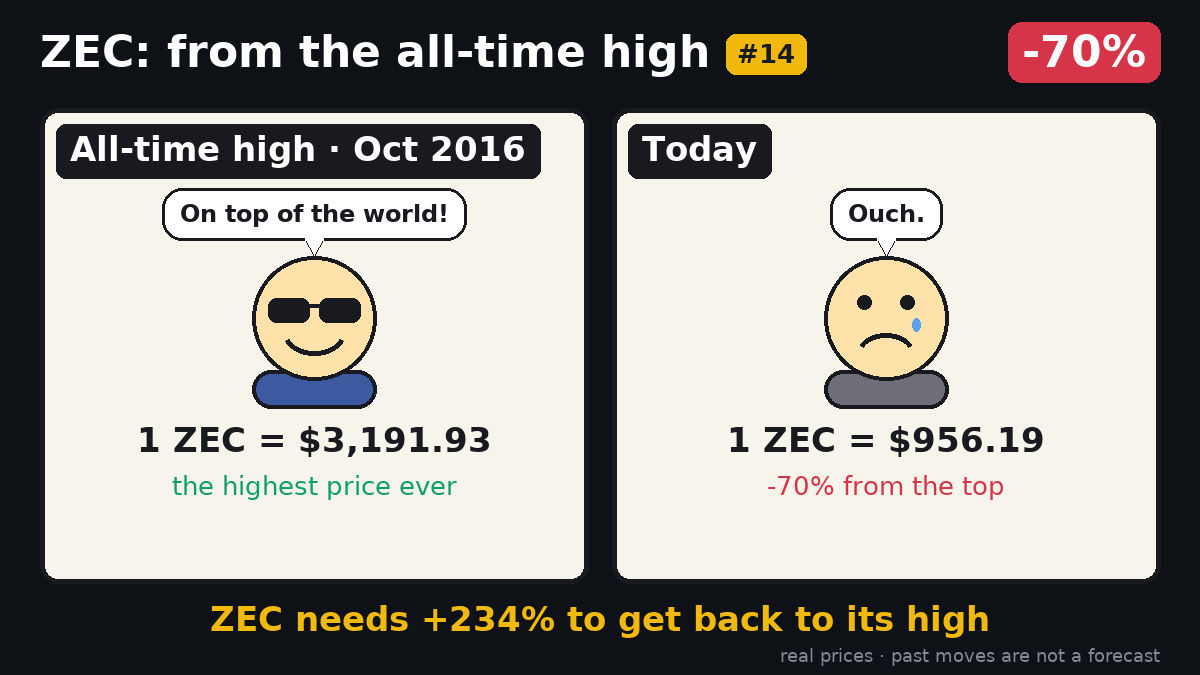
ZEC sits at $956, a 70% drop from its $3,191.93 all‑time high recorded in October 2016. To reclaim that peak, a 234% climb is required.
Past moves say nothing about the next ones. The price gap highlights how volatile legacy privacy coins can be, reminding holders to weigh risk versus potential upside.
💬 Back?
🎨 From the Top #14 · a new one every morning
$ZEC
#ZEC
$956 → $3192: ZEC since 2016‑10‑28
ZEC sits at $956, a 70% drop from its $3,191.93 all‑time high recorded in October 2016. To reclaim that peak, a 234% climb is required.
Past moves say nothing about the next ones. The price gap highlights how volatile legacy privacy coins can be, reminding holders to weigh risk versus potential upside.
💬 Back?
🎨 From the Top #14 · a new one every morning
$ZEC
#ZEC
ZEC sits at $956, a 70% drop from its $3,191.93 all‑time high recorded in October 2016. To reclaim that peak, a 234% climb is required.
Past moves say nothing about the next ones. The price gap highlights how volatile legacy privacy coins can be, reminding holders to weigh risk versus potential upside.
💬 Back?
🎨 From the Top #14 · a new one every morning
$ZEC
#ZEC
53

·
--
⚡ Level Check #15: $SOL
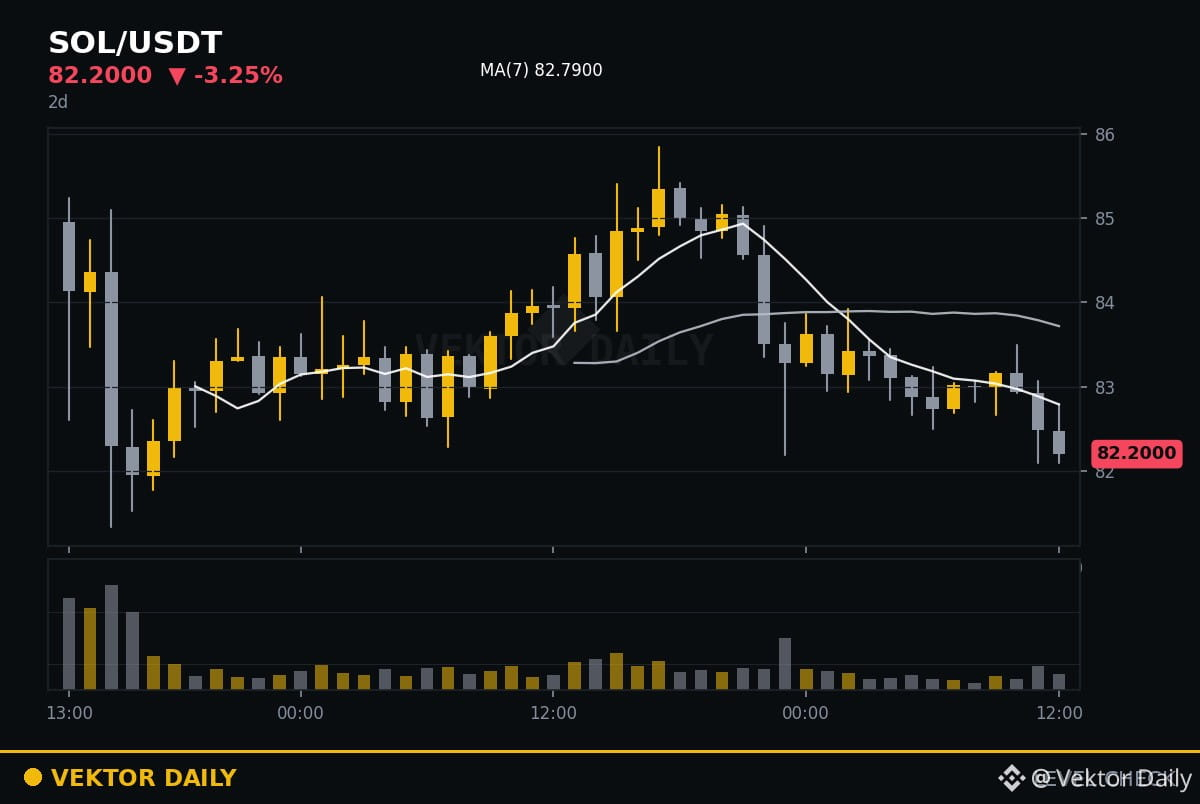
Now 82.22
24h high 85.85
24h low 82.10
Yesterday's check (#14, ETH): it stayed inside its range (2 006 to 2 109).
Series record: range held 3 of 14 days.
No prediction here, only where the edges are.
Does the range hold today?
Not financial advice.
#LevelCheck #VektorDaily
⚡ Level Check #15: $SOL
Now 82.22
24h high 85.85
24h low 82.10
Yesterday's check (#14, ETH): it stayed inside its range (2 006 to 2 109).
Series record: range held 3 of 14 days.
No prediction here, only where the edges are.
Does the range hold today?
Not financial advice.
#LevelCheck #VektorDaily
Now 82.22
24h high 85.85
24h low 82.10
Yesterday's check (#14, ETH): it stayed inside its range (2 006 to 2 109).
Series record: range held 3 of 14 days.
No prediction here, only where the edges are.
Does the range hold today?
Not financial advice.
#LevelCheck #VektorDaily
1
130

·
--
$75,000 was lost twice. This time, I didn’t just watch—I added to my short.
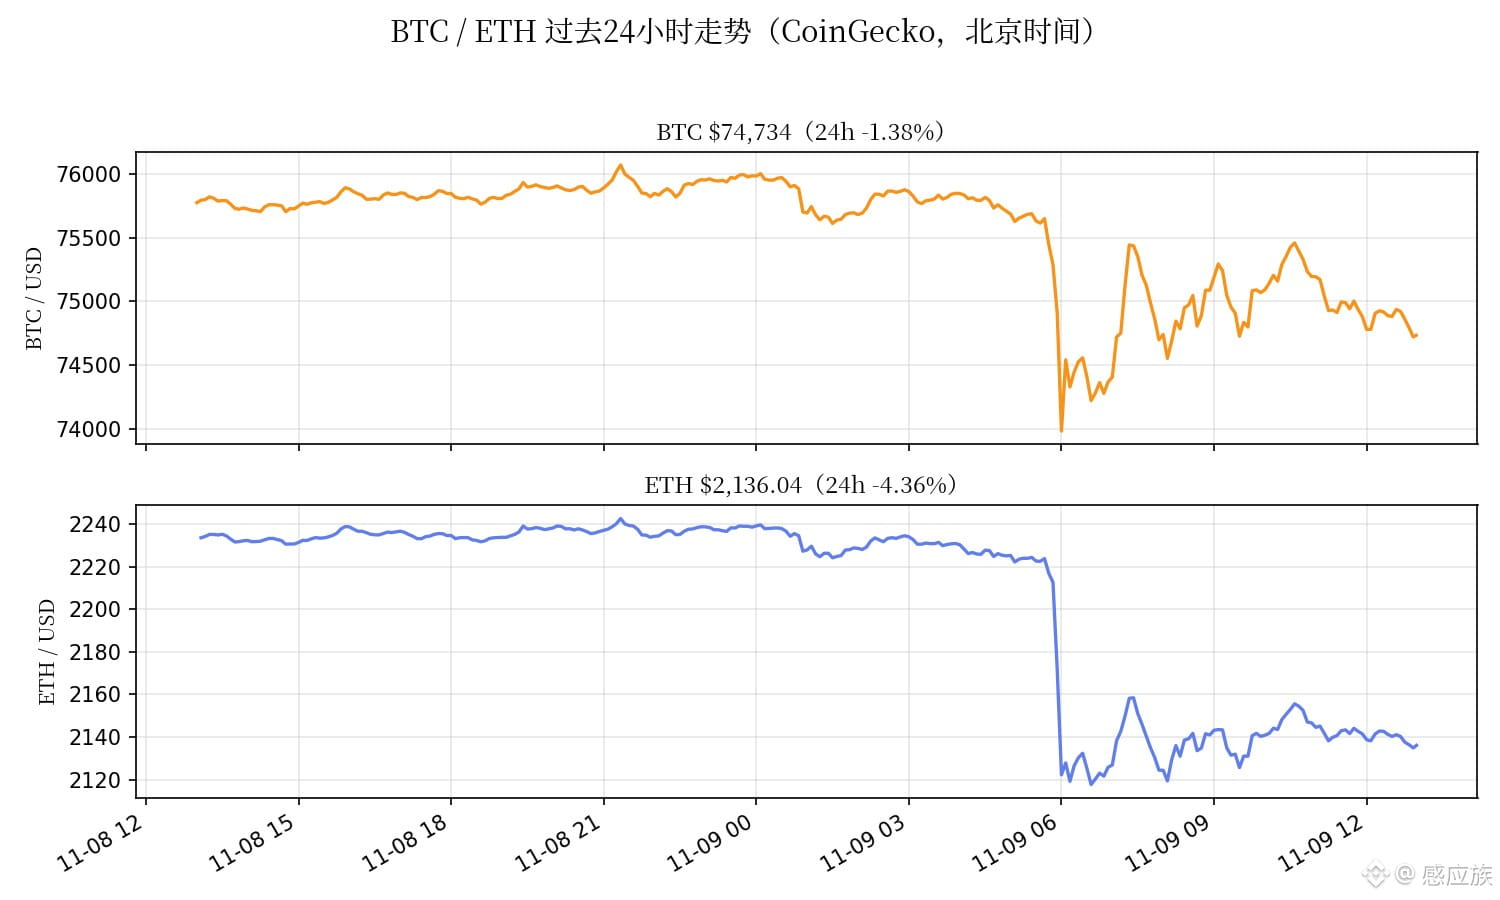
13:00: $BTC at approximately $74,727, down 1.37% over 24 hours; $ETH at approximately $2,134, down 4.39% over 24 hours (live data from CoinGecko). This morning, the price briefly dipped to $73,510, a three-month low (Finnhub data).
The $75,000 level was breached twice today: the 4-hour candle closing at 08:00 finished at around $74,740, and the one closing at 12:00 finished at around $74,781. Both 4-hour candles closed below $75,000, and the price is still below that level—it hasn’t reclaimed it. It was right not to chase the short during this morning’s V-shaped rebound from $73,510 to $75,190; but two confirmed candle closes are not the same as a single wick.
ETH has already fallen below $2,200. As I said before, bearish momentum is accelerating. XRP is around $1.11 (-4.6%) and SOL around $85.7 (-3.9%); major coins are all moving lower (TradingView).
Short trade update #14: Opened the short on November 7 at 13:00 in the $75,800–$76,100 range, with a midpoint entry of $75,950. Current price: $74,727, down 1.61% from entry. At 100x leverage, the unrealized profit is approximately +161%—up from +97% at 11:02. This trade is in profit now, to be frank. The stop-loss at $77,500 and targets at $73,200 (take half off at this level) / $68,000 remain unchanged.
Decision to add to the short (following the trigger level I previously made public): The 12:00 4-hour candle closed below $75,000, triggering the add-to-short level. I’m adding a small short position around $74,700–$75,000, with the same stop as the original trade, above $77,500, and a target of $73,200. As with the original position, I’ll use only a very small portion of total capital as margin; at 100x, I won’t hold through a one-way move.
But there are two variables to flag first: 7,932 BTC options expire today at 16:00, with max pain at $76,000 overhead (Coinlab data). Prices may be pulled toward $76,000 before expiry, so a short-term bounce wouldn’t be surprising. Tomorrow at 20:30 Beijing time, the U.S. October CPI will be released. Core CPI is expected to rise 0.2% month over month, and the probability of a 25-basis-point rate hike in December is 76%–80%. I won’t trade during the hour before or after the CPI release.
The conditions for a reversal are unchanged: I’ll admit I’m wrong and exit if a 4-hour candle closes back above $76,250. I’ll only consider going long if the price reclaims $78,000 and holds above it.
After losing $75,000 twice, do you think we’ll reclaim it tonight? Let’s discuss in the comments. (Prices: live CoinGecko data at 13:00 Beijing time on November 9; chart shows the past 24 hours.)
$75,000 was lost twice. This time, I didn’t just watch—I added to my short.
13:00: $BTC at approximately $74,727, down 1.37% over 24 hours; $ETH at approximately $2,134, down 4.39% over 24 hours (live data from CoinGecko). This morning, the price briefly dipped to $73,510, a three-month low (Finnhub data).
The $75,000 level was breached twice today: the 4-hour candle closing at 08:00 finished at around $74,740, and the one closing at 12:00 finished at around $74,781. Both 4-hour candles closed below $75,000, and the price is still below that level—it hasn’t reclaimed it. It was right not to chase the short during this morning’s V-shaped rebound from $73,510 to $75,190; but two confirmed candle closes are not the same as a single wick.
ETH has already fallen below $2,200. As I said before, bearish momentum is accelerating. XRP is around $1.11 (-4.6%) and SOL around $85.7 (-3.9%); major coins are all moving lower (TradingView).
Short trade update #14: Opened the short on November 7 at 13:00 in the $75,800–$76,100 range, with a midpoint entry of $75,950. Current price: $74,727, down 1.61% from entry. At 100x leverage, the unrealized profit is approximately +161%—up from +97% at 11:02. This trade is in profit now, to be frank. The stop-loss at $77,500 and targets at $73,200 (take half off at this level) / $68,000 remain unchanged.
Decision to add to the short (following the trigger level I previously made public): The 12:00 4-hour candle closed below $75,000, triggering the add-to-short level. I’m adding a small short position around $74,700–$75,000, with the same stop as the original trade, above $77,500, and a target of $73,200. As with the original position, I’ll use only a very small portion of total capital as margin; at 100x, I won’t hold through a one-way move.
But there are two variables to flag first: 7,932 BTC options expire today at 16:00, with max pain at $76,000 overhead (Coinlab data). Prices may be pulled toward $76,000 before expiry, so a short-term bounce wouldn’t be surprising. Tomorrow at 20:30 Beijing time, the U.S. October CPI will be released. Core CPI is expected to rise 0.2% month over month, and the probability of a 25-basis-point rate hike in December is 76%–80%. I won’t trade during the hour before or after the CPI release.
The conditions for a reversal are unchanged: I’ll admit I’m wrong and exit if a 4-hour candle closes back above $76,250. I’ll only consider going long if the price reclaims $78,000 and holds above it.
After losing $75,000 twice, do you think we’ll reclaim it tonight? Let’s discuss in the comments. (Prices: live CoinGecko data at 13:00 Beijing time on November 9; chart shows the past 24 hours.)
13:00: $BTC at approximately $74,727, down 1.37% over 24 hours; $ETH at approximately $2,134, down 4.39% over 24 hours (live data from CoinGecko). This morning, the price briefly dipped to $73,510, a three-month low (Finnhub data).
The $75,000 level was breached twice today: the 4-hour candle closing at 08:00 finished at around $74,740, and the one closing at 12:00 finished at around $74,781. Both 4-hour candles closed below $75,000, and the price is still below that level—it hasn’t reclaimed it. It was right not to chase the short during this morning’s V-shaped rebound from $73,510 to $75,190; but two confirmed candle closes are not the same as a single wick.
ETH has already fallen below $2,200. As I said before, bearish momentum is accelerating. XRP is around $1.11 (-4.6%) and SOL around $85.7 (-3.9%); major coins are all moving lower (TradingView).
Short trade update #14: Opened the short on November 7 at 13:00 in the $75,800–$76,100 range, with a midpoint entry of $75,950. Current price: $74,727, down 1.61% from entry. At 100x leverage, the unrealized profit is approximately +161%—up from +97% at 11:02. This trade is in profit now, to be frank. The stop-loss at $77,500 and targets at $73,200 (take half off at this level) / $68,000 remain unchanged.
Decision to add to the short (following the trigger level I previously made public): The 12:00 4-hour candle closed below $75,000, triggering the add-to-short level. I’m adding a small short position around $74,700–$75,000, with the same stop as the original trade, above $77,500, and a target of $73,200. As with the original position, I’ll use only a very small portion of total capital as margin; at 100x, I won’t hold through a one-way move.
But there are two variables to flag first: 7,932 BTC options expire today at 16:00, with max pain at $76,000 overhead (Coinlab data). Prices may be pulled toward $76,000 before expiry, so a short-term bounce wouldn’t be surprising. Tomorrow at 20:30 Beijing time, the U.S. October CPI will be released. Core CPI is expected to rise 0.2% month over month, and the probability of a 25-basis-point rate hike in December is 76%–80%. I won’t trade during the hour before or after the CPI release.
The conditions for a reversal are unchanged: I’ll admit I’m wrong and exit if a 4-hour candle closes back above $76,250. I’ll only consider going long if the price reclaims $78,000 and holds above it.
After losing $75,000 twice, do you think we’ll reclaim it tonight? Let’s discuss in the comments. (Prices: live CoinGecko data at 13:00 Beijing time on November 9; chart shows the past 24 hours.)
525

·
--
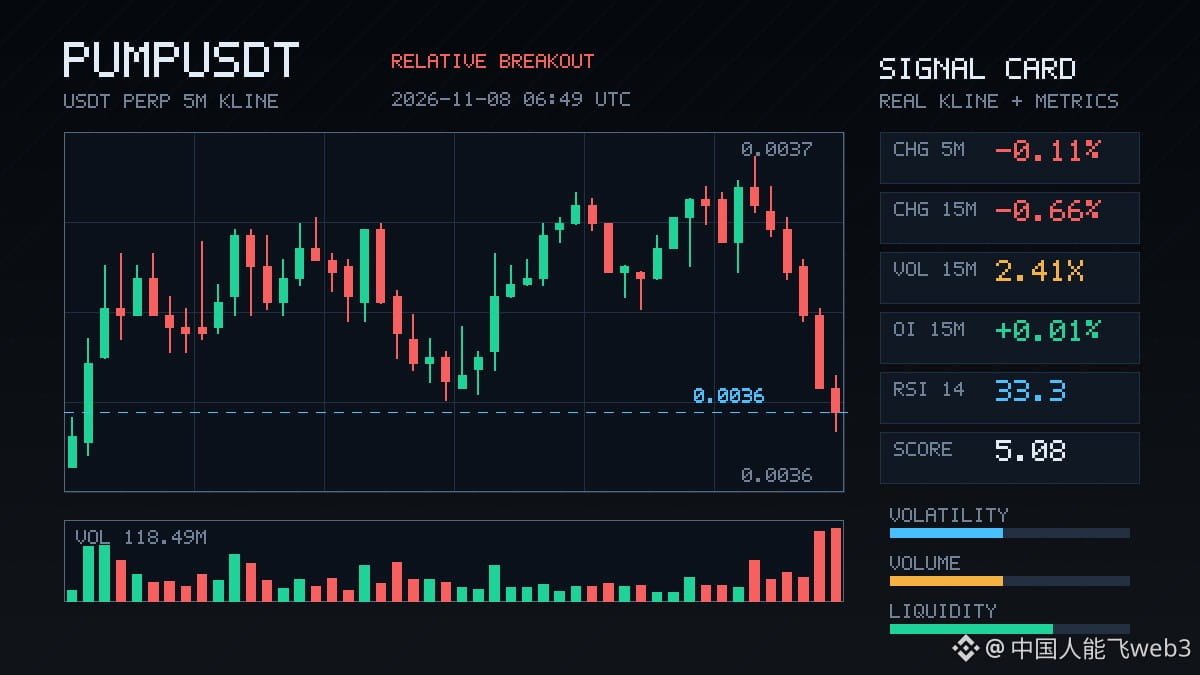
$PUMP This move is interesting. The price fell 0.66%, which isn’t much, but 15m volume surged to 2.41 times its usual level. The buy/sell ratio was 0.54, and the net aggressive trading flow was nearly -30%, showing clearly one-sided selling pressure. The close also fell below the lower boundary of the past 20 or so 5m candles. Once a range boundary breaks, short-term sentiment can easily follow.
On the OI side, there was a slight nominal outflow, with more than 400,000 U in reductions over 1h. But structurally, it looks more like new leveraged shorts are joining in: the price is falling while OI hasn’t collapsed, suggesting this isn’t simply a sell-off caused by longs closing positions. The anomaly percentile is 81%, ranking #14 across the entire pool; the nominal change ranks #10. The move has persisted over several consecutive periods, depth confirmation is sufficient, and volume is above normal.
24h trading volume is 108 million, so there’s plenty of liquidity. Put simply, someone is actively pushing the price down at this level, with leverage. It’s hard to say whether the move will continue after the breakdown, but with this combination of price action and volume, and aggressive selling skewed to the downside, don’t rush to buy the dip in the short term.
$PUMP This move is interesting. The price fell 0.66%, which isn’t much, but 15m volume surged to 2.41 times its usual level. The buy/sell ratio was 0.54, and the net aggressive trading flow was nearly -30%, showing clearly one-sided selling pressure. The close also fell below the lower boundary of the past 20 or so 5m candles. Once a range boundary breaks, short-term sentiment can easily follow.
On the OI side, there was a slight nominal outflow, with more than 400,000 U in reductions over 1h. But structurally, it looks more like new leveraged shorts are joining in: the price is falling while OI hasn’t collapsed, suggesting this isn’t simply a sell-off caused by longs closing positions. The anomaly percentile is 81%, ranking #14 across the entire pool; the nominal change ranks #10. The move has persisted over several consecutive periods, depth confirmation is sufficient, and volume is above normal.
24h trading volume is 108 million, so there’s plenty of liquidity. Put simply, someone is actively pushing the price down at this level, with leverage. It’s hard to say whether the move will continue after the breakdown, but with this combination of price action and volume, and aggressive selling skewed to the downside, don’t rush to buy the dip in the short term.
On the OI side, there was a slight nominal outflow, with more than 400,000 U in reductions over 1h. But structurally, it looks more like new leveraged shorts are joining in: the price is falling while OI hasn’t collapsed, suggesting this isn’t simply a sell-off caused by longs closing positions. The anomaly percentile is 81%, ranking #14 across the entire pool; the nominal change ranks #10. The move has persisted over several consecutive periods, depth confirmation is sufficient, and volume is above normal.
24h trading volume is 108 million, so there’s plenty of liquidity. Put simply, someone is actively pushing the price down at this level, with leverage. It’s hard to say whether the move will continue after the breakdown, but with this combination of price action and volume, and aggressive selling skewed to the downside, don’t rush to buy the dip in the short term.
3

·
--
$APR put in a decisive 15m push, +2.41% breaking straight through the highs of the last 20 5m candles. Volume came in at 1.78x, so this wasn’t a fake breakout that fizzled out. Aggressive trade flow was 25.5%, with a buy/sell ratio of 1.68—clearly, someone was sweeping up.
What’s more notable is that OI rose in tandem: +0.19% on 15m and +0.12% on 1h. New leveraged longs are coming in; this isn’t just spot buying pushing the price up. The anomaly percentile is 89.9%, ranking #14 across the whole pool. The market is small (just 9.6M in 24h volume), but when OI and price rise together in a small pool like this, the momentum signal is cleaner than it is for large caps.
Watch to see if it can hold above the highs. A pullback would make this a failed breakout—that’s a different story.
$APR put in a decisive 15m push, +2.41% breaking straight through the highs of the last 20 5m candles. Volume came in at 1.78x, so this wasn’t a fake breakout that fizzled out. Aggressive trade flow was 25.5%, with a buy/sell ratio of 1.68—clearly, someone was sweeping up.
What’s more notable is that OI rose in tandem: +0.19% on 15m and +0.12% on 1h. New leveraged longs are coming in; this isn’t just spot buying pushing the price up. The anomaly percentile is 89.9%, ranking #14 across the whole pool. The market is small (just 9.6M in 24h volume), but when OI and price rise together in a small pool like this, the momentum signal is cleaner than it is for large caps.
Watch to see if it can hold above the highs. A pullback would make this a failed breakout—that’s a different story.
What’s more notable is that OI rose in tandem: +0.19% on 15m and +0.12% on 1h. New leveraged longs are coming in; this isn’t just spot buying pushing the price up. The anomaly percentile is 89.9%, ranking #14 across the whole pool. The market is small (just 9.6M in 24h volume), but when OI and price rise together in a small pool like this, the momentum signal is cleaner than it is for large caps.
Watch to see if it can hold above the highs. A pullback would make this a failed breakout—that’s a different story.
7

·
--
$PONS This drop is somewhat unusual. The price fell 3.44% in 15m, volume surged to 11 times its previous level, and the price broke below the lower bound of nearly 20 recent 5m candles. The taker flow imbalance was -25.5%, and the buy/sell ratio was 0.59, indicating that selling pressure is being applied aggressively.
More interestingly, OI rose as the price fell. The anomaly percentile reached 98.2%, ranking #14 across the entire pool. This looks more like new shorts entering with leverage than existing longs closing their positions. The funding rate is also near a recent high. With both sides increasing leverage, volatility is likely to remain high. For now, watch whether the price can reclaim the lower bound of the 5m range it just broke below.
$PONS This drop is somewhat unusual. The price fell 3.44% in 15m, volume surged to 11 times its previous level, and the price broke below the lower bound of nearly 20 recent 5m candles. The taker flow imbalance was -25.5%, and the buy/sell ratio was 0.59, indicating that selling pressure is being applied aggressively.
More interestingly, OI rose as the price fell. The anomaly percentile reached 98.2%, ranking #14 across the entire pool. This looks more like new shorts entering with leverage than existing longs closing their positions. The funding rate is also near a recent high. With both sides increasing leverage, volatility is likely to remain high. For now, watch whether the price can reclaim the lower bound of the 5m range it just broke below.
More interestingly, OI rose as the price fell. The anomaly percentile reached 98.2%, ranking #14 across the entire pool. This looks more like new shorts entering with leverage than existing longs closing their positions. The funding rate is also near a recent high. With both sides increasing leverage, volatility is likely to remain high. For now, watch whether the price can reclaim the lower bound of the 5m range it just broke below.
33

·
--
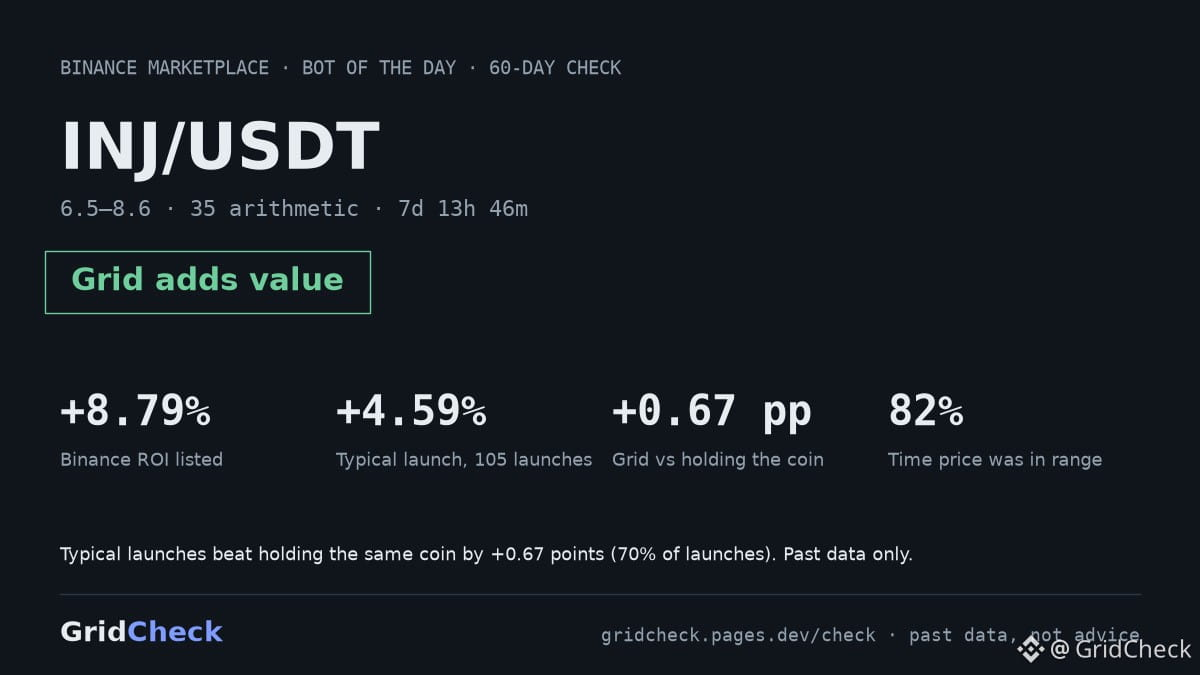
Today's top Binance grid bot, checked: $INJ (INJ/USDT), #14 on Binance's Marketplace, listed +8.79% over 7d 13h 46m.
We replayed the same settings 105 times over the last 60 days:
• price inside the range 82% of the time
• grid vs simply holding the coin: +0.67 pp
• beat holding in 70% of launches
Verdict: Grid adds value. The grid itself added return over simply holding the coin.
2 of 15 top bots passed all our checks today: INJ/USDT, BNB/BTC.
Do you check anything besides ROI before copying a bot?
Check any bot free: gridcheck.pages.dev/check
Data, not financial advice. Not affiliated with Binance.
#SpotGrid #GridTrading #TradingBots
Today's top Binance grid bot, checked: $INJ (INJ/USDT), #14 on Binance's Marketplace, listed +8.79% over 7d 13h 46m.
We replayed the same settings 105 times over the last 60 days:
• price inside the range 82% of the time
• grid vs simply holding the coin: +0.67 pp
• beat holding in 70% of launches
Verdict: Grid adds value. The grid itself added return over simply holding the coin.
2 of 15 top bots passed all our checks today: INJ/USDT, BNB/BTC.
Do you check anything besides ROI before copying a bot?
Check any bot free: gridcheck.pages.dev/check
Data, not financial advice. Not affiliated with Binance.
#SpotGrid #GridTrading #TradingBots
We replayed the same settings 105 times over the last 60 days:
• price inside the range 82% of the time
• grid vs simply holding the coin: +0.67 pp
• beat holding in 70% of launches
Verdict: Grid adds value. The grid itself added return over simply holding the coin.
2 of 15 top bots passed all our checks today: INJ/USDT, BNB/BTC.
Do you check anything besides ROI before copying a bot?
Check any bot free: gridcheck.pages.dev/check
Data, not financial advice. Not affiliated with Binance.
#SpotGrid #GridTrading #TradingBots
131

·
--
$JCT This move is pretty interesting. It surged 4.66% in 15m, with volume hitting 6 times the usual level and volatility Z at 5.36—not the kind of low-volume fake breakout. The closing price moved above the upper bound of the last 20 5m candles, taker flow was +3.5%, and the buy/sell ratio was 1.07, with buyers pushing it up.
More importantly, OI—15m futures OI rose 0.55%, with a notional change of 906K; one-hour notional also increased by 699K. Price and OI rising together is a classic sign of fresh leveraged longs entering, not the false rally you get from short covering. The OI anomaly percentile is 89.1%, ranking #25 across the entire pool, with notional change ranking #14. It has held up across multiple consecutive periods, and market depth confirms it too.
24-hour trading volume is nearly 400 million, so liquidity is sufficient. With this setup, it either keeps running for a while or longs are so crowded that they could get flushed out at any moment. I personally lean toward the former, but still use a stop-loss—don't get carried away.
$JCT This move is pretty interesting. It surged 4.66% in 15m, with volume hitting 6 times the usual level and volatility Z at 5.36—not the kind of low-volume fake breakout. The closing price moved above the upper bound of the last 20 5m candles, taker flow was +3.5%, and the buy/sell ratio was 1.07, with buyers pushing it up.
More importantly, OI—15m futures OI rose 0.55%, with a notional change of 906K; one-hour notional also increased by 699K. Price and OI rising together is a classic sign of fresh leveraged longs entering, not the false rally you get from short covering. The OI anomaly percentile is 89.1%, ranking #25 across the entire pool, with notional change ranking #14. It has held up across multiple consecutive periods, and market depth confirms it too.
24-hour trading volume is nearly 400 million, so liquidity is sufficient. With this setup, it either keeps running for a while or longs are so crowded that they could get flushed out at any moment. I personally lean toward the former, but still use a stop-loss—don't get carried away.
More importantly, OI—15m futures OI rose 0.55%, with a notional change of 906K; one-hour notional also increased by 699K. Price and OI rising together is a classic sign of fresh leveraged longs entering, not the false rally you get from short covering. The OI anomaly percentile is 89.1%, ranking #25 across the entire pool, with notional change ranking #14. It has held up across multiple consecutive periods, and market depth confirms it too.
24-hour trading volume is nearly 400 million, so liquidity is sufficient. With this setup, it either keeps running for a while or longs are so crowded that they could get flushed out at any moment. I personally lean toward the former, but still use a stop-loss—don't get carried away.
26
·
--
$ZRO This rally feels a bit flimsy. The price is up 1% over 15m, but OI has been falling all the way, and open interest in 1h futures is down 3.56%—notional positions have shrunk by more than 2 million U. Positions are being closed as the price rises: a classic short-covering rally, not genuine follow-through buying.
Volume has picked up, though, reaching 4.31x, and the funding rate has climbed to a recent high. It looks lively, but the net taker flow is still negative, and the buy/sell ratio is 0.96, so buyers haven't gained the upper hand. OI's anomaly percentile is 95.8%, ranking #14 across the entire pool. With the same pattern persisting for several periods, this looks more like shorts being forced to close than new longs entering.
I'm not comfortable chasing this kind of setup. Without rising open interest to support it, the price is moving higher purely on short covering, and it could easily stall as soon as that buying dries up. If you really want to get involved, wait until OI stabilizes. For now, it's a matter of watching who gets out fastest.
$ZRO This rally feels a bit flimsy. The price is up 1% over 15m, but OI has been falling all the way, and open interest in 1h futures is down 3.56%—notional positions have shrunk by more than 2 million U. Positions are being closed as the price rises: a classic short-covering rally, not genuine follow-through buying.
Volume has picked up, though, reaching 4.31x, and the funding rate has climbed to a recent high. It looks lively, but the net taker flow is still negative, and the buy/sell ratio is 0.96, so buyers haven't gained the upper hand. OI's anomaly percentile is 95.8%, ranking #14 across the entire pool. With the same pattern persisting for several periods, this looks more like shorts being forced to close than new longs entering.
I'm not comfortable chasing this kind of setup. Without rising open interest to support it, the price is moving higher purely on short covering, and it could easily stall as soon as that buying dries up. If you really want to get involved, wait until OI stabilizes. For now, it's a matter of watching who gets out fastest.
Volume has picked up, though, reaching 4.31x, and the funding rate has climbed to a recent high. It looks lively, but the net taker flow is still negative, and the buy/sell ratio is 0.96, so buyers haven't gained the upper hand. OI's anomaly percentile is 95.8%, ranking #14 across the entire pool. With the same pattern persisting for several periods, this looks more like shorts being forced to close than new longs entering.
I'm not comfortable chasing this kind of setup. Without rising open interest to support it, the price is moving higher purely on short covering, and it could easily stall as soon as that buying dries up. If you really want to get involved, wait until OI stabilizes. For now, it's a matter of watching who gets out fastest.
1

·
--
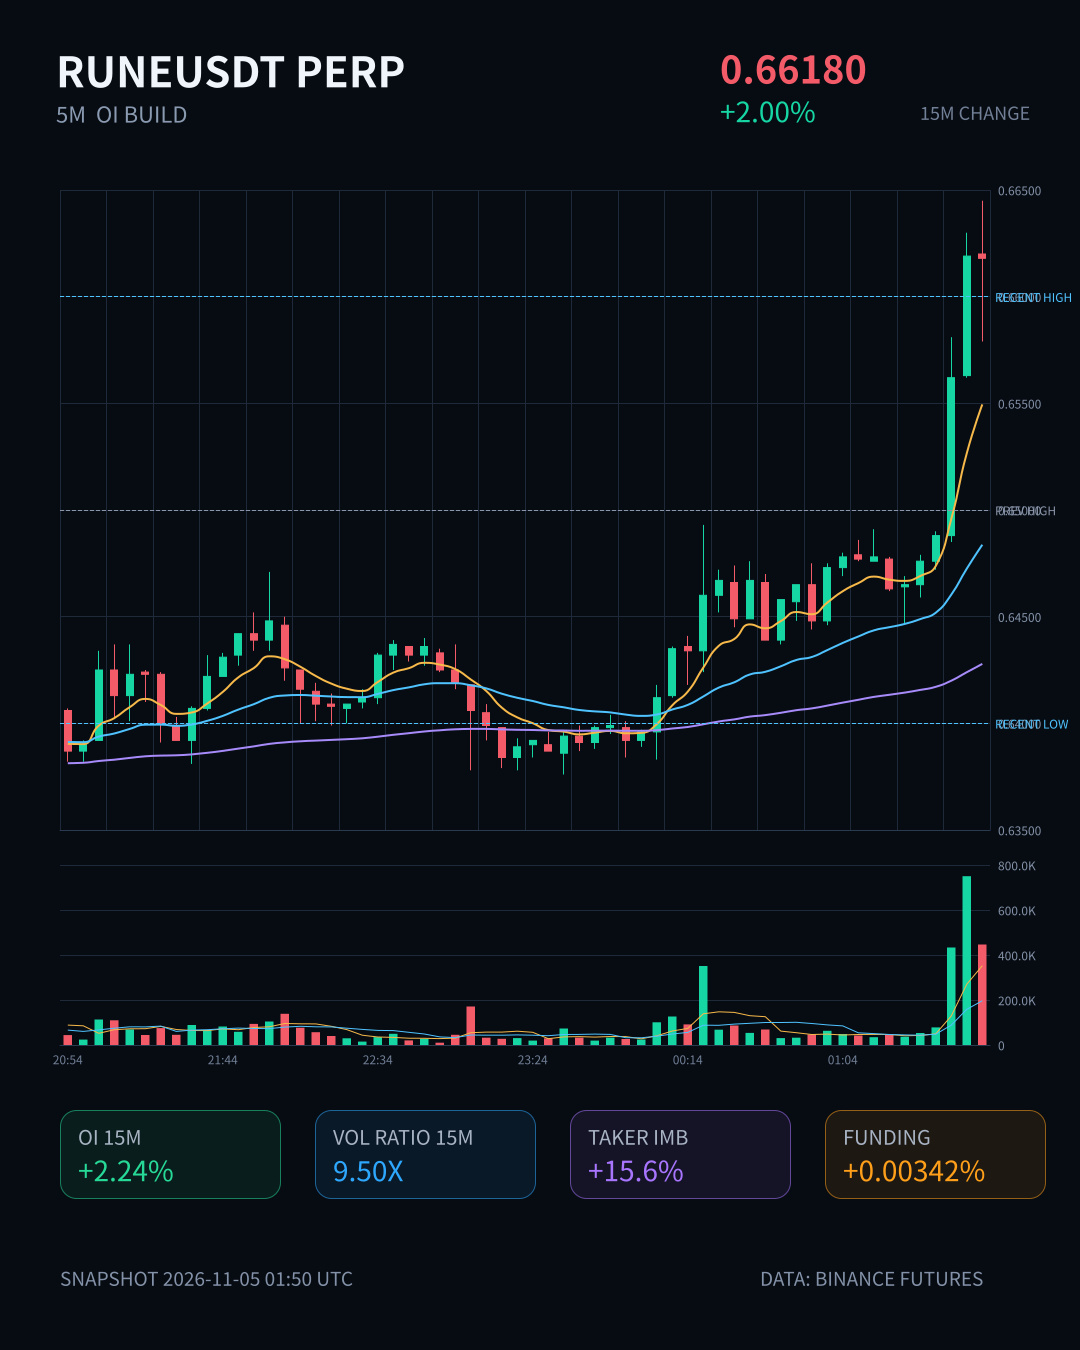
RUNE has been making moves over the past 15 minutes: its price is up 2%, while trading volume has surged to 9.5 times its usual level. OI has been building over both the 15-minute and 1-hour periods, with the combined notional change topping 600,000 U. Price up, open interest up—a classic sign of leveraged longs piling in, not just a hollow short squeeze. The aggressive trade imbalance is 15.6%, and the buy/sell ratio is 1.37, so buyers really are actively lifting offers.
The OI anomaly percentile is already at 95.2%, ranking #14 across the entire pool, while notional change ranks #29. That’s not a low level; it’s approaching the extreme end of its historical range. This setup looks good, but the faster leverage piles up, the harder the flush can be. If you’re chasing, be clear on whether you’re riding the trend or catching a falling knife—don’t wait for a pullback to realize your position is bigger than your conviction.
RUNE has been making moves over the past 15 minutes: its price is up 2%, while trading volume has surged to 9.5 times its usual level. OI has been building over both the 15-minute and 1-hour periods, with the combined notional change topping 600,000 U. Price up, open interest up—a classic sign of leveraged longs piling in, not just a hollow short squeeze. The aggressive trade imbalance is 15.6%, and the buy/sell ratio is 1.37, so buyers really are actively lifting offers.
The OI anomaly percentile is already at 95.2%, ranking #14 across the entire pool, while notional change ranks #29. That’s not a low level; it’s approaching the extreme end of its historical range. This setup looks good, but the faster leverage piles up, the harder the flush can be. If you’re chasing, be clear on whether you’re riding the trend or catching a falling knife—don’t wait for a pullback to realize your position is bigger than your conviction.
The OI anomaly percentile is already at 95.2%, ranking #14 across the entire pool, while notional change ranks #29. That’s not a low level; it’s approaching the extreme end of its historical range. This setup looks good, but the faster leverage piles up, the harder the flush can be. If you’re chasing, be clear on whether you’re riding the trend or catching a falling knife—don’t wait for a pullback to realize your position is bigger than your conviction.
31
·
--
$QNT This 15m move is pretty interesting: price is up +0.92%, breaking above the highs of the past 20 5m candles, while volume jumped to 2.27x. But 15m OI is down -0.37%, with notional shrinking by 176K. Price up, open interest down—a classic short-covering pattern. The aggressive buy/sell ratio is only 0.60, so selling pressure is still there. 1h OI is up +1.06%, though, suggesting positions are still being added over the longer term. The anomaly percentile is 86.3%, ranking #14 across the whole pool—one of today's more notable moves. 24h trading volume is 46.6M, and liquidity is decent. Be careful chasing longs in this setup: once the short-covering rally stalls, the gains could easily reverse.
$QNT This 15m move is pretty interesting: price is up +0.92%, breaking above the highs of the past 20 5m candles, while volume jumped to 2.27x. But 15m OI is down -0.37%, with notional shrinking by 176K. Price up, open interest down—a classic short-covering pattern. The aggressive buy/sell ratio is only 0.60, so selling pressure is still there. 1h OI is up +1.06%, though, suggesting positions are still being added over the longer term. The anomaly percentile is 86.3%, ranking #14 across the whole pool—one of today's more notable moves. 24h trading volume is 46.6M, and liquidity is decent. Be careful chasing longs in this setup: once the short-covering rally stalls, the gains could easily reverse.
6
·
--
$CHIP This drop has been pretty sharp: it plunged 2.4% in 15 minutes, with volume reaching 6.8 times normal, and the close fell below the lower end of the last 20 five-minute candles. Taker flow was -34.4%, and the buy/sell ratio was 0.49, pointing to clear selling pressure.
Interestingly, open interest is still rising: +0.42% over one hour, at the 97th percentile for unusual activity, ranking #14 across the entire pool. Price down, OI up—that strongly suggests new leveraged shorts are entering. The funding rate has also surged to a recent high percentile, so short positioning is fairly crowded.
With a deep drop, rising volume, and high funding, chasing shorts in this setup could leave you vulnerable to a rebound. First, watch whether price can reclaim this lower boundary.
$CHIP This drop has been pretty sharp: it plunged 2.4% in 15 minutes, with volume reaching 6.8 times normal, and the close fell below the lower end of the last 20 five-minute candles. Taker flow was -34.4%, and the buy/sell ratio was 0.49, pointing to clear selling pressure.
Interestingly, open interest is still rising: +0.42% over one hour, at the 97th percentile for unusual activity, ranking #14 across the entire pool. Price down, OI up—that strongly suggests new leveraged shorts are entering. The funding rate has also surged to a recent high percentile, so short positioning is fairly crowded.
With a deep drop, rising volume, and high funding, chasing shorts in this setup could leave you vulnerable to a rebound. First, watch whether price can reclaim this lower boundary.
Interestingly, open interest is still rising: +0.42% over one hour, at the 97th percentile for unusual activity, ranking #14 across the entire pool. Price down, OI up—that strongly suggests new leveraged shorts are entering. The funding rate has also surged to a recent high percentile, so short positioning is fairly crowded.
With a deep drop, rising volume, and high funding, chasing shorts in this setup could leave you vulnerable to a rebound. First, watch whether price can reclaim this lower boundary.
5
·
--
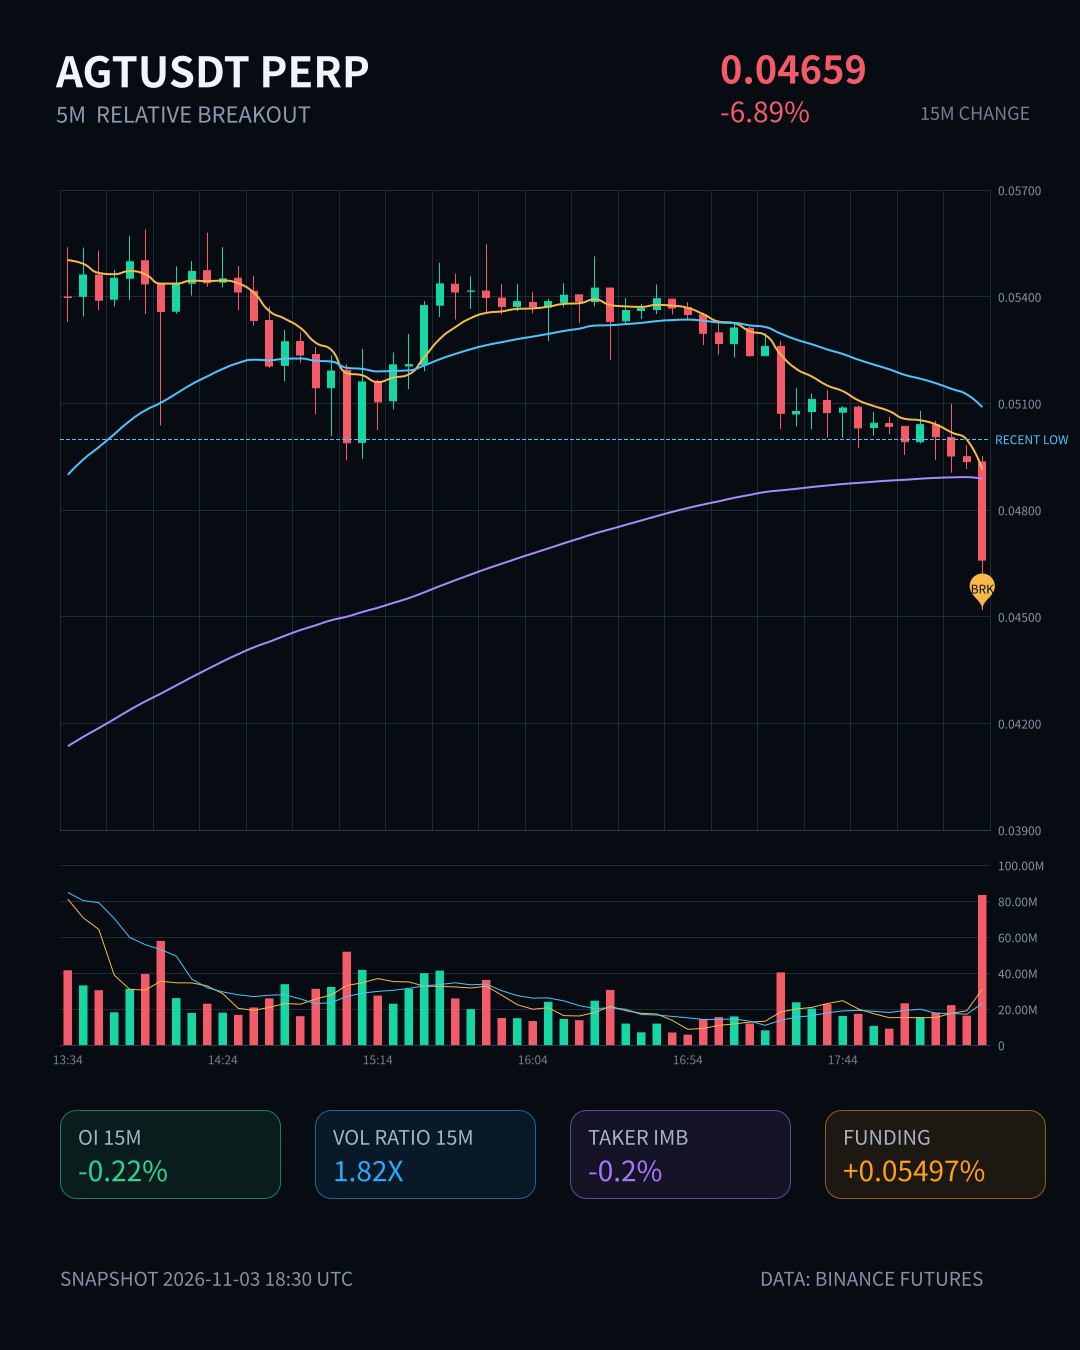
$AGT This 15m move dumped 6.89% directly, with volume surging to 1.82x. Price broke below the lower bound of the last nearly 20 5m candles—a classic breakdown of the range boundary.
But the open interest is more interesting: OI fell just 0.22% over 15m, while it was actually up 0.47% over 1h; notional change was negative. With price down and OI falling, this looks more like longs deleveraging and stopping out than fresh shorts entering and pushing the price down. The buy/sell ratio was 1.00, and the taker flow imbalance was -0.2%, so the selling pressure wasn’t actually that intense.
Notional change ranked #14 across the entire universe, with an anomaly percentile of 83.7% and 24h trading volume of 174M—there’s plenty of attention and liquidity. Given this structure, I’m more inclined to see this as a leverage flush than the start of a trend reversal. Whether price can reclaim the lower edge of the range is the key thing to watch next.
$AGT This 15m move dumped 6.89% directly, with volume surging to 1.82x. Price broke below the lower bound of the last nearly 20 5m candles—a classic breakdown of the range boundary.
But the open interest is more interesting: OI fell just 0.22% over 15m, while it was actually up 0.47% over 1h; notional change was negative. With price down and OI falling, this looks more like longs deleveraging and stopping out than fresh shorts entering and pushing the price down. The buy/sell ratio was 1.00, and the taker flow imbalance was -0.2%, so the selling pressure wasn’t actually that intense.
Notional change ranked #14 across the entire universe, with an anomaly percentile of 83.7% and 24h trading volume of 174M—there’s plenty of attention and liquidity. Given this structure, I’m more inclined to see this as a leverage flush than the start of a trend reversal. Whether price can reclaim the lower edge of the range is the key thing to watch next.
But the open interest is more interesting: OI fell just 0.22% over 15m, while it was actually up 0.47% over 1h; notional change was negative. With price down and OI falling, this looks more like longs deleveraging and stopping out than fresh shorts entering and pushing the price down. The buy/sell ratio was 1.00, and the taker flow imbalance was -0.2%, so the selling pressure wasn’t actually that intense.
Notional change ranked #14 across the entire universe, with an anomaly percentile of 83.7% and 24h trading volume of 174M—there’s plenty of attention and liquidity. Given this structure, I’m more inclined to see this as a leverage flush than the start of a trend reversal. Whether price can reclaim the lower edge of the range is the key thing to watch next.
4
·
--
$TRUMP This move is getting interesting. It surged 1.38% in 15m, with volume reaching 2.78x normal, a Z-score of 3.95, and the close above the highs of the last 20 5m candles.
The key is that OI moved up alongside it—+0.90% over 15m and +1.33% over 1h. Its anomaly percentile is 97.2%, ranking #32 across the entire pool, with nominal change ranking #14. Price up, open interest up: this isn’t the false pop you get from short covering; it looks more like new leveraged longs entering.
The taker buy-sell imbalance is 24.4%, and the buy/sell ratio is 1.65, showing a clear tilt toward buyers. 24h trading volume is 96M, and market depth has kept up too. The move has continued for several consecutive periods and is already approaching the extreme end of its historical range. At this point, it could either accelerate or be a bull trap. Let’s see if it can hold above the top of the 5m range.
$TRUMP This move is getting interesting. It surged 1.38% in 15m, with volume reaching 2.78x normal, a Z-score of 3.95, and the close above the highs of the last 20 5m candles.
The key is that OI moved up alongside it—+0.90% over 15m and +1.33% over 1h. Its anomaly percentile is 97.2%, ranking #32 across the entire pool, with nominal change ranking #14. Price up, open interest up: this isn’t the false pop you get from short covering; it looks more like new leveraged longs entering.
The taker buy-sell imbalance is 24.4%, and the buy/sell ratio is 1.65, showing a clear tilt toward buyers. 24h trading volume is 96M, and market depth has kept up too. The move has continued for several consecutive periods and is already approaching the extreme end of its historical range. At this point, it could either accelerate or be a bull trap. Let’s see if it can hold above the top of the 5m range.
The key is that OI moved up alongside it—+0.90% over 15m and +1.33% over 1h. Its anomaly percentile is 97.2%, ranking #32 across the entire pool, with nominal change ranking #14. Price up, open interest up: this isn’t the false pop you get from short covering; it looks more like new leveraged longs entering.
The taker buy-sell imbalance is 24.4%, and the buy/sell ratio is 1.65, showing a clear tilt toward buyers. 24h trading volume is 96M, and market depth has kept up too. The move has continued for several consecutive periods and is already approaching the extreme end of its historical range. At this point, it could either accelerate or be a bull trap. Let’s see if it can hold above the top of the 5m range.
15
·
--
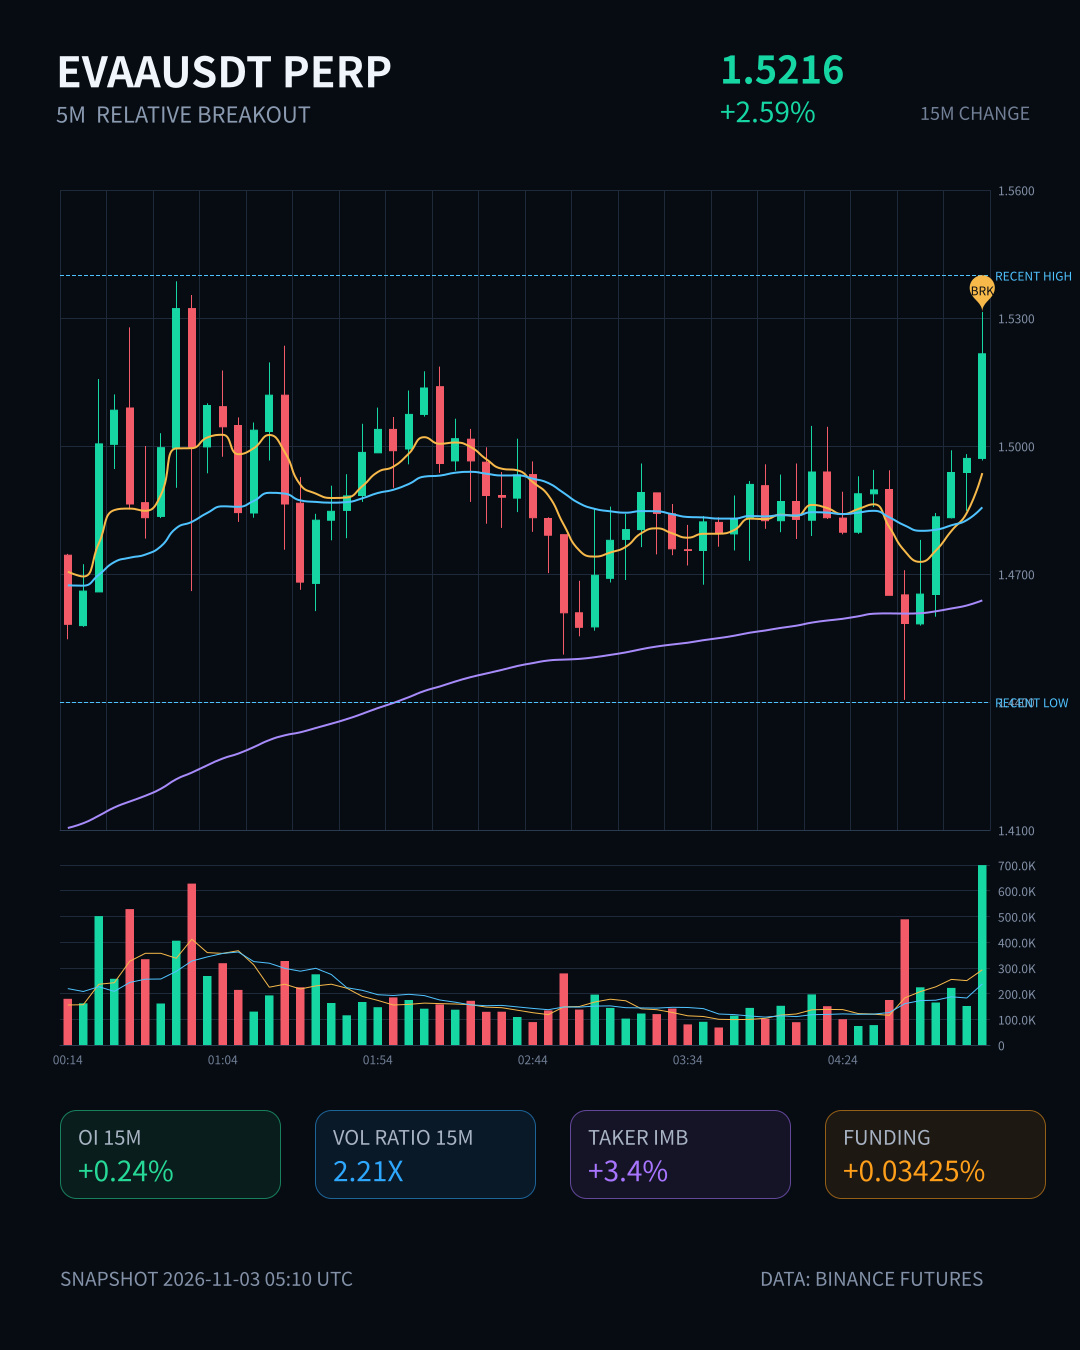
$EVAA put in a decisive 15m move, up 2.59%—not huge, but volume rose to 2.21x, with a Z-score of 2.18, clearly showing someone is pushing it. The closing price broke above the highs of the last 20 5m candles, aggressive trading imbalance was 3.4%, and the buy/sell ratio was 1.07, with bulls taking the initiative.
More interesting is the OI: 15m contracts rose 0.24%, or +344K notional, indicating new leveraged longs entering rather than shorts covering. 1h OI is still edging lower, down 0.56%, or just -4K notional—basically negligible. Capital flows are somewhat out of sync between the short and long timeframes. The OI anomaly percentile is 88.1%, ranking #20 across the full pool and #14 by notional change. It has continued over several consecutive periods, and volume is also above normal—this structure is much more solid than a single green candle.
24h trading volume is 97.69M, with enough depth that a move shouldn't immediately cause slippage. Now the question is whether it can hold above this 5m range. If it does, there's room to move higher; if not, this could be a false breakout designed to lure in buyers. Personally, I'd first watch the volume on a pullback rather than rush to chase it.
$EVAA put in a decisive 15m move, up 2.59%—not huge, but volume rose to 2.21x, with a Z-score of 2.18, clearly showing someone is pushing it. The closing price broke above the highs of the last 20 5m candles, aggressive trading imbalance was 3.4%, and the buy/sell ratio was 1.07, with bulls taking the initiative.
More interesting is the OI: 15m contracts rose 0.24%, or +344K notional, indicating new leveraged longs entering rather than shorts covering. 1h OI is still edging lower, down 0.56%, or just -4K notional—basically negligible. Capital flows are somewhat out of sync between the short and long timeframes. The OI anomaly percentile is 88.1%, ranking #20 across the full pool and #14 by notional change. It has continued over several consecutive periods, and volume is also above normal—this structure is much more solid than a single green candle.
24h trading volume is 97.69M, with enough depth that a move shouldn't immediately cause slippage. Now the question is whether it can hold above this 5m range. If it does, there's room to move higher; if not, this could be a false breakout designed to lure in buyers. Personally, I'd first watch the volume on a pullback rather than rush to chase it.
More interesting is the OI: 15m contracts rose 0.24%, or +344K notional, indicating new leveraged longs entering rather than shorts covering. 1h OI is still edging lower, down 0.56%, or just -4K notional—basically negligible. Capital flows are somewhat out of sync between the short and long timeframes. The OI anomaly percentile is 88.1%, ranking #20 across the full pool and #14 by notional change. It has continued over several consecutive periods, and volume is also above normal—this structure is much more solid than a single green candle.
24h trading volume is 97.69M, with enough depth that a move shouldn't immediately cause slippage. Now the question is whether it can hold above this 5m range. If it does, there's room to move higher; if not, this could be a false breakout designed to lure in buyers. Personally, I'd first watch the volume on a pullback rather than rush to chase it.
9
·
--
This 15m rally in INJ came with 4.8x volume, a buy/sell ratio of 3.59, and a 56% aggressive trade imbalance. Yet OI fell on both the 1h and 15m timeframes—price up, open interest down: classic short covering, not new longs entering. Its 91.7% anomaly percentile ranks it #14 across the entire pool, with a strong short-covering feel. With 24h turnover of $61M, this kind of pop looks more squeeze-driven than backed by genuine demand. First see whether buyers follow through after the covering is done; don't rush to chase.
This 15m rally in INJ came with 4.8x volume, a buy/sell ratio of 3.59, and a 56% aggressive trade imbalance. Yet OI fell on both the 1h and 15m timeframes—price up, open interest down: classic short covering, not new longs entering. Its 91.7% anomaly percentile ranks it #14 across the entire pool, with a strong short-covering feel. With 24h turnover of $61M, this kind of pop looks more squeeze-driven than backed by genuine demand. First see whether buyers follow through after the covering is done; don't rush to chase.
9
Log in to explore more content
Join global crypto users on Binance Square
⚡️ Get latest and useful information about crypto.
💬 Trusted by the world’s largest crypto exchange.
👍 Discover real insights from verified creators.
Email / Phone number
Trending Topics
1
#NvidiaLoses$2.7TrillionInMonthAndAHalf
2,132 views
50 Discussing
2
#CanBTCReboundAfterFallingBelow60K?
571,585 views
2,428 Discussing
3
#GlobalStocksFaceLongestLosingStreakSince2023
197,351 views
1,672 Discussing
4
#BlackRockIBITPostsRecord$541MSingleDayOutflow
17,712 views
58 Discussing
5
#AnthropicPlungesTowardIPOPriceonDay2
98,230 views
975 Discussing
6
#TwentyOneCapitalAdds172.25BTC
41,122 views
490 Discussing
7
#HKBillWouldExcludeTokenizedDepositsFromVirtualAssets
4,085 views
47 Discussing
8
#BNBDropsBelow540USDTWith8.46%DailyDecline
56,567 views
505 Discussing
9
#HKBillProposesHK$100KFineForUnauthorizedCryptoTitles
1,924 views
20 Discussing
10
#BitMineFaces$10.1BUnrealizedETHLoss
4,146 views
25 Discussing