
#23
23
49,963 views
240 Discussing
Hot
Latest

·
--
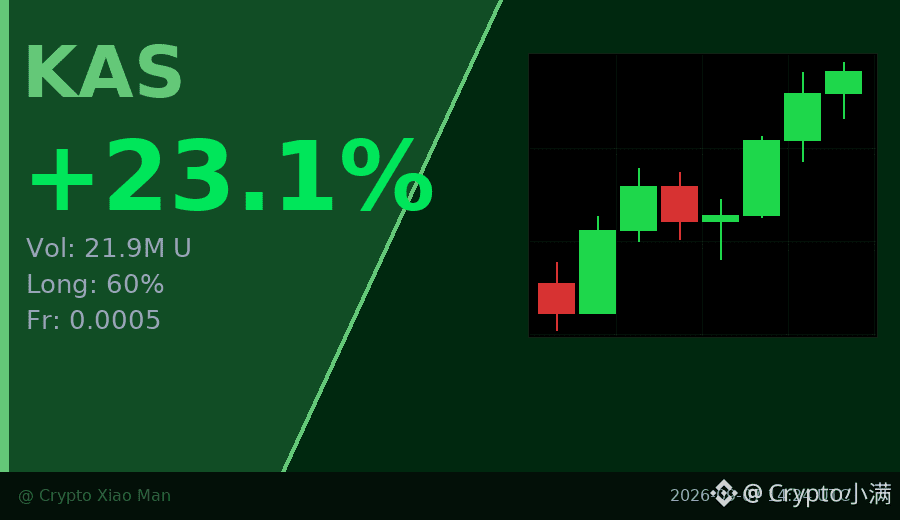
23% rise in percentage, trading volume surged to 21.90 million U, and this rally in KAS is kind of interesting.
More importantly, the funding rate is only 0.0005. The long side makes up 60%, but it’s not extremely crowded. Compared with coins whose funding rates jump above 0.01, KAS’s upward resistance is actually smaller.
The hourly chart has already seen three consecutive bullish candles—pushing steadily from around 0.03 up to 0.037. The buying momentum is very stable. This kind of volume-price alignment paired with a moderate funding rate is often more durable than a pull-up driven by overheated sentiment.
$KAS #KAS #23.09
Click the small card below to quickly check the market trend👇
23% rise in percentage, trading volume surged to 21.90 million U, and this rally in KAS is kind of interesting.
More importantly, the funding rate is only 0.0005. The long side makes up 60%, but it’s not extremely crowded. Compared with coins whose funding rates jump above 0.01, KAS’s upward resistance is actually smaller.
The hourly chart has already seen three consecutive bullish candles—pushing steadily from around 0.03 up to 0.037. The buying momentum is very stable. This kind of volume-price alignment paired with a moderate funding rate is often more durable than a pull-up driven by overheated sentiment.
$KAS #KAS #23.09
Click the small card below to quickly check the market trend👇
More importantly, the funding rate is only 0.0005. The long side makes up 60%, but it’s not extremely crowded. Compared with coins whose funding rates jump above 0.01, KAS’s upward resistance is actually smaller.
The hourly chart has already seen three consecutive bullish candles—pushing steadily from around 0.03 up to 0.037. The buying momentum is very stable. This kind of volume-price alignment paired with a moderate funding rate is often more durable than a pull-up driven by overheated sentiment.
$KAS #KAS #23.09
Click the small card below to quickly check the market trend👇
57

·
--
Three times NEAR clawed its way back above $3.20. Tonight it stopped clawing.
That line was the whole story of the last two days. On Nov 18 it reclaimed $3.20 for the third time, after the reclaim had already died twice. Tonight it gave the line back in four straight closed hours.
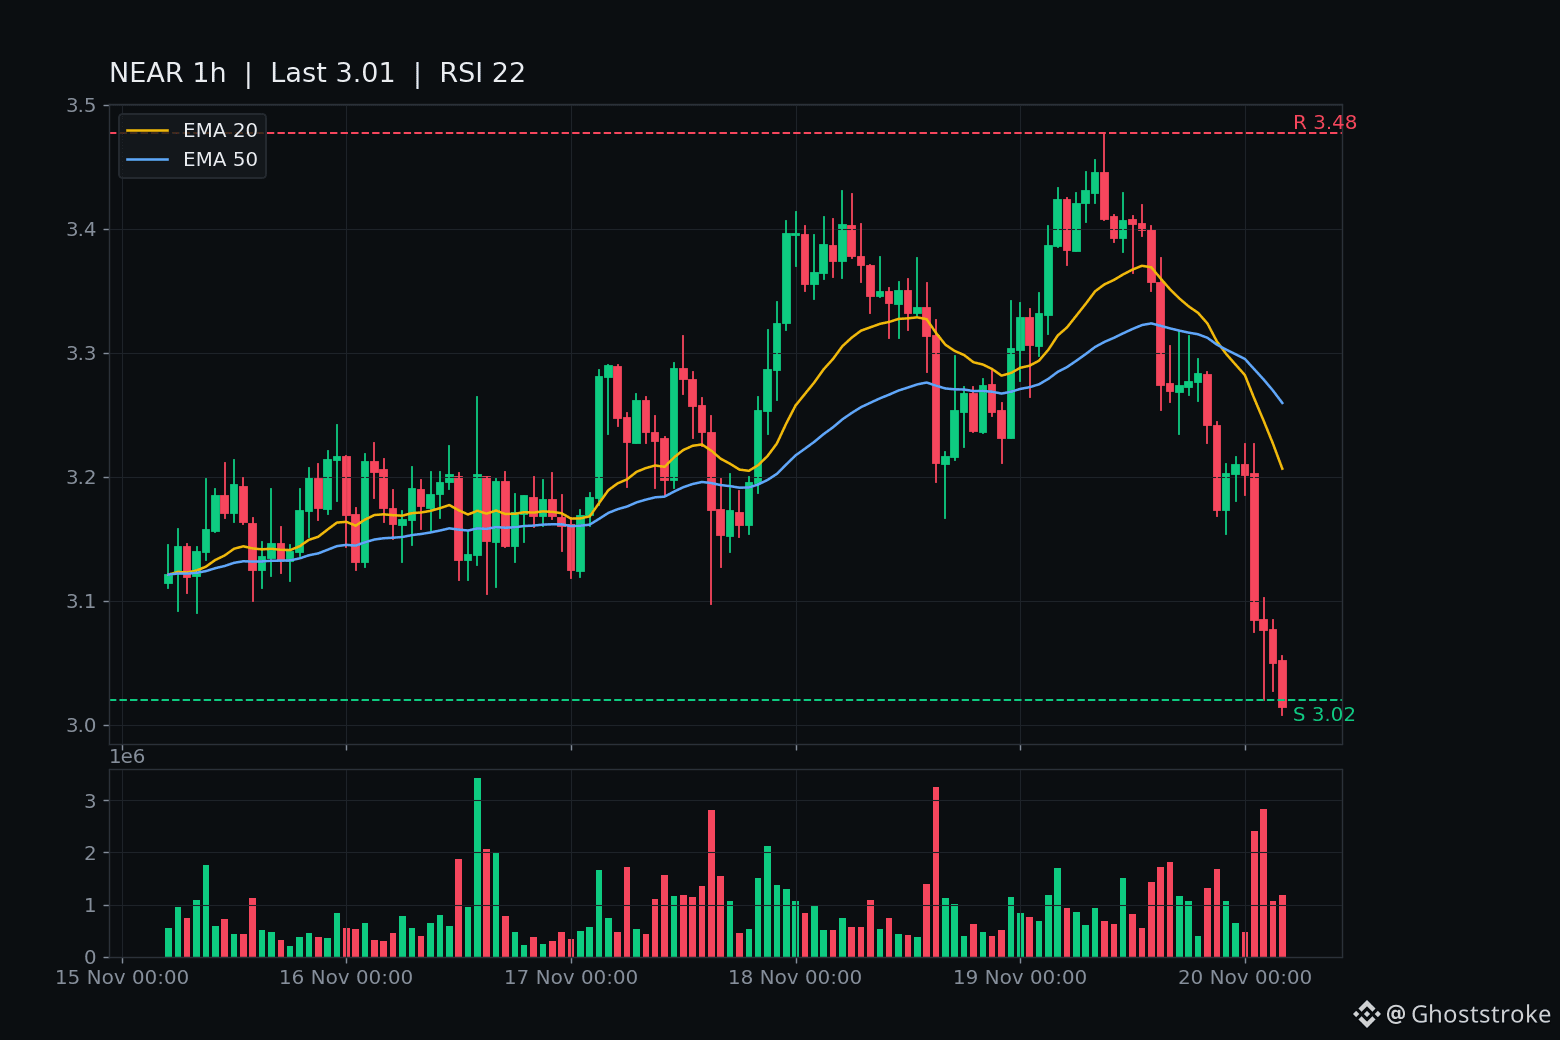
Closed candles through 04:00 UTC: NEAR sat on the line all evening — $3.202, $3.209, $3.201 — then the 01:00 hour closed $3.084 on $7.54M, first close under. The 02:00 hour closed $3.076 on $8.61M, the day's biggest bar. Then $3.050, then $3.014, low $3.008 — a fresh 24h low. The forming 05:00 hour is printing around $3.013, unclosed.
Live: $3.013, down 11.8% in 24 hours, $90.4M of volume on 285,899 trades. RSI 22 on the 1h, price under EMA20 $3.206 and EMA50 $3.259. CoinGecko: rank #23, $3.95B, down 40.2% in 30 days, 85.3% off its $20.44 all-time high — and 100% of supply already circulating, so this isn't an unlock story. It's tape.
No fresh NEAR headline drove this — nothing timed, nothing new in three days. It's a board wash: BTC is at $61,570, down 3.06%, and tagged $61,291 overnight. NEAR is running about 3.8x weaker than the board. The backdrop that was supposed to save it — the issuance cut ratified Nov 16, Hayes naming it one of his "Four Horsemen" with a $6 target on Nov 17 — is underwater now. The $5.45 launch high is 45% away.
The other side, honestly: RSI 22 is where flushes bounce hardest, and this line has whipsawed before — it died twice and came back a third time. One hourly close back above $3.20 unwrites this whole chapter. Not a call, just the line to watch.
Around the board: $BNB's verdict resolved on the same bell — closed $567.46, under $575.37 but holding above the $566 window low by $1.46. $MMT lost its EMA20 on the close, $0.2531 under $0.2549. NEXO still under $0.647, RARE still above $0.01222, SENT down 14.7% but still above its $0.01876 pump-day open.
The line died twice and came back a third time. Is tonight the fourth death, or the one that sticks?
$NEAR $BNB $MMT
Three times NEAR clawed its way back above $3.20. Tonight it stopped clawing.
That line was the whole story of the last two days. On Nov 18 it reclaimed $3.20 for the third time, after the reclaim had already died twice. Tonight it gave the line back in four straight closed hours.
Closed candles through 04:00 UTC: NEAR sat on the line all evening — $3.202, $3.209, $3.201 — then the 01:00 hour closed $3.084 on $7.54M, first close under. The 02:00 hour closed $3.076 on $8.61M, the day's biggest bar. Then $3.050, then $3.014, low $3.008 — a fresh 24h low. The forming 05:00 hour is printing around $3.013, unclosed.
Live: $3.013, down 11.8% in 24 hours, $90.4M of volume on 285,899 trades. RSI 22 on the 1h, price under EMA20 $3.206 and EMA50 $3.259. CoinGecko: rank #23, $3.95B, down 40.2% in 30 days, 85.3% off its $20.44 all-time high — and 100% of supply already circulating, so this isn't an unlock story. It's tape.
No fresh NEAR headline drove this — nothing timed, nothing new in three days. It's a board wash: BTC is at $61,570, down 3.06%, and tagged $61,291 overnight. NEAR is running about 3.8x weaker than the board. The backdrop that was supposed to save it — the issuance cut ratified Nov 16, Hayes naming it one of his "Four Horsemen" with a $6 target on Nov 17 — is underwater now. The $5.45 launch high is 45% away.
The other side, honestly: RSI 22 is where flushes bounce hardest, and this line has whipsawed before — it died twice and came back a third time. One hourly close back above $3.20 unwrites this whole chapter. Not a call, just the line to watch.
Around the board: $BNB 's verdict resolved on the same bell — closed $567.46, under $575.37 but holding above the $566 window low by $1.46. $MMT lost its EMA20 on the close, $0.2531 under $0.2549. NEXO still under $0.647, RARE still above $0.01222, SENT down 14.7% but still above its $0.01876 pump-day open.
The line died twice and came back a third time. Is tonight the fourth death, or the one that sticks?
$NEAR $BNB $MMT
That line was the whole story of the last two days. On Nov 18 it reclaimed $3.20 for the third time, after the reclaim had already died twice. Tonight it gave the line back in four straight closed hours.
Closed candles through 04:00 UTC: NEAR sat on the line all evening — $3.202, $3.209, $3.201 — then the 01:00 hour closed $3.084 on $7.54M, first close under. The 02:00 hour closed $3.076 on $8.61M, the day's biggest bar. Then $3.050, then $3.014, low $3.008 — a fresh 24h low. The forming 05:00 hour is printing around $3.013, unclosed.
Live: $3.013, down 11.8% in 24 hours, $90.4M of volume on 285,899 trades. RSI 22 on the 1h, price under EMA20 $3.206 and EMA50 $3.259. CoinGecko: rank #23, $3.95B, down 40.2% in 30 days, 85.3% off its $20.44 all-time high — and 100% of supply already circulating, so this isn't an unlock story. It's tape.
No fresh NEAR headline drove this — nothing timed, nothing new in three days. It's a board wash: BTC is at $61,570, down 3.06%, and tagged $61,291 overnight. NEAR is running about 3.8x weaker than the board. The backdrop that was supposed to save it — the issuance cut ratified Nov 16, Hayes naming it one of his "Four Horsemen" with a $6 target on Nov 17 — is underwater now. The $5.45 launch high is 45% away.
The other side, honestly: RSI 22 is where flushes bounce hardest, and this line has whipsawed before — it died twice and came back a third time. One hourly close back above $3.20 unwrites this whole chapter. Not a call, just the line to watch.
Around the board: $BNB 's verdict resolved on the same bell — closed $567.46, under $575.37 but holding above the $566 window low by $1.46. $MMT lost its EMA20 on the close, $0.2531 under $0.2549. NEXO still under $0.647, RARE still above $0.01222, SENT down 14.7% but still above its $0.01876 pump-day open.
The line died twice and came back a third time. Is tonight the fourth death, or the one that sticks?
$NEAR $BNB $MMT
44

📚 TRADING LESSON #23 — Patience — the most underrated skill
New traders think success is about finding the right indicator. It is mostly about waiting. Waiting for the setup. Waiting for the entry. Waiting for the target. The traders who survive years in this market are not the smartest — they are the most patient. Every impulsive trade you skip is money you did not lose.
❓ What is harder for you — waiting or exiting?
🔔 Follow Inam Pro Trader — a new lesson every day.
📅 18 Nov 2026
#LearnTrading #Patience #TradingPsychology
📚 TRADING LESSON #23 — Patience — the most underrated skill
New traders think success is about finding the right indicator. It is mostly about waiting. Waiting for the setup. Waiting for the entry. Waiting for the target. The traders who survive years in this market are not the smartest — they are the most patient. Every impulsive trade you skip is money you did not lose.
❓ What is harder for you — waiting or exiting?
🔔 Follow Inam Pro Trader — a new lesson every day.
📅 18 Nov 2026
#LearnTrading #Patience #TradingPsychology
New traders think success is about finding the right indicator. It is mostly about waiting. Waiting for the setup. Waiting for the entry. Waiting for the target. The traders who survive years in this market are not the smartest — they are the most patient. Every impulsive trade you skip is money you did not lose.
❓ What is harder for you — waiting or exiting?
🔔 Follow Inam Pro Trader — a new lesson every day.
📅 18 Nov 2026
#LearnTrading #Patience #TradingPsychology
2
$JCT is dropping sharply on BSC, down 15.5% in 24h, with a further 5.4% decline in the past hour—the sell-off is accelerating, with no sign of slowing. From yesterday’s open at $0.00199, the price slid straight to $0.0017, right at the 24h low. 24h cash flow is $2.84M, with sellers in the lead: 15,422 sell orders versus 12,855 buy orders, and $1.44M in sell volume versus $1.40M in buy volume—sellers are still setting the pace. The key level to hold now is $0.0017; if it breaks, the price could keep sliding with no nearby support. For a recovery, it needs to reclaim $0.00199 before the 24h high of $0.00209 comes into view. AI token, trending on BSC #23 , with a $17.9M market cap and $0.63M in liquidity—thin liquidity means sharp volatility. If you’re entering, watch $0.0017 as the make-or-break level, and don’t blindly catch a falling knife.
$JCT is dropping sharply on BSC, down 15.5% in 24h, with a further 5.4% decline in the past hour—the sell-off is accelerating, with no sign of slowing. From yesterday’s open at $0.00199, the price slid straight to $0.0017, right at the 24h low. 24h cash flow is $2.84M, with sellers in the lead: 15,422 sell orders versus 12,855 buy orders, and $1.44M in sell volume versus $1.40M in buy volume—sellers are still setting the pace. The key level to hold now is $0.0017; if it breaks, the price could keep sliding with no nearby support. For a recovery, it needs to reclaim $0.00199 before the 24h high of $0.00209 comes into view. AI token, trending on BSC #23 , with a $17.9M market cap and $0.63M in liquidity—thin liquidity means sharp volatility. If you’re entering, watch $0.0017 as the make-or-break level, and don’t blindly catch a falling knife.
607
·
--
$1M to deploy today. Two doors. ENTRY 226.
Both of them reclaimed a line last night. Both just gave it back — four closes in a row under, on the same bell.
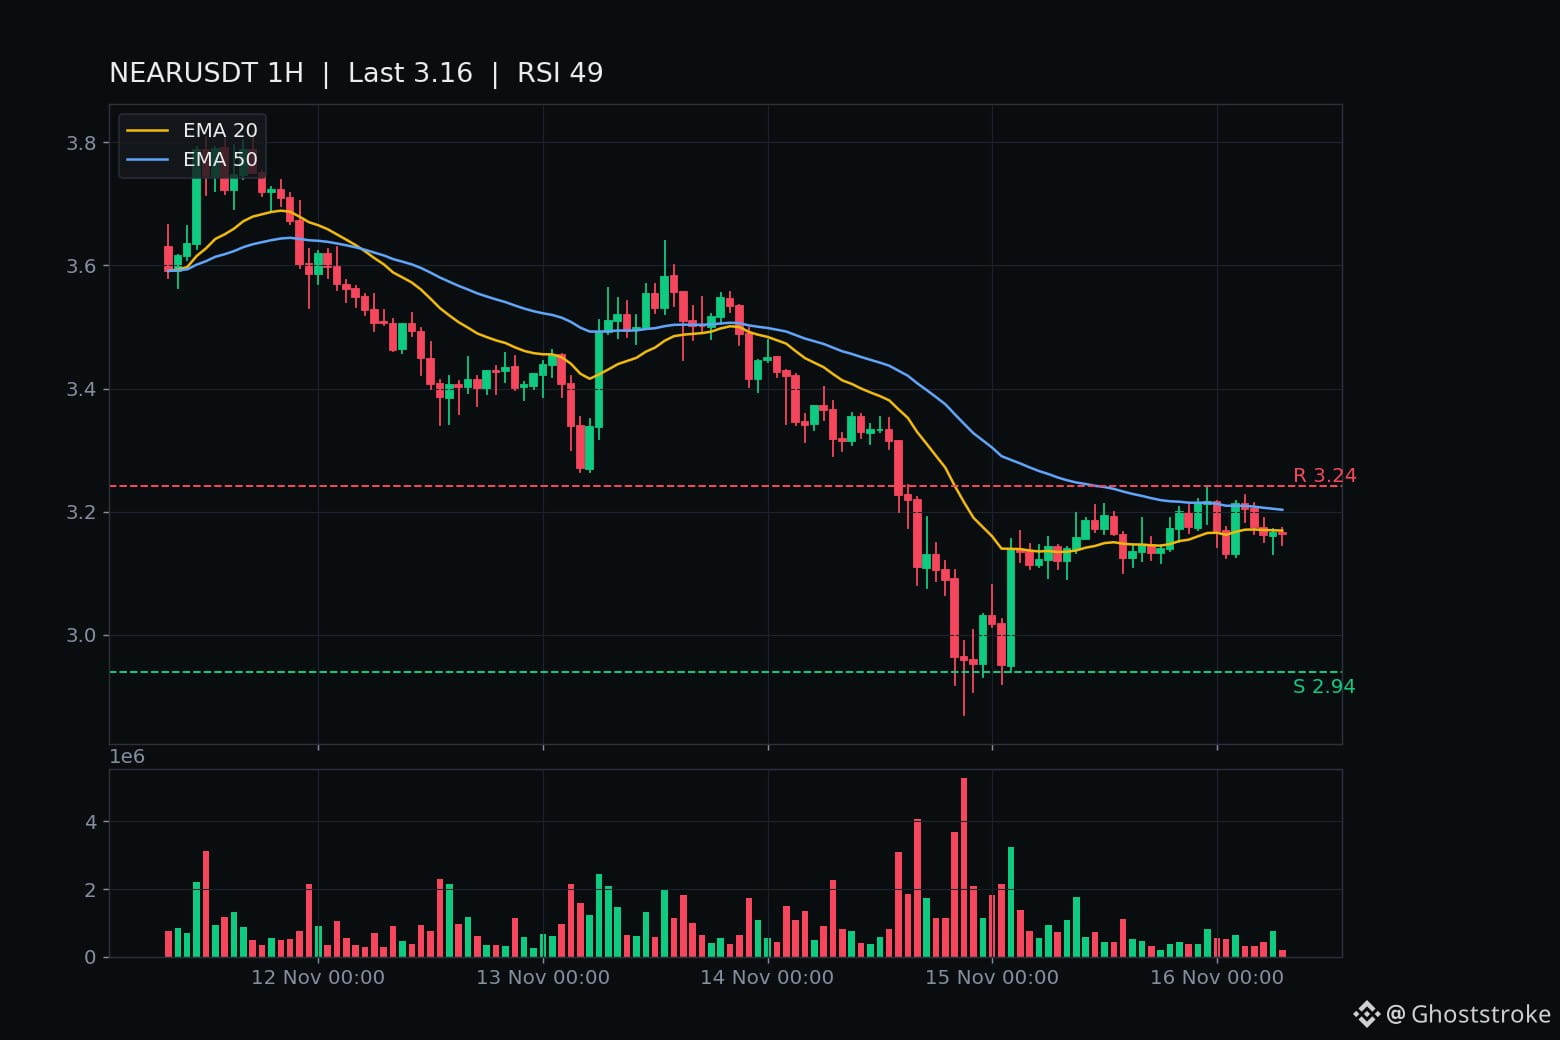
Door 1 — $NEAR, $3.17. It printed $3.212 and $3.204 above the $3.20 line at 02:00 and 03:00 UTC, then rolled: $3.175, $3.162, $3.165, $3.154 at 07:00. Four straight closes under, and the 06:00 bar was the heaviest of the leg at $2.44M. Chart says RSI 49, parked under EMA20 $3.17 and EMA50 $3.20, resistance $3.24, support $2.94. Rank #23, $4.14B, down 37.6% in 30 days.
Door 2 — $ADA, $0.1526. Same script, smaller numbers. The reclaim printed $0.1547 and $0.1541 above $0.1539, then $0.1536, $0.1529, $0.1529, $0.1521 at 07:00 — four closes under. RSI 45, under EMA20 $0.1535 and EMA50 $0.1558, resistance $0.1567, support $0.1431. Rank #18, $5.71B, down 32.1% in 30 days. One write-up credits the bounce to TapDano and a Node 11.3 pre-release — if that's the tailwind and the line still didn't hold, that's the louder signal.
My pick is Door 2. A reclaim that dies with good news in the air tells you more than one that dies on silence.
The other side: the 07:00 bars were the lightest of the leg on both coins, RSI is mid-40s, not washed out, and one hourly close back above either line unwrites its door. BTC's flat at $64,624 — this is a slow bleed, not a flush.
Kickers: SOPH and ZIL held their ATLs past the 11:30 IST delisting hour — SOPH even printed a fresh $0.00085 low, then closed back above the line. INIT deepened its fresh low on two closes under $0.10295.
Not a call, either way. Which one gets back above its line first — NEAR or ADA?
$1M to deploy today. Two doors. ENTRY 226.
Both of them reclaimed a line last night. Both just gave it back — four closes in a row under, on the same bell.
Door 1 — $NEAR , $3.17. It printed $3.212 and $3.204 above the $3.20 line at 02:00 and 03:00 UTC, then rolled: $3.175, $3.162, $3.165, $3.154 at 07:00. Four straight closes under, and the 06:00 bar was the heaviest of the leg at $2.44M. Chart says RSI 49, parked under EMA20 $3.17 and EMA50 $3.20, resistance $3.24, support $2.94. Rank #23, $4.14B, down 37.6% in 30 days.
Door 2 — $ADA , $0.1526. Same script, smaller numbers. The reclaim printed $0.1547 and $0.1541 above $0.1539, then $0.1536, $0.1529, $0.1529, $0.1521 at 07:00 — four closes under. RSI 45, under EMA20 $0.1535 and EMA50 $0.1558, resistance $0.1567, support $0.1431. Rank #18, $5.71B, down 32.1% in 30 days. One write-up credits the bounce to TapDano and a Node 11.3 pre-release — if that's the tailwind and the line still didn't hold, that's the louder signal.
My pick is Door 2. A reclaim that dies with good news in the air tells you more than one that dies on silence.
The other side: the 07:00 bars were the lightest of the leg on both coins, RSI is mid-40s, not washed out, and one hourly close back above either line unwrites its door. BTC's flat at $64,624 — this is a slow bleed, not a flush.
Kickers: SOPH and ZIL held their ATLs past the 11:30 IST delisting hour — SOPH even printed a fresh $0.00085 low, then closed back above the line. INIT deepened its fresh low on two closes under $0.10295.
Not a call, either way. Which one gets back above its line first — NEAR or ADA?
Both of them reclaimed a line last night. Both just gave it back — four closes in a row under, on the same bell.
Door 1 — $NEAR , $3.17. It printed $3.212 and $3.204 above the $3.20 line at 02:00 and 03:00 UTC, then rolled: $3.175, $3.162, $3.165, $3.154 at 07:00. Four straight closes under, and the 06:00 bar was the heaviest of the leg at $2.44M. Chart says RSI 49, parked under EMA20 $3.17 and EMA50 $3.20, resistance $3.24, support $2.94. Rank #23, $4.14B, down 37.6% in 30 days.
Door 2 — $ADA , $0.1526. Same script, smaller numbers. The reclaim printed $0.1547 and $0.1541 above $0.1539, then $0.1536, $0.1529, $0.1529, $0.1521 at 07:00 — four closes under. RSI 45, under EMA20 $0.1535 and EMA50 $0.1558, resistance $0.1567, support $0.1431. Rank #18, $5.71B, down 32.1% in 30 days. One write-up credits the bounce to TapDano and a Node 11.3 pre-release — if that's the tailwind and the line still didn't hold, that's the louder signal.
My pick is Door 2. A reclaim that dies with good news in the air tells you more than one that dies on silence.
The other side: the 07:00 bars were the lightest of the leg on both coins, RSI is mid-40s, not washed out, and one hourly close back above either line unwrites its door. BTC's flat at $64,624 — this is a slow bleed, not a flush.
Kickers: SOPH and ZIL held their ATLs past the 11:30 IST delisting hour — SOPH even printed a fresh $0.00085 low, then closed back above the line. INIT deepened its fresh low on two closes under $0.10295.
Not a call, either way. Which one gets back above its line first — NEAR or ADA?
67

Coin spotlight: $NEAR (NEAR Protocol)
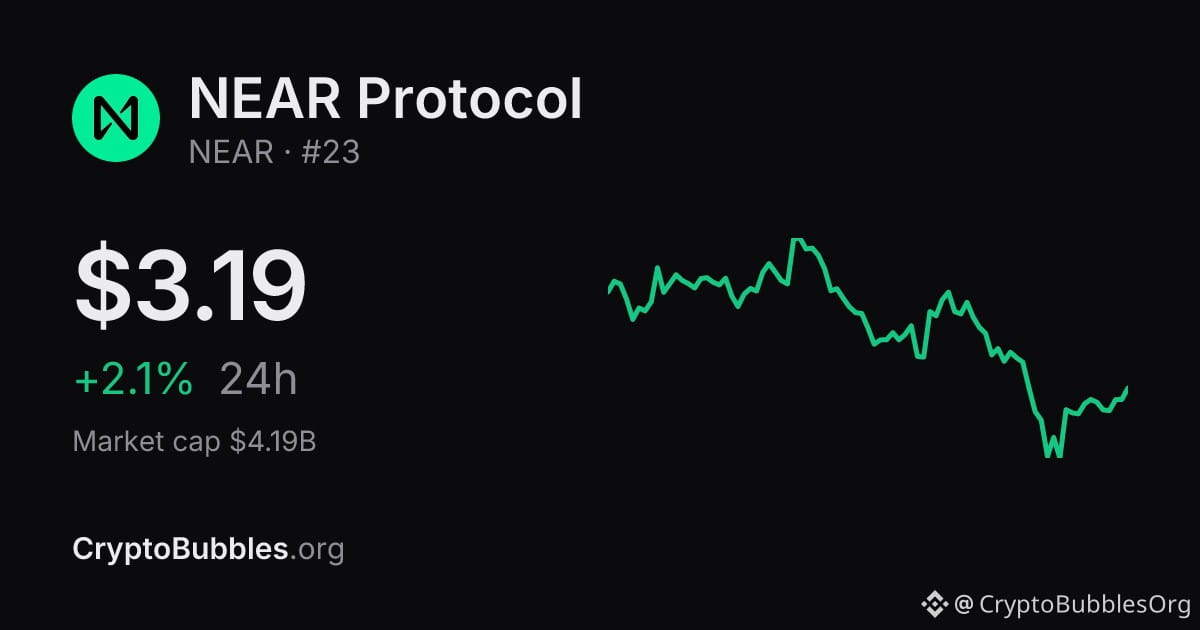
Price: $3.19
24h +2.1% · 7d -11.9% · 30d -37.0%
Rank #23 · market cap $4.2B
All-time high: $20.44
Down 84% from the top. Written off, or the comeback story of the cycle?
Bullish or bearish on $NEAR from here?
Follow for the whole market in bubbles, every hour.
#Crypto
Coin spotlight: $NEAR (NEAR Protocol)
Price: $3.19
24h +2.1% · 7d -11.9% · 30d -37.0%
Rank #23 · market cap $4.2B
All-time high: $20.44
Down 84% from the top. Written off, or the comeback story of the cycle?
Bullish or bearish on $NEAR from here?
Follow for the whole market in bubbles, every hour.
#Crypto
Price: $3.19
24h +2.1% · 7d -11.9% · 30d -37.0%
Rank #23 · market cap $4.2B
All-time high: $20.44
Down 84% from the top. Written off, or the comeback story of the cycle?
Bullish or bearish on $NEAR from here?
Follow for the whole market in bubbles, every hour.
#Crypto
10
·
--
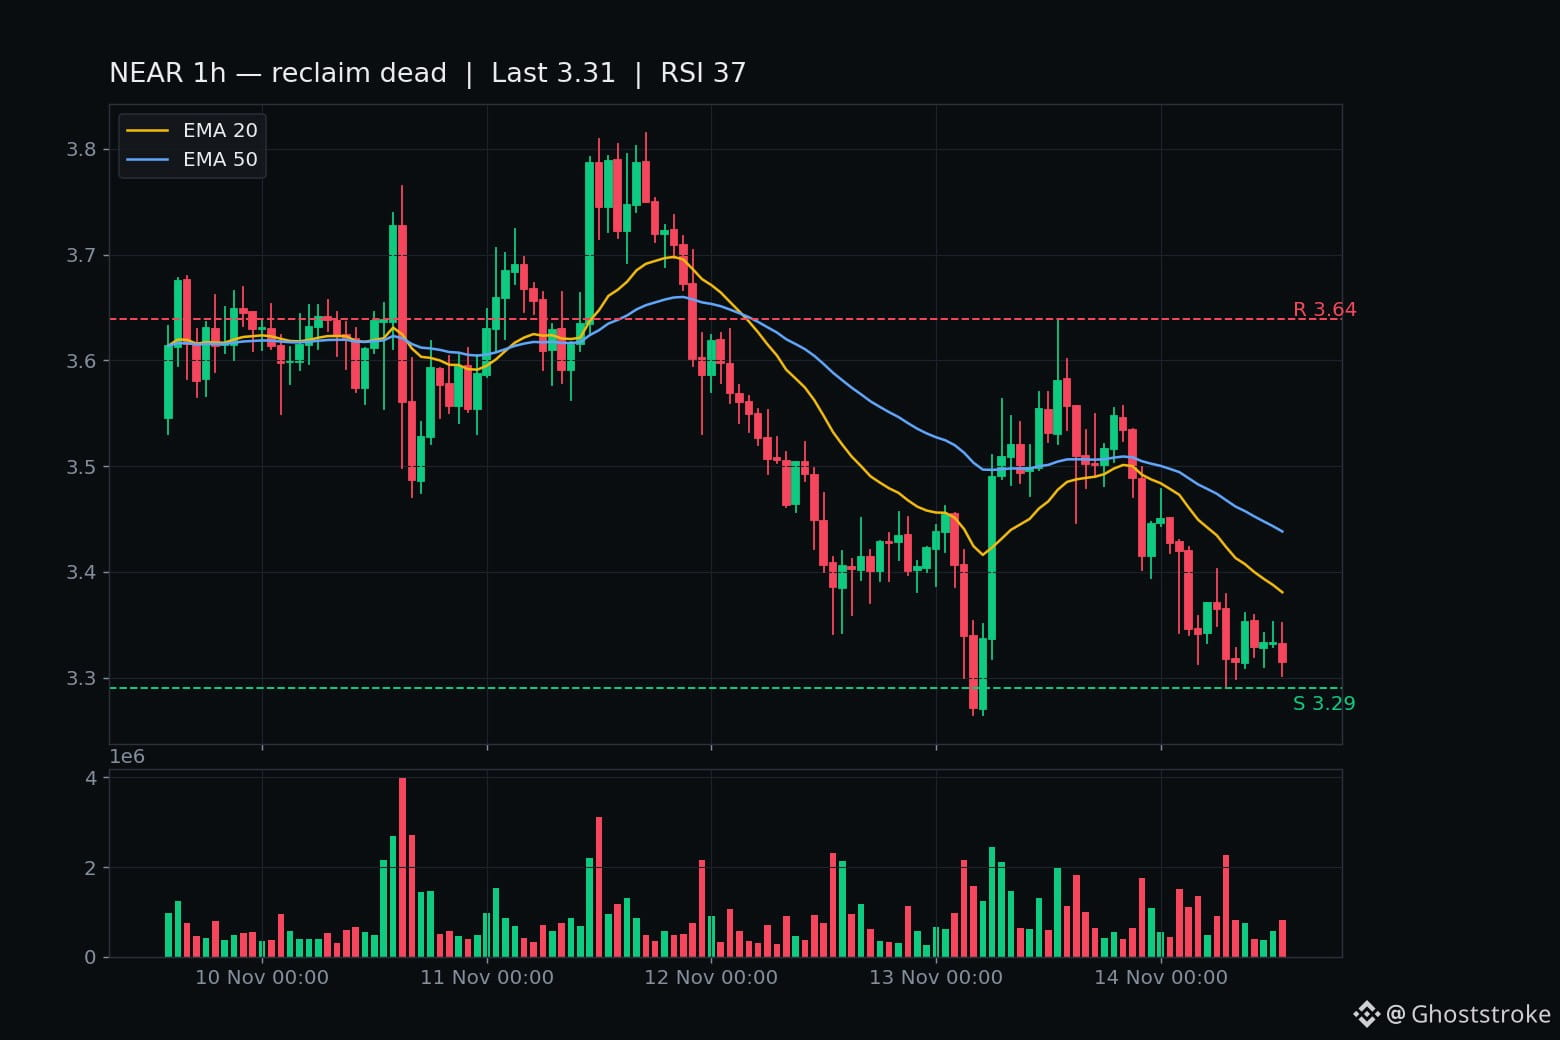
$NEAR just printed $3.20 — and the reclaim that saved it yesterday is dead.
The line was $3.341. On Thursday it gave way twice — 03:00 UTC closed $3.339, 04:00 closed $3.271 — then the reclaim came: 06:00 closed $3.490 on $8.38M, the day's biggest bar, and by 13:00 it had tagged $3.639.
That reclaim is now fully unwound.
Today the first close back under $3.341 came at 07:00 UTC — $3.318 on $7.57M, the day's biggest NEAR bar. Six of the seven closed hours since are under the line. The one dead-cat try, 09:00 at $3.353, was sold the next hour. 13:00 closed $3.315.
The forming 14:00 hour is printing $3.20 right now — a fresh low — but it's unclosed. Its 15:00 UTC close (20:30 IST) is the verdict, not a level yet.
Live at publish: $3.22, -10.0% on the day, $80.2M of Binance volume. Rank #23, $4.23B, -27.5% in 30 days, -84% off the $20.44 high. Chart: RSI 37, under EMA20 $3.38 and EMA50 $3.44.
No fresh NEAR headline — this is tape, not news. Bitcoin is $66,090, -4.4%, and NEAR is running about twice as weak. The launch math keeps getting worse: $5.45 in October to $3.22 now, -41%.
The other side: RSI 37 is not the RSI 17 of the November 3 flush, and this line whipsawed once before — one hourly close back above $3.403 unwrites the chapter.
This is a watch, not a call.
The same 15:00 UTC bell also decides $ZEC at $891.22 and $BNB at $600. Does $3.20 hold, or does the next closed hour take it out?
$NEAR just printed $3.20 — and the reclaim that saved it yesterday is dead.
The line was $3.341. On Thursday it gave way twice — 03:00 UTC closed $3.339, 04:00 closed $3.271 — then the reclaim came: 06:00 closed $3.490 on $8.38M, the day's biggest bar, and by 13:00 it had tagged $3.639.
That reclaim is now fully unwound.
Today the first close back under $3.341 came at 07:00 UTC — $3.318 on $7.57M, the day's biggest NEAR bar. Six of the seven closed hours since are under the line. The one dead-cat try, 09:00 at $3.353, was sold the next hour. 13:00 closed $3.315.
The forming 14:00 hour is printing $3.20 right now — a fresh low — but it's unclosed. Its 15:00 UTC close (20:30 IST) is the verdict, not a level yet.
Live at publish: $3.22, -10.0% on the day, $80.2M of Binance volume. Rank #23, $4.23B, -27.5% in 30 days, -84% off the $20.44 high. Chart: RSI 37, under EMA20 $3.38 and EMA50 $3.44.
No fresh NEAR headline — this is tape, not news. Bitcoin is $66,090, -4.4%, and NEAR is running about twice as weak. The launch math keeps getting worse: $5.45 in October to $3.22 now, -41%.
The other side: RSI 37 is not the RSI 17 of the November 3 flush, and this line whipsawed once before — one hourly close back above $3.403 unwrites the chapter.
This is a watch, not a call.
The same 15:00 UTC bell also decides $ZEC at $891.22 and $BNB at $600. Does $3.20 hold, or does the next closed hour take it out?
The line was $3.341. On Thursday it gave way twice — 03:00 UTC closed $3.339, 04:00 closed $3.271 — then the reclaim came: 06:00 closed $3.490 on $8.38M, the day's biggest bar, and by 13:00 it had tagged $3.639.
That reclaim is now fully unwound.
Today the first close back under $3.341 came at 07:00 UTC — $3.318 on $7.57M, the day's biggest NEAR bar. Six of the seven closed hours since are under the line. The one dead-cat try, 09:00 at $3.353, was sold the next hour. 13:00 closed $3.315.
The forming 14:00 hour is printing $3.20 right now — a fresh low — but it's unclosed. Its 15:00 UTC close (20:30 IST) is the verdict, not a level yet.
Live at publish: $3.22, -10.0% on the day, $80.2M of Binance volume. Rank #23, $4.23B, -27.5% in 30 days, -84% off the $20.44 high. Chart: RSI 37, under EMA20 $3.38 and EMA50 $3.44.
No fresh NEAR headline — this is tape, not news. Bitcoin is $66,090, -4.4%, and NEAR is running about twice as weak. The launch math keeps getting worse: $5.45 in October to $3.22 now, -41%.
The other side: RSI 37 is not the RSI 17 of the November 3 flush, and this line whipsawed once before — one hourly close back above $3.403 unwrites the chapter.
This is a watch, not a call.
The same 15:00 UTC bell also decides $ZEC at $891.22 and $BNB at $600. Does $3.20 hold, or does the next closed hour take it out?
372
·
--
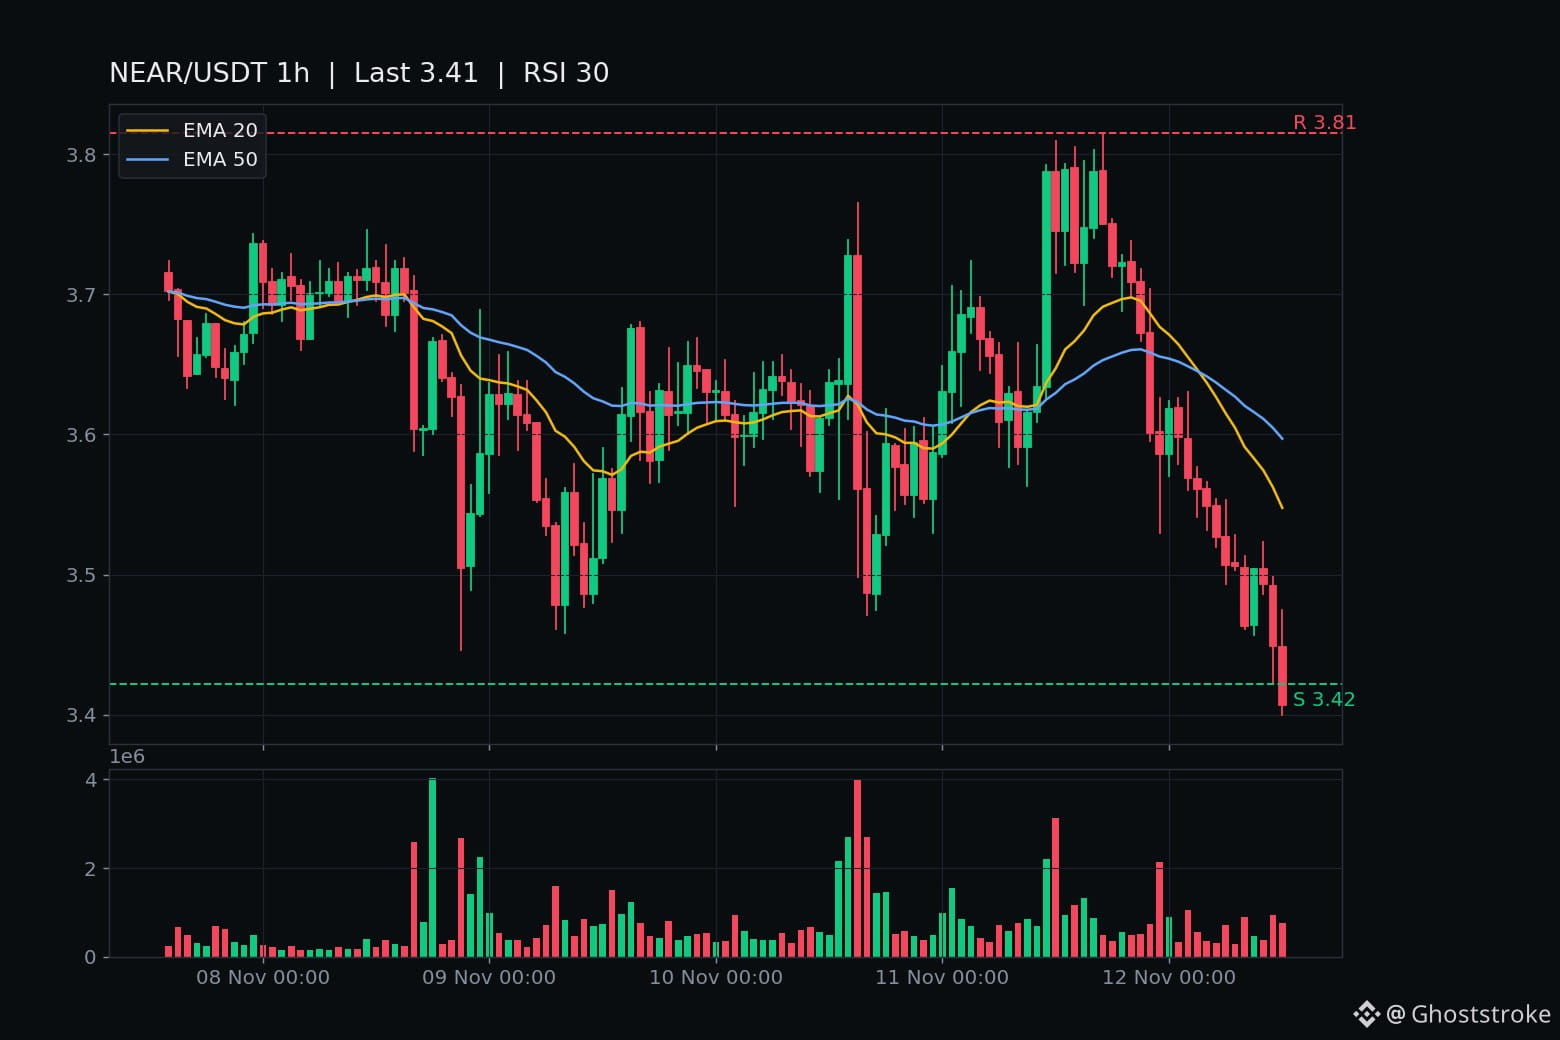
$NEAR just closed an hour under $3.42 — and that was the last shelf the whole bleed was standing on.
Post 817's named line broke on the 12:00 UTC bell. The tape: Nov 11 21:00 UTC closed $3.672, the first hour under the $3.69 floor — fifteen straight closes under it after that, fresh 24h low $3.422. Then 12:00 UTC today: opened $3.448, low $3.400, closed $3.407 on $2.61M. First closed hour under the fresh low.
The forming 13:00 hour is still open — low $3.341, live $3.394 — and its 14:00 UTC close (19:30 IST) is the next verdict, not a level yet.
Live: $3.394, -10.0% in 24h, high $3.815 / low $3.341, $67.6M Binance volume on 266k trades. Chart (119 closed hours): RSI 29.6, pinned under EMA20 $3.55 / EMA50 $3.60, resistance $3.815, window -9.0%.
CoinGecko: rank #23, $4.42B, 7d -14.3%, 30d -33.8%, fully circulating 1.31B — no unlock overhang — and still -83.5% off the $20.44 all-time high.
No fresh NEAR headline behind this — the newest items are prediction pieces and a Nov 4 support note. It's the board doing it: $BTC $72,697, -1.7%, fresh 24h low $72,234. $BNB's forming hour printed $652, a fresh low of its own, also unclosed.
The honest other side: RSI near 30 is exactly where flushes bounce hardest, and one hourly close back above $3.422 turns this break into a wick. The next shelf down is $3.403, the Sep 19 daily low — a closed hour under that, and it's air to $3.06.
Levels: $3.422 broken (hourly close back above = break unwritten); $3.403 (closed hour below = September shelf gone); $3.06 (September base); above, $3.69 the broken floor and $3.756 the ceiling.
Not a call, either way. But the 14:00 UTC close decides it: does the forming hour close under $3.403, or does RSI-30 snap it back above $3.42?
$NEAR just closed an hour under $3.42 — and that was the last shelf the whole bleed was standing on.
Post 817's named line broke on the 12:00 UTC bell. The tape: Nov 11 21:00 UTC closed $3.672, the first hour under the $3.69 floor — fifteen straight closes under it after that, fresh 24h low $3.422. Then 12:00 UTC today: opened $3.448, low $3.400, closed $3.407 on $2.61M. First closed hour under the fresh low.
The forming 13:00 hour is still open — low $3.341, live $3.394 — and its 14:00 UTC close (19:30 IST) is the next verdict, not a level yet.
Live: $3.394, -10.0% in 24h, high $3.815 / low $3.341, $67.6M Binance volume on 266k trades. Chart (119 closed hours): RSI 29.6, pinned under EMA20 $3.55 / EMA50 $3.60, resistance $3.815, window -9.0%.
CoinGecko: rank #23, $4.42B, 7d -14.3%, 30d -33.8%, fully circulating 1.31B — no unlock overhang — and still -83.5% off the $20.44 all-time high.
No fresh NEAR headline behind this — the newest items are prediction pieces and a Nov 4 support note. It's the board doing it: $BTC $72,697, -1.7%, fresh 24h low $72,234. $BNB 's forming hour printed $652, a fresh low of its own, also unclosed.
The honest other side: RSI near 30 is exactly where flushes bounce hardest, and one hourly close back above $3.422 turns this break into a wick. The next shelf down is $3.403, the Sep 19 daily low — a closed hour under that, and it's air to $3.06.
Levels: $3.422 broken (hourly close back above = break unwritten); $3.403 (closed hour below = September shelf gone); $3.06 (September base); above, $3.69 the broken floor and $3.756 the ceiling.
Not a call, either way. But the 14:00 UTC close decides it: does the forming hour close under $3.403, or does RSI-30 snap it back above $3.42?
Post 817's named line broke on the 12:00 UTC bell. The tape: Nov 11 21:00 UTC closed $3.672, the first hour under the $3.69 floor — fifteen straight closes under it after that, fresh 24h low $3.422. Then 12:00 UTC today: opened $3.448, low $3.400, closed $3.407 on $2.61M. First closed hour under the fresh low.
The forming 13:00 hour is still open — low $3.341, live $3.394 — and its 14:00 UTC close (19:30 IST) is the next verdict, not a level yet.
Live: $3.394, -10.0% in 24h, high $3.815 / low $3.341, $67.6M Binance volume on 266k trades. Chart (119 closed hours): RSI 29.6, pinned under EMA20 $3.55 / EMA50 $3.60, resistance $3.815, window -9.0%.
CoinGecko: rank #23, $4.42B, 7d -14.3%, 30d -33.8%, fully circulating 1.31B — no unlock overhang — and still -83.5% off the $20.44 all-time high.
No fresh NEAR headline behind this — the newest items are prediction pieces and a Nov 4 support note. It's the board doing it: $BTC $72,697, -1.7%, fresh 24h low $72,234. $BNB 's forming hour printed $652, a fresh low of its own, also unclosed.
The honest other side: RSI near 30 is exactly where flushes bounce hardest, and one hourly close back above $3.422 turns this break into a wick. The next shelf down is $3.403, the Sep 19 daily low — a closed hour under that, and it's air to $3.06.
Levels: $3.422 broken (hourly close back above = break unwritten); $3.403 (closed hour below = September shelf gone); $3.06 (September base); above, $3.69 the broken floor and $3.756 the ceiling.
Not a call, either way. But the 14:00 UTC close decides it: does the forming hour close under $3.403, or does RSI-30 snap it back above $3.42?
97

·
--
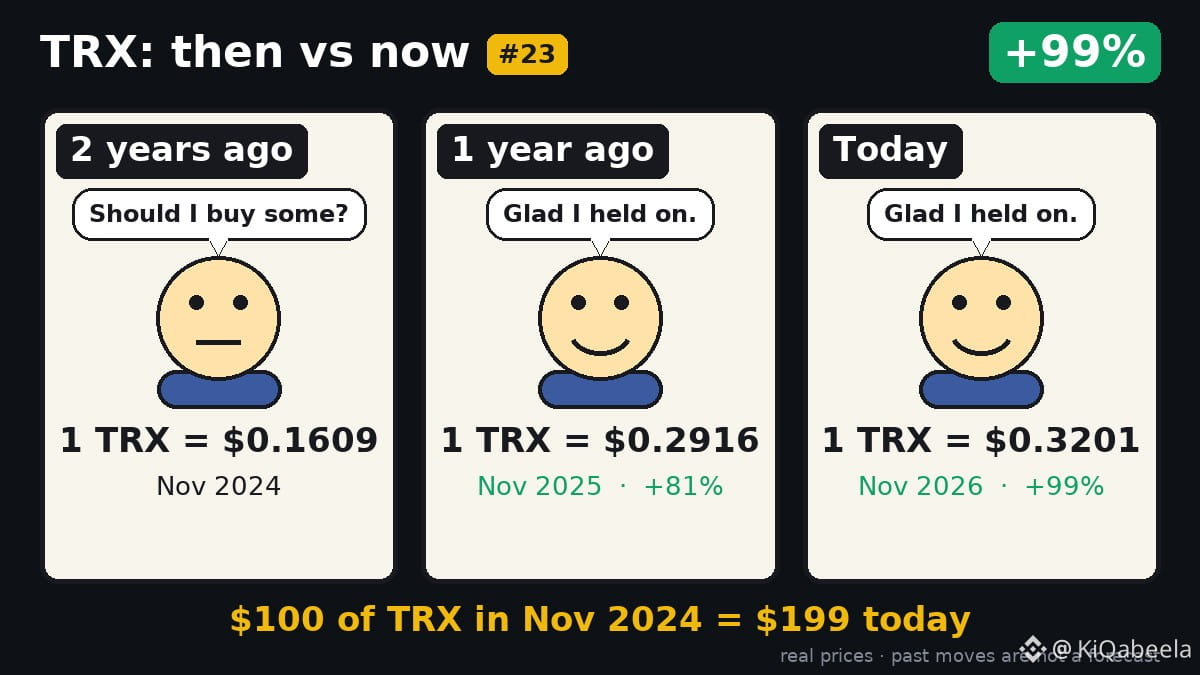
Two years ago $TRX closed at $0.1609, nearly doubling since.
A $100 stake back then would be worth $199 today, showing a 99% rise.
The climb from $0.1609 to $0.3201 reflects steady demand, but past moves say nothing about the next ones.
💬Holder?
🎨 Then vs Now #23 · a new one every morning
#TRX
Two years ago $TRX closed at $0.1609, nearly doubling since.
A $100 stake back then would be worth $199 today, showing a 99% rise.
The climb from $0.1609 to $0.3201 reflects steady demand, but past moves say nothing about the next ones.
💬Holder?
🎨 Then vs Now #23 · a new one every morning
#TRX
A $100 stake back then would be worth $199 today, showing a 99% rise.
The climb from $0.1609 to $0.3201 reflects steady demand, but past moves say nothing about the next ones.
💬Holder?
🎨 Then vs Now #23 · a new one every morning
#TRX
50

·
--
$TIA This 15m move saw a sharp drop on 1.64x normal volume, but OI fell in tandem—the 1h contract open interest declined by 0.22%, with just over 190K U in notional volume. Price down + open interest down looks more like longs deleveraging or being stopped out than a major influx of new shorts.
The close has already fallen below the low of the last 20 5m candles. Aggressive trade imbalance is -31%, and the buy/sell ratio is 0.52, showing clear selling pressure. The anomaly percentile is 87.9%, ranking #23 across the entire pool, while the notional change ranks #36—not the most extreme, but worth keeping an eye on given the confirmation from market depth.
24h trading volume is only 22.66M, so the pool is relatively thin, and breakouts at this scale can easily reverse. Watch to see whether it can reclaim the range; if not, there may be another leg of excess liquidity being flushed out.
$TIA This 15m move saw a sharp drop on 1.64x normal volume, but OI fell in tandem—the 1h contract open interest declined by 0.22%, with just over 190K U in notional volume. Price down + open interest down looks more like longs deleveraging or being stopped out than a major influx of new shorts.
The close has already fallen below the low of the last 20 5m candles. Aggressive trade imbalance is -31%, and the buy/sell ratio is 0.52, showing clear selling pressure. The anomaly percentile is 87.9%, ranking #23 across the entire pool, while the notional change ranks #36—not the most extreme, but worth keeping an eye on given the confirmation from market depth.
24h trading volume is only 22.66M, so the pool is relatively thin, and breakouts at this scale can easily reverse. Watch to see whether it can reclaim the range; if not, there may be another leg of excess liquidity being flushed out.
The close has already fallen below the low of the last 20 5m candles. Aggressive trade imbalance is -31%, and the buy/sell ratio is 0.52, showing clear selling pressure. The anomaly percentile is 87.9%, ranking #23 across the entire pool, while the notional change ranks #36—not the most extreme, but worth keeping an eye on given the confirmation from market depth.
24h trading volume is only 22.66M, so the pool is relatively thin, and breakouts at this scale can easily reverse. Watch to see whether it can reclaim the range; if not, there may be another leg of excess liquidity being flushed out.
7

·
--
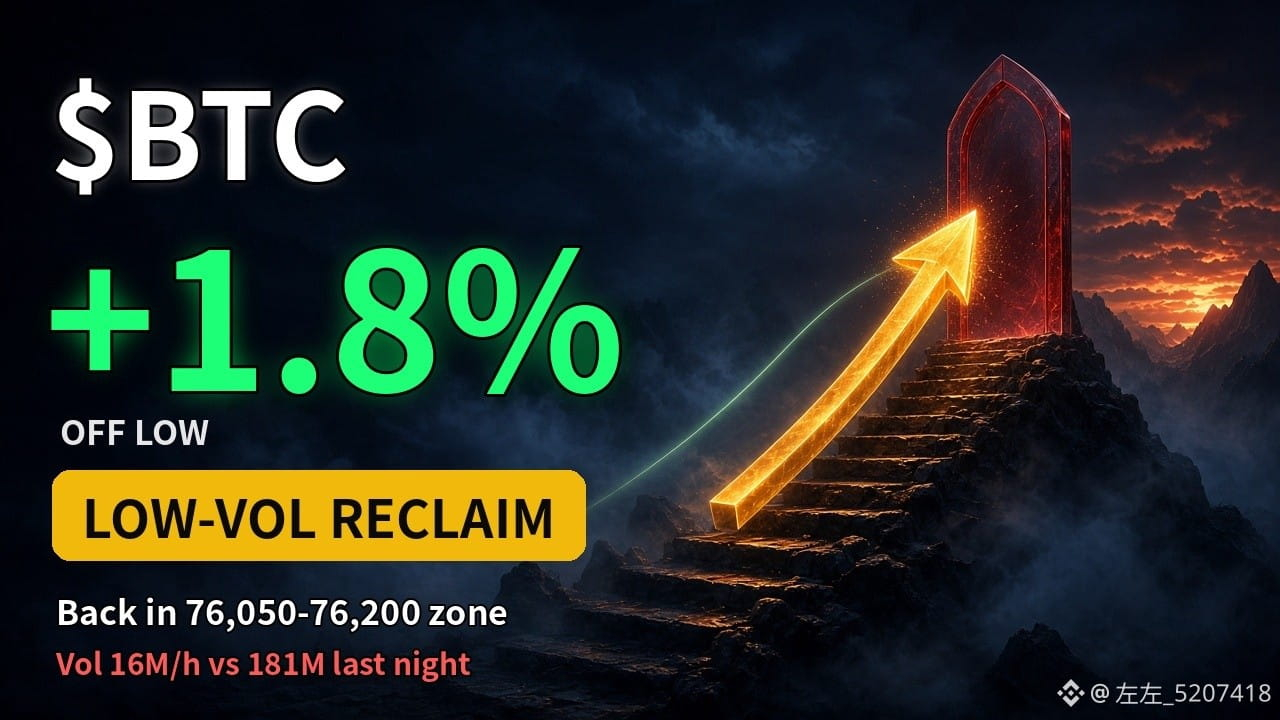
【Zuo Zuo Market Alert】🤔 BTC quietly climbed back to 76,200. Should the bears pull out?
During this morning’s review of the #23 short position, I said: if price reclaims 76,050–76,200 on increased volume, stop chasing shorts.
Price has indeed come back: today’s 11:00 low was 75,790, followed by a steady climb on the 1H chart, reaching 76,249.99 at 17:00. That’s a 1.8% rebound from last night’s low of 74,888.
But volume hasn’t followed at all: last night’s 23:00 1H candle saw 181 million U in volume, while this afternoon’s hourly volume was only around 16 million U. This is a slow, low-volume weekend climb—not a high-volume reclaim.
① A high-volume 1H close above 76,378 (the 24H high) would be the first real break in the bearish structure.
② A drop back below 75,790 means we’re still ranging; the rebound hasn’t taken hold.
③ A break below 74,888 (last night’s low) means the bears are back in control.
With a low-volume weekend rally like this, would you take a position, or wait to see if volume picks up on Monday?
#BTC #比特币 #周末行情 #左左异动速报
$BTC
{future}(BTCUSDT)
【Zuo Zuo Market Alert】🤔 BTC quietly climbed back to 76,200. Should the bears pull out?
During this morning’s review of the #23 short position, I said: if price reclaims 76,050–76,200 on increased volume, stop chasing shorts.
Price has indeed come back: today’s 11:00 low was 75,790, followed by a steady climb on the 1H chart, reaching 76,249.99 at 17:00. That’s a 1.8% rebound from last night’s low of 74,888.
But volume hasn’t followed at all: last night’s 23:00 1H candle saw 181 million U in volume, while this afternoon’s hourly volume was only around 16 million U. This is a slow, low-volume weekend climb—not a high-volume reclaim.
① A high-volume 1H close above 76,378 (the 24H high) would be the first real break in the bearish structure.
② A drop back below 75,790 means we’re still ranging; the rebound hasn’t taken hold.
③ A break below 74,888 (last night’s low) means the bears are back in control.
With a low-volume weekend rally like this, would you take a position, or wait to see if volume picks up on Monday?
#BTC #比特币 #周末行情 #左左异动速报
$BTC
During this morning’s review of the #23 short position, I said: if price reclaims 76,050–76,200 on increased volume, stop chasing shorts.
Price has indeed come back: today’s 11:00 low was 75,790, followed by a steady climb on the 1H chart, reaching 76,249.99 at 17:00. That’s a 1.8% rebound from last night’s low of 74,888.
But volume hasn’t followed at all: last night’s 23:00 1H candle saw 181 million U in volume, while this afternoon’s hourly volume was only around 16 million U. This is a slow, low-volume weekend climb—not a high-volume reclaim.
① A high-volume 1H close above 76,378 (the 24H high) would be the first real break in the bearish structure.
② A drop back below 75,790 means we’re still ranging; the rebound hasn’t taken hold.
③ A break below 74,888 (last night’s low) means the bears are back in control.
With a low-volume weekend rally like this, would you take a position, or wait to see if volume picks up on Monday?
#BTC #比特币 #周末行情 #左左异动速报
$BTC
1
200

·
--
$BTW this 15m move was quite decisive, +3.53%, volume immediately jumped to 2.17x, Z value 2.90, not the kind of fake breakout that just bluffs once. The key is that OI is rising in sync, 15m +0.96%, 1h +1.47%, nominal change on the 1h side brought in 1.10M USDT, abnormal percentile 93.3%, ranked #23 in the entire pool — this structure looks more like fresh leveraged longs putting real money in, rather than shorts being forced to cover.
Price just closed above the upper edge of the near-20 5m range, active trading difference 2.9%, buy-sell ratio 1.06, mildly bullish but not extreme. 24h turnover is 36.47M, and depth is still keeping up. What’s interesting about this position is that it’s already close to its own historical extreme zone, and the full-pool nominal change is also in the top 25, which means it’s not just BTW moving on its own; capital in the pool is also shifting this way.
Of course, a sharp pump + fast OI buildup often means that after this it will either keep squeezing shorts, or there will be a wave of long liquidation and shakeout. I’d personally watch the reaction at the upper edge on the first pullback; if it holds, then we can talk. Chasing strength is left to those with faster hands.
$BTW this 15m move was quite decisive, +3.53%, volume immediately jumped to 2.17x, Z value 2.90, not the kind of fake breakout that just bluffs once. The key is that OI is rising in sync, 15m +0.96%, 1h +1.47%, nominal change on the 1h side brought in 1.10M USDT, abnormal percentile 93.3%, ranked #23 in the entire pool — this structure looks more like fresh leveraged longs putting real money in, rather than shorts being forced to cover.
Price just closed above the upper edge of the near-20 5m range, active trading difference 2.9%, buy-sell ratio 1.06, mildly bullish but not extreme. 24h turnover is 36.47M, and depth is still keeping up. What’s interesting about this position is that it’s already close to its own historical extreme zone, and the full-pool nominal change is also in the top 25, which means it’s not just BTW moving on its own; capital in the pool is also shifting this way.
Of course, a sharp pump + fast OI buildup often means that after this it will either keep squeezing shorts, or there will be a wave of long liquidation and shakeout. I’d personally watch the reaction at the upper edge on the first pullback; if it holds, then we can talk. Chasing strength is left to those with faster hands.
Price just closed above the upper edge of the near-20 5m range, active trading difference 2.9%, buy-sell ratio 1.06, mildly bullish but not extreme. 24h turnover is 36.47M, and depth is still keeping up. What’s interesting about this position is that it’s already close to its own historical extreme zone, and the full-pool nominal change is also in the top 25, which means it’s not just BTW moving on its own; capital in the pool is also shifting this way.
Of course, a sharp pump + fast OI buildup often means that after this it will either keep squeezing shorts, or there will be a wave of long liquidation and shakeout. I’d personally watch the reaction at the upper edge on the first pullback; if it holds, then we can talk. Chasing strength is left to those with faster hands.
7

Article
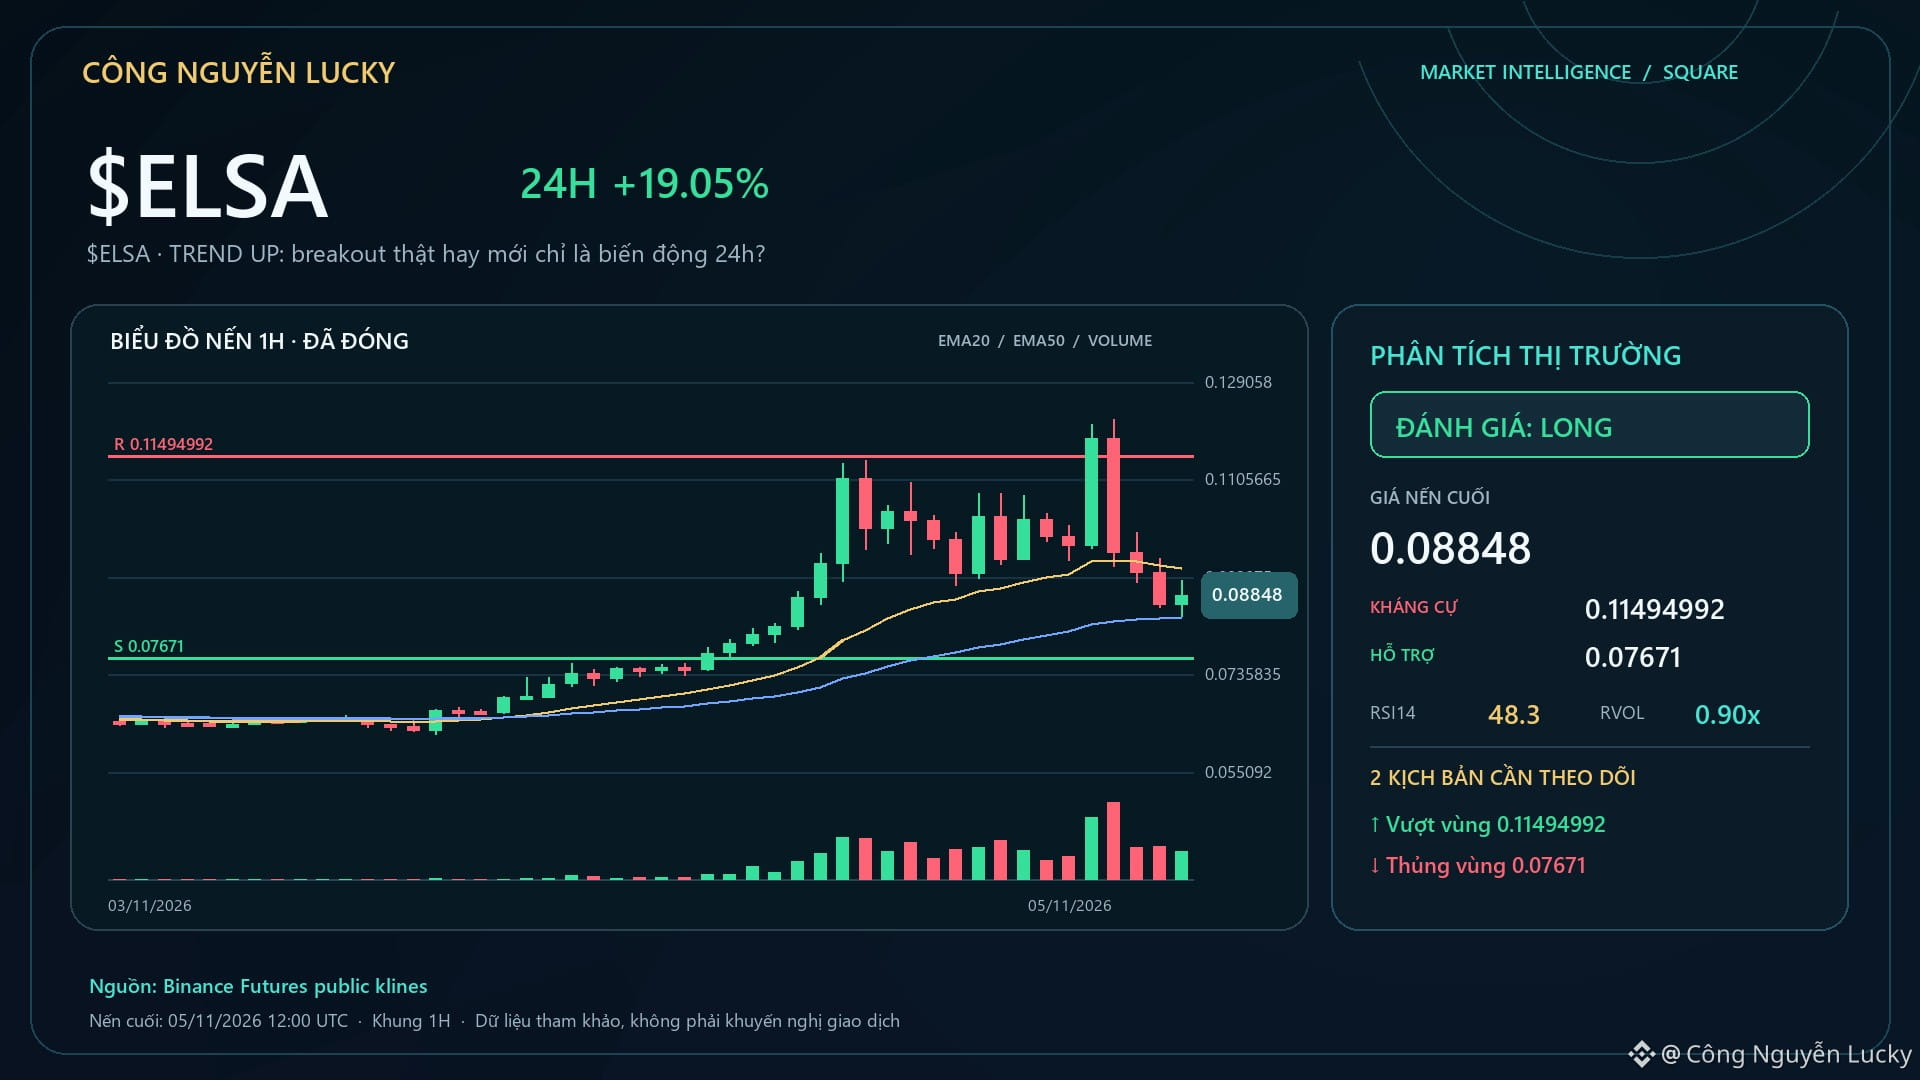
$ELSA · TREND UP: a genuine breakout or just 24-hour volatility?🔥 $ELSA is up +15.50% — but a percentage gain or loss alone isn't enough to call this a good setup. 0.08674 · 24h +15.50% · volume ~324.8M USDT · 3,959,694 trades.
Market-focus participation score: 97/100.
Range position: 28/100. Positive signal: A break above 0.1219 with expanding volume would make the continuation scenario more credible.
Sign to watch for: Failing to hold the highs and dropping back below the midpoint at 0.09765 would make the cooling-off scenario more likely. 📌 LONG/SHORT view: **LONG · STRONG · 87/100**.
$ELSA · TREND UP: a genuine breakout or just 24-hour volatility?
🔥 $ELSA is up +15.50% — but a percentage gain or loss alone isn't enough to call this a good setup. 0.08674 · 24h +15.50% · volume ~324.8M USDT · 3,959,694 trades.
Market-focus participation score: 97/100.
Range position: 28/100. Positive signal: A break above 0.1219 with expanding volume would make the continuation scenario more credible.
Sign to watch for: Failing to hold the highs and dropping back below the midpoint at 0.09765 would make the cooling-off scenario more likely. 📌 LONG/SHORT view: **LONG · STRONG · 87/100**.
Market-focus participation score: 97/100.
Range position: 28/100. Positive signal: A break above 0.1219 with expanding volume would make the continuation scenario more credible.
Sign to watch for: Failing to hold the highs and dropping back below the midpoint at 0.09765 would make the cooling-off scenario more likely. 📌 LONG/SHORT view: **LONG · STRONG · 87/100**.
352
Article
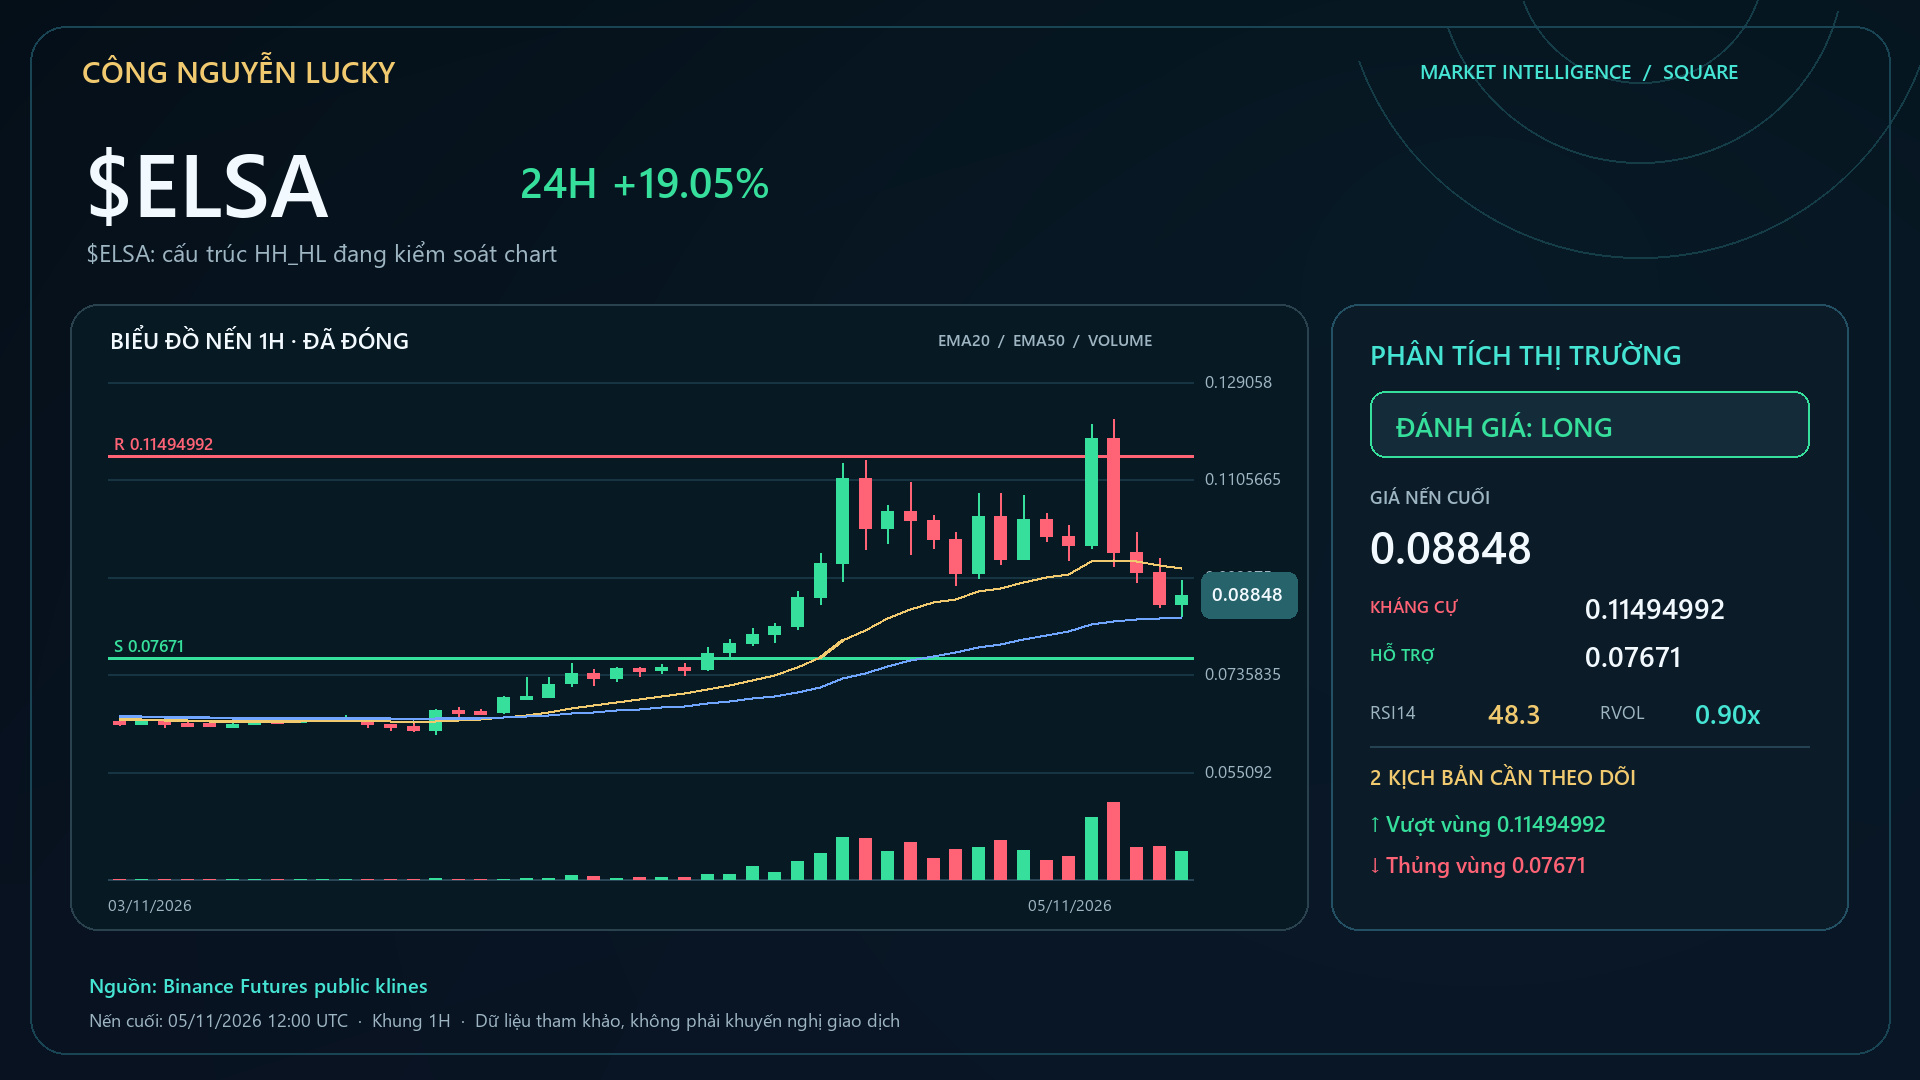
$ELSA: HH_HL structure is in control of the chart🔥 $ELSA is up +13.65% — but a percentage gain or loss alone isn’t enough to call this a good setup. Market: 0.08535 · 24h +13.65% · volume ~324.2M USDT · 3,954,266 trades.
Swing high near 0.1219 · swing low near 0.09042.
EMA50 0.08432625 · RSI14 48.3 · LONG bias 94/100. Indicators are used to confirm the structure, not replace it. Losing 0.07671 or breaking above 0.11494992 would be the clearest points at which the narrative changes. The technical layers are being selected according to the regime:
$ELSA: HH_HL structure is in control of the chart
🔥 $ELSA is up +13.65% — but a percentage gain or loss alone isn’t enough to call this a good setup. Market: 0.08535 · 24h +13.65% · volume ~324.2M USDT · 3,954,266 trades.
Swing high near 0.1219 · swing low near 0.09042.
EMA50 0.08432625 · RSI14 48.3 · LONG bias 94/100. Indicators are used to confirm the structure, not replace it. Losing 0.07671 or breaking above 0.11494992 would be the clearest points at which the narrative changes. The technical layers are being selected according to the regime:
Swing high near 0.1219 · swing low near 0.09042.
EMA50 0.08432625 · RSI14 48.3 · LONG bias 94/100. Indicators are used to confirm the structure, not replace it. Losing 0.07671 or breaking above 0.11494992 would be the clearest points at which the narrative changes. The technical layers are being selected according to the regime:
229
Article
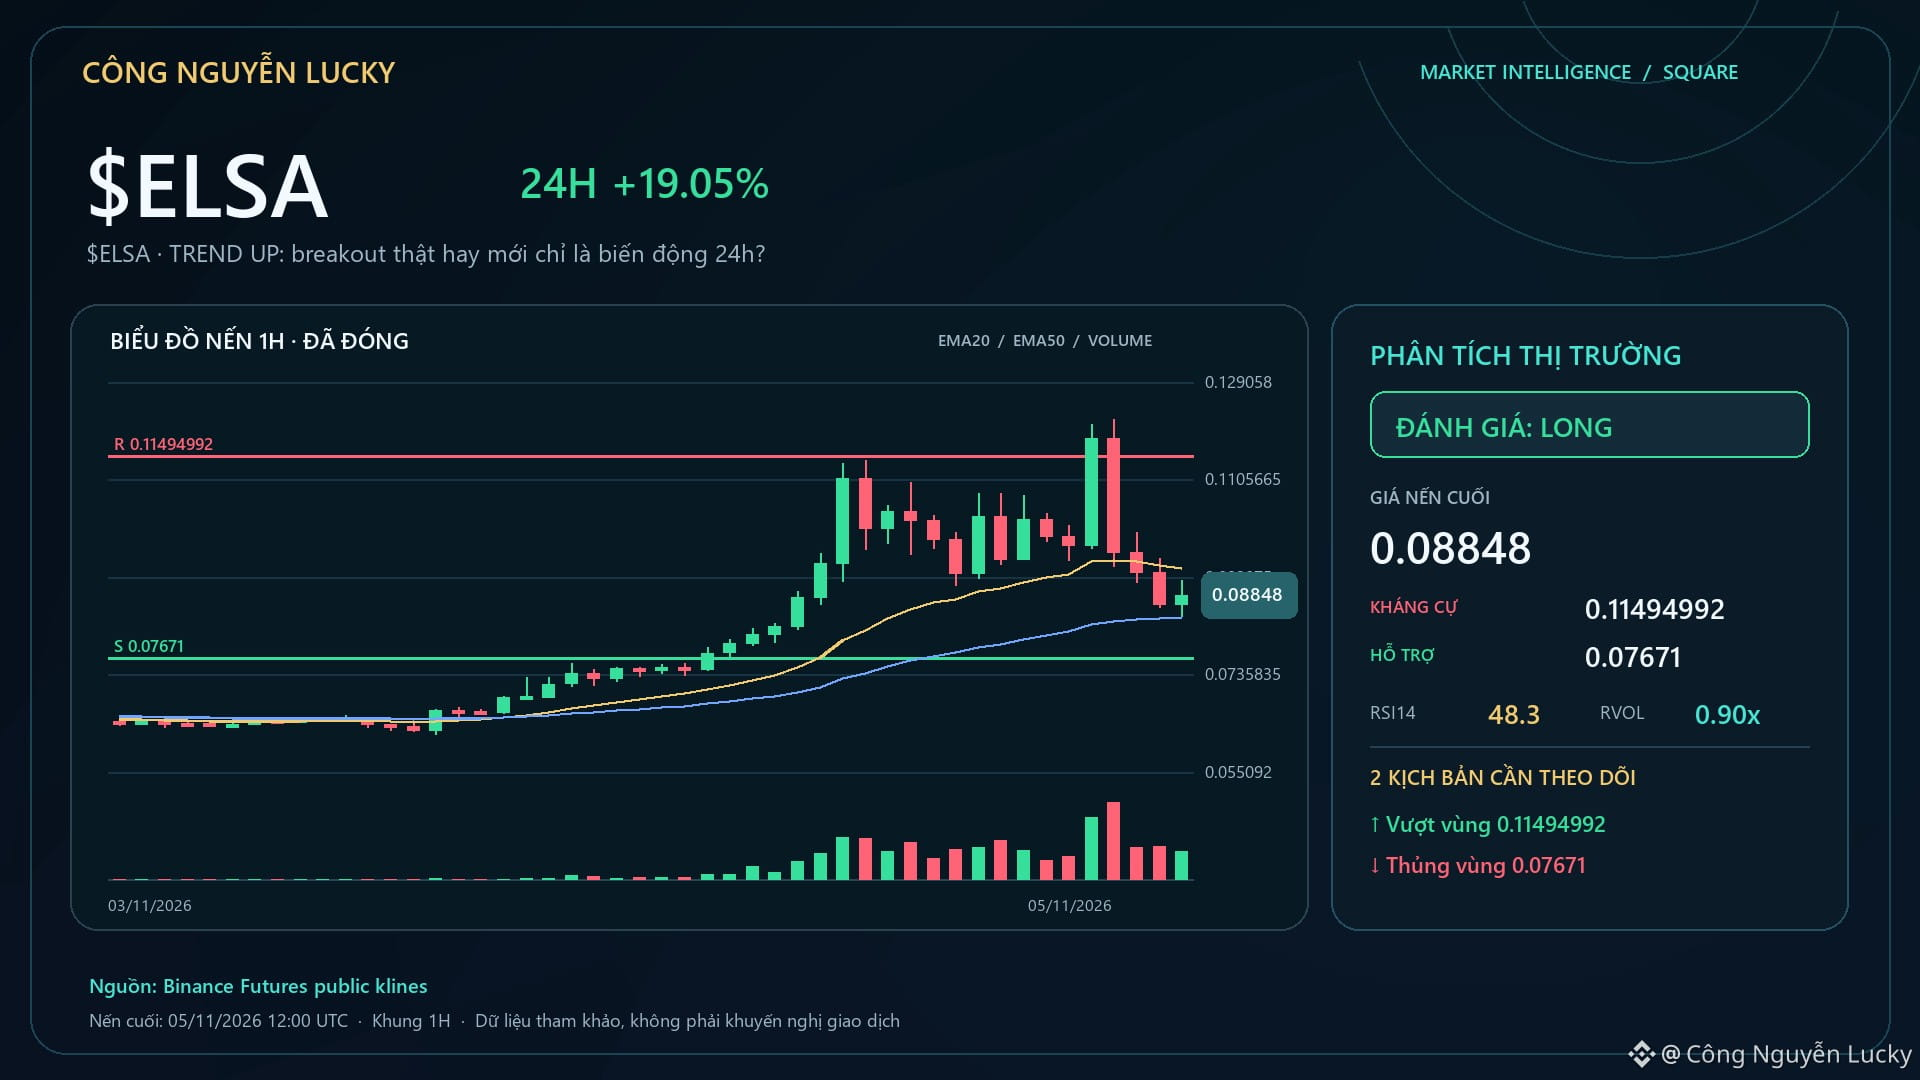
$ELSA · TREND UP: a genuine breakout or just 24-hour volatility?🧠 With $ELSA, getting the direction right still isn’t enough — position size and the invalidation point determine how long you can stay in the trade. Even a good setup can turn into a bad trade if your position is too large. Capital management must come before profit expectations. Current market snapshot: 0.08779 · 24h +17.38% · volume ~322.9M USDT · 3,940,317 trades. The takeaway: The goal is to survive across many probabilities, not to win with one all-in bet.
$ELSA · TREND UP: a genuine breakout or just 24-hour volatility?
🧠 With $ELSA , getting the direction right still isn’t enough — position size and the invalidation point determine how long you can stay in the trade. Even a good setup can turn into a bad trade if your position is too large. Capital management must come before profit expectations. Current market snapshot: 0.08779 · 24h +17.38% · volume ~322.9M USDT · 3,940,317 trades. The takeaway: The goal is to survive across many probabilities, not to win with one all-in bet.
246
·
--
$ESPORTS This 15m surge looks pretty solid: a 2.99% gain on 2.85x volume, with the price breaking above the highs of the past 20 or so 5m candles. OI rose 0.39% over 15m, with 152K in notional value, while the 1h figure was only 1K, suggesting this move is more likely being driven by fresh intraday leveraged longs. The taker flow imbalance is 7.4%, and the buy/sell ratio is 1.16, so buyers are still fairly active. 24h trading volume is 130M, and the asset ranks #23 for notional change in the pool, so liquidity looks adequate. However, the OI percentile is only 52.6%, so things aren't extremely crowded yet. For now, let's see if it can hold above the top of the range.
$ESPORTS This 15m surge looks pretty solid: a 2.99% gain on 2.85x volume, with the price breaking above the highs of the past 20 or so 5m candles. OI rose 0.39% over 15m, with 152K in notional value, while the 1h figure was only 1K, suggesting this move is more likely being driven by fresh intraday leveraged longs. The taker flow imbalance is 7.4%, and the buy/sell ratio is 1.16, so buyers are still fairly active. 24h trading volume is 130M, and the asset ranks #23 for notional change in the pool, so liquidity looks adequate. However, the OI percentile is only 52.6%, so things aren't extremely crowded yet. For now, let's see if it can hold above the top of the range.
7

·
--
$ZEC This 15-minute candle looks a bit ominous. A 2.18% drop isn't huge, but volume surged to 4.59 times its usual level, with a Z-score of 3.46. What does that tell us? This isn't normal turnover—there's real capital rushing to take a position.
More importantly, look at OI: up 1.46% over 15 minutes and 3.16% over 1 hour. The price is falling while open interest is rising. This doesn't look like old longs levering up to buy the dip; it looks more like new shorts entering and pushing the price down. The taker volume delta is -26.6%, and the buy/sell ratio is 0.58, so selling pressure is clearly dominant. The 5-minute Binance futures liquidation proxy is 883K, with liquidations concentrated on the sell side—a leveraged position is getting wiped out in the short term.
But OI is at an anomalous percentile of 92.5%, the anomaly ranks #23 across the entire pool, and the notional change ranks second. This kind of scale isn't something retail traders can produce. The price has just touched the lower end of its recent range, while the funding rate is also near a recent high. That suggests longs have been carrying costs for a while, and now that the price has broken below support, liquidation pressure is being released all at once.
With a coin like ZEC, whose liquidity is unstable, when you see this kind of “simultaneous volume-price anomaly plus concentrated liquidations” in the order book, it often doesn't end with just one wick. I'll watch to see whether the 15-minute candle can reclaim that range boundary. If it can't, there's more momentum to the downside.
$ZEC This 15-minute candle looks a bit ominous. A 2.18% drop isn't huge, but volume surged to 4.59 times its usual level, with a Z-score of 3.46. What does that tell us? This isn't normal turnover—there's real capital rushing to take a position.
More importantly, look at OI: up 1.46% over 15 minutes and 3.16% over 1 hour. The price is falling while open interest is rising. This doesn't look like old longs levering up to buy the dip; it looks more like new shorts entering and pushing the price down. The taker volume delta is -26.6%, and the buy/sell ratio is 0.58, so selling pressure is clearly dominant. The 5-minute Binance futures liquidation proxy is 883K, with liquidations concentrated on the sell side—a leveraged position is getting wiped out in the short term.
But OI is at an anomalous percentile of 92.5%, the anomaly ranks #23 across the entire pool, and the notional change ranks second. This kind of scale isn't something retail traders can produce. The price has just touched the lower end of its recent range, while the funding rate is also near a recent high. That suggests longs have been carrying costs for a while, and now that the price has broken below support, liquidation pressure is being released all at once.
With a coin like ZEC, whose liquidity is unstable, when you see this kind of “simultaneous volume-price anomaly plus concentrated liquidations” in the order book, it often doesn't end with just one wick. I'll watch to see whether the 15-minute candle can reclaim that range boundary. If it can't, there's more momentum to the downside.
More importantly, look at OI: up 1.46% over 15 minutes and 3.16% over 1 hour. The price is falling while open interest is rising. This doesn't look like old longs levering up to buy the dip; it looks more like new shorts entering and pushing the price down. The taker volume delta is -26.6%, and the buy/sell ratio is 0.58, so selling pressure is clearly dominant. The 5-minute Binance futures liquidation proxy is 883K, with liquidations concentrated on the sell side—a leveraged position is getting wiped out in the short term.
But OI is at an anomalous percentile of 92.5%, the anomaly ranks #23 across the entire pool, and the notional change ranks second. This kind of scale isn't something retail traders can produce. The price has just touched the lower end of its recent range, while the funding rate is also near a recent high. That suggests longs have been carrying costs for a while, and now that the price has broken below support, liquidation pressure is being released all at once.
With a coin like ZEC, whose liquidity is unstable, when you see this kind of “simultaneous volume-price anomaly plus concentrated liquidations” in the order book, it often doesn't end with just one wick. I'll watch to see whether the 15-minute candle can reclaim that range boundary. If it can't, there's more momentum to the downside.
2
·
--
$ZRO This 15m move was pretty decisive, with volume jumping straight to 2.33x. It closed above the upper end of the recent 20-candle 5m range, with a buy/sell ratio of 1.64 and an aggressive trade imbalance of 24.4%—clearly, someone was actively scooping up. OI ticked up slightly, while the funding rate is still sitting near recent highs. Structurally, this looks more like new leveraged longs entering than shorts covering. However, 1h OI is still edging down, and the overall pool ranks #23 for anomalies and #20 for notional change. That suggests some capital is paying attention, but there isn’t broad market-wide confirmation yet. Whether to chase is up to you; I’m going to watch whether this volume can hold up, rather than seeing another quick spike get punished by funding.
$ZRO This 15m move was pretty decisive, with volume jumping straight to 2.33x. It closed above the upper end of the recent 20-candle 5m range, with a buy/sell ratio of 1.64 and an aggressive trade imbalance of 24.4%—clearly, someone was actively scooping up. OI ticked up slightly, while the funding rate is still sitting near recent highs. Structurally, this looks more like new leveraged longs entering than shorts covering. However, 1h OI is still edging down, and the overall pool ranks #23 for anomalies and #20 for notional change. That suggests some capital is paying attention, but there isn’t broad market-wide confirmation yet. Whether to chase is up to you; I’m going to watch whether this volume can hold up, rather than seeing another quick spike get punished by funding.
1


·
--
$QNT This 15m breakdown is interesting—the price fell 0.88%, which isn't that steep, but volume jumped to 1.76x, pushing straight through the lower bound of the last 20 5m candles.
The key is that OI is falling too: -0.30% over 15m, -0.36% over 1h, with notional down by 400k U. This doesn't look like new shorts entering and driving the price down; it looks more like longs deleveraging and getting stopped out. The taker volume delta is -2.1%, and the buy/sell ratio is 0.96. There is selling pressure, but it's nowhere near panic levels.
It ranks #15 for anomalies across the whole pool and #23 for notional change, so it's starting to stand out. 24h trading volume is 63M, and liquidity is holding up. I usually wouldn't rush to chase shorts with this kind of setup—deleveraging-driven drops often lack follow-through. We need to see whether new shorts step in after this round of position reduction. For now, watch whether price can reclaim the lower bound of those 20 5m candles. If it can't, then we'll see.
$QNT This 15m breakdown is interesting—the price fell 0.88%, which isn't that steep, but volume jumped to 1.76x, pushing straight through the lower bound of the last 20 5m candles.
The key is that OI is falling too: -0.30% over 15m, -0.36% over 1h, with notional down by 400k U. This doesn't look like new shorts entering and driving the price down; it looks more like longs deleveraging and getting stopped out. The taker volume delta is -2.1%, and the buy/sell ratio is 0.96. There is selling pressure, but it's nowhere near panic levels.
It ranks #15 for anomalies across the whole pool and #23 for notional change, so it's starting to stand out. 24h trading volume is 63M, and liquidity is holding up. I usually wouldn't rush to chase shorts with this kind of setup—deleveraging-driven drops often lack follow-through. We need to see whether new shorts step in after this round of position reduction. For now, watch whether price can reclaim the lower bound of those 20 5m candles. If it can't, then we'll see.
The key is that OI is falling too: -0.30% over 15m, -0.36% over 1h, with notional down by 400k U. This doesn't look like new shorts entering and driving the price down; it looks more like longs deleveraging and getting stopped out. The taker volume delta is -2.1%, and the buy/sell ratio is 0.96. There is selling pressure, but it's nowhere near panic levels.
It ranks #15 for anomalies across the whole pool and #23 for notional change, so it's starting to stand out. 24h trading volume is 63M, and liquidity is holding up. I usually wouldn't rush to chase shorts with this kind of setup—deleveraging-driven drops often lack follow-through. We need to see whether new shorts step in after this round of position reduction. For now, watch whether price can reclaim the lower bound of those 20 5m candles. If it can't, then we'll see.
10
Log in to explore more content
Join global crypto users on Binance Square
⚡️ Get latest and useful information about crypto.
💬 Trusted by the world’s largest crypto exchange.
👍 Discover real insights from verified creators.
Email / Phone number
Trending Topics
1
#CanBTCReboundAfterFallingBelow60K?
0 views
115 Discussing
2
#GlobalStocksFaceLongestLosingStreakSince2023
0 views
268 Discussing
3
#AnthropicPlungesTowardIPOPriceonDay2
0 views
43 Discussing
4
#GaoTengBitcoinETFListsOnHKEX
0 views
261 Discussing
5
#TradFiForBeginners
946,825 views
5,525 Discussing
6
#NvidiaBoardReportedlySplitOverHuang’sReturn
258,674 views
2,405 Discussing
7
#TetherBurns8BillionUSDTInPast20Days
0 views
99 Discussing
8
#BitcoinWalletSignatureFlawExploitableWithinSeconds
0 views
44 Discussing
9
#CanGTA6'sLaunchLiftTTWOShares?
207,868 views
1,711 Discussing
10
#HongKongProposesSFCLicensingForFourVirtualAssetServices
404 views
32 Discussing