
#26
26
10,798 views
218 Discussing
Hot
Latest

·
--
26% increase, but the funding rate is negative?
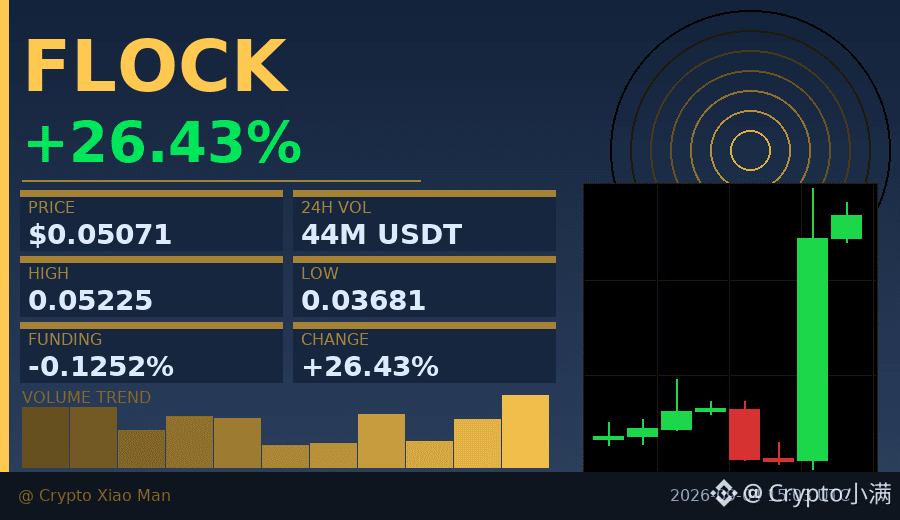
FLOCK rose to 0.05071 today, with trading volume of 44.2 million U, but the funding rate is -0.0125%.
This means shorts are still paying longs—the price is surging, yet no one believes it can last.
The hourly chart has closed green for three straight candles, with longs accounting for 57%, but the negative funding rate shows shorts are still holding on.
This kind of divergence usually appears in the early stage of a move: some traders are already in, while others insist it "will drop back."
The key is whether trading volume can be sustained. If volume keeps expanding, shorts may be forced to cover, accelerating the rally.
$FLOCK #资金费率背离 #26%
Click the small card below to quickly check the market 👇
26% increase, but the funding rate is negative?
FLOCK rose to 0.05071 today, with trading volume of 44.2 million U, but the funding rate is -0.0125%.
This means shorts are still paying longs—the price is surging, yet no one believes it can last.
The hourly chart has closed green for three straight candles, with longs accounting for 57%, but the negative funding rate shows shorts are still holding on.
This kind of divergence usually appears in the early stage of a move: some traders are already in, while others insist it "will drop back."
The key is whether trading volume can be sustained. If volume keeps expanding, shorts may be forced to cover, accelerating the rally.
$FLOCK #资金费率背离 #26%
Click the small card below to quickly check the market 👇
FLOCK rose to 0.05071 today, with trading volume of 44.2 million U, but the funding rate is -0.0125%.
This means shorts are still paying longs—the price is surging, yet no one believes it can last.
The hourly chart has closed green for three straight candles, with longs accounting for 57%, but the negative funding rate shows shorts are still holding on.
This kind of divergence usually appears in the early stage of a move: some traders are already in, while others insist it "will drop back."
The key is whether trading volume can be sustained. If volume keeps expanding, shorts may be forced to cover, accelerating the rally.
$FLOCK #资金费率背离 #26%
Click the small card below to quickly check the market 👇
173

·
--
🚨 BLESS plunged 13% in 1 hour! Still up 4.1% over 24H—the volatility has finally woken up!
But here's the interesting part: trading volume surged to 5.2x, yet the price spiked and then pulled back. The direction signal is still unconfirmed. Social buzz isn't particularly strong either: BSQ is only 27 points, ranked #26.
📊 What does this mean? This isn't fear of missing out—it's a bull trap. Historically, the WAKE signal has led to at least a 3% move within 4 hours about 89% of the time, but its directional accuracy is only around 44%. Correctly predicting volatility doesn't mean correctly predicting the direction.
🎯 No reliable data on key levels yet, so I won't make up prices.
My take: stay on the sidelines; don't bet on a one-way move! Wait for a breakout on increased volume and confirmation of the direction before considering a trade. If the price keeps plunging, beware of late buyers getting left holding the bag.
Do you think BLESS will break upward next, or keep pulling back? 👇 #BLESS #Cryptocurrency
🚨 BLESS plunged 13% in 1 hour! Still up 4.1% over 24H—the volatility has finally woken up!
But here's the interesting part: trading volume surged to 5.2x, yet the price spiked and then pulled back. The direction signal is still unconfirmed. Social buzz isn't particularly strong either: BSQ is only 27 points, ranked #26.
📊 What does this mean? This isn't fear of missing out—it's a bull trap. Historically, the WAKE signal has led to at least a 3% move within 4 hours about 89% of the time, but its directional accuracy is only around 44%. Correctly predicting volatility doesn't mean correctly predicting the direction.
🎯 No reliable data on key levels yet, so I won't make up prices.
My take: stay on the sidelines; don't bet on a one-way move! Wait for a breakout on increased volume and confirmation of the direction before considering a trade. If the price keeps plunging, beware of late buyers getting left holding the bag.
Do you think BLESS will break upward next, or keep pulling back? 👇 #BLESS #Cryptocurrency
But here's the interesting part: trading volume surged to 5.2x, yet the price spiked and then pulled back. The direction signal is still unconfirmed. Social buzz isn't particularly strong either: BSQ is only 27 points, ranked #26.
📊 What does this mean? This isn't fear of missing out—it's a bull trap. Historically, the WAKE signal has led to at least a 3% move within 4 hours about 89% of the time, but its directional accuracy is only around 44%. Correctly predicting volatility doesn't mean correctly predicting the direction.
🎯 No reliable data on key levels yet, so I won't make up prices.
My take: stay on the sidelines; don't bet on a one-way move! Wait for a breakout on increased volume and confirmation of the direction before considering a trade. If the price keeps plunging, beware of late buyers getting left holding the bag.
Do you think BLESS will break upward next, or keep pulling back? 👇 #BLESS #Cryptocurrency
2

·
--
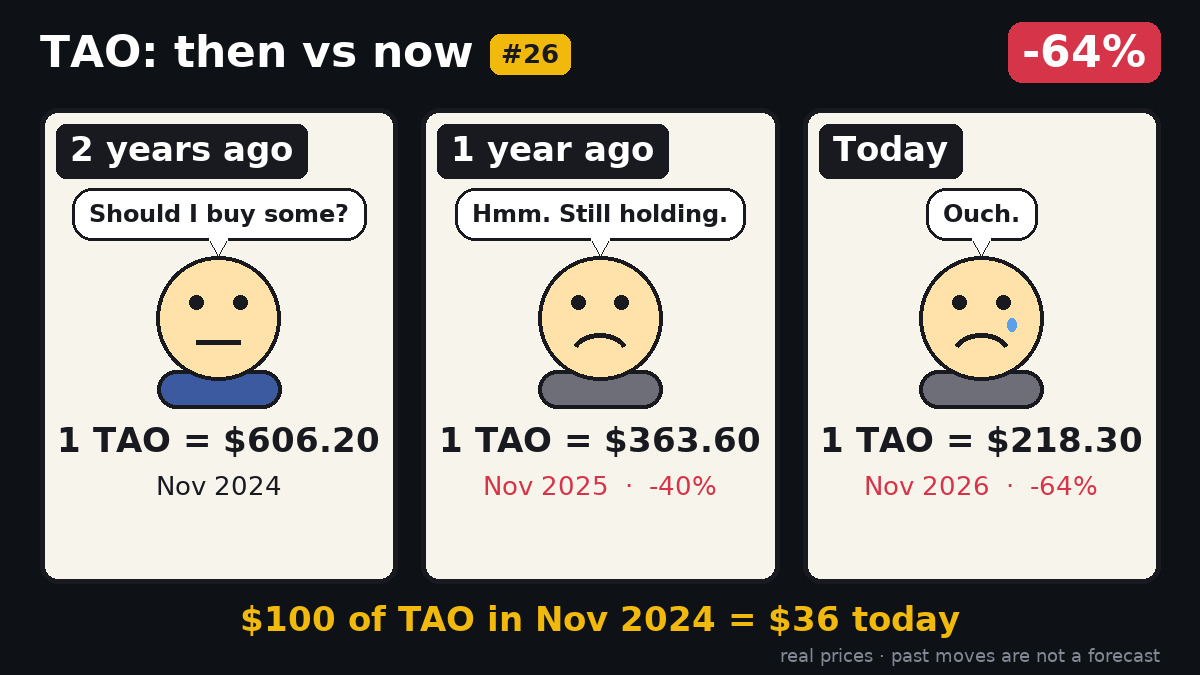
$100 → $36: TAO down 64% since 2024‑11‑11.
Two years ago TAO closed at $606.2, fell to $363.6 a year later, and sits at $218.3 today. That $100 purchase in November 2024 would now be worth just $36.
The slide reflects a steady erosion rather than a single event – a reminder that timing markets is tough.
Past moves say nothing about the next ones.
💬Holder or regret?
🎨 Then vs Now #26 · a new one every morning
$TAO
#TAO
$100 → $36: TAO down 64% since 2024‑11‑11.
Two years ago TAO closed at $606.2, fell to $363.6 a year later, and sits at $218.3 today. That $100 purchase in November 2024 would now be worth just $36.
The slide reflects a steady erosion rather than a single event – a reminder that timing markets is tough.
Past moves say nothing about the next ones.
💬Holder or regret?
🎨 Then vs Now #26 · a new one every morning
$TAO
#TAO
Two years ago TAO closed at $606.2, fell to $363.6 a year later, and sits at $218.3 today. That $100 purchase in November 2024 would now be worth just $36.
The slide reflects a steady erosion rather than a single event – a reminder that timing markets is tough.
Past moves say nothing about the next ones.
💬Holder or regret?
🎨 Then vs Now #26 · a new one every morning
$TAO
#TAO
1
29

·
--
$1M to deploy today. Two doors. ENTRY 141.
Door 1 — $INIT $0.163, +34% in 24 hours. Fourth touch of the $0.15000 line today, and the first that's holding above it with room to spare. The morning spike tagged $0.15000, closed $0.14139, and gave the whole move back in one hour ($0.12899). The 16:00 hour wicked to $0.15382 and closed under the line. The 18:00 hour closed $0.14938 — a hair above the $0.14899 line. The hour now forming has tagged $0.16574. Rank #566, $35M market cap, $35.7M global volume — the whole coin turned over once today. No fresh headline: the standing story is still the October 24 mint-exploit halt and the November 2 restart. RSI 66 on the closed chart, price well above both EMAs.
Door 2 — $AVAX $8.56, +4.3%. The real headline of the day: NYSE plans to use Avalanche for tokenized-stock settlement, Q4 target, approval still pending — and the NYSE runs its own custom chain on Avalanche tech, not the public chain. The tape ripped 16% on it, $7.77 flush low to $9.01, then gave back a third: three straight closes under $8.814, and 18:00 closed $8.552 — the first close under the $8.653 floor. Rank #26, $3.82B, $512M global volume. The $8.453 rip-bar close is the next floor down.
My pick: Door 1. A line that rejected price twice this morning, then saw the 18:00 close land above $0.14899 — and the hour now forming is trading $0.013 above $0.15000. That beats a headline whose floor just broke on a closed candle. The honest other side: INIT's hour isn't closed — the 20:00 UTC close decides it, and this coin gave back a whole spike in sixty minutes this morning. One close back under $0.15000 and the extension is unwritten; one AVAX close above $8.653 and the support-gone chapter is unwritten too.
Not a call, either way. The 20:00 UTC close, 01:30 IST, settles both doors at once — which one are you watching?
$1M to deploy today. Two doors. ENTRY 141.
Door 1 — $INIT $0.163, +34% in 24 hours. Fourth touch of the $0.15000 line today, and the first that's holding above it with room to spare. The morning spike tagged $0.15000, closed $0.14139, and gave the whole move back in one hour ($0.12899). The 16:00 hour wicked to $0.15382 and closed under the line. The 18:00 hour closed $0.14938 — a hair above the $0.14899 line. The hour now forming has tagged $0.16574. Rank #566, $35M market cap, $35.7M global volume — the whole coin turned over once today. No fresh headline: the standing story is still the October 24 mint-exploit halt and the November 2 restart. RSI 66 on the closed chart, price well above both EMAs.
Door 2 — $AVAX $8.56, +4.3%. The real headline of the day: NYSE plans to use Avalanche for tokenized-stock settlement, Q4 target, approval still pending — and the NYSE runs its own custom chain on Avalanche tech, not the public chain. The tape ripped 16% on it, $7.77 flush low to $9.01, then gave back a third: three straight closes under $8.814, and 18:00 closed $8.552 — the first close under the $8.653 floor. Rank #26, $3.82B, $512M global volume. The $8.453 rip-bar close is the next floor down.
My pick: Door 1. A line that rejected price twice this morning, then saw the 18:00 close land above $0.14899 — and the hour now forming is trading $0.013 above $0.15000. That beats a headline whose floor just broke on a closed candle. The honest other side: INIT's hour isn't closed — the 20:00 UTC close decides it, and this coin gave back a whole spike in sixty minutes this morning. One close back under $0.15000 and the extension is unwritten; one AVAX close above $8.653 and the support-gone chapter is unwritten too.
Not a call, either way. The 20:00 UTC close, 01:30 IST, settles both doors at once — which one are you watching?
Door 1 — $INIT $0.163, +34% in 24 hours. Fourth touch of the $0.15000 line today, and the first that's holding above it with room to spare. The morning spike tagged $0.15000, closed $0.14139, and gave the whole move back in one hour ($0.12899). The 16:00 hour wicked to $0.15382 and closed under the line. The 18:00 hour closed $0.14938 — a hair above the $0.14899 line. The hour now forming has tagged $0.16574. Rank #566, $35M market cap, $35.7M global volume — the whole coin turned over once today. No fresh headline: the standing story is still the October 24 mint-exploit halt and the November 2 restart. RSI 66 on the closed chart, price well above both EMAs.
Door 2 — $AVAX $8.56, +4.3%. The real headline of the day: NYSE plans to use Avalanche for tokenized-stock settlement, Q4 target, approval still pending — and the NYSE runs its own custom chain on Avalanche tech, not the public chain. The tape ripped 16% on it, $7.77 flush low to $9.01, then gave back a third: three straight closes under $8.814, and 18:00 closed $8.552 — the first close under the $8.653 floor. Rank #26, $3.82B, $512M global volume. The $8.453 rip-bar close is the next floor down.
My pick: Door 1. A line that rejected price twice this morning, then saw the 18:00 close land above $0.14899 — and the hour now forming is trading $0.013 above $0.15000. That beats a headline whose floor just broke on a closed candle. The honest other side: INIT's hour isn't closed — the 20:00 UTC close decides it, and this coin gave back a whole spike in sixty minutes this morning. One close back under $0.15000 and the extension is unwritten; one AVAX close above $8.653 and the support-gone chapter is unwritten too.
Not a call, either way. The 20:00 UTC close, 01:30 IST, settles both doors at once — which one are you watching?
9
·
--
$AVAX ripped 16% on the NYSE headline — and just lost the floor that was supposed to hold it.
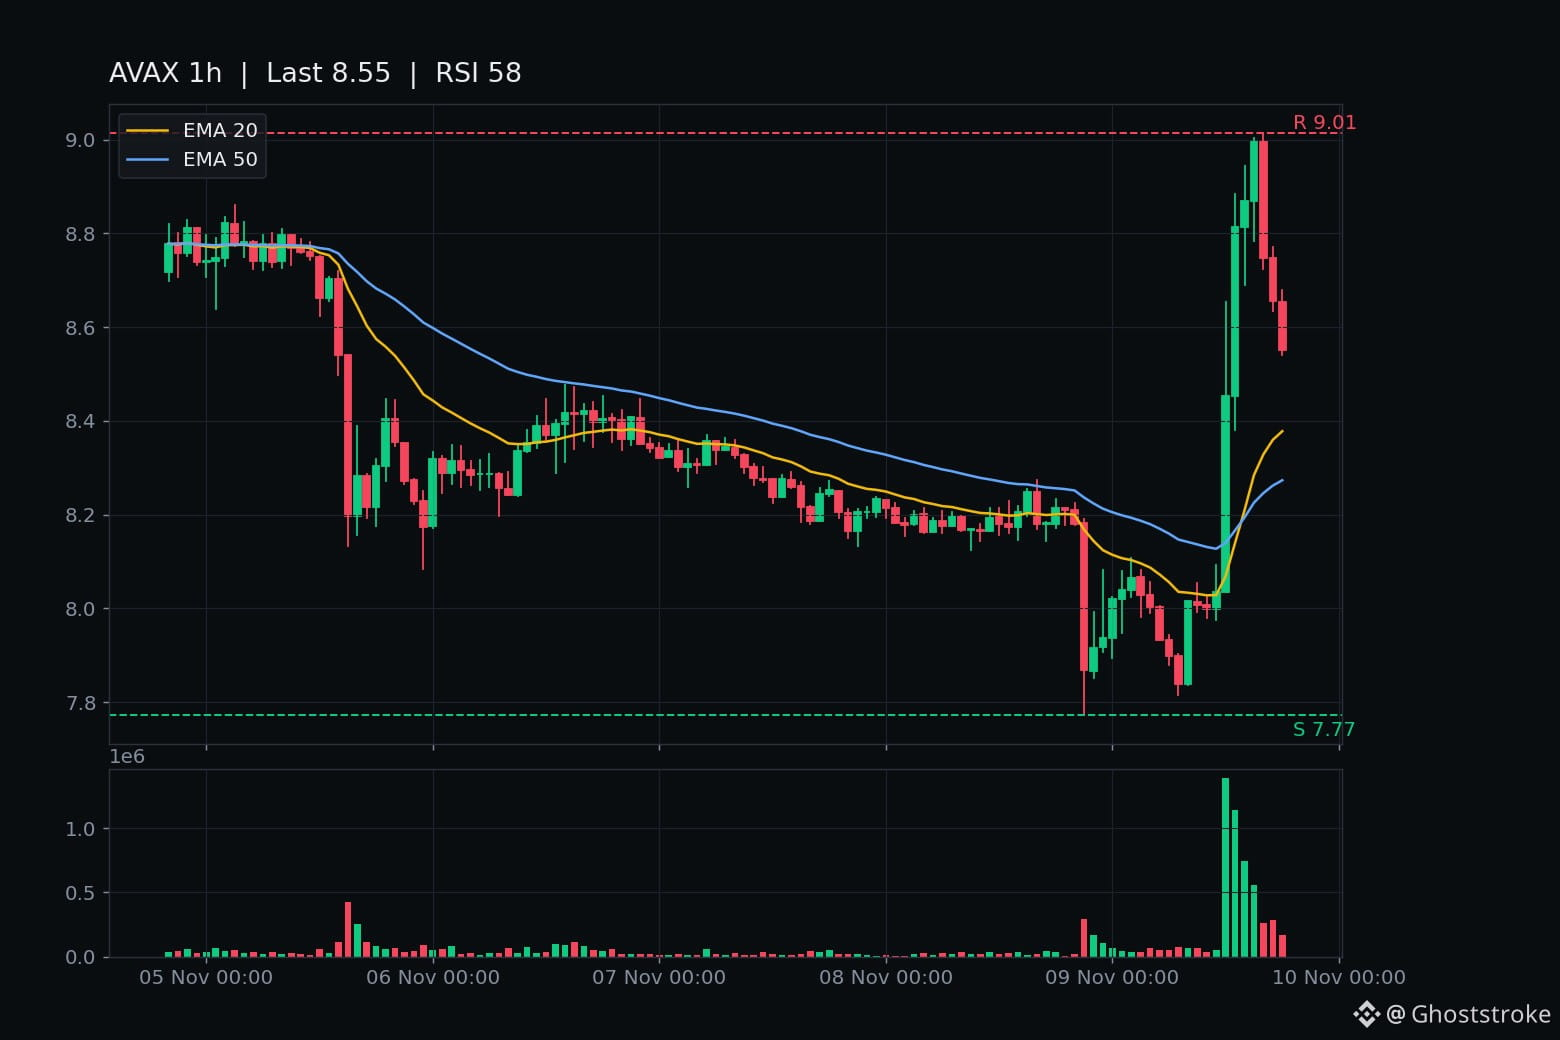
The 12:00 UTC hour closed $8.453 on $11.75M, the biggest AVAX bar of the day. The 13:00 hour closed $8.814 on $9.92M. By 15:00 it tagged $9.014 — 16% off the $7.773 flush low, on a real headline: the NYSE plans to use Avalanche as the core settlement ledger for its tokenized-stock platform.
Then the give-back. The 16:00 hour closed $8.748, first close under the $8.814 rip line. The 17:00 hour closed $8.655 — two-thousandths of a dollar above the $8.653 support. And the 18:00 hour closed $8.552 on $1.49M. First closed hour under the floor. More than a third of the whole rip is gone in three hours.
Live $8.55, up 4.3% on the day — it was +16% at the tag. $49.6M changing hands, 374,000 trades. The chart sits above both EMAs ($8.38 / $8.27), RSI 58 — the trend underneath is not broken yet, just the floor.
The headline is real, and the caveats are real too. WSJ and CoinDesk both reported it today, and Ava Labs confirmed it: Avalanche supplies the core ledger for the clearing firm behind the NYSE's planned tokenized-securities venue. But the venue still needs regulatory approval, targets a Q4 launch with no exact date, and the NYSE runs its own custom chain built on Avalanche tech — not the public chain — for settlement. A tech selection, not a deployment. Nothing in it guarantees AVAX demand.
Rank #26, $3.81B market cap. Up 2% on the week, down 18% on the month, 94% off the $144.96 all-time high. BTC $74,700, down 1.6% — a soft board, and the headline coin could not hold its floor on it.
Levels: $8.653 is the line — an hourly close back above it unwrites the chapter. Below, $8.453, then $8.034, then the $7.773 flush low. Not a call, either way.
The 20:00 UTC close (01:30 IST) decides: does $AVAX reclaim $8.653, or does the give-back run to $8.45?
$AVAX ripped 16% on the NYSE headline — and just lost the floor that was supposed to hold it.
The 12:00 UTC hour closed $8.453 on $11.75M, the biggest AVAX bar of the day. The 13:00 hour closed $8.814 on $9.92M. By 15:00 it tagged $9.014 — 16% off the $7.773 flush low, on a real headline: the NYSE plans to use Avalanche as the core settlement ledger for its tokenized-stock platform.
Then the give-back. The 16:00 hour closed $8.748, first close under the $8.814 rip line. The 17:00 hour closed $8.655 — two-thousandths of a dollar above the $8.653 support. And the 18:00 hour closed $8.552 on $1.49M. First closed hour under the floor. More than a third of the whole rip is gone in three hours.
Live $8.55, up 4.3% on the day — it was +16% at the tag. $49.6M changing hands, 374,000 trades. The chart sits above both EMAs ($8.38 / $8.27), RSI 58 — the trend underneath is not broken yet, just the floor.
The headline is real, and the caveats are real too. WSJ and CoinDesk both reported it today, and Ava Labs confirmed it: Avalanche supplies the core ledger for the clearing firm behind the NYSE's planned tokenized-securities venue. But the venue still needs regulatory approval, targets a Q4 launch with no exact date, and the NYSE runs its own custom chain built on Avalanche tech — not the public chain — for settlement. A tech selection, not a deployment. Nothing in it guarantees AVAX demand.
Rank #26, $3.81B market cap. Up 2% on the week, down 18% on the month, 94% off the $144.96 all-time high. BTC $74,700, down 1.6% — a soft board, and the headline coin could not hold its floor on it.
Levels: $8.653 is the line — an hourly close back above it unwrites the chapter. Below, $8.453, then $8.034, then the $7.773 flush low. Not a call, either way.
The 20:00 UTC close (01:30 IST) decides: does $AVAX reclaim $8.653, or does the give-back run to $8.45?
The 12:00 UTC hour closed $8.453 on $11.75M, the biggest AVAX bar of the day. The 13:00 hour closed $8.814 on $9.92M. By 15:00 it tagged $9.014 — 16% off the $7.773 flush low, on a real headline: the NYSE plans to use Avalanche as the core settlement ledger for its tokenized-stock platform.
Then the give-back. The 16:00 hour closed $8.748, first close under the $8.814 rip line. The 17:00 hour closed $8.655 — two-thousandths of a dollar above the $8.653 support. And the 18:00 hour closed $8.552 on $1.49M. First closed hour under the floor. More than a third of the whole rip is gone in three hours.
Live $8.55, up 4.3% on the day — it was +16% at the tag. $49.6M changing hands, 374,000 trades. The chart sits above both EMAs ($8.38 / $8.27), RSI 58 — the trend underneath is not broken yet, just the floor.
The headline is real, and the caveats are real too. WSJ and CoinDesk both reported it today, and Ava Labs confirmed it: Avalanche supplies the core ledger for the clearing firm behind the NYSE's planned tokenized-securities venue. But the venue still needs regulatory approval, targets a Q4 launch with no exact date, and the NYSE runs its own custom chain built on Avalanche tech — not the public chain — for settlement. A tech selection, not a deployment. Nothing in it guarantees AVAX demand.
Rank #26, $3.81B market cap. Up 2% on the week, down 18% on the month, 94% off the $144.96 all-time high. BTC $74,700, down 1.6% — a soft board, and the headline coin could not hold its floor on it.
Levels: $8.653 is the line — an hourly close back above it unwrites the chapter. Below, $8.453, then $8.034, then the $7.773 flush low. Not a call, either way.
The 20:00 UTC close (01:30 IST) decides: does $AVAX reclaim $8.653, or does the give-back run to $8.45?
4
·
--
$AVAX ripped 16% on the NYSE headline — then gave back nearly a third of it in two hours.
The headline is real, and it's dated today. The Wall Street Journal reported the NYSE plans to use Avalanche to settle tokenized-stock trades, and Avalanche's own statement today called its tech the platform's core settlement infrastructure. A Nov 5 SEC filing says the NYSE tested Avalanche for about a year.
The part the rip skipped: the platform still needs regulatory approval. No launch date, no live settlement, no guaranteed demand for the token. A tech selection, not a deployment.
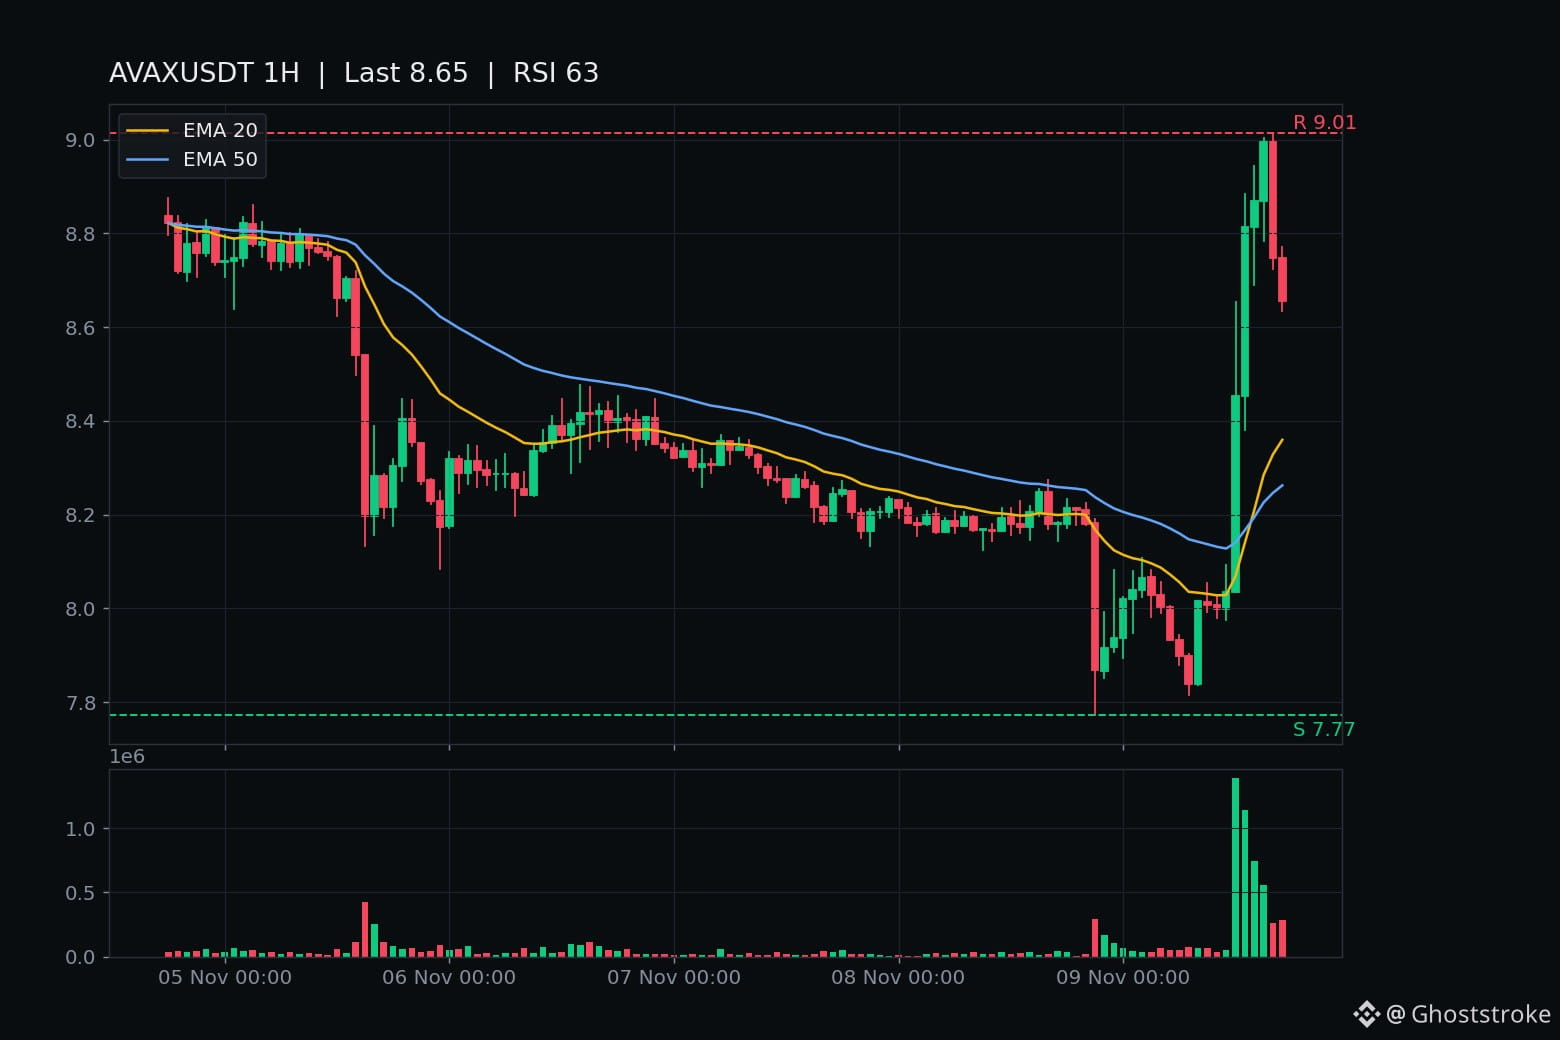
The tape: $7.77 flush low → 12:00 UTC close $8.45 on $11.75M, the day's biggest bar → 13:00 close $8.81 on $9.92M → 15:00 close $9.00, tagged $9.01 → 16:00 close $8.75, first close under the $8.81 rip line → 17:00 close $8.66, second close under. That's the first crack in the rip, on real volume.
The forming 18:00 hour is printing ~$8.57, under the $8.65 support intraday — unclosed. Its 19:00 UTC close (00:30 IST) decides: close back above $8.81 and the crack unwrites itself; close under $8.65 and the give-back has a second leg.
Live $8.57, still +4.3% on the day, $49M traded. Rank #26, $3.82B. Chart RSI 63, still above EMA20 $8.36 and EMA50 $8.26 — the trend stack hasn't broken, the headline leg has just cooled. Not a call, either way.
Does the NYSE headline hold $8.65 overnight, or does the rip finish giving itself back?
$AVAX ripped 16% on the NYSE headline — then gave back nearly a third of it in two hours.
The headline is real, and it's dated today. The Wall Street Journal reported the NYSE plans to use Avalanche to settle tokenized-stock trades, and Avalanche's own statement today called its tech the platform's core settlement infrastructure. A Nov 5 SEC filing says the NYSE tested Avalanche for about a year.
The part the rip skipped: the platform still needs regulatory approval. No launch date, no live settlement, no guaranteed demand for the token. A tech selection, not a deployment.
The tape: $7.77 flush low → 12:00 UTC close $8.45 on $11.75M, the day's biggest bar → 13:00 close $8.81 on $9.92M → 15:00 close $9.00, tagged $9.01 → 16:00 close $8.75, first close under the $8.81 rip line → 17:00 close $8.66, second close under. That's the first crack in the rip, on real volume.
The forming 18:00 hour is printing ~$8.57, under the $8.65 support intraday — unclosed. Its 19:00 UTC close (00:30 IST) decides: close back above $8.81 and the crack unwrites itself; close under $8.65 and the give-back has a second leg.
Live $8.57, still +4.3% on the day, $49M traded. Rank #26, $3.82B. Chart RSI 63, still above EMA20 $8.36 and EMA50 $8.26 — the trend stack hasn't broken, the headline leg has just cooled. Not a call, either way.
Does the NYSE headline hold $8.65 overnight, or does the rip finish giving itself back?
The headline is real, and it's dated today. The Wall Street Journal reported the NYSE plans to use Avalanche to settle tokenized-stock trades, and Avalanche's own statement today called its tech the platform's core settlement infrastructure. A Nov 5 SEC filing says the NYSE tested Avalanche for about a year.
The part the rip skipped: the platform still needs regulatory approval. No launch date, no live settlement, no guaranteed demand for the token. A tech selection, not a deployment.
The tape: $7.77 flush low → 12:00 UTC close $8.45 on $11.75M, the day's biggest bar → 13:00 close $8.81 on $9.92M → 15:00 close $9.00, tagged $9.01 → 16:00 close $8.75, first close under the $8.81 rip line → 17:00 close $8.66, second close under. That's the first crack in the rip, on real volume.
The forming 18:00 hour is printing ~$8.57, under the $8.65 support intraday — unclosed. Its 19:00 UTC close (00:30 IST) decides: close back above $8.81 and the crack unwrites itself; close under $8.65 and the give-back has a second leg.
Live $8.57, still +4.3% on the day, $49M traded. Rank #26, $3.82B. Chart RSI 63, still above EMA20 $8.36 and EMA50 $8.26 — the trend stack hasn't broken, the headline leg has just cooled. Not a call, either way.
Does the NYSE headline hold $8.65 overnight, or does the rip finish giving itself back?
2

·
--
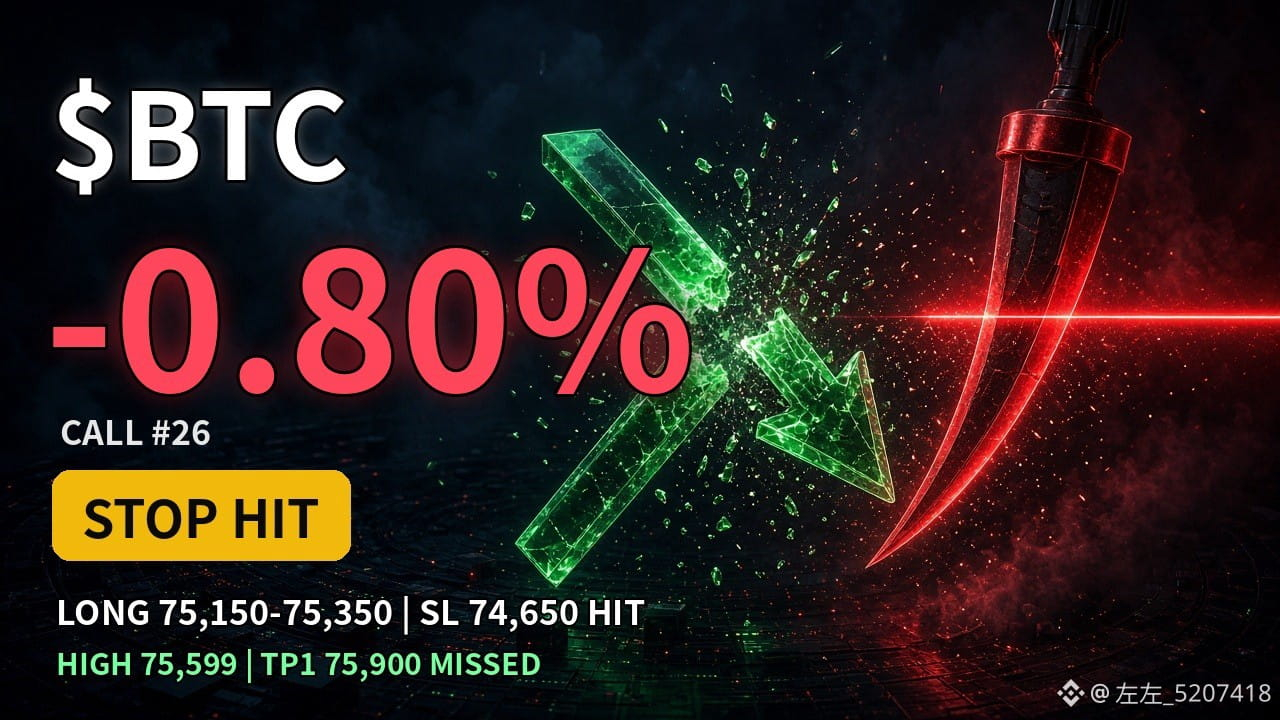
【Zuo Zuo Trade Idea · Review】BTC long #26 stopped out. The rebound after the wick couldn't hold? 🩸
10:30 trade idea: Go long on a pullback to 75,150–75,350, stop loss at 74,650, TP1 at 75,900.
Result: After the post went live, price peaked at 75,599 (10:33), still over 300 points short of TP1. The pullback entry was triggered after 10:45, then price continued lower, hitting the 74,650 stop loss at 13:02. That's -0.80% based on the midpoint of the entry range (without leverage). Record updated to 9W-15L.
Current price: 74,528, 24H -1.8% (Binance spot).
Watching two things next:
① Whether the overnight wick low of 73,510 holds. A break below would mean a second test of the lows.
② Only a move back above 74,888 would mean this stop-out was just a shakeout.
Taking a loss doesn't mean skipping the review. Did you hold this time, or did you stop out too? 👇
#BTC #比特币 #左左观点单 #加密市场
$BTC
{future}(BTCUSDT)
【Zuo Zuo Trade Idea · Review】BTC long #26 stopped out. The rebound after the wick couldn't hold? 🩸
10:30 trade idea: Go long on a pullback to 75,150–75,350, stop loss at 74,650, TP1 at 75,900.
Result: After the post went live, price peaked at 75,599 (10:33), still over 300 points short of TP1. The pullback entry was triggered after 10:45, then price continued lower, hitting the 74,650 stop loss at 13:02. That's -0.80% based on the midpoint of the entry range (without leverage). Record updated to 9W-15L.
Current price: 74,528, 24H -1.8% (Binance spot).
Watching two things next:
① Whether the overnight wick low of 73,510 holds. A break below would mean a second test of the lows.
② Only a move back above 74,888 would mean this stop-out was just a shakeout.
Taking a loss doesn't mean skipping the review. Did you hold this time, or did you stop out too? 👇
#BTC #比特币 #左左观点单 #加密市场
$BTC
10:30 trade idea: Go long on a pullback to 75,150–75,350, stop loss at 74,650, TP1 at 75,900.
Result: After the post went live, price peaked at 75,599 (10:33), still over 300 points short of TP1. The pullback entry was triggered after 10:45, then price continued lower, hitting the 74,650 stop loss at 13:02. That's -0.80% based on the midpoint of the entry range (without leverage). Record updated to 9W-15L.
Current price: 74,528, 24H -1.8% (Binance spot).
Watching two things next:
① Whether the overnight wick low of 73,510 holds. A break below would mean a second test of the lows.
② Only a move back above 74,888 would mean this stop-out was just a shakeout.
Taking a loss doesn't mean skipping the review. Did you hold this time, or did you stop out too? 👇
#BTC #比特币 #左左观点单 #加密市场
$BTC
1
435

·
--
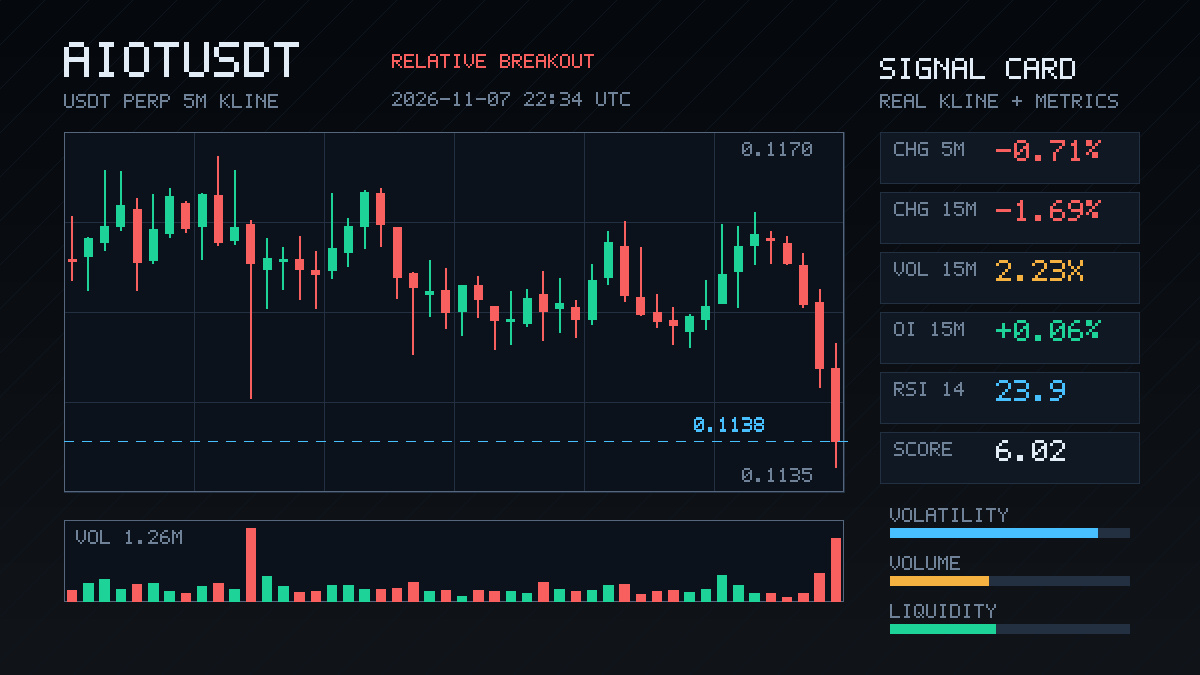
$AIOT Something feels off with this 15m move—the price is down 1.69%, but volume is 2.23 times the norm. Net taker flow is -27.9%, the buy/sell ratio is 0.56, and selling pressure is clear. The key is that OI is still edging up: +0.22% over 1h, with an anomaly percentile of 87.3%, ranking #26 across the entire pool. This looks more like new shorts adding leverage than old longs giving up and exiting. The price has already broken below the lows of the last 20 5m candles. 24h trading volume is 21M, and the order book isn't very deep, so chasing shorts here could get you burned by a rebound. I'll first see whether this wave of new shorts can hold; let's talk once the price stabilizes below the lows.
$AIOT Something feels off with this 15m move—the price is down 1.69%, but volume is 2.23 times the norm. Net taker flow is -27.9%, the buy/sell ratio is 0.56, and selling pressure is clear. The key is that OI is still edging up: +0.22% over 1h, with an anomaly percentile of 87.3%, ranking #26 across the entire pool. This looks more like new shorts adding leverage than old longs giving up and exiting. The price has already broken below the lows of the last 20 5m candles. 24h trading volume is 21M, and the order book isn't very deep, so chasing shorts here could get you burned by a rebound. I'll first see whether this wave of new shorts can hold; let's talk once the price stabilizes below the lows.

·
--
$PENGU This is getting interesting. The 15m price is down just 0.22%, while volume has expanded to 2.86x and OI is edging up—a falling price with rising open interest looks more like new shorts entering than longs closing. Aggressive trade delta is -66.5%, with a buy/sell ratio of 0.20, showing clearly one-sided selling pressure. The 5m Binance Futures liquidation proxy is 213K USDT, concentrated on the sell side. 24h trading volume is 20.83M, and depth confirms volume is above normal and has reached the edge of the recent price range. Ranked #30 across the full pool for anomalies and #26 for notional change, it’s not right at the top but is high enough to watch for continuation.
$PENGU This is getting interesting. The 15m price is down just 0.22%, while volume has expanded to 2.86x and OI is edging up—a falling price with rising open interest looks more like new shorts entering than longs closing. Aggressive trade delta is -66.5%, with a buy/sell ratio of 0.20, showing clearly one-sided selling pressure. The 5m Binance Futures liquidation proxy is 213K USDT, concentrated on the sell side. 24h trading volume is 20.83M, and depth confirms volume is above normal and has reached the edge of the recent price range. Ranked #30 across the full pool for anomalies and #26 for notional change, it’s not right at the top but is high enough to watch for continuation.
17
·
--
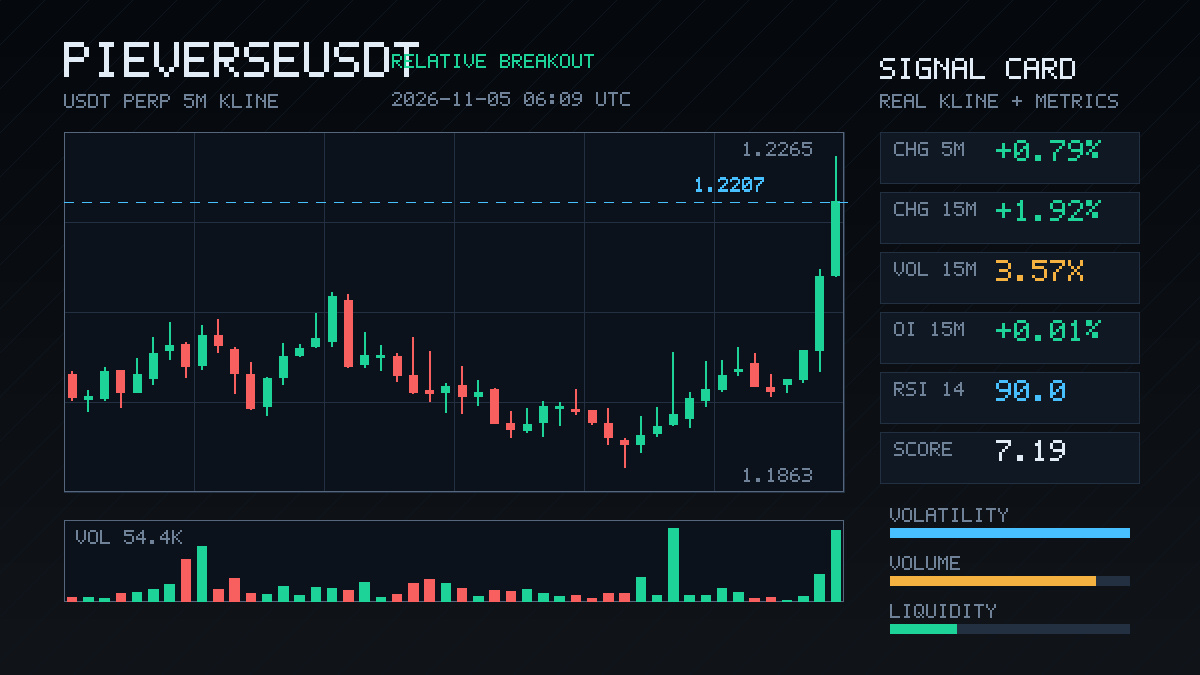
$PIEVERSE These 15 minutes were something else: volume shot up to 3.57× normal, Z-score hit 5.49, and price climbed 1.92%, closing above the upper end of the last 20 5m ranges.
OI was up 0.21% over 1h, with notional up +259K. Price rose as OI increased, which structurally looks more like new leveraged longs entering than hollow short covering. The anomaly percentile was 95.4%, ranking #4 across the whole pool; notional change ranked #26, and depth kept pace.
The taker volume imbalance was 7.3%, with a buy/sell ratio of 1.16—bullish, but not extreme. 24h trading volume was only 6.79M, so the pool isn't very deep. Be cautious chasing at this level, or a wick might teach you a lesson.
$PIEVERSE These 15 minutes were something else: volume shot up to 3.57× normal, Z-score hit 5.49, and price climbed 1.92%, closing above the upper end of the last 20 5m ranges.
OI was up 0.21% over 1h, with notional up +259K. Price rose as OI increased, which structurally looks more like new leveraged longs entering than hollow short covering. The anomaly percentile was 95.4%, ranking #4 across the whole pool; notional change ranked #26, and depth kept pace.
The taker volume imbalance was 7.3%, with a buy/sell ratio of 1.16—bullish, but not extreme. 24h trading volume was only 6.79M, so the pool isn't very deep. Be cautious chasing at this level, or a wick might teach you a lesson.
OI was up 0.21% over 1h, with notional up +259K. Price rose as OI increased, which structurally looks more like new leveraged longs entering than hollow short covering. The anomaly percentile was 95.4%, ranking #4 across the whole pool; notional change ranked #26, and depth kept pace.
The taker volume imbalance was 7.3%, with a buy/sell ratio of 1.16—bullish, but not extreme. 24h trading volume was only 6.79M, so the pool isn't very deep. Be cautious chasing at this level, or a wick might teach you a lesson.
2

·
--
$IDOL This 15m move was pretty clean: up 2.92%, breaking straight above the highs of the last 20 5m candles, with volume surging to 2.53x. The buy/sell ratio was 1.25 and the aggressive trade imbalance was 10.9%—buyers are genuinely absorbing the supply.
OI rose slightly by 0.12% over 15m, with a notional change of 278K and an anomaly percentile of 72%, ranking #26 across the entire pool. Price up + OI up: structurally, this looks more like new leveraged longs entering.
But 1h OI is still down 0.02%, suggesting this wasn’t driven by steady position-building all the way up. It looks more like some traders jumped in just as price broke above the range boundary.
24h trading volume is 118M, and depth is decent. Now it’s all about whether price can hold above this level; if it can’t, this could be a bull trap on a false breakout. $IDOL
$IDOL This 15m move was pretty clean: up 2.92%, breaking straight above the highs of the last 20 5m candles, with volume surging to 2.53x. The buy/sell ratio was 1.25 and the aggressive trade imbalance was 10.9%—buyers are genuinely absorbing the supply.
OI rose slightly by 0.12% over 15m, with a notional change of 278K and an anomaly percentile of 72%, ranking #26 across the entire pool. Price up + OI up: structurally, this looks more like new leveraged longs entering.
But 1h OI is still down 0.02%, suggesting this wasn’t driven by steady position-building all the way up. It looks more like some traders jumped in just as price broke above the range boundary.
24h trading volume is 118M, and depth is decent. Now it’s all about whether price can hold above this level; if it can’t, this could be a bull trap on a false breakout. $IDOL
OI rose slightly by 0.12% over 15m, with a notional change of 278K and an anomaly percentile of 72%, ranking #26 across the entire pool. Price up + OI up: structurally, this looks more like new leveraged longs entering.
But 1h OI is still down 0.02%, suggesting this wasn’t driven by steady position-building all the way up. It looks more like some traders jumped in just as price broke above the range boundary.
24h trading volume is 118M, and depth is decent. Now it’s all about whether price can hold above this level; if it can’t, this could be a bull trap on a false breakout. $IDOL
70

·
--
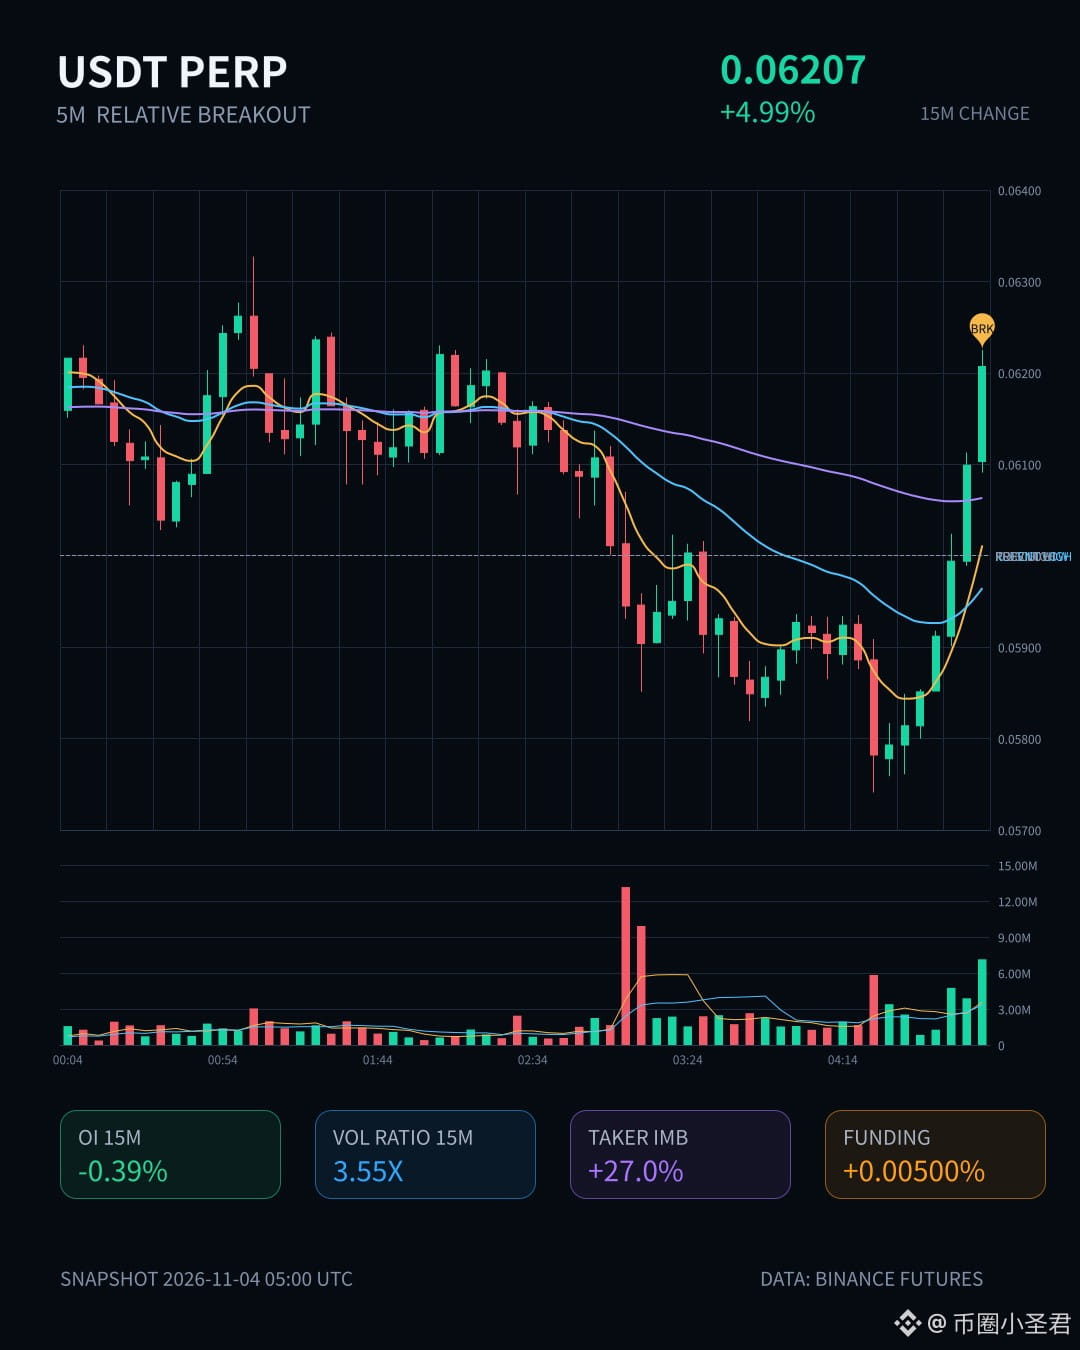
$牛 has rallied pretty sharply over the past 15m, surging +4.99% straight through the upper range of the last ~20 5m candles. Volume hit 3.55x its usual level, the buy/sell ratio was 1.74, and aggressive trade flow was 27% net positive—clearly, someone was in a hurry to sweep prices higher.
But OI is interesting here: while price rose, 1h OI actually fell 1.67%, and 15m OI also edged down. This doesn’t look like a move driven by new longs entering; it looks more like shorts were squeezed into covering and positions were forced to close. In other words, the “fuel” for this rally wasn’t fresh capital, but short sellers’ stop-loss orders.
The anomaly percentile is 97.8%, it ranks #35 for anomalies across the entire pool, and #26 for notional change. The funding rate has also climbed to a high percentile relative to recent levels. Taken together, these signals show that short-term sentiment is already running hot.
Be careful chasing this kind of setup: when a rally is driven by short covering, once the covering is over, it’s not clear who will take over. Either wait for OI to recover and confirm that longs are genuinely entering, or treat this as a burst of sentiment and don’t mistake a rebound for a reversal. For now, I’d rather wait and see if it cools off.
$牛 has rallied pretty sharply over the past 15m, surging +4.99% straight through the upper range of the last ~20 5m candles. Volume hit 3.55x its usual level, the buy/sell ratio was 1.74, and aggressive trade flow was 27% net positive—clearly, someone was in a hurry to sweep prices higher.
But OI is interesting here: while price rose, 1h OI actually fell 1.67%, and 15m OI also edged down. This doesn’t look like a move driven by new longs entering; it looks more like shorts were squeezed into covering and positions were forced to close. In other words, the “fuel” for this rally wasn’t fresh capital, but short sellers’ stop-loss orders.
The anomaly percentile is 97.8%, it ranks #35 for anomalies across the entire pool, and #26 for notional change. The funding rate has also climbed to a high percentile relative to recent levels. Taken together, these signals show that short-term sentiment is already running hot.
Be careful chasing this kind of setup: when a rally is driven by short covering, once the covering is over, it’s not clear who will take over. Either wait for OI to recover and confirm that longs are genuinely entering, or treat this as a burst of sentiment and don’t mistake a rebound for a reversal. For now, I’d rather wait and see if it cools off.
But OI is interesting here: while price rose, 1h OI actually fell 1.67%, and 15m OI also edged down. This doesn’t look like a move driven by new longs entering; it looks more like shorts were squeezed into covering and positions were forced to close. In other words, the “fuel” for this rally wasn’t fresh capital, but short sellers’ stop-loss orders.
The anomaly percentile is 97.8%, it ranks #35 for anomalies across the entire pool, and #26 for notional change. The funding rate has also climbed to a high percentile relative to recent levels. Taken together, these signals show that short-term sentiment is already running hot.
Be careful chasing this kind of setup: when a rally is driven by short covering, once the covering is over, it’s not clear who will take over. Either wait for OI to recover and confirm that longs are genuinely entering, or treat this as a burst of sentiment and don’t mistake a rebound for a reversal. For now, I’d rather wait and see if it cools off.
17
·
--
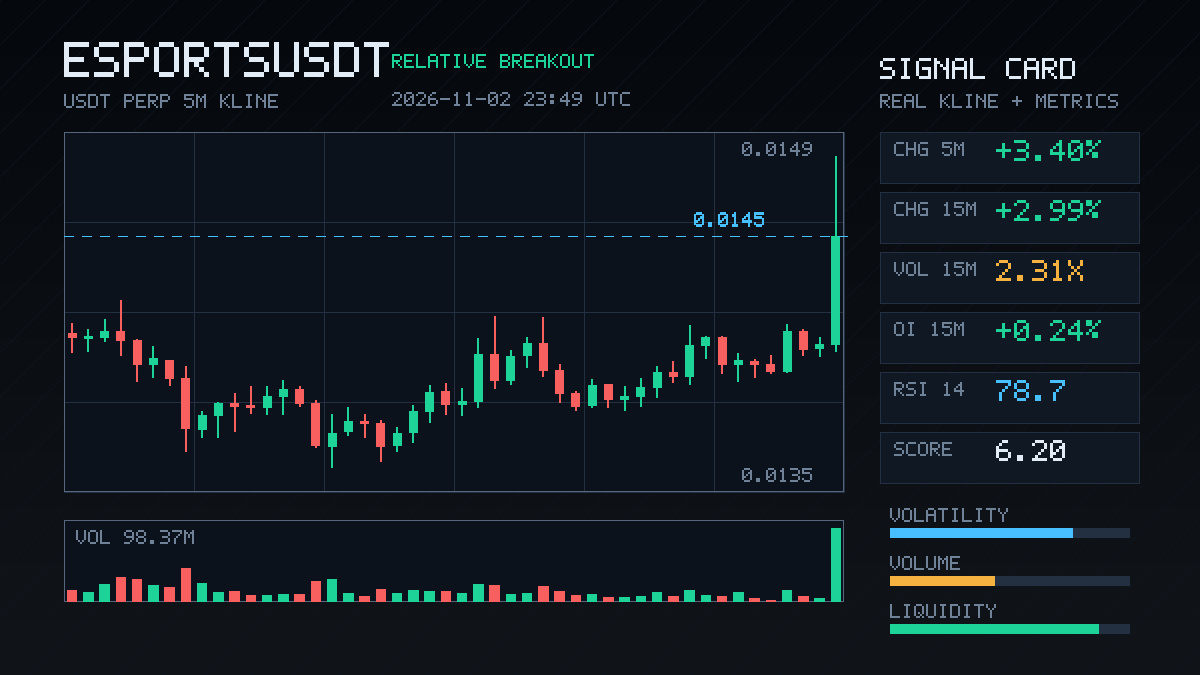
$ESPORTS This move was pretty decisive: +2.99% in 15m, with volume reaching 2.31x normal, and the close above the upper end of the last 20 5m candles. The key is that OI rose along with it: 1h contracts were up 0.47%, with notional increasing by 253K. This looks more like new longs entering with leverage than a quick short-covering move. Aggressive trade delta was 15%, and the buy/sell ratio was 1.35, so buyers are definitely chasing. 24h trading volume is over 400 million, with decent depth. The pool's notional change ranks #26—not a huge move, but the direction is pretty clear. Let's see whether this move can hold above the breakout level.
$ESPORTS This move was pretty decisive: +2.99% in 15m, with volume reaching 2.31x normal, and the close above the upper end of the last 20 5m candles. The key is that OI rose along with it: 1h contracts were up 0.47%, with notional increasing by 253K. This looks more like new longs entering with leverage than a quick short-covering move. Aggressive trade delta was 15%, and the buy/sell ratio was 1.35, so buyers are definitely chasing. 24h trading volume is over 400 million, with decent depth. The pool's notional change ranks #26—not a huge move, but the direction is pretty clear. Let's see whether this move can hold above the breakout level.
5
·
--
The bulls took a pretty decisive hit this time: price dumped 1.4% in 15m, volume surged to 2.22x, and the close broke below the lows of nearly 20 recent 5m candles. But looking at OI, it was down just 0.39% over 1h, with notional change of only a little over 400K U—this doesn’t look like shorts piling in heavily, but more like longs deleveraging and stop-losses getting triggered. Taker flow was -21.7%, and the buy/sell ratio was 0.64, so selling pressure clearly had the upper hand. Funding rates are still in a high percentile for the recent period, suggesting longs had been pretty crowded. The whole-pool anomaly #26 isn’t the most eye-catching, but declines accompanied by falling OI often don’t go very deep. First, let’s see if price can reclaim the bottom of the range.
The bulls took a pretty decisive hit this time: price dumped 1.4% in 15m, volume surged to 2.22x, and the close broke below the lows of nearly 20 recent 5m candles. But looking at OI, it was down just 0.39% over 1h, with notional change of only a little over 400K U—this doesn’t look like shorts piling in heavily, but more like longs deleveraging and stop-losses getting triggered. Taker flow was -21.7%, and the buy/sell ratio was 0.64, so selling pressure clearly had the upper hand. Funding rates are still in a high percentile for the recent period, suggesting longs had been pretty crowded. The whole-pool anomaly #26 isn’t the most eye-catching, but declines accompanied by falling OI often don’t go very deep. First, let’s see if price can reclaim the bottom of the range.
25

·
--
$ESPORTS rose 6.49% over 15m, but OI fell instead—down 1.83% over 15m and 1.78% over 1h. Price up, open interest down: a classic short-covering rally, not fresh longs entering. Volume was 1.93x above normal, and the taker buy/sell ratio was 1.15, indicating genuine buying pressure—but positions are being reduced, suggesting shorts are being forced to close. 24h trading volume was 774M, with sufficient liquidity. The anomaly percentile was 79.2%, ranking #26 across the pool and #7 in nominal change, so this move is among the more significant ones in the pool. In the short term, the short covering may not be over, but if OI keeps falling, the momentum behind any further rally is questionable. Be cautious about chasing the price; wait for a pullback and confirmation.
$ESPORTS rose 6.49% over 15m, but OI fell instead—down 1.83% over 15m and 1.78% over 1h. Price up, open interest down: a classic short-covering rally, not fresh longs entering. Volume was 1.93x above normal, and the taker buy/sell ratio was 1.15, indicating genuine buying pressure—but positions are being reduced, suggesting shorts are being forced to close. 24h trading volume was 774M, with sufficient liquidity. The anomaly percentile was 79.2%, ranking #26 across the pool and #7 in nominal change, so this move is among the more significant ones in the pool. In the short term, the short covering may not be over, but if OI keeps falling, the momentum behind any further rally is questionable. Be cautious about chasing the price; wait for a pullback and confirmation.
3
·
--
$PUMP 15m just closed above the upper boundary of the recent 20-bar 5m range, with volume at 1.57x, a Z-score of 2.04, and price up 0.71%. OI is also edging up on the 1h timeframe, ranking #26 across the entire pool for notional change. Structurally, price and OI are both rising, indicating new leveraged longs entering, but aggressive trade flow is flat at -0.0%, with a buy/sell ratio of 1.00, so buyers have yet to gain the upper hand in aggressive trading. Funding rates have recently been in a high percentile, suggesting overheated short-term sentiment. First, watch whether price can hold above this breakout level; if chasing, be mindful of crowded leverage.
$PUMP 15m just closed above the upper boundary of the recent 20-bar 5m range, with volume at 1.57x, a Z-score of 2.04, and price up 0.71%. OI is also edging up on the 1h timeframe, ranking #26 across the entire pool for notional change. Structurally, price and OI are both rising, indicating new leveraged longs entering, but aggressive trade flow is flat at -0.0%, with a buy/sell ratio of 1.00, so buyers have yet to gain the upper hand in aggressive trading. Funding rates have recently been in a high percentile, suggesting overheated short-term sentiment. First, watch whether price can hold above this breakout level; if chasing, be mindful of crowded leverage.
39
·
--
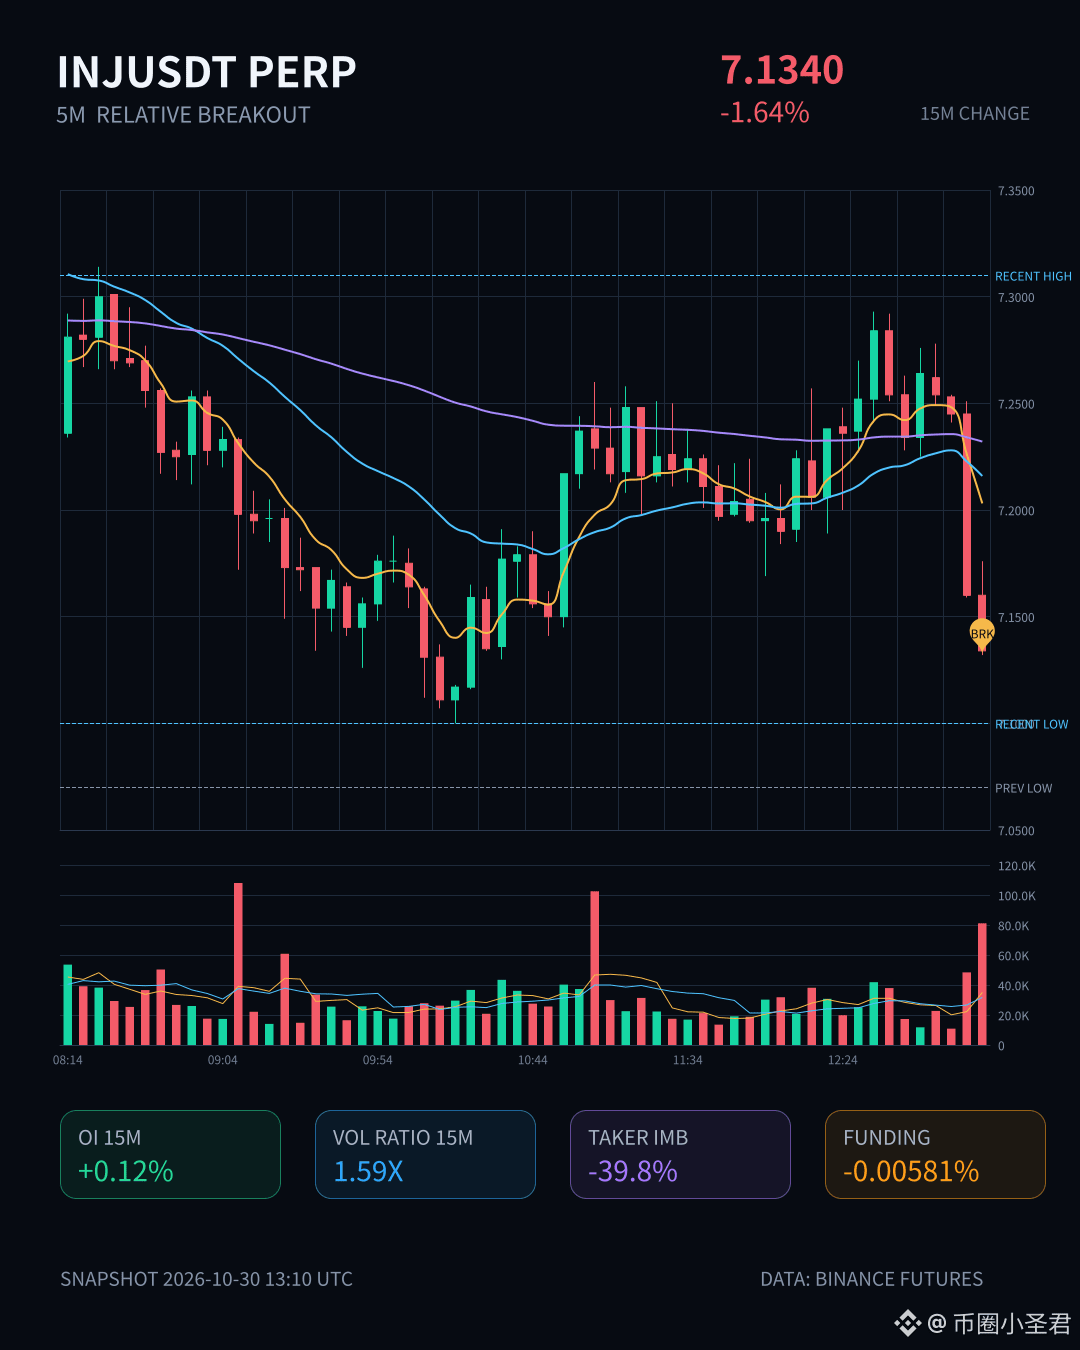
$INJ This move is interesting: the price fell 1.64%, but OI is rising instead, with 15m contracts up 0.12% and 1h up 0.26%. Notional change is negative, though, at -285K USDT. Price down + OI up is a classic sign of new leveraged shorts entering, not existing shorts adding to their positions.
Volume is 1.59x, volatility Z is 3.64, and activity has definitely picked up. The closing price fell below the lower bound of the recent 20-bar 5m K range. Aggressive trade imbalance is -39.8%, and the buy/sell ratio is 0.43, showing clearly one-sided selling pressure.
The anomaly percentile is 81.3%, ranking #23 across the entire pool; notional change ranks #26. That puts it near the top, but it is not extreme. 24h trading volume is 122.99M, and liquidity is decent.
Structurally, bears are actively pressing, but notional OI change is negative, which indicates that some existing positions are being closed. With new shorts entering and old positions being closed, this kind of turnover structure could lead to another leg down if the price cannot quickly reclaim the lower bound of the range. However, with the anomaly at the 81st percentile, the risk-reward of chasing shorts is less attractive.
$INJ This move is interesting: the price fell 1.64%, but OI is rising instead, with 15m contracts up 0.12% and 1h up 0.26%. Notional change is negative, though, at -285K USDT. Price down + OI up is a classic sign of new leveraged shorts entering, not existing shorts adding to their positions.
Volume is 1.59x, volatility Z is 3.64, and activity has definitely picked up. The closing price fell below the lower bound of the recent 20-bar 5m K range. Aggressive trade imbalance is -39.8%, and the buy/sell ratio is 0.43, showing clearly one-sided selling pressure.
The anomaly percentile is 81.3%, ranking #23 across the entire pool; notional change ranks #26. That puts it near the top, but it is not extreme. 24h trading volume is 122.99M, and liquidity is decent.
Structurally, bears are actively pressing, but notional OI change is negative, which indicates that some existing positions are being closed. With new shorts entering and old positions being closed, this kind of turnover structure could lead to another leg down if the price cannot quickly reclaim the lower bound of the range. However, with the anomaly at the 81st percentile, the risk-reward of chasing shorts is less attractive.
Volume is 1.59x, volatility Z is 3.64, and activity has definitely picked up. The closing price fell below the lower bound of the recent 20-bar 5m K range. Aggressive trade imbalance is -39.8%, and the buy/sell ratio is 0.43, showing clearly one-sided selling pressure.
The anomaly percentile is 81.3%, ranking #23 across the entire pool; notional change ranks #26. That puts it near the top, but it is not extreme. 24h trading volume is 122.99M, and liquidity is decent.
Structurally, bears are actively pressing, but notional OI change is negative, which indicates that some existing positions are being closed. With new shorts entering and old positions being closed, this kind of turnover structure could lead to another leg down if the price cannot quickly reclaim the lower bound of the range. However, with the anomaly at the 81st percentile, the risk-reward of chasing shorts is less attractive.
6
·
--
STRK had a rough 15 minutes: volume surged to 14.9 times normal, while the price fell just 1.6%. But OI tells the real story: down 3.26% in 15 minutes and 3.75% in an hour, with notional value dropping by more than $2 million. This is a classic case of longs getting flushed out, with stop-loss orders triggering in succession—not new shorts opening positions.
The taker flow imbalance was -31.6%, and the buy/sell ratio was 0.52, showing that selling pressure is in control. The OI anomaly percentile hit 100%, ranking #26 across the entire pool. It has continued over several consecutive periods, so this isn't noise—it's real deleveraging.
Price down + OI down means positions are contracting, rather than shorts building positions. 24-hour trading volume is $44M, so liquidity isn't particularly deep. An OI contraction of this scale is worth watching to see whether a rebound follows, but don't rush to buy the dip: leveraged positions often aren't flushed out in a single candle.
STRK had a rough 15 minutes: volume surged to 14.9 times normal, while the price fell just 1.6%. But OI tells the real story: down 3.26% in 15 minutes and 3.75% in an hour, with notional value dropping by more than $2 million. This is a classic case of longs getting flushed out, with stop-loss orders triggering in succession—not new shorts opening positions.
The taker flow imbalance was -31.6%, and the buy/sell ratio was 0.52, showing that selling pressure is in control. The OI anomaly percentile hit 100%, ranking #26 across the entire pool. It has continued over several consecutive periods, so this isn't noise—it's real deleveraging.
Price down + OI down means positions are contracting, rather than shorts building positions. 24-hour trading volume is $44M, so liquidity isn't particularly deep. An OI contraction of this scale is worth watching to see whether a rebound follows, but don't rush to buy the dip: leveraged positions often aren't flushed out in a single candle.
The taker flow imbalance was -31.6%, and the buy/sell ratio was 0.52, showing that selling pressure is in control. The OI anomaly percentile hit 100%, ranking #26 across the entire pool. It has continued over several consecutive periods, so this isn't noise—it's real deleveraging.
Price down + OI down means positions are contracting, rather than shorts building positions. 24-hour trading volume is $44M, so liquidity isn't particularly deep. An OI contraction of this scale is worth watching to see whether a rebound follows, but don't rush to buy the dip: leveraged positions often aren't flushed out in a single candle.
9
·
--
$INIT is up 3.95% in this 15m move—there's something to it. OI is up 0.97% over 1h and 0.23% over 15m, suggesting new leveraged longs are entering rather than shorts covering. The active trade delta is 8.8%, and the buy/sell ratio is 1.19, so buyers are driving the move. Price just broke above the range high of the last 20 5m candles, with volume at 1.5x and an anomaly percentile of 84.1%, ranking #26 across the whole pool. The funding rate is already at a recent high percentile, so chasing longs isn't cheap. Better wait for a pullback and confirmation.
$INIT is up 3.95% in this 15m move—there's something to it. OI is up 0.97% over 1h and 0.23% over 15m, suggesting new leveraged longs are entering rather than shorts covering. The active trade delta is 8.8%, and the buy/sell ratio is 1.19, so buyers are driving the move. Price just broke above the range high of the last 20 5m candles, with volume at 1.5x and an anomaly percentile of 84.1%, ranking #26 across the whole pool. The funding rate is already at a recent high percentile, so chasing longs isn't cheap. Better wait for a pullback and confirmation.

Article
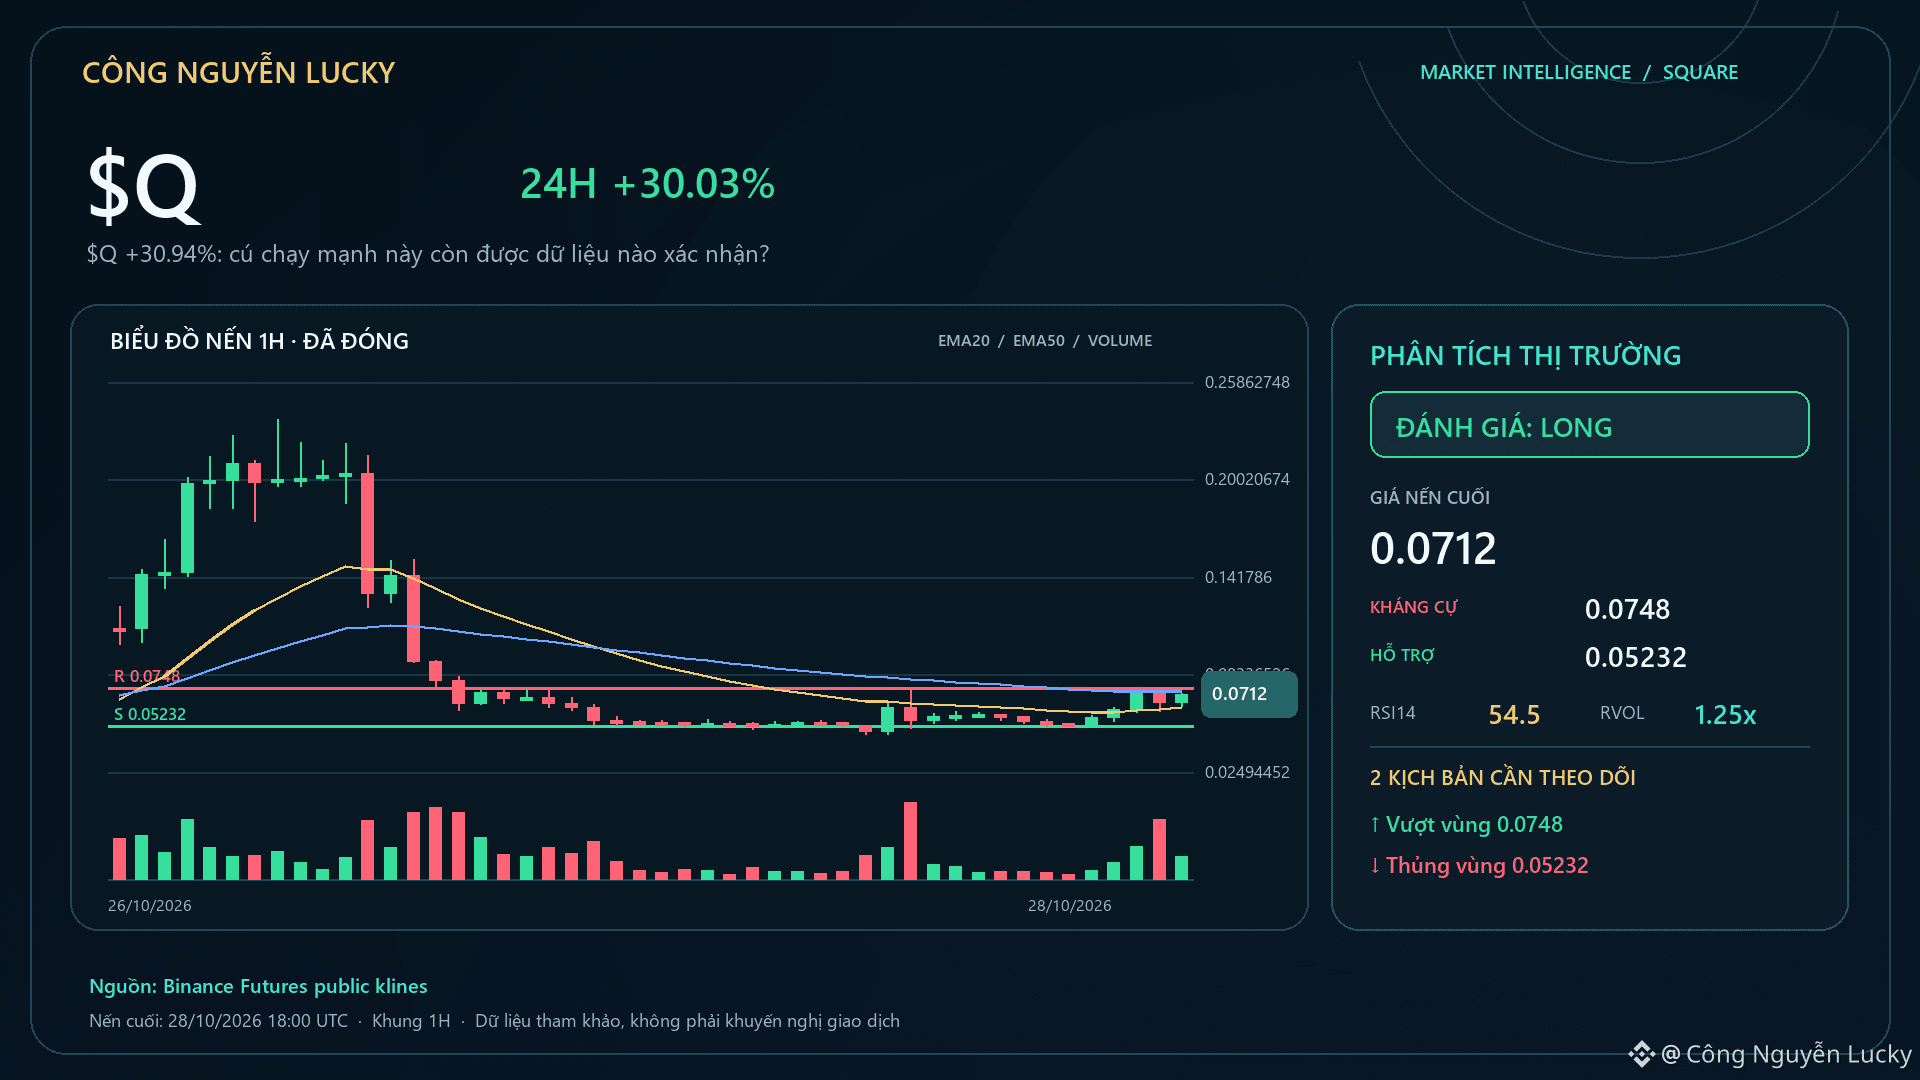
$Q +30.94%: What data still confirms this strong run?🧠 With $Q, getting the direction right still isn’t enough — position size and the invalidation point determine how long we can stay in the game. Even a good setup can turn into a bad trade if the position is too large. Capital management must come before profit expectations. Current market context: 0.07276 · 24h +30.94% · volume ~305.9M USDT · 5,852,958 trades. The takeaway: the goal is to survive across many probabilities, not to win with one all-in bet.
$Q +30.94%: What data still confirms this strong run?
🧠 With $Q , getting the direction right still isn’t enough — position size and the invalidation point determine how long we can stay in the game. Even a good setup can turn into a bad trade if the position is too large. Capital management must come before profit expectations. Current market context: 0.07276 · 24h +30.94% · volume ~305.9M USDT · 5,852,958 trades. The takeaway: the goal is to survive across many probabilities, not to win with one all-in bet.
681
Log in to explore more content
Join global crypto users on Binance Square
⚡️ Get latest and useful information about crypto.
💬 Trusted by the world’s largest crypto exchange.
👍 Discover real insights from verified creators.
Email / Phone number
Trending Topics
1
#A Packed Week of Earnings and Data Tests Markets
8,457 views
114 Discussing
2
#AnthropicIPOTestsInvestorAppetiteForAI
5,191 views
199 Discussing
3
#HuangReportedlyConsidersReturnToNvidia
25,012 views
405 Discussing
4
#CryptoSelloffTriggersMultipleWhaleLiquidations
299,222 views
2,445 Discussing
5
#BitcoinSpotETFsPost$1.065BOutflowsForThirdStraightWeek
2,221 views
60 Discussing
6
#About64000BitcoinMiningMachinesReportedlyHijacked
21,815 views
287 Discussing
7
#USSpotXRPETFsSeeLargestWeeklyOutflowIn8Months
234,330 views
1,900 Discussing
8
#WillFOMCMinutesReinforceRateHikeExpectations?
88,152 views
967 Discussing
9
#BitcoinActiveSupplyInProfitDropsBelow45%
307,416 views
2,112 Discussing
10
#KavaSaysAbnormalActivityLimitedToKavaLend
200,687 views
1,190 Discussing