
#29
29
30,509 views
239 Discussing
Hot
Latest

·
--
Behind the 29% surge, this trading volume is a bit interesting.
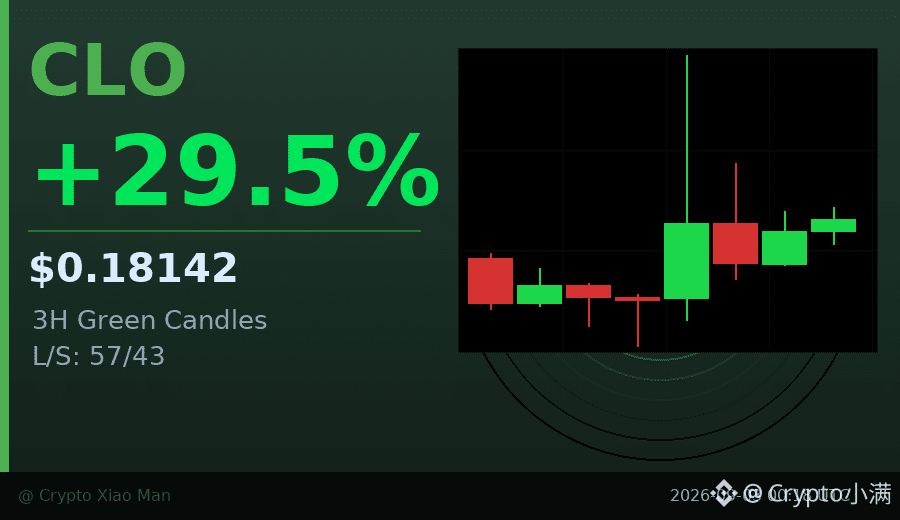
Today, CLO is up 29.48%, with the price reaching 0.18142. I noticed that the hourly chart has closed bullish for three consecutive candles, which suggests that the buying is not a one-time spike, but rather staged in waves.
Trading volume is 34.2 million USDT. Along with this price increase, it represents a healthy pattern of price and volume rising together. The funding rate is 0.072%, not particularly high. The long-to-short ratio is 57% vs 43%, meaning longs have the upper hand, but it’s not crowded yet.
The biggest risk with this kind of move is chasing at the high point. But if the pullback doesn’t break below the low of the previous bullish candle, there may still be opportunities.
$CLO #量价齐升 #29%
Click the small card below to quickly view the market trend👇
Behind the 29% surge, this trading volume is a bit interesting.
Today, CLO is up 29.48%, with the price reaching 0.18142. I noticed that the hourly chart has closed bullish for three consecutive candles, which suggests that the buying is not a one-time spike, but rather staged in waves.
Trading volume is 34.2 million USDT. Along with this price increase, it represents a healthy pattern of price and volume rising together. The funding rate is 0.072%, not particularly high. The long-to-short ratio is 57% vs 43%, meaning longs have the upper hand, but it’s not crowded yet.
The biggest risk with this kind of move is chasing at the high point. But if the pullback doesn’t break below the low of the previous bullish candle, there may still be opportunities.
$CLO #量价齐升 #29%
Click the small card below to quickly view the market trend👇
Today, CLO is up 29.48%, with the price reaching 0.18142. I noticed that the hourly chart has closed bullish for three consecutive candles, which suggests that the buying is not a one-time spike, but rather staged in waves.
Trading volume is 34.2 million USDT. Along with this price increase, it represents a healthy pattern of price and volume rising together. The funding rate is 0.072%, not particularly high. The long-to-short ratio is 57% vs 43%, meaning longs have the upper hand, but it’s not crowded yet.
The biggest risk with this kind of move is chasing at the high point. But if the pullback doesn’t break below the low of the previous bullish candle, there may still be opportunities.
$CLO #量价齐升 #29%
Click the small card below to quickly view the market trend👇
160

·
--
Would you have held $QNT for two years as it rose 164%?
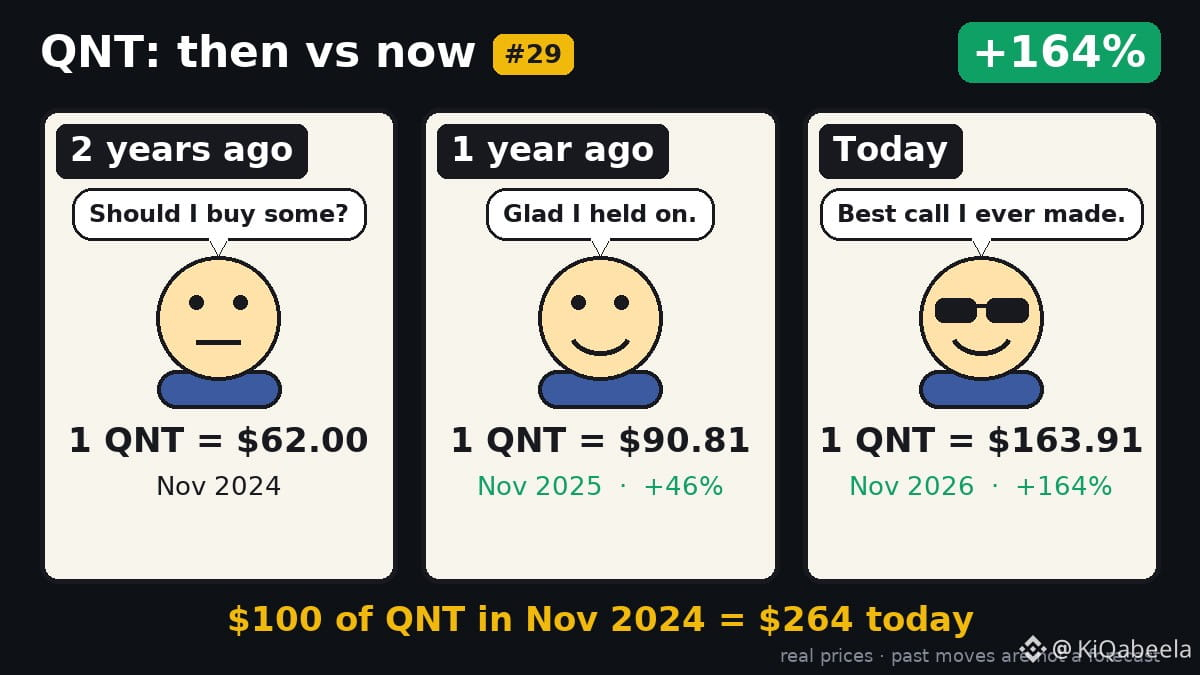
A $100 stake back on 2024‑11‑13 would be worth $264 today. The daily close jumped from $62 to $163.91, more than doubling each year.
That upside feels like a friendly reminder that patience can pay off, even if you missed the early surge. Past moves say nothing about the next ones.
💬 Holder?
🎨 Then vs Now #29 · a new one every morning
#QNT
Would you have held $QNT for two years as it rose 164%?
A $100 stake back on 2024‑11‑13 would be worth $264 today. The daily close jumped from $62 to $163.91, more than doubling each year.
That upside feels like a friendly reminder that patience can pay off, even if you missed the early surge. Past moves say nothing about the next ones.
💬 Holder?
🎨 Then vs Now #29 · a new one every morning
#QNT
A $100 stake back on 2024‑11‑13 would be worth $264 today. The daily close jumped from $62 to $163.91, more than doubling each year.
That upside feels like a friendly reminder that patience can pay off, even if you missed the early surge. Past moves say nothing about the next ones.
💬 Holder?
🎨 Then vs Now #29 · a new one every morning
#QNT
26

·
--
$1M to deploy today. Two doors. ENTRY 178.
Door 1 — $CYBER. $0.250, -4.6% on the day. The 19:00 close printed $0.252 — a tenth of a cent under the $0.253 line — on $441k, the heaviest CYBER hour of the day. The same hour wicked to $0.238, a fresh 24-hour low, ~3% from the $0.2300 all-time low. The forming hour sits $0.250, still under the line, unclosed: back above $0.253 and this is a wobble; a second close under confirms the deeper-air leg. Today is unlock day: ~511k CYBER to Ecosystem Development and Community Treasury per Tokenomist, plus ~1.76M insider tomorrow — though trackers disagree on the size, some showing up to 42.35M. CoinGecko: rank #935, $15.3M, -98.4% off the $15.79 all-time high. Chart: RSI 42, under EMA20 $0.255 and EMA50 $0.261.
Door 2 — $GRAM. $1.127, -6.5% on the day. Four closes deep now: $1.272 took the $1.257 ceiling at 15:00, then $1.253, $1.226, $1.156 on the day's heaviest bar, $1.143 at 19:00 on $3.8M. The forming hour prints $1.127 — under the $1.134 fresh low, live, unclosed. CoinGecko: rank #29, $3.23B. Chart: RSI 38, under EMA20 $1.21 and EMA50 $1.18 — the stack flipped overhead in one session. No fresh headline.
My pick is Door 2. A four-close give-back on the day's heaviest bars, pressing its line intraday, beats a break a tenth of a cent deep that needs a second close to mean anything. The other side is real: at RSI 38 flushes bounce hard, one close above $1.204 unwrites the give-back — and CYBER's unlock lands today, so if the second close confirms, its deeper-air leg runs while GRAM is still deciding.
Kicker: BARD, the coin that woke this hour — $0.1356, +62%. Its 19:00 close wicked to $0.1394, above the $0.1382 open-air line, then closed $0.1295 under it. Extension holds. Board: BTC $71,627, -3.7%.
Not a call, either way. The 21:00 UTC close, 02:30 IST, decides both doors: GRAM closing under $1.134, or CYBER closing back above $0.253 — which breaks first?
$1M to deploy today. Two doors. ENTRY 178.
Door 1 — $CYBER . $0.250, -4.6% on the day. The 19:00 close printed $0.252 — a tenth of a cent under the $0.253 line — on $441k, the heaviest CYBER hour of the day. The same hour wicked to $0.238, a fresh 24-hour low, ~3% from the $0.2300 all-time low. The forming hour sits $0.250, still under the line, unclosed: back above $0.253 and this is a wobble; a second close under confirms the deeper-air leg. Today is unlock day: ~511k CYBER to Ecosystem Development and Community Treasury per Tokenomist, plus ~1.76M insider tomorrow — though trackers disagree on the size, some showing up to 42.35M. CoinGecko: rank #935, $15.3M, -98.4% off the $15.79 all-time high. Chart: RSI 42, under EMA20 $0.255 and EMA50 $0.261.
Door 2 — $GRAM . $1.127, -6.5% on the day. Four closes deep now: $1.272 took the $1.257 ceiling at 15:00, then $1.253, $1.226, $1.156 on the day's heaviest bar, $1.143 at 19:00 on $3.8M. The forming hour prints $1.127 — under the $1.134 fresh low, live, unclosed. CoinGecko: rank #29, $3.23B. Chart: RSI 38, under EMA20 $1.21 and EMA50 $1.18 — the stack flipped overhead in one session. No fresh headline.
My pick is Door 2. A four-close give-back on the day's heaviest bars, pressing its line intraday, beats a break a tenth of a cent deep that needs a second close to mean anything. The other side is real: at RSI 38 flushes bounce hard, one close above $1.204 unwrites the give-back — and CYBER's unlock lands today, so if the second close confirms, its deeper-air leg runs while GRAM is still deciding.
Kicker: BARD, the coin that woke this hour — $0.1356, +62%. Its 19:00 close wicked to $0.1394, above the $0.1382 open-air line, then closed $0.1295 under it. Extension holds. Board: BTC $71,627, -3.7%.
Not a call, either way. The 21:00 UTC close, 02:30 IST, decides both doors: GRAM closing under $1.134, or CYBER closing back above $0.253 — which breaks first?
Door 1 — $CYBER . $0.250, -4.6% on the day. The 19:00 close printed $0.252 — a tenth of a cent under the $0.253 line — on $441k, the heaviest CYBER hour of the day. The same hour wicked to $0.238, a fresh 24-hour low, ~3% from the $0.2300 all-time low. The forming hour sits $0.250, still under the line, unclosed: back above $0.253 and this is a wobble; a second close under confirms the deeper-air leg. Today is unlock day: ~511k CYBER to Ecosystem Development and Community Treasury per Tokenomist, plus ~1.76M insider tomorrow — though trackers disagree on the size, some showing up to 42.35M. CoinGecko: rank #935, $15.3M, -98.4% off the $15.79 all-time high. Chart: RSI 42, under EMA20 $0.255 and EMA50 $0.261.
Door 2 — $GRAM . $1.127, -6.5% on the day. Four closes deep now: $1.272 took the $1.257 ceiling at 15:00, then $1.253, $1.226, $1.156 on the day's heaviest bar, $1.143 at 19:00 on $3.8M. The forming hour prints $1.127 — under the $1.134 fresh low, live, unclosed. CoinGecko: rank #29, $3.23B. Chart: RSI 38, under EMA20 $1.21 and EMA50 $1.18 — the stack flipped overhead in one session. No fresh headline.
My pick is Door 2. A four-close give-back on the day's heaviest bars, pressing its line intraday, beats a break a tenth of a cent deep that needs a second close to mean anything. The other side is real: at RSI 38 flushes bounce hard, one close above $1.204 unwrites the give-back — and CYBER's unlock lands today, so if the second close confirms, its deeper-air leg runs while GRAM is still deciding.
Kicker: BARD, the coin that woke this hour — $0.1356, +62%. Its 19:00 close wicked to $0.1394, above the $0.1382 open-air line, then closed $0.1295 under it. Extension holds. Board: BTC $71,627, -3.7%.
Not a call, either way. The 21:00 UTC close, 02:30 IST, decides both doors: GRAM closing under $1.134, or CYBER closing back above $0.253 — which breaks first?
663

SUI spot check
$SUI is trading around $0.82, down ~1.4% on the day. Day range: $0.81 - $0.85.
The L1 is still under pressure: -12% this week, -21% this month, and -44% year to date. Market cap ~$3.4B, rank #29, with a solid ~$262M in 24h spot volume — buyers haven't walked away, they're just waiting for a cheaper entry.
Key levels:
Support: $0.81, then $0.80
Resistance: $0.85, then $0.87
A hold above $0.81 keeps the door open for a bounce toward $0.85. Lose $0.80 and the next stop is lower. $BTC is holding ~$73.7K, so SUI's move will likely follow Bitcoin's lead.
Verdict: weak short-term, but $0.81 is the line to watch.
Not financial advice. DYOR.
#Sui #Crypto #Altcoins
SUI spot check
$SUI is trading around $0.82, down ~1.4% on the day. Day range: $0.81 - $0.85.
The L1 is still under pressure: -12% this week, -21% this month, and -44% year to date. Market cap ~$3.4B, rank #29, with a solid ~$262M in 24h spot volume — buyers haven't walked away, they're just waiting for a cheaper entry.
Key levels:
Support: $0.81, then $0.80
Resistance: $0.85, then $0.87
A hold above $0.81 keeps the door open for a bounce toward $0.85. Lose $0.80 and the next stop is lower. $BTC is holding ~$73.7K, so SUI's move will likely follow Bitcoin's lead.
Verdict: weak short-term, but $0.81 is the line to watch.
Not financial advice. DYOR.
#Sui #Crypto #Altcoins
$SUI is trading around $0.82, down ~1.4% on the day. Day range: $0.81 - $0.85.
The L1 is still under pressure: -12% this week, -21% this month, and -44% year to date. Market cap ~$3.4B, rank #29, with a solid ~$262M in 24h spot volume — buyers haven't walked away, they're just waiting for a cheaper entry.
Key levels:
Support: $0.81, then $0.80
Resistance: $0.85, then $0.87
A hold above $0.81 keeps the door open for a bounce toward $0.85. Lose $0.80 and the next stop is lower. $BTC is holding ~$73.7K, so SUI's move will likely follow Bitcoin's lead.
Verdict: weak short-term, but $0.81 is the line to watch.
Not financial advice. DYOR.
#Sui #Crypto #Altcoins
56
·
--
$1M to deploy today. Two doors. ENTRY 161.
The bell post 800 named just rang — and both give-backs answered the same way: still under their lines.
Door 1 — $GRAM: $1.187, +5.7% 24h, $26.9M Binance vol. Durov's 1M-wallets number ran it to $1.257. Then 20:00 C $1.183, 21:00 $1.185, 22:00 $1.179, 23:00 $1.174 — and the 00:00 UTC close printed $1.181. Five straight closes under $1.204. The give-back isn't pausing, it's confirming. Chart: RSI 52, under EMA20 $1.182, above EMA50 $1.146, R $1.257 / S $1.089. Rank #29, $3.38B, 7d +0.2%, -85.6% off the $8.25 ATH. Forming hour $1.185, still under the line, unclosed.
Door 2 — $OPG: $0.1329, +3.8% 24h, $10.3M Binance vol. Ripped +19% to $0.153 on no news, spiked $0.1641 — now -19% off that spike. The reclaim never came: 21:00 C $0.1354, 22:00 $0.1342, 23:00 $0.1350, 00:00 $0.1350. Four straight closes under EMA20 $0.1357. Chart: RSI 48, under EMA20 $0.1375, above EMA50 $0.1332, R $0.1641 / S $0.1258. OpenGradient, rank #596, $31.8M, 7d +12.8%, -72.4% off the $0.4816 ATH. Forming hour $0.1325, printing lower, unclosed.
My pick is Door 1. Five confirming closes on a $27M book beats four closes under a moving average on a $10M book.
The other side, honestly: GRAM actually closed UP on the hour ($1.174 to $1.181) and sits only -5.6% off its high with a real catalyst behind it. OPG is probing toward $0.1285 and one close back above $0.1357 flips the read entirely.
No fresh headline on either — tape, not news. BTC $73,671, +0.2%, flat board.
Not a call, either way. Next bell 02:00 UTC (07:30 IST): GRAM's sixth close under $1.204, or OPG closing below $0.1285 — which prints first?
$1M to deploy today. Two doors. ENTRY 161.
The bell post 800 named just rang — and both give-backs answered the same way: still under their lines.
Door 1 — $GRAM : $1.187, +5.7% 24h, $26.9M Binance vol. Durov's 1M-wallets number ran it to $1.257. Then 20:00 C $1.183, 21:00 $1.185, 22:00 $1.179, 23:00 $1.174 — and the 00:00 UTC close printed $1.181. Five straight closes under $1.204. The give-back isn't pausing, it's confirming. Chart: RSI 52, under EMA20 $1.182, above EMA50 $1.146, R $1.257 / S $1.089. Rank #29, $3.38B, 7d +0.2%, -85.6% off the $8.25 ATH. Forming hour $1.185, still under the line, unclosed.
Door 2 — $OPG : $0.1329, +3.8% 24h, $10.3M Binance vol. Ripped +19% to $0.153 on no news, spiked $0.1641 — now -19% off that spike. The reclaim never came: 21:00 C $0.1354, 22:00 $0.1342, 23:00 $0.1350, 00:00 $0.1350. Four straight closes under EMA20 $0.1357. Chart: RSI 48, under EMA20 $0.1375, above EMA50 $0.1332, R $0.1641 / S $0.1258. OpenGradient, rank #596, $31.8M, 7d +12.8%, -72.4% off the $0.4816 ATH. Forming hour $0.1325, printing lower, unclosed.
My pick is Door 1. Five confirming closes on a $27M book beats four closes under a moving average on a $10M book.
The other side, honestly: GRAM actually closed UP on the hour ($1.174 to $1.181) and sits only -5.6% off its high with a real catalyst behind it. OPG is probing toward $0.1285 and one close back above $0.1357 flips the read entirely.
No fresh headline on either — tape, not news. BTC $73,671, +0.2%, flat board.
Not a call, either way. Next bell 02:00 UTC (07:30 IST): GRAM's sixth close under $1.204, or OPG closing below $0.1285 — which prints first?
The bell post 800 named just rang — and both give-backs answered the same way: still under their lines.
Door 1 — $GRAM : $1.187, +5.7% 24h, $26.9M Binance vol. Durov's 1M-wallets number ran it to $1.257. Then 20:00 C $1.183, 21:00 $1.185, 22:00 $1.179, 23:00 $1.174 — and the 00:00 UTC close printed $1.181. Five straight closes under $1.204. The give-back isn't pausing, it's confirming. Chart: RSI 52, under EMA20 $1.182, above EMA50 $1.146, R $1.257 / S $1.089. Rank #29, $3.38B, 7d +0.2%, -85.6% off the $8.25 ATH. Forming hour $1.185, still under the line, unclosed.
Door 2 — $OPG : $0.1329, +3.8% 24h, $10.3M Binance vol. Ripped +19% to $0.153 on no news, spiked $0.1641 — now -19% off that spike. The reclaim never came: 21:00 C $0.1354, 22:00 $0.1342, 23:00 $0.1350, 00:00 $0.1350. Four straight closes under EMA20 $0.1357. Chart: RSI 48, under EMA20 $0.1375, above EMA50 $0.1332, R $0.1641 / S $0.1258. OpenGradient, rank #596, $31.8M, 7d +12.8%, -72.4% off the $0.4816 ATH. Forming hour $0.1325, printing lower, unclosed.
My pick is Door 1. Five confirming closes on a $27M book beats four closes under a moving average on a $10M book.
The other side, honestly: GRAM actually closed UP on the hour ($1.174 to $1.181) and sits only -5.6% off its high with a real catalyst behind it. OPG is probing toward $0.1285 and one close back above $0.1357 flips the read entirely.
No fresh headline on either — tape, not news. BTC $73,671, +0.2%, flat board.
Not a call, either way. Next bell 02:00 UTC (07:30 IST): GRAM's sixth close under $1.204, or OPG closing below $0.1285 — which prints first?
190
·
--
$1M to deploy today. Two doors. ENTRY 158.
Both doors are give-backs. One is a $3.3B book handing back a founder's number. The other is a $33M microcap handing back a no-news rip.
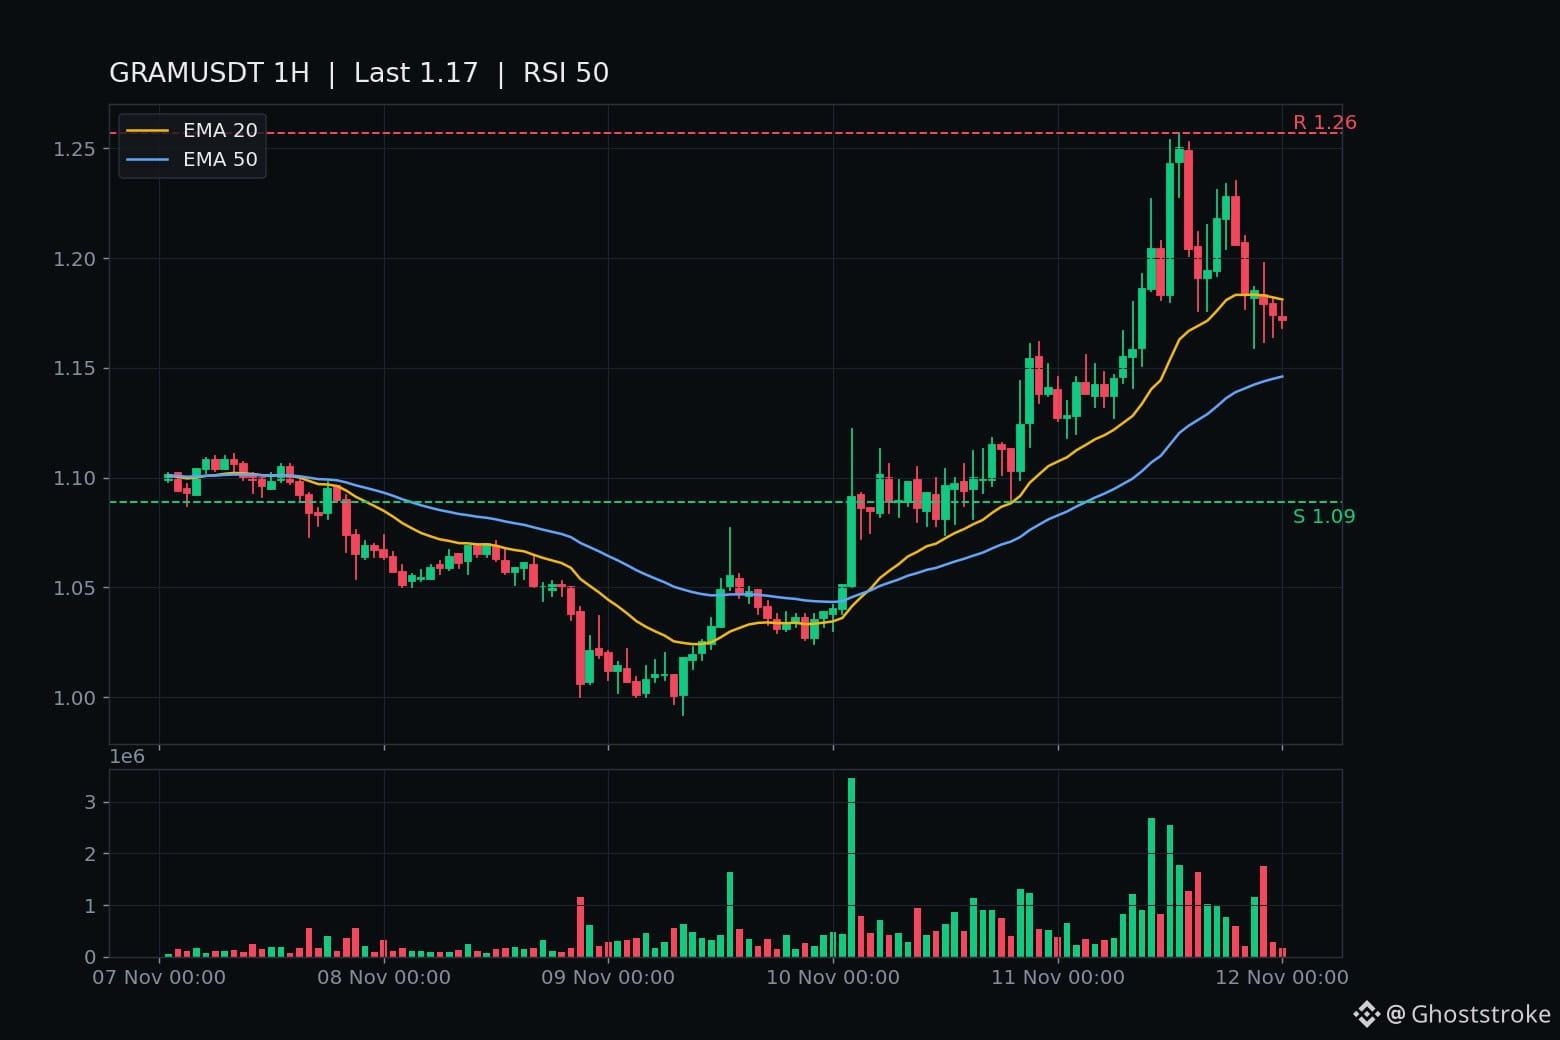
Door 1 — $GRAM: $1.175, +3.9% today. Yesterday Durov posted 1M Gram wallets in 48 hours and the price ran to $1.257. Tonight it gave the line back: 19:00 closed $1.206, holding $1.204 by two-tenths of a cent — then four straight closes under it ($1.183, $1.185, $1.179, $1.174). The rally's fuel was real distribution, but the tape is selling the number anyway. Rank #29, $3.35B, -14% in 30 days, still -86% off its $8.25 high. Chart: RSI 50, under EMA20 $1.18, above EMA50 $1.15.
Door 2 — $OPG: $0.1378, +6.2% today. Ripped 19% to $0.153 on no news, spiked $0.1641, then rolled over every hour since: three straight closes under its EMA20 $0.1357 ($0.1354, $0.1342, $0.1350). The forming hour is already back above the line — unclosed, so it counts for nothing yet. OpenGradient, rank #586, $32.8M, -71% off its $0.48 high. No fresh headline on either door tonight — tape, not news.
My pick is Door 1. Four confirming closes under a named line, on $27M of volume, beats three closes under a moving average on a book a hundred times smaller — especially when the smaller book's forming hour is already wobbling back above its line. The other side: GRAM is only 6.6% off its high and the wallet number is real; OPG closing back above $0.1357 flips the whole read.
Kicker: post-799's verdict lands on the same bell — ZEC under $951 into deeper air, or INIT under $0.13222 into a new low. The 01:00 UTC close decides all three.
Not a call, either way. Which prints first at 01:00 UTC — GRAM's fifth close under $1.204, or OPG closing back above $0.1357?
$1M to deploy today. Two doors. ENTRY 158.
Both doors are give-backs. One is a $3.3B book handing back a founder's number. The other is a $33M microcap handing back a no-news rip.
Door 1 — $GRAM : $1.175, +3.9% today. Yesterday Durov posted 1M Gram wallets in 48 hours and the price ran to $1.257. Tonight it gave the line back: 19:00 closed $1.206, holding $1.204 by two-tenths of a cent — then four straight closes under it ($1.183, $1.185, $1.179, $1.174). The rally's fuel was real distribution, but the tape is selling the number anyway. Rank #29, $3.35B, -14% in 30 days, still -86% off its $8.25 high. Chart: RSI 50, under EMA20 $1.18, above EMA50 $1.15.
Door 2 — $OPG : $0.1378, +6.2% today. Ripped 19% to $0.153 on no news, spiked $0.1641, then rolled over every hour since: three straight closes under its EMA20 $0.1357 ($0.1354, $0.1342, $0.1350). The forming hour is already back above the line — unclosed, so it counts for nothing yet. OpenGradient, rank #586, $32.8M, -71% off its $0.48 high. No fresh headline on either door tonight — tape, not news.
My pick is Door 1. Four confirming closes under a named line, on $27M of volume, beats three closes under a moving average on a book a hundred times smaller — especially when the smaller book's forming hour is already wobbling back above its line. The other side: GRAM is only 6.6% off its high and the wallet number is real; OPG closing back above $0.1357 flips the whole read.
Kicker: post-799's verdict lands on the same bell — ZEC under $951 into deeper air, or INIT under $0.13222 into a new low. The 01:00 UTC close decides all three.
Not a call, either way. Which prints first at 01:00 UTC — GRAM's fifth close under $1.204, or OPG closing back above $0.1357?
Both doors are give-backs. One is a $3.3B book handing back a founder's number. The other is a $33M microcap handing back a no-news rip.
Door 1 — $GRAM : $1.175, +3.9% today. Yesterday Durov posted 1M Gram wallets in 48 hours and the price ran to $1.257. Tonight it gave the line back: 19:00 closed $1.206, holding $1.204 by two-tenths of a cent — then four straight closes under it ($1.183, $1.185, $1.179, $1.174). The rally's fuel was real distribution, but the tape is selling the number anyway. Rank #29, $3.35B, -14% in 30 days, still -86% off its $8.25 high. Chart: RSI 50, under EMA20 $1.18, above EMA50 $1.15.
Door 2 — $OPG : $0.1378, +6.2% today. Ripped 19% to $0.153 on no news, spiked $0.1641, then rolled over every hour since: three straight closes under its EMA20 $0.1357 ($0.1354, $0.1342, $0.1350). The forming hour is already back above the line — unclosed, so it counts for nothing yet. OpenGradient, rank #586, $32.8M, -71% off its $0.48 high. No fresh headline on either door tonight — tape, not news.
My pick is Door 1. Four confirming closes under a named line, on $27M of volume, beats three closes under a moving average on a book a hundred times smaller — especially when the smaller book's forming hour is already wobbling back above its line. The other side: GRAM is only 6.6% off its high and the wallet number is real; OPG closing back above $0.1357 flips the whole read.
Kicker: post-799's verdict lands on the same bell — ZEC under $951 into deeper air, or INIT under $0.13222 into a new low. The 01:00 UTC close decides all three.
Not a call, either way. Which prints first at 01:00 UTC — GRAM's fifth close under $1.204, or OPG closing back above $0.1357?
352
·
--
Pavel Durov just called $GRAM "ridiculously undervalued" — and said it belongs in the top 3.
His post on X today: "Crypto's a sea of red. Only GRAM is up +8%." The snapshot showed LTC, AVAX, SUI and HBAR all down 1.7% to 3.6% while GRAM sat at $1.12, +8.65%, on a $3.21B market cap. His line: "No surprise there. It's the only coin built into a real social ecosystem."
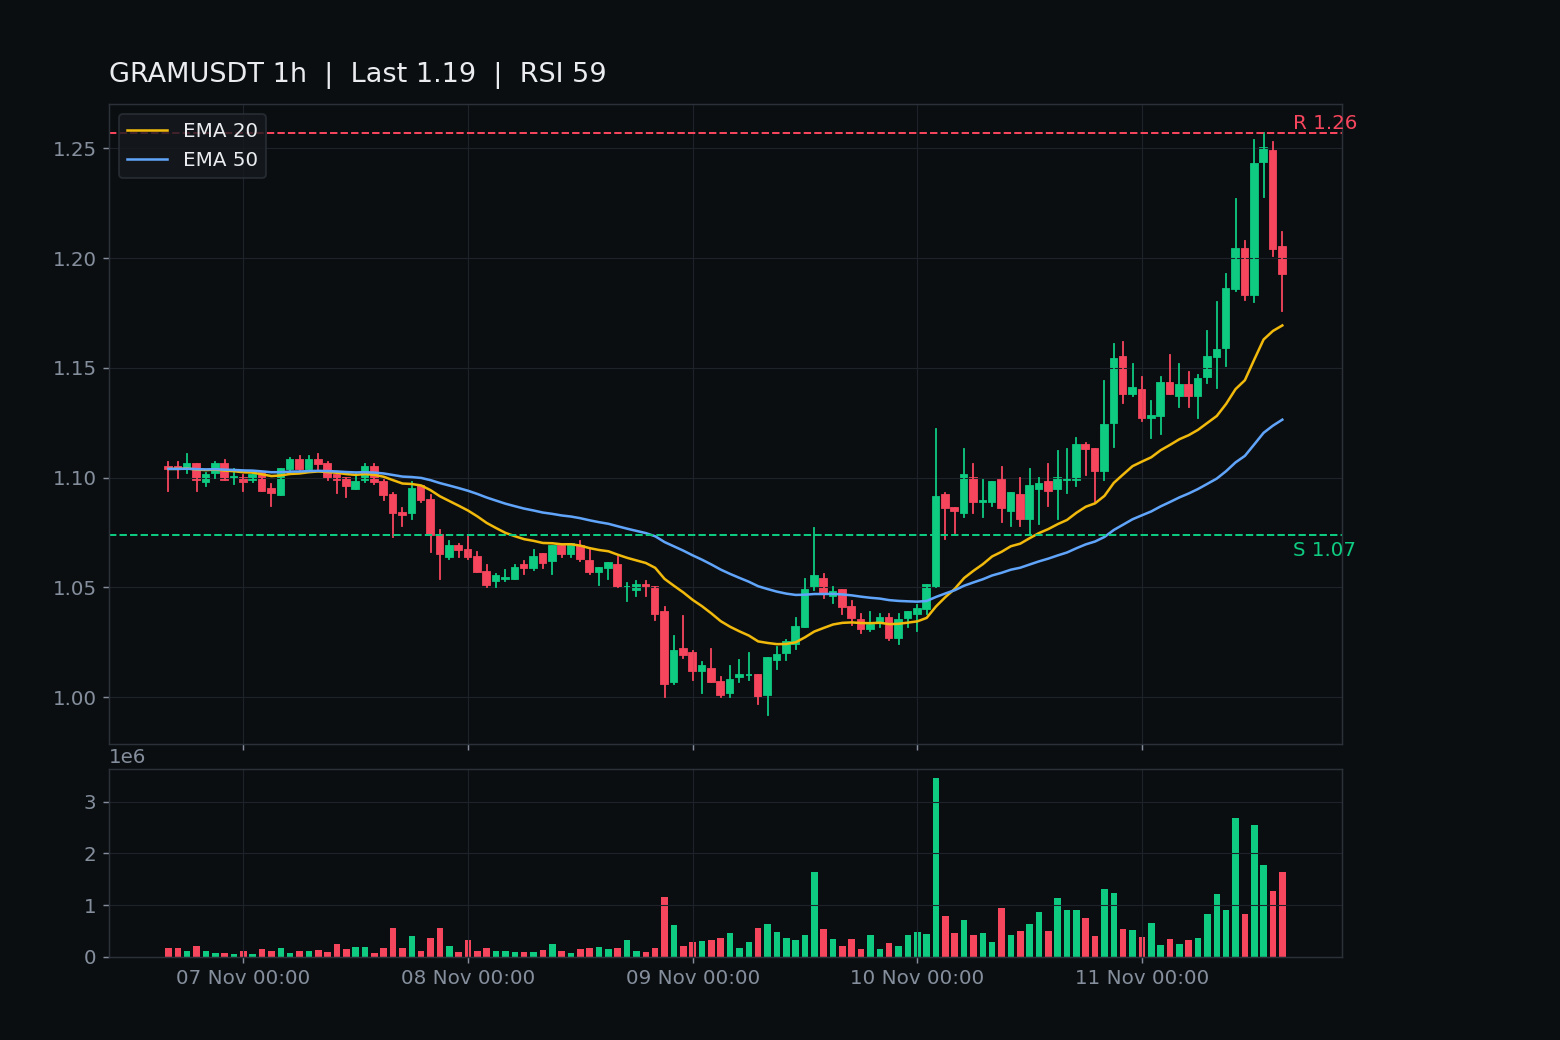
The tape did what the tweet said. GRAM sat flat near $1.13 overnight, then ground up from 07:00 UTC — $1.204 by 10:00 on the day's biggest hourly bar, $1.243 at noon, $1.250 by 13:00 with a $1.257 high. Live now $1.19, +9.3% on the day, $26.7M of Binance volume. Rank #29, $3.4B market cap, $159M of global volume today.
The honest other side, because a founder's tweet is not a fundamental: GRAM is still 85% below its $8.25 high from June 2024, down 13% over the last 30 days, and the move is already giving back — $1.257 to $1.19 is -5% off the high in two hours. And "top 3" is not a small claim: that is roughly 30x from here, into $100B-plus territory. 54% of the 5.28B supply circulates, no max supply.
The chart: 1h RSI 59, above EMA20 $1.169 and EMA50 $1.126 — the move has room, it is not overheated yet. The line that matters is $1.257: an hourly close above it and the founder's call gets a second leg. An hourly close below $1.204 and this is a tweet spike giving itself back.
Not a call. A founder's claim, priced in real time.
Does the Telegram ecosystem bid carry GRAM past $1.257, or does the give-back win the day?
Pavel Durov just called $GRAM "ridiculously undervalued" — and said it belongs in the top 3.
His post on X today: "Crypto's a sea of red. Only GRAM is up +8%." The snapshot showed LTC, AVAX, SUI and HBAR all down 1.7% to 3.6% while GRAM sat at $1.12, +8.65%, on a $3.21B market cap. His line: "No surprise there. It's the only coin built into a real social ecosystem."
The tape did what the tweet said. GRAM sat flat near $1.13 overnight, then ground up from 07:00 UTC — $1.204 by 10:00 on the day's biggest hourly bar, $1.243 at noon, $1.250 by 13:00 with a $1.257 high. Live now $1.19, +9.3% on the day, $26.7M of Binance volume. Rank #29, $3.4B market cap, $159M of global volume today.
The honest other side, because a founder's tweet is not a fundamental: GRAM is still 85% below its $8.25 high from June 2024, down 13% over the last 30 days, and the move is already giving back — $1.257 to $1.19 is -5% off the high in two hours. And "top 3" is not a small claim: that is roughly 30x from here, into $100B-plus territory. 54% of the 5.28B supply circulates, no max supply.
The chart: 1h RSI 59, above EMA20 $1.169 and EMA50 $1.126 — the move has room, it is not overheated yet. The line that matters is $1.257: an hourly close above it and the founder's call gets a second leg. An hourly close below $1.204 and this is a tweet spike giving itself back.
Not a call. A founder's claim, priced in real time.
Does the Telegram ecosystem bid carry GRAM past $1.257, or does the give-back win the day?
His post on X today: "Crypto's a sea of red. Only GRAM is up +8%." The snapshot showed LTC, AVAX, SUI and HBAR all down 1.7% to 3.6% while GRAM sat at $1.12, +8.65%, on a $3.21B market cap. His line: "No surprise there. It's the only coin built into a real social ecosystem."
The tape did what the tweet said. GRAM sat flat near $1.13 overnight, then ground up from 07:00 UTC — $1.204 by 10:00 on the day's biggest hourly bar, $1.243 at noon, $1.250 by 13:00 with a $1.257 high. Live now $1.19, +9.3% on the day, $26.7M of Binance volume. Rank #29, $3.4B market cap, $159M of global volume today.
The honest other side, because a founder's tweet is not a fundamental: GRAM is still 85% below its $8.25 high from June 2024, down 13% over the last 30 days, and the move is already giving back — $1.257 to $1.19 is -5% off the high in two hours. And "top 3" is not a small claim: that is roughly 30x from here, into $100B-plus territory. 54% of the 5.28B supply circulates, no max supply.
The chart: 1h RSI 59, above EMA20 $1.169 and EMA50 $1.126 — the move has room, it is not overheated yet. The line that matters is $1.257: an hourly close above it and the founder's call gets a second leg. An hourly close below $1.204 and this is a tweet spike giving itself back.
Not a call. A founder's claim, priced in real time.
Does the Telegram ecosystem bid carry GRAM past $1.257, or does the give-back win the day?
79

·
--
15:00 market update: BTC is grinding around 73,500, while privacy coins are the first to buckle—ZEC is down 14% in a day.
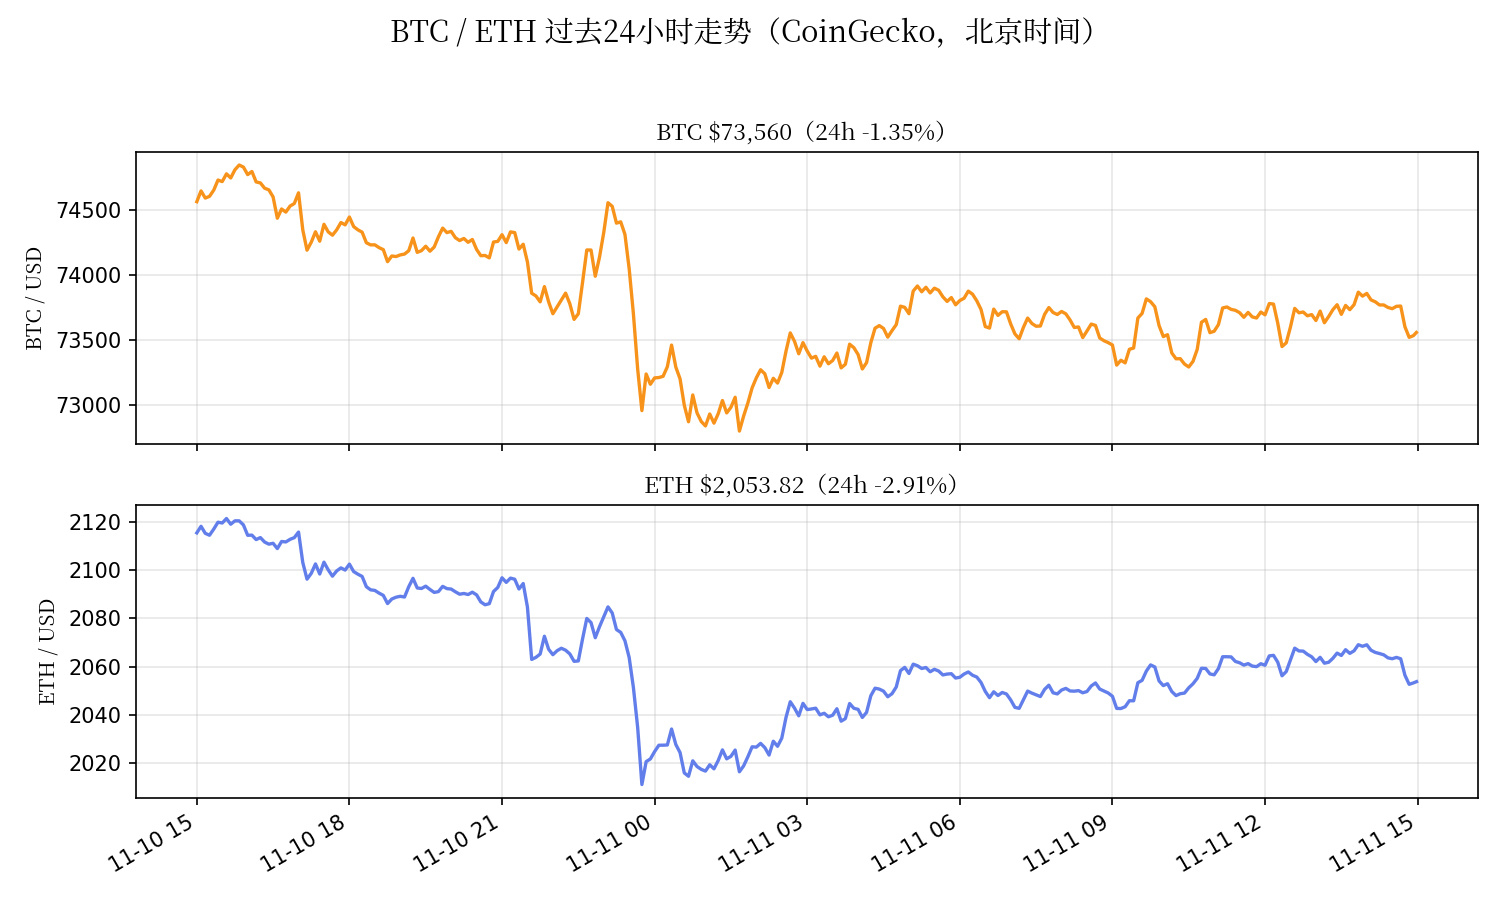
At 15:00, $BTC was around $73,555, down 1.3% over 24 hours; $ETH was around $2,054, down 2.9% (live CoinGecko data). The 24-hour ranges were $72,840–$74,775 for BTC and $2,017–$2,116 for ETH. The 12:00 four-hour candle closed at around $73,695, marking the 14th consecutive close below $75,000. If the 16:00 candle also closes below $75,000, it’ll be the 15th.
The standout today isn’t BTC, but ZEC: down 14.1% in a day, falling below $1,000 to around $986 (CoinGecko trending searches). What’s interesting is that there’s no shortage of positive news: Grayscale announced yesterday that it would allocate $1 million to the Zcash ecosystem and launch a national ad campaign, while the NU7 upgrade also went live on November 6, cutting block times from 75 seconds to 25. But none of it was enough to support the price. The ZCSH ETF saw outflows of more than $15 million in November, after $46.25 million flowed out in October (CoinStats/FXStreet data); over the past 24 hours, $27.08 million in ZEC positions were liquidated, 89% of them longs. In plain terms: privacy coins are cooling off in a rotation after a big run-up; XMR had also dropped 7.8% earlier. ZEC is still up 160% over the past year, so this looks more like profit-taking at elevated levels than a collapse in the fundamentals of a single coin—but I’m staying away. Buying a dip like this is like catching a falling knife.
Now for the institutional side: mining company MARA sold 13,597 BTC over the past six weeks, worth about $1.1 billion, and said it would continue selling (CoinDesk). BlackRock’s IBIT has seen net outflows for seven consecutive trading days, totaling $1.66 billion over that period. Since November 2, U.S. spot BTC ETFs have seen cumulative outflows of about $1.5 billion, putting year-to-date flows in the red by around $900 million–$1.1 billion. On-chain data also shows that large holders sold more than 34,000 BTC as the price fell from $79,000 to below $73,000 (analyst Ali Martinez). The selling isn’t retail investors fleeing; it’s institutions and miners offloading.
Short position tracking #29: The short was opened on November 7 at 13:00 between $75,800 and $76,100, with a midpoint entry of $75,950. At the current price of $73,555, the price is down 3.15%. With 100x leverage, the remaining half has an unrealized gain of about +315%—it was +307% at 13:00, so the gain has widened a little. The added short (entry range $74,700–$75,000, midpoint $74,850) is up about +173% (it was +165% at 13:00). The portions I closed at half size are already locked in: +362% on the original position and +220% on the added short. To be clear: this trade is still profitable.
A quick look at the technicals: the 200-day moving average is around $73,136, just over $400 below the current price; the recent low is $72,689. The first resistance zone above is $74,000–$75,000. The U.S. 10-year Treasury yield is at 4.996%, nearing 5% (Chosun Biz), and some expect BTC to fall below $73,000 if the yield breaks 5%. The Fear & Greed Index is at 26, in fear territory.
The plan hasn’t changed: keep holding the remaining half, with a second target at $68,000. The stop is at $77,500, and I’ll admit I’m wrong if a four-hour candle closes above $76,250; neither level has been hit. A rebound to $75,300–$75,500 is still my zone to add to the short. If BTC drops below $71,500 and can’t reclaim it on a four-hour close, I won’t chase the short; I’ll hold and wait for $68,000. I’ll only consider flipping long if it gets back above $78,000 and holds. I’m putting only a very small portion of my total capital behind 100x leverage. On Friday, November 13, we also have PPI and the expiry of 33,902 BTC options (max pain at $77,000).
Among trending searches, INIT is up 19% in a day (it was up 45% at 13:00, but interest is fading), while JCT is back in the rankings, up 27%. Both are small caps—just sentiment gauges, not something I’m touching.
With ZEC dropping 14% in a day from elevated levels, do you see this as a buying opportunity, or would you wait for it to stabilize first? Let’s discuss in the comments. (Prices: live CoinGecko data at 15:00 Beijing time on November 11; chart shows the past 24 hours.)
15:00 market update: BTC is grinding around 73,500, while privacy coins are the first to buckle—ZEC is down 14% in a day.
At 15:00, $BTC was around $73,555, down 1.3% over 24 hours; $ETH was around $2,054, down 2.9% (live CoinGecko data). The 24-hour ranges were $72,840–$74,775 for BTC and $2,017–$2,116 for ETH. The 12:00 four-hour candle closed at around $73,695, marking the 14th consecutive close below $75,000. If the 16:00 candle also closes below $75,000, it’ll be the 15th.
The standout today isn’t BTC, but ZEC: down 14.1% in a day, falling below $1,000 to around $986 (CoinGecko trending searches). What’s interesting is that there’s no shortage of positive news: Grayscale announced yesterday that it would allocate $1 million to the Zcash ecosystem and launch a national ad campaign, while the NU7 upgrade also went live on November 6, cutting block times from 75 seconds to 25. But none of it was enough to support the price. The ZCSH ETF saw outflows of more than $15 million in November, after $46.25 million flowed out in October (CoinStats/FXStreet data); over the past 24 hours, $27.08 million in ZEC positions were liquidated, 89% of them longs. In plain terms: privacy coins are cooling off in a rotation after a big run-up; XMR had also dropped 7.8% earlier. ZEC is still up 160% over the past year, so this looks more like profit-taking at elevated levels than a collapse in the fundamentals of a single coin—but I’m staying away. Buying a dip like this is like catching a falling knife.
Now for the institutional side: mining company MARA sold 13,597 BTC over the past six weeks, worth about $1.1 billion, and said it would continue selling (CoinDesk). BlackRock’s IBIT has seen net outflows for seven consecutive trading days, totaling $1.66 billion over that period. Since November 2, U.S. spot BTC ETFs have seen cumulative outflows of about $1.5 billion, putting year-to-date flows in the red by around $900 million–$1.1 billion. On-chain data also shows that large holders sold more than 34,000 BTC as the price fell from $79,000 to below $73,000 (analyst Ali Martinez). The selling isn’t retail investors fleeing; it’s institutions and miners offloading.
Short position tracking #29: The short was opened on November 7 at 13:00 between $75,800 and $76,100, with a midpoint entry of $75,950. At the current price of $73,555, the price is down 3.15%. With 100x leverage, the remaining half has an unrealized gain of about +315%—it was +307% at 13:00, so the gain has widened a little. The added short (entry range $74,700–$75,000, midpoint $74,850) is up about +173% (it was +165% at 13:00). The portions I closed at half size are already locked in: +362% on the original position and +220% on the added short. To be clear: this trade is still profitable.
A quick look at the technicals: the 200-day moving average is around $73,136, just over $400 below the current price; the recent low is $72,689. The first resistance zone above is $74,000–$75,000. The U.S. 10-year Treasury yield is at 4.996%, nearing 5% (Chosun Biz), and some expect BTC to fall below $73,000 if the yield breaks 5%. The Fear & Greed Index is at 26, in fear territory.
The plan hasn’t changed: keep holding the remaining half, with a second target at $68,000. The stop is at $77,500, and I’ll admit I’m wrong if a four-hour candle closes above $76,250; neither level has been hit. A rebound to $75,300–$75,500 is still my zone to add to the short. If BTC drops below $71,500 and can’t reclaim it on a four-hour close, I won’t chase the short; I’ll hold and wait for $68,000. I’ll only consider flipping long if it gets back above $78,000 and holds. I’m putting only a very small portion of my total capital behind 100x leverage. On Friday, November 13, we also have PPI and the expiry of 33,902 BTC options (max pain at $77,000).
Among trending searches, INIT is up 19% in a day (it was up 45% at 13:00, but interest is fading), while JCT is back in the rankings, up 27%. Both are small caps—just sentiment gauges, not something I’m touching.
With ZEC dropping 14% in a day from elevated levels, do you see this as a buying opportunity, or would you wait for it to stabilize first? Let’s discuss in the comments. (Prices: live CoinGecko data at 15:00 Beijing time on November 11; chart shows the past 24 hours.)
At 15:00, $BTC was around $73,555, down 1.3% over 24 hours; $ETH was around $2,054, down 2.9% (live CoinGecko data). The 24-hour ranges were $72,840–$74,775 for BTC and $2,017–$2,116 for ETH. The 12:00 four-hour candle closed at around $73,695, marking the 14th consecutive close below $75,000. If the 16:00 candle also closes below $75,000, it’ll be the 15th.
The standout today isn’t BTC, but ZEC: down 14.1% in a day, falling below $1,000 to around $986 (CoinGecko trending searches). What’s interesting is that there’s no shortage of positive news: Grayscale announced yesterday that it would allocate $1 million to the Zcash ecosystem and launch a national ad campaign, while the NU7 upgrade also went live on November 6, cutting block times from 75 seconds to 25. But none of it was enough to support the price. The ZCSH ETF saw outflows of more than $15 million in November, after $46.25 million flowed out in October (CoinStats/FXStreet data); over the past 24 hours, $27.08 million in ZEC positions were liquidated, 89% of them longs. In plain terms: privacy coins are cooling off in a rotation after a big run-up; XMR had also dropped 7.8% earlier. ZEC is still up 160% over the past year, so this looks more like profit-taking at elevated levels than a collapse in the fundamentals of a single coin—but I’m staying away. Buying a dip like this is like catching a falling knife.
Now for the institutional side: mining company MARA sold 13,597 BTC over the past six weeks, worth about $1.1 billion, and said it would continue selling (CoinDesk). BlackRock’s IBIT has seen net outflows for seven consecutive trading days, totaling $1.66 billion over that period. Since November 2, U.S. spot BTC ETFs have seen cumulative outflows of about $1.5 billion, putting year-to-date flows in the red by around $900 million–$1.1 billion. On-chain data also shows that large holders sold more than 34,000 BTC as the price fell from $79,000 to below $73,000 (analyst Ali Martinez). The selling isn’t retail investors fleeing; it’s institutions and miners offloading.
Short position tracking #29: The short was opened on November 7 at 13:00 between $75,800 and $76,100, with a midpoint entry of $75,950. At the current price of $73,555, the price is down 3.15%. With 100x leverage, the remaining half has an unrealized gain of about +315%—it was +307% at 13:00, so the gain has widened a little. The added short (entry range $74,700–$75,000, midpoint $74,850) is up about +173% (it was +165% at 13:00). The portions I closed at half size are already locked in: +362% on the original position and +220% on the added short. To be clear: this trade is still profitable.
A quick look at the technicals: the 200-day moving average is around $73,136, just over $400 below the current price; the recent low is $72,689. The first resistance zone above is $74,000–$75,000. The U.S. 10-year Treasury yield is at 4.996%, nearing 5% (Chosun Biz), and some expect BTC to fall below $73,000 if the yield breaks 5%. The Fear & Greed Index is at 26, in fear territory.
The plan hasn’t changed: keep holding the remaining half, with a second target at $68,000. The stop is at $77,500, and I’ll admit I’m wrong if a four-hour candle closes above $76,250; neither level has been hit. A rebound to $75,300–$75,500 is still my zone to add to the short. If BTC drops below $71,500 and can’t reclaim it on a four-hour close, I won’t chase the short; I’ll hold and wait for $68,000. I’ll only consider flipping long if it gets back above $78,000 and holds. I’m putting only a very small portion of my total capital behind 100x leverage. On Friday, November 13, we also have PPI and the expiry of 33,902 BTC options (max pain at $77,000).
Among trending searches, INIT is up 19% in a day (it was up 45% at 13:00, but interest is fading), while JCT is back in the rankings, up 27%. Both are small caps—just sentiment gauges, not something I’m touching.
With ZEC dropping 14% in a day from elevated levels, do you see this as a buying opportunity, or would you wait for it to stabilize first? Let’s discuss in the comments. (Prices: live CoinGecko data at 15:00 Beijing time on November 11; chart shows the past 24 hours.)
600

·
--
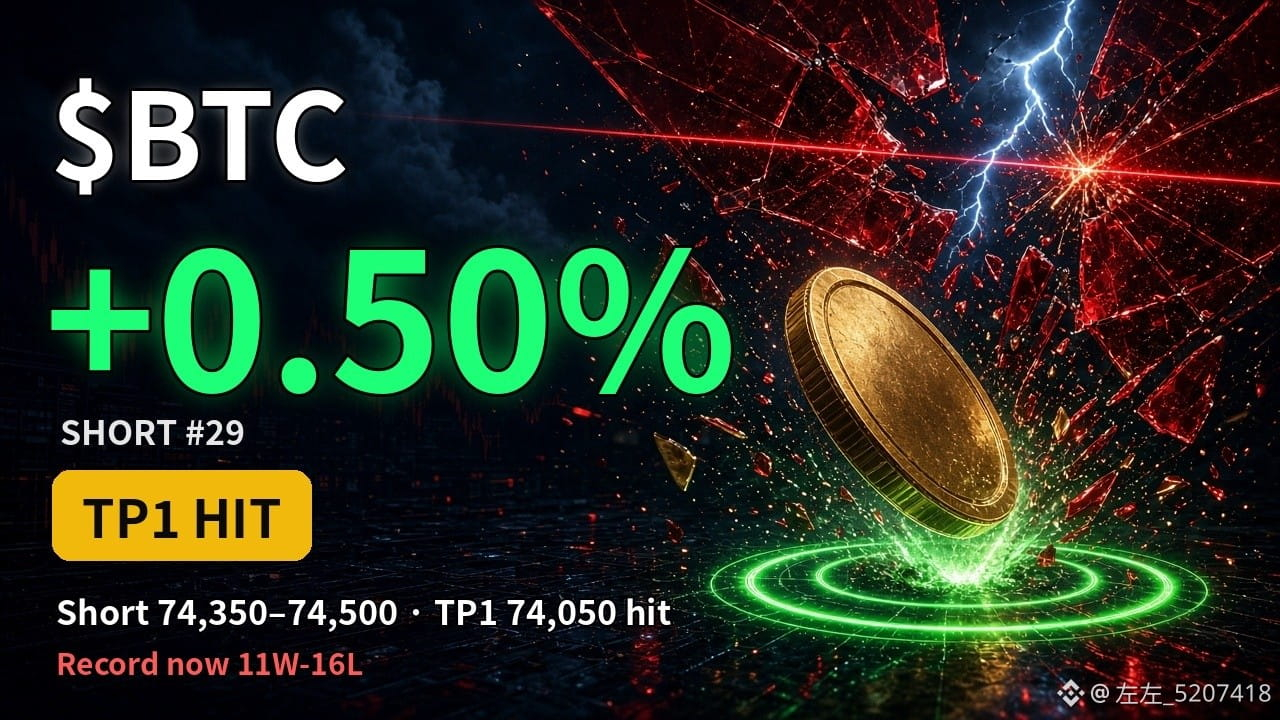
【ZuoZuo’s Trade Idea · Review】BTC short #29 hit take-profit TP1. Did you get stopped out during that one-minute CPI candle? 🎯
Last night’s 19:30 trade idea: Short the rebound at 74,350–74,500, stop-loss at 74,750, TP1 at 74,050, TP2 at 73,750.
Result: Entry filled at 19:43. CPI was released at 21:30, and the same 1-minute candle hit a high of 74,770 and a low of 73,524—both the stop-loss and TP1 were hit. Counted as a take-profit, with a return of +0.50% based on the midpoint of the range (no leverage). The record is now 11W-16L.
Later, price rebounded to 74,843 at 23:00, then plunged to 72,727 around midnight. Current price: 73,369, down 2.0% over 24 hours (Binance spot).
Two things to watch next:
① Will the overnight low of 72,727 hold?
② If price gets back above 74,050, the bears can take a breather for now.
Win or lose, we review every trade. Did that CPI wick stop you out or put money in your pocket? 👇
#BTC #比特币 #CPI #左左观点单
$BTC
{future}(BTCUSDT)
【ZuoZuo’s Trade Idea · Review】BTC short #29 hit take-profit TP1. Did you get stopped out during that one-minute CPI candle? 🎯
Last night’s 19:30 trade idea: Short the rebound at 74,350–74,500, stop-loss at 74,750, TP1 at 74,050, TP2 at 73,750.
Result: Entry filled at 19:43. CPI was released at 21:30, and the same 1-minute candle hit a high of 74,770 and a low of 73,524—both the stop-loss and TP1 were hit. Counted as a take-profit, with a return of +0.50% based on the midpoint of the range (no leverage). The record is now 11W-16L.
Later, price rebounded to 74,843 at 23:00, then plunged to 72,727 around midnight. Current price: 73,369, down 2.0% over 24 hours (Binance spot).
Two things to watch next:
① Will the overnight low of 72,727 hold?
② If price gets back above 74,050, the bears can take a breather for now.
Win or lose, we review every trade. Did that CPI wick stop you out or put money in your pocket? 👇
#BTC #比特币 #CPI #左左观点单
$BTC
Last night’s 19:30 trade idea: Short the rebound at 74,350–74,500, stop-loss at 74,750, TP1 at 74,050, TP2 at 73,750.
Result: Entry filled at 19:43. CPI was released at 21:30, and the same 1-minute candle hit a high of 74,770 and a low of 73,524—both the stop-loss and TP1 were hit. Counted as a take-profit, with a return of +0.50% based on the midpoint of the range (no leverage). The record is now 11W-16L.
Later, price rebounded to 74,843 at 23:00, then plunged to 72,727 around midnight. Current price: 73,369, down 2.0% over 24 hours (Binance spot).
Two things to watch next:
① Will the overnight low of 72,727 hold?
② If price gets back above 74,050, the bears can take a breather for now.
Win or lose, we review every trade. Did that CPI wick stop you out or put money in your pocket? 👇
#BTC #比特币 #CPI #左左观点单
$BTC
1
201

·
--
$ONE rose 0.82% over 15m, while volume was only 0.99x and OI kept climbing—the 1h contract is up 1.51%, with notional value increasing by nearly 400k U. Price is up, open interest is up, but volume hasn't followed: a classic sign of leveraged longs adding positions, rather than spot buying driving the move. The active buy/sell ratio is 1.16, and the trade imbalance is 7.2%. Buying pressure is indeed stronger, but its anomaly percentile is 63.1%, ranked #29 across the entire pool—not enough to make it the center of everyone's attention yet.
24h turnover is over 580 million, and the pool is deep enough that price, volume, and open interest are structurally aligned. But until volume picks up, this rise in OI looks more like someone positioning early than a confirmed trend. Watch whether 15m volume catches up; if it doesn't, this is just a burst of leveraged activity.
$ONE rose 0.82% over 15m, while volume was only 0.99x and OI kept climbing—the 1h contract is up 1.51%, with notional value increasing by nearly 400k U. Price is up, open interest is up, but volume hasn't followed: a classic sign of leveraged longs adding positions, rather than spot buying driving the move. The active buy/sell ratio is 1.16, and the trade imbalance is 7.2%. Buying pressure is indeed stronger, but its anomaly percentile is 63.1%, ranked #29 across the entire pool—not enough to make it the center of everyone's attention yet.
24h turnover is over 580 million, and the pool is deep enough that price, volume, and open interest are structurally aligned. But until volume picks up, this rise in OI looks more like someone positioning early than a confirmed trend. Watch whether 15m volume catches up; if it doesn't, this is just a burst of leveraged activity.
24h turnover is over 580 million, and the pool is deep enough that price, volume, and open interest are structurally aligned. But until volume picks up, this rise in OI looks more like someone positioning early than a confirmed trend. Watch whether 15m volume catches up; if it doesn't, this is just a burst of leveraged activity.
5

·
--
$NEAR This 15m setup is interesting—the price drop of 0.62% isn't huge, but volume surged to 2.33x, and the net taker flow was -31.5%. Someone is clearly pushing the price down.
OI is what’s worth watching: price down, open interest up—a classic sign of fresh short leverage entering, rather than old longs closing out. It also closed below the lower bound of the last 20 5m candles, so the short-term structure has deteriorated.
It ranks #29 for anomalies across the whole pool and #7 for notional change, with solid depth. With volume rising on the drop and taker selling pressure building, I’m not going to catch this falling knife for now. I’ll wait for the divergence between OI and price to resolve before reconsidering.
$NEAR This 15m setup is interesting—the price drop of 0.62% isn't huge, but volume surged to 2.33x, and the net taker flow was -31.5%. Someone is clearly pushing the price down.
OI is what’s worth watching: price down, open interest up—a classic sign of fresh short leverage entering, rather than old longs closing out. It also closed below the lower bound of the last 20 5m candles, so the short-term structure has deteriorated.
It ranks #29 for anomalies across the whole pool and #7 for notional change, with solid depth. With volume rising on the drop and taker selling pressure building, I’m not going to catch this falling knife for now. I’ll wait for the divergence between OI and price to resolve before reconsidering.
OI is what’s worth watching: price down, open interest up—a classic sign of fresh short leverage entering, rather than old longs closing out. It also closed below the lower bound of the last 20 5m candles, so the short-term structure has deteriorated.
It ranks #29 for anomalies across the whole pool and #7 for notional change, with solid depth. With volume rising on the drop and taker selling pressure building, I’m not going to catch this falling knife for now. I’ll wait for the divergence between OI and price to resolve before reconsidering.
9

·
--
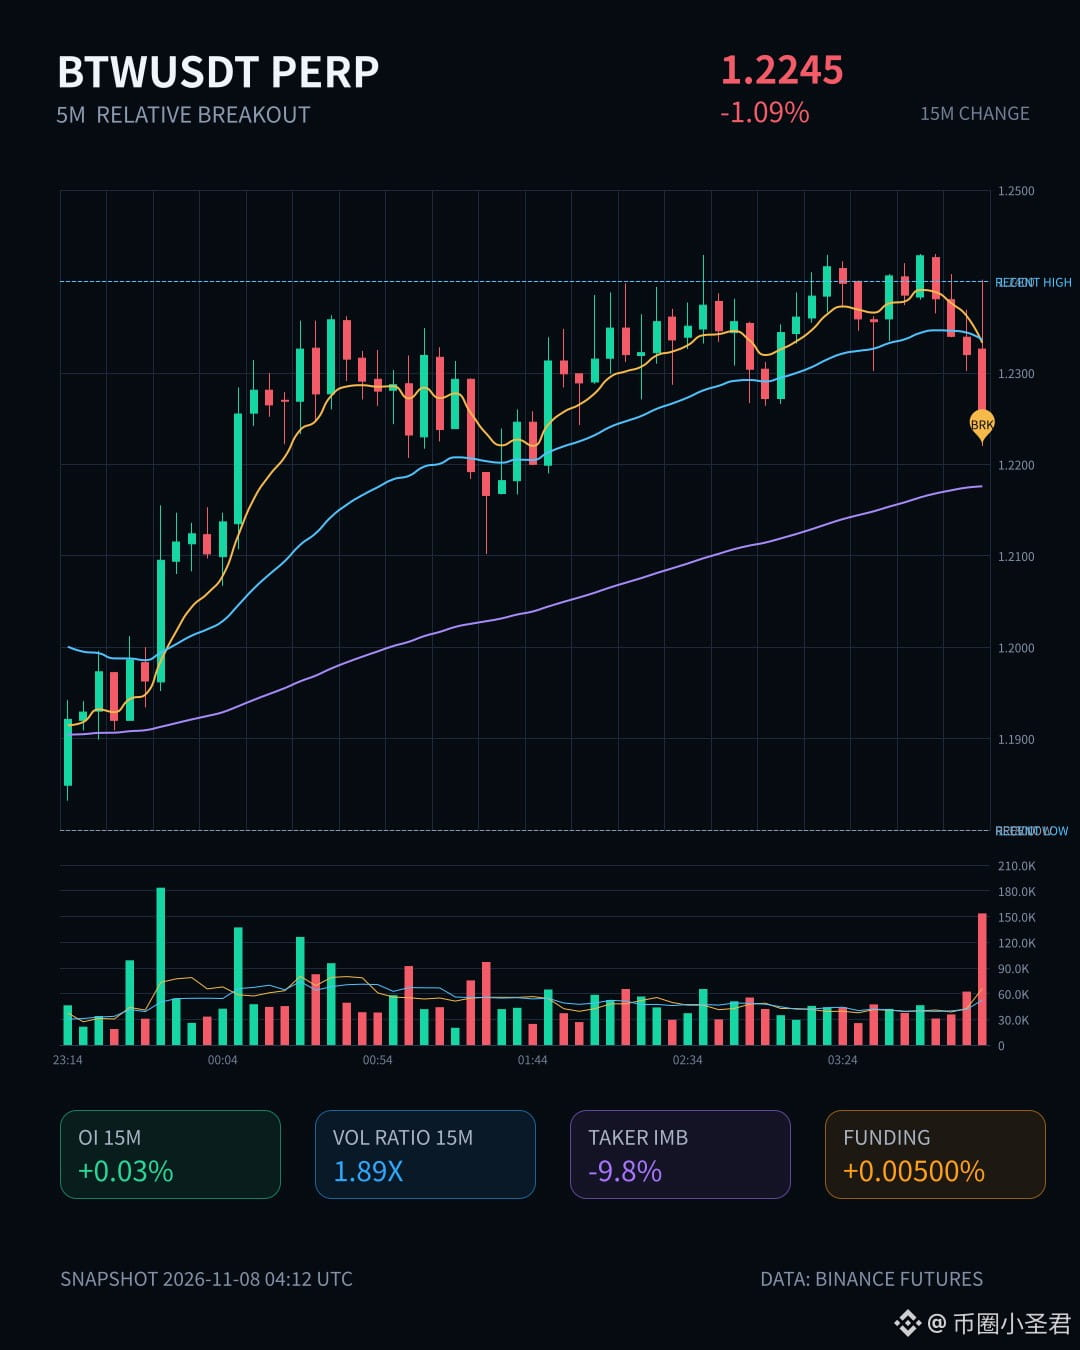
$BTW 15m This high-volume bearish candle is worth watching—the volume was 1.89 times the norm, volatility Z reached 1.94, and the close broke straight below the lows of the last 20 5m candles. More importantly, OI rose along with it: +0.24% over 1h. Price down + OI up points more to new leveraged shorts entering than to a long-position liquidation cascade. The aggressive trade imbalance was -9.8%, with a buy/sell ratio of 0.82, so selling pressure is in control. Notional change ranks near the top of the entire pool at #29 , and depth also confirms that volume is above normal—technically, this is a genuine breakout. At times like this, I usually don't rush to buy the dip. First, I watch to see whether a pullback can reclaim the lower bound of the range. If it can't, I'll look for the next leg to continue in the same direction.
$BTW 15m This high-volume bearish candle is worth watching—the volume was 1.89 times the norm, volatility Z reached 1.94, and the close broke straight below the lows of the last 20 5m candles. More importantly, OI rose along with it: +0.24% over 1h. Price down + OI up points more to new leveraged shorts entering than to a long-position liquidation cascade. The aggressive trade imbalance was -9.8%, with a buy/sell ratio of 0.82, so selling pressure is in control. Notional change ranks near the top of the entire pool at #29 , and depth also confirms that volume is above normal—technically, this is a genuine breakout. At times like this, I usually don't rush to buy the dip. First, I watch to see whether a pullback can reclaim the lower bound of the range. If it can't, I'll look for the next leg to continue in the same direction.
18
·
--
$ZRO broke below the lower boundary of the past 20 5m ranges, while 15m volume expanded to 2.9 times normal. Aggressive trade imbalance was -16.2% and the buy/sell ratio was 0.72—this wasn’t a gradual grind downward; it was driven by aggressive selling.
More interestingly, OI rose as price fell: new shorts are entering, rather than longs closing out in a cascade. The funding rate is still in a high range relative to recent levels, and shorts are willing to pay that cost to push prices lower, suggesting this isn’t just a probe. Notional change ranks #29 across the entire pool, and the volume-price action is enough to confirm the move.
This isn’t a signal to buy the dip. First, watch whether these newly opened shorts continue adding to their positions in the next 5m candle.
$ZRO broke below the lower boundary of the past 20 5m ranges, while 15m volume expanded to 2.9 times normal. Aggressive trade imbalance was -16.2% and the buy/sell ratio was 0.72—this wasn’t a gradual grind downward; it was driven by aggressive selling.
More interestingly, OI rose as price fell: new shorts are entering, rather than longs closing out in a cascade. The funding rate is still in a high range relative to recent levels, and shorts are willing to pay that cost to push prices lower, suggesting this isn’t just a probe. Notional change ranks #29 across the entire pool, and the volume-price action is enough to confirm the move.
This isn’t a signal to buy the dip. First, watch whether these newly opened shorts continue adding to their positions in the next 5m candle.
More interestingly, OI rose as price fell: new shorts are entering, rather than longs closing out in a cascade. The funding rate is still in a high range relative to recent levels, and shorts are willing to pay that cost to push prices lower, suggesting this isn’t just a probe. Notional change ranks #29 across the entire pool, and the volume-price action is enough to confirm the move.
This isn’t a signal to buy the dip. First, watch whether these newly opened shorts continue adding to their positions in the next 5m candle.
·
--
$1M to deploy today. Two doors. ENTRY 67.
Door 1 is $HYPE — $83.69, down 0.6% on a day BTC is +4% and ETH is +6.4%. The whole board bounced and HYPE faded.
Yesterday's 15:00 UTC hour tagged $88.90, closed $85.92 on $9.33M — the day's heaviest HYPE bar — then bled all night to $82.77. It is sitting under that tag with tomorrow's unlock hanging over it.
Here is the twist in the calendar: the headlines say $923M of HYPE unlocks Nov 6 — about 9.92M tokens to core contributors. Hyperliquid's team says the actual Nov 6 distribution is 180,000 HYPE, about $15.7M. That is not a rounding error, that is 55x smaller. The fade may be fear of a number that isn't real. (CoinGecko: rank #11, $20.1B, $39.2M Binance volume.)
Door 2 is $SUI — $0.9256, +4.5% today — and this is the unlock that already cleared. Nov 1's ~44M SUI unlock was the one the last three unlocks printed red for. This time the $0.8277 flush low held, and the token climbed back to $0.93. Today's high $0.9566, yesterday's 15:00 hour closed $0.943 on $7.61M. The seller showed, the floor held, the chart moved on. (CoinGecko: rank #29, $3.8B.)
My pick is Door 1. A known seller that already showed its size is one thing — a feared seller that may be 55x smaller than the headline is another, and the market faded HYPE before checking which number was real.
The other side, honestly: if the clarification is wrong, or early holders sell into the headline anyway, $82.77 breaks and HYPE has air below it. And SUI's history says "held" can still turn red on the second look.
Not a call, either way. Which door would you rather own tonight — the unlock that already cleared, or the one the headlines got wrong?
$1M to deploy today. Two doors. ENTRY 67.
Door 1 is $HYPE — $83.69, down 0.6% on a day BTC is +4% and ETH is +6.4%. The whole board bounced and HYPE faded.
Yesterday's 15:00 UTC hour tagged $88.90, closed $85.92 on $9.33M — the day's heaviest HYPE bar — then bled all night to $82.77. It is sitting under that tag with tomorrow's unlock hanging over it.
Here is the twist in the calendar: the headlines say $923M of HYPE unlocks Nov 6 — about 9.92M tokens to core contributors. Hyperliquid's team says the actual Nov 6 distribution is 180,000 HYPE, about $15.7M. That is not a rounding error, that is 55x smaller. The fade may be fear of a number that isn't real. (CoinGecko: rank #11, $20.1B, $39.2M Binance volume.)
Door 2 is $SUI — $0.9256, +4.5% today — and this is the unlock that already cleared. Nov 1's ~44M SUI unlock was the one the last three unlocks printed red for. This time the $0.8277 flush low held, and the token climbed back to $0.93. Today's high $0.9566, yesterday's 15:00 hour closed $0.943 on $7.61M. The seller showed, the floor held, the chart moved on. (CoinGecko: rank #29, $3.8B.)
My pick is Door 1. A known seller that already showed its size is one thing — a feared seller that may be 55x smaller than the headline is another, and the market faded HYPE before checking which number was real.
The other side, honestly: if the clarification is wrong, or early holders sell into the headline anyway, $82.77 breaks and HYPE has air below it. And SUI's history says "held" can still turn red on the second look.
Not a call, either way. Which door would you rather own tonight — the unlock that already cleared, or the one the headlines got wrong?
Door 1 is $HYPE — $83.69, down 0.6% on a day BTC is +4% and ETH is +6.4%. The whole board bounced and HYPE faded.
Yesterday's 15:00 UTC hour tagged $88.90, closed $85.92 on $9.33M — the day's heaviest HYPE bar — then bled all night to $82.77. It is sitting under that tag with tomorrow's unlock hanging over it.
Here is the twist in the calendar: the headlines say $923M of HYPE unlocks Nov 6 — about 9.92M tokens to core contributors. Hyperliquid's team says the actual Nov 6 distribution is 180,000 HYPE, about $15.7M. That is not a rounding error, that is 55x smaller. The fade may be fear of a number that isn't real. (CoinGecko: rank #11, $20.1B, $39.2M Binance volume.)
Door 2 is $SUI — $0.9256, +4.5% today — and this is the unlock that already cleared. Nov 1's ~44M SUI unlock was the one the last three unlocks printed red for. This time the $0.8277 flush low held, and the token climbed back to $0.93. Today's high $0.9566, yesterday's 15:00 hour closed $0.943 on $7.61M. The seller showed, the floor held, the chart moved on. (CoinGecko: rank #29, $3.8B.)
My pick is Door 1. A known seller that already showed its size is one thing — a feared seller that may be 55x smaller than the headline is another, and the market faded HYPE before checking which number was real.
The other side, honestly: if the clarification is wrong, or early holders sell into the headline anyway, $82.77 breaks and HYPE has air below it. And SUI's history says "held" can still turn red on the second look.
Not a call, either way. Which door would you rather own tonight — the unlock that already cleared, or the one the headlines got wrong?
3
·
--
FIL’s 15m move looks off—price fell 0.81%, while volume hit 2.05x and the taker buy/sell ratio was only 0.40, pointing to clear selling pressure.
Open interest is more interesting: 15m -0.30%, 1h -0.44%, with notional changes shrinking in both cases. Price down + OI down doesn’t mean new shorts are entering; it looks more like longs deleveraging and stopping out. The anomaly percentile is 87.7%, ranking #29 across the entire pool, while notional change ranks #20—showing that this position contraction is among the more significant in the pool.
The close has already fallen below the lower edge of the recent 20-bar 5m range, while the funding rate is still at a recent high percentile—longs had gotten pretty crowded, and now the excess is starting to get squeezed out. First, see if this level can hold. Don’t rush to buy the dip.
FIL’s 15m move looks off—price fell 0.81%, while volume hit 2.05x and the taker buy/sell ratio was only 0.40, pointing to clear selling pressure.
Open interest is more interesting: 15m -0.30%, 1h -0.44%, with notional changes shrinking in both cases. Price down + OI down doesn’t mean new shorts are entering; it looks more like longs deleveraging and stopping out. The anomaly percentile is 87.7%, ranking #29 across the entire pool, while notional change ranks #20—showing that this position contraction is among the more significant in the pool.
The close has already fallen below the lower edge of the recent 20-bar 5m range, while the funding rate is still at a recent high percentile—longs had gotten pretty crowded, and now the excess is starting to get squeezed out. First, see if this level can hold. Don’t rush to buy the dip.
Open interest is more interesting: 15m -0.30%, 1h -0.44%, with notional changes shrinking in both cases. Price down + OI down doesn’t mean new shorts are entering; it looks more like longs deleveraging and stopping out. The anomaly percentile is 87.7%, ranking #29 across the entire pool, while notional change ranks #20—showing that this position contraction is among the more significant in the pool.
The close has already fallen below the lower edge of the recent 20-bar 5m range, while the funding rate is still at a recent high percentile—longs had gotten pretty crowded, and now the excess is starting to get squeezed out. First, see if this level can hold. Don’t rush to buy the dip.
7
·
--
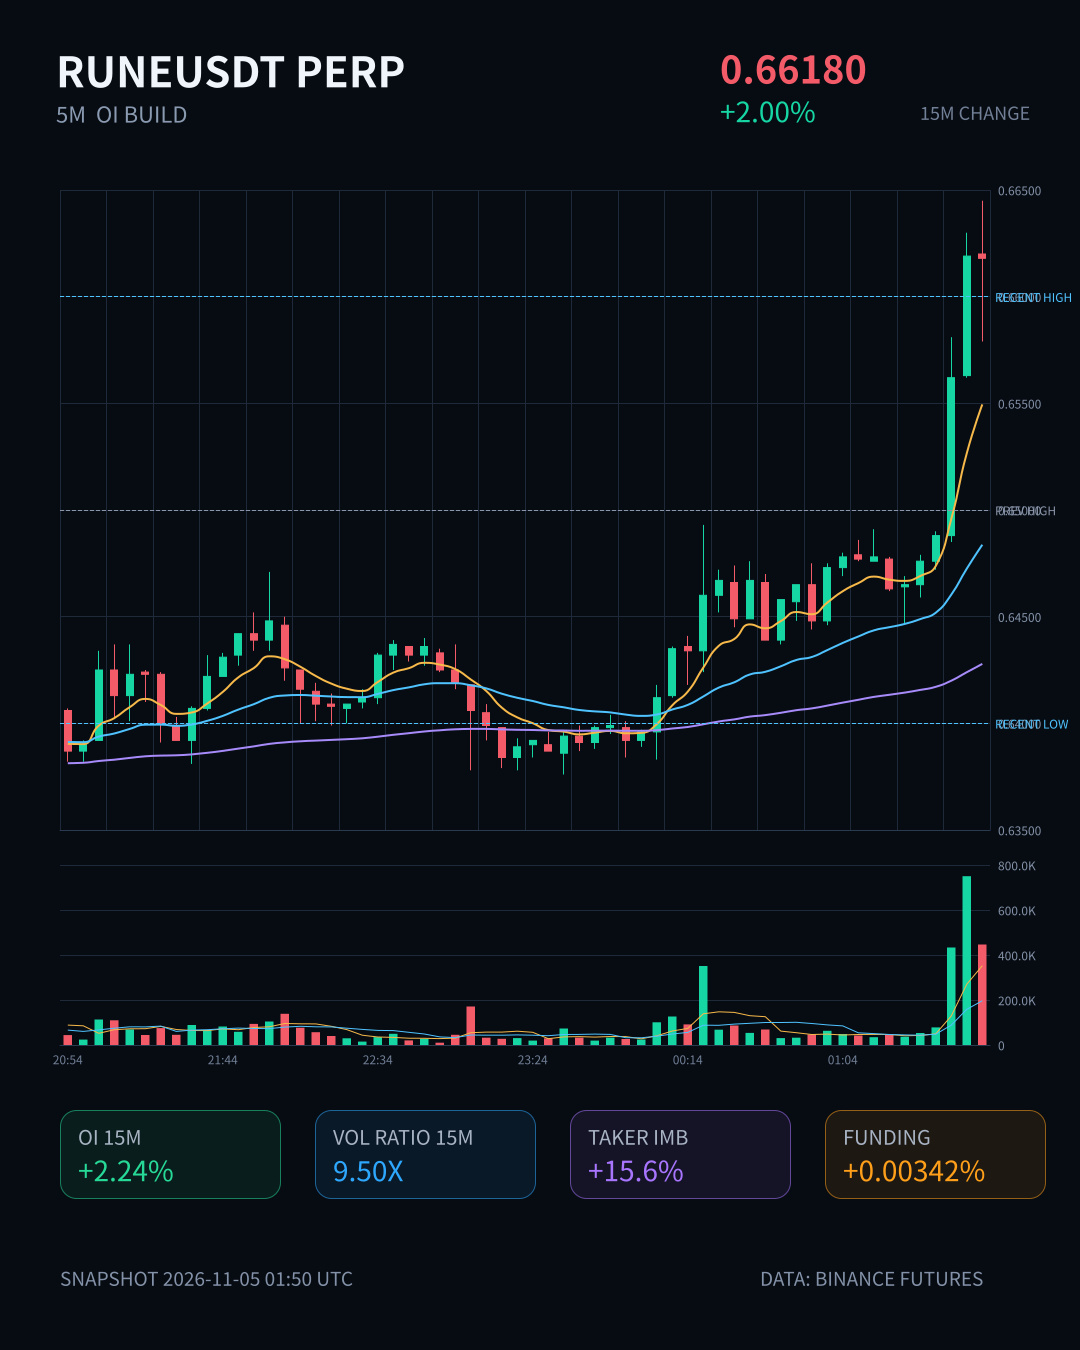
RUNE has been making moves over the past 15 minutes: its price is up 2%, while trading volume has surged to 9.5 times its usual level. OI has been building over both the 15-minute and 1-hour periods, with the combined notional change topping 600,000 U. Price up, open interest up—a classic sign of leveraged longs piling in, not just a hollow short squeeze. The aggressive trade imbalance is 15.6%, and the buy/sell ratio is 1.37, so buyers really are actively lifting offers.
The OI anomaly percentile is already at 95.2%, ranking #14 across the entire pool, while notional change ranks #29. That’s not a low level; it’s approaching the extreme end of its historical range. This setup looks good, but the faster leverage piles up, the harder the flush can be. If you’re chasing, be clear on whether you’re riding the trend or catching a falling knife—don’t wait for a pullback to realize your position is bigger than your conviction.
RUNE has been making moves over the past 15 minutes: its price is up 2%, while trading volume has surged to 9.5 times its usual level. OI has been building over both the 15-minute and 1-hour periods, with the combined notional change topping 600,000 U. Price up, open interest up—a classic sign of leveraged longs piling in, not just a hollow short squeeze. The aggressive trade imbalance is 15.6%, and the buy/sell ratio is 1.37, so buyers really are actively lifting offers.
The OI anomaly percentile is already at 95.2%, ranking #14 across the entire pool, while notional change ranks #29. That’s not a low level; it’s approaching the extreme end of its historical range. This setup looks good, but the faster leverage piles up, the harder the flush can be. If you’re chasing, be clear on whether you’re riding the trend or catching a falling knife—don’t wait for a pullback to realize your position is bigger than your conviction.
The OI anomaly percentile is already at 95.2%, ranking #14 across the entire pool, while notional change ranks #29. That’s not a low level; it’s approaching the extreme end of its historical range. This setup looks good, but the faster leverage piles up, the harder the flush can be. If you’re chasing, be clear on whether you’re riding the trend or catching a falling knife—don’t wait for a pullback to realize your position is bigger than your conviction.
31
·
--
$TRUMP This drop is pretty brutal: down 4.83% in just 15m, with volume hitting 5x normal levels. The key thing is that while price is falling, OI is rising—1h futures are up 3.02%, at the 99th percentile for unusual activity, ranking #29 across the whole pool. This structure looks more like new leveraged shorts entering than a simple long liquidation cascade.
The close has already fallen below the lows of the last 20 5m candles. Net aggressive trading volume is -20%, the buy/sell ratio is 0.67, and selling pressure is clear. Funding rates are still at a high level relative to recent readings; shorts are paying a hefty cost, but they’re still adding positions. 24h trading volume is 137M, and liquidity is sufficient. Now it’s a matter of whether this level can hold.
$TRUMP This drop is pretty brutal: down 4.83% in just 15m, with volume hitting 5x normal levels. The key thing is that while price is falling, OI is rising—1h futures are up 3.02%, at the 99th percentile for unusual activity, ranking #29 across the whole pool. This structure looks more like new leveraged shorts entering than a simple long liquidation cascade.
The close has already fallen below the lows of the last 20 5m candles. Net aggressive trading volume is -20%, the buy/sell ratio is 0.67, and selling pressure is clear. Funding rates are still at a high level relative to recent readings; shorts are paying a hefty cost, but they’re still adding positions. 24h trading volume is 137M, and liquidity is sufficient. Now it’s a matter of whether this level can hold.
The close has already fallen below the lows of the last 20 5m candles. Net aggressive trading volume is -20%, the buy/sell ratio is 0.67, and selling pressure is clear. Funding rates are still at a high level relative to recent readings; shorts are paying a hefty cost, but they’re still adding positions. 24h trading volume is 137M, and liquidity is sufficient. Now it’s a matter of whether this level can hold.
·
--
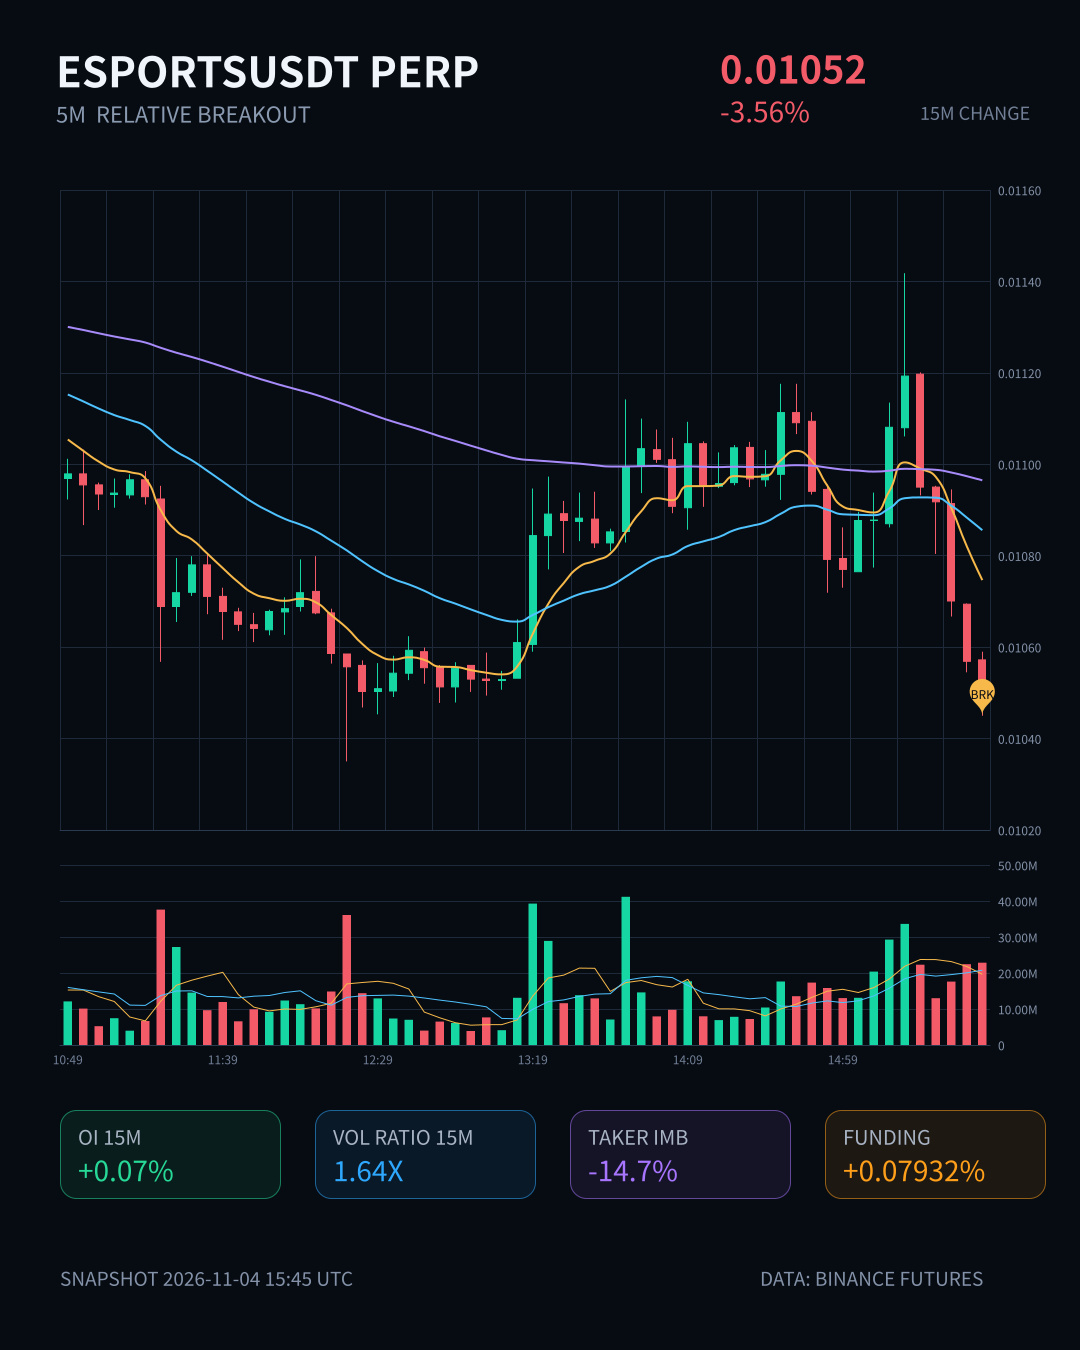
This move in $ESPORTS : down 3.56% over 15m, with volume rising to 1.64x, breaking straight below the lower bound of the 20-candle 5m range. The aggressive trade imbalance is -14.7%, and the buy/sell ratio is 0.74, clearly indicating that selling pressure is in control. OI notional change is -282K, but with price falling and OI showing signs of new leveraged shorts entering, the anomaly percentile across the entire pool is 90.1%, anomaly rank #34, and notional change rank #29. 24h trading volume of 41M is also not insignificant. It looks like shorts are actively adding positions, rather than this being simply longs closing out. Keep monitoring.
This move in $ESPORTS : down 3.56% over 15m, with volume rising to 1.64x, breaking straight below the lower bound of the 20-candle 5m range. The aggressive trade imbalance is -14.7%, and the buy/sell ratio is 0.74, clearly indicating that selling pressure is in control. OI notional change is -282K, but with price falling and OI showing signs of new leveraged shorts entering, the anomaly percentile across the entire pool is 90.1%, anomaly rank #34, and notional change rank #29. 24h trading volume of 41M is also not insignificant. It looks like shorts are actively adding positions, rather than this being simply longs closing out. Keep monitoring.
7

·
--
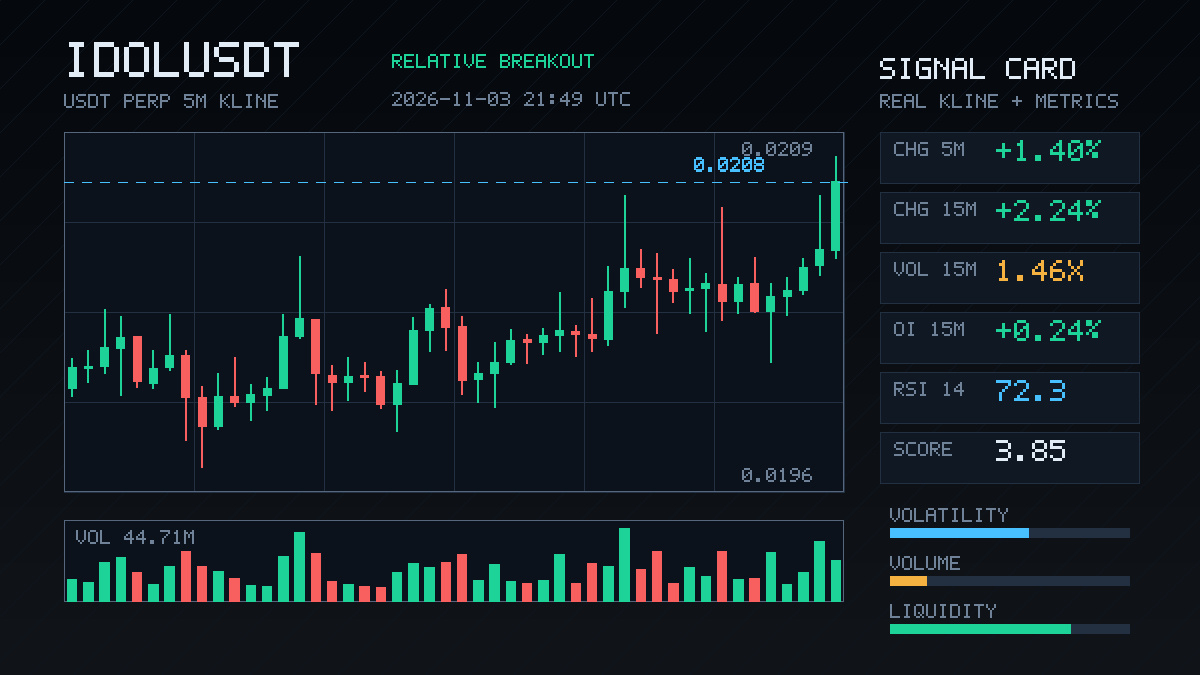
$IDOL Up 2.24% in 15 minutes, volume 1.46x, net aggressive buying +4.1%—looks like buyers are actively lifting offers. The key is that OI is rising in sync: +0.24% over 15m and +0.35% over 1h. Price up + open interest up points to new leveraged longs entering, rather than the usual hollow short covering.
The closing price has just broken above the range high of the last 20 five-minute candles. Notional change ranks #29 across the whole pool, and depth confirms the move, so this breakout doesn’t look like a fake-out. 24h trading volume is 182M; liquidity is ample. The 213K increase in notional isn’t huge, but it’s in the right direction.
Watch whether it can hold above this range high. Only then is it worth talking about continuation; if it can’t, it’s just a wick.
$IDOL Up 2.24% in 15 minutes, volume 1.46x, net aggressive buying +4.1%—looks like buyers are actively lifting offers. The key is that OI is rising in sync: +0.24% over 15m and +0.35% over 1h. Price up + open interest up points to new leveraged longs entering, rather than the usual hollow short covering.
The closing price has just broken above the range high of the last 20 five-minute candles. Notional change ranks #29 across the whole pool, and depth confirms the move, so this breakout doesn’t look like a fake-out. 24h trading volume is 182M; liquidity is ample. The 213K increase in notional isn’t huge, but it’s in the right direction.
Watch whether it can hold above this range high. Only then is it worth talking about continuation; if it can’t, it’s just a wick.
The closing price has just broken above the range high of the last 20 five-minute candles. Notional change ranks #29 across the whole pool, and depth confirms the move, so this breakout doesn’t look like a fake-out. 24h trading volume is 182M; liquidity is ample. The 213K increase in notional isn’t huge, but it’s in the right direction.
Watch whether it can hold above this range high. Only then is it worth talking about continuation; if it can’t, it’s just a wick.
3
·
--
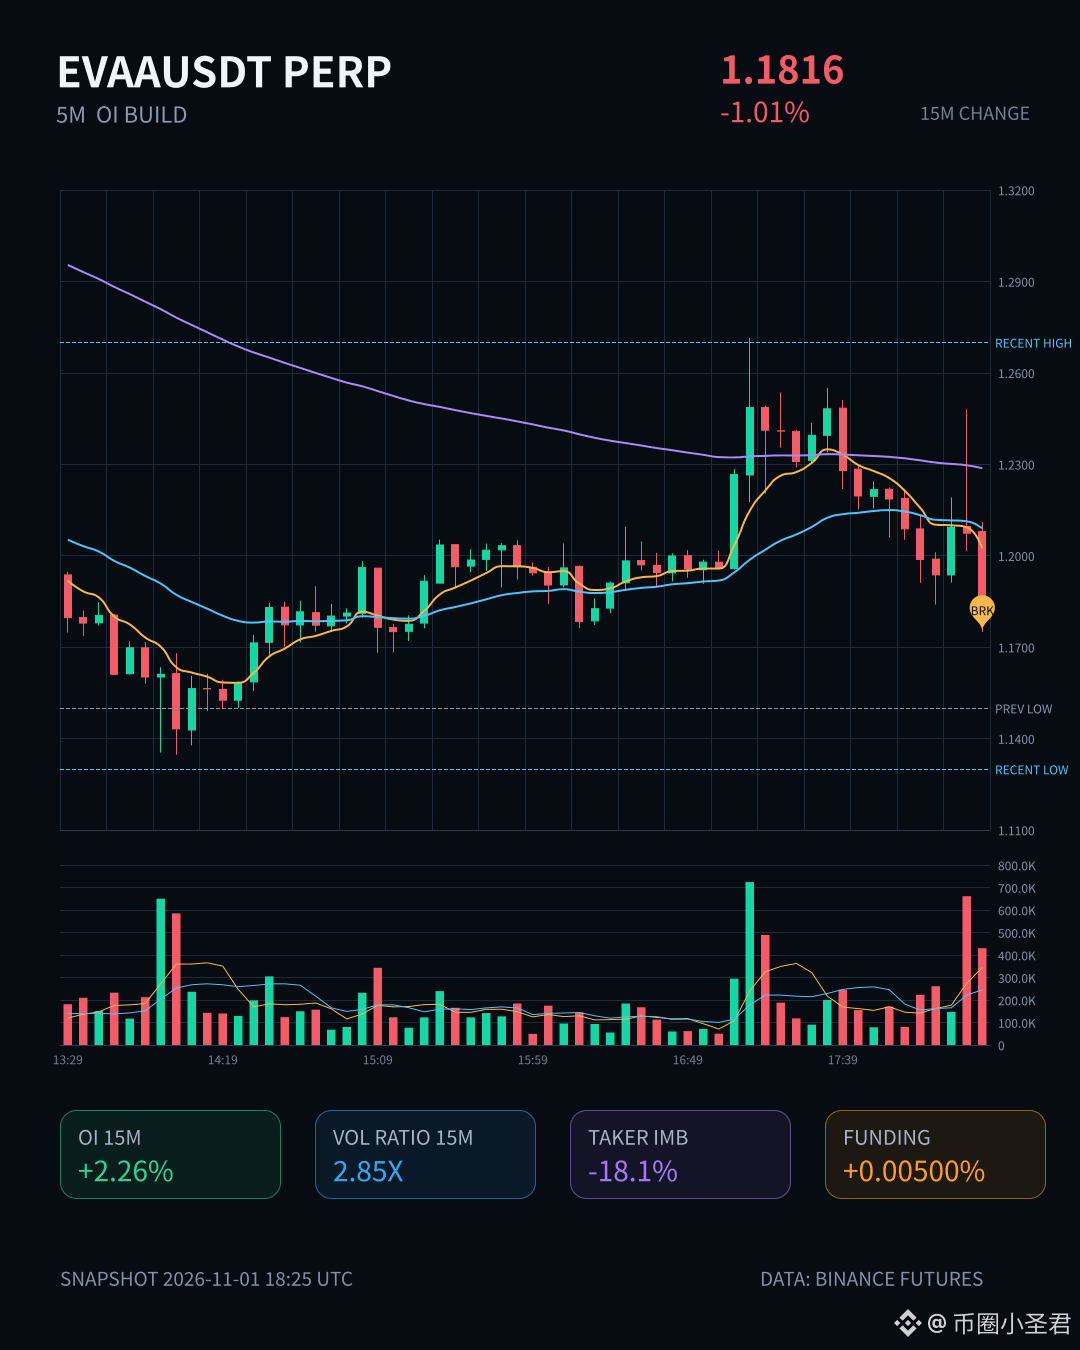
$EVAA This drop is interesting. The price is down 1%, which isn’t much, but OI is up 2.26% in 15m, volume has surged to 2.85x, the taker buy/sell delta is -18.1%, and the buy/sell ratio is 0.69—clearly, someone is adding leverage to short at this level rather than dumping spot. The change in notional across the entire pool ranks #29, with an anomaly percentile of 85.7%; both depth and volume confirm it’s not a fake move. 24h trading volume is 135 million, so liquidity is sufficient. The fact that shorts are willing to enter suggests they’re eyeing the bottom of the range. Now we’ll see whether the pressure continues or they get squeezed out. Either way, I’m not chasing shorts—I’ll wait until this wave of leveraged sentiment has played out.
$EVAA This drop is interesting. The price is down 1%, which isn’t much, but OI is up 2.26% in 15m, volume has surged to 2.85x, the taker buy/sell delta is -18.1%, and the buy/sell ratio is 0.69—clearly, someone is adding leverage to short at this level rather than dumping spot. The change in notional across the entire pool ranks #29, with an anomaly percentile of 85.7%; both depth and volume confirm it’s not a fake move. 24h trading volume is 135 million, so liquidity is sufficient. The fact that shorts are willing to enter suggests they’re eyeing the bottom of the range. Now we’ll see whether the pressure continues or they get squeezed out. Either way, I’m not chasing shorts—I’ll wait until this wave of leveraged sentiment has played out.
2
Log in to explore more content
Join global crypto users on Binance Square
⚡️ Get latest and useful information about crypto.
💬 Trusted by the world’s largest crypto exchange.
👍 Discover real insights from verified creators.
Email / Phone number
Trending Topics
1
#XRPDropsToTwoYearLowNear87Cents
0 views
5 Discussing
2
#BitcoinFallsBelow$57KToTwoYearLow
0 views
0 Discussing
3
#NvidiaLoses$2.7TrillionInMonthAndAHalf
82 views
18 Discussing
4
#CanBTCReboundAfterFallingBelow60K?
477,933 views
2,117 Discussing
5
#GlobalStocksFaceLongestLosingStreakSince2023
164,781 views
1,485 Discussing
6
#BlackRockIBITPostsRecord$541MSingleDayOutflow
7,371 views
47 Discussing
7
#AnthropicPlungesTowardIPOPriceonDay2
78,782 views
848 Discussing
8
#TwentyOneCapitalAdds172.25BTC
30,258 views
374 Discussing
9
#HKBillWouldExcludeTokenizedDepositsFromVirtualAssets
2,974 views
39 Discussing
10
#BNBDropsBelow540USDTWith8.46%DailyDecline
46,202 views
429 Discussing