
#60
60
4,564 views
77 Discussing
Hot
Latest

·
--
A 60% surge, but the most noteworthy detail is this—
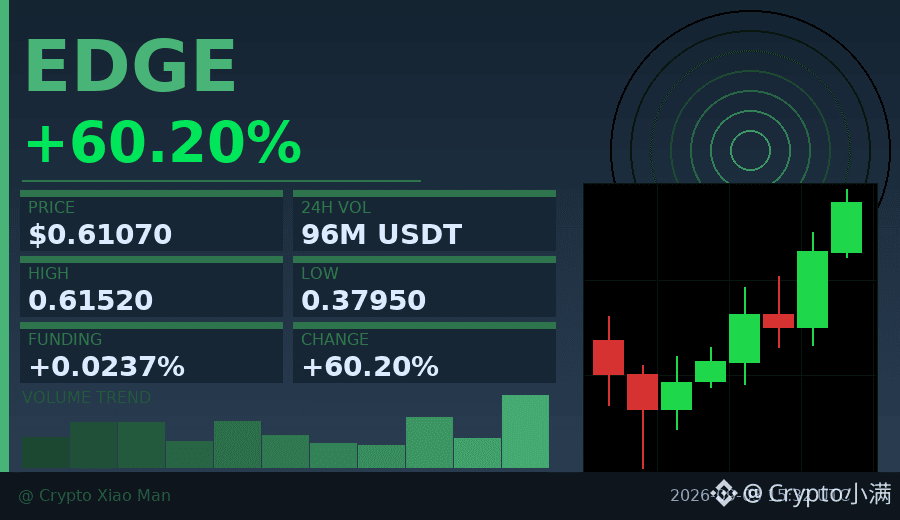
Today EDGE jumped from 0.38 all the way to 0.61, with volume surging to 96.50 million USDT. The key point is that the hourly chart has printed three consecutive bullish candles. Every pullback has buyers stepping in, which suggests this isn’t just a simple wick.
The funding rate of 0.0237% is still fairly mild. The long-to-short ratio is 57% vs 43%—longs are slightly ahead, but not crowded. The biggest fear with this kind of move is everyone charging in at once; the good news is there’s still room.
I just checked the recent posts—this coin hasn’t really been discussed yet. After breaking the 0.55 resistance, the next thing to watch is whether it can hold above the 0.60 psychological, round-number level.
$EDGE #强势突破 #60%涨幅
Click the small card below to quickly view the chart👇
A 60% surge, but the most noteworthy detail is this—
Today EDGE jumped from 0.38 all the way to 0.61, with volume surging to 96.50 million USDT. The key point is that the hourly chart has printed three consecutive bullish candles. Every pullback has buyers stepping in, which suggests this isn’t just a simple wick.
The funding rate of 0.0237% is still fairly mild. The long-to-short ratio is 57% vs 43%—longs are slightly ahead, but not crowded. The biggest fear with this kind of move is everyone charging in at once; the good news is there’s still room.
I just checked the recent posts—this coin hasn’t really been discussed yet. After breaking the 0.55 resistance, the next thing to watch is whether it can hold above the 0.60 psychological, round-number level.
$EDGE #强势突破 #60%涨幅
Click the small card below to quickly view the chart👇
Today EDGE jumped from 0.38 all the way to 0.61, with volume surging to 96.50 million USDT. The key point is that the hourly chart has printed three consecutive bullish candles. Every pullback has buyers stepping in, which suggests this isn’t just a simple wick.
The funding rate of 0.0237% is still fairly mild. The long-to-short ratio is 57% vs 43%—longs are slightly ahead, but not crowded. The biggest fear with this kind of move is everyone charging in at once; the good news is there’s still room.
I just checked the recent posts—this coin hasn’t really been discussed yet. After breaking the 0.55 resistance, the next thing to watch is whether it can hold above the 0.60 psychological, round-number level.
$EDGE #强势突破 #60%涨幅
Click the small card below to quickly view the chart👇
197
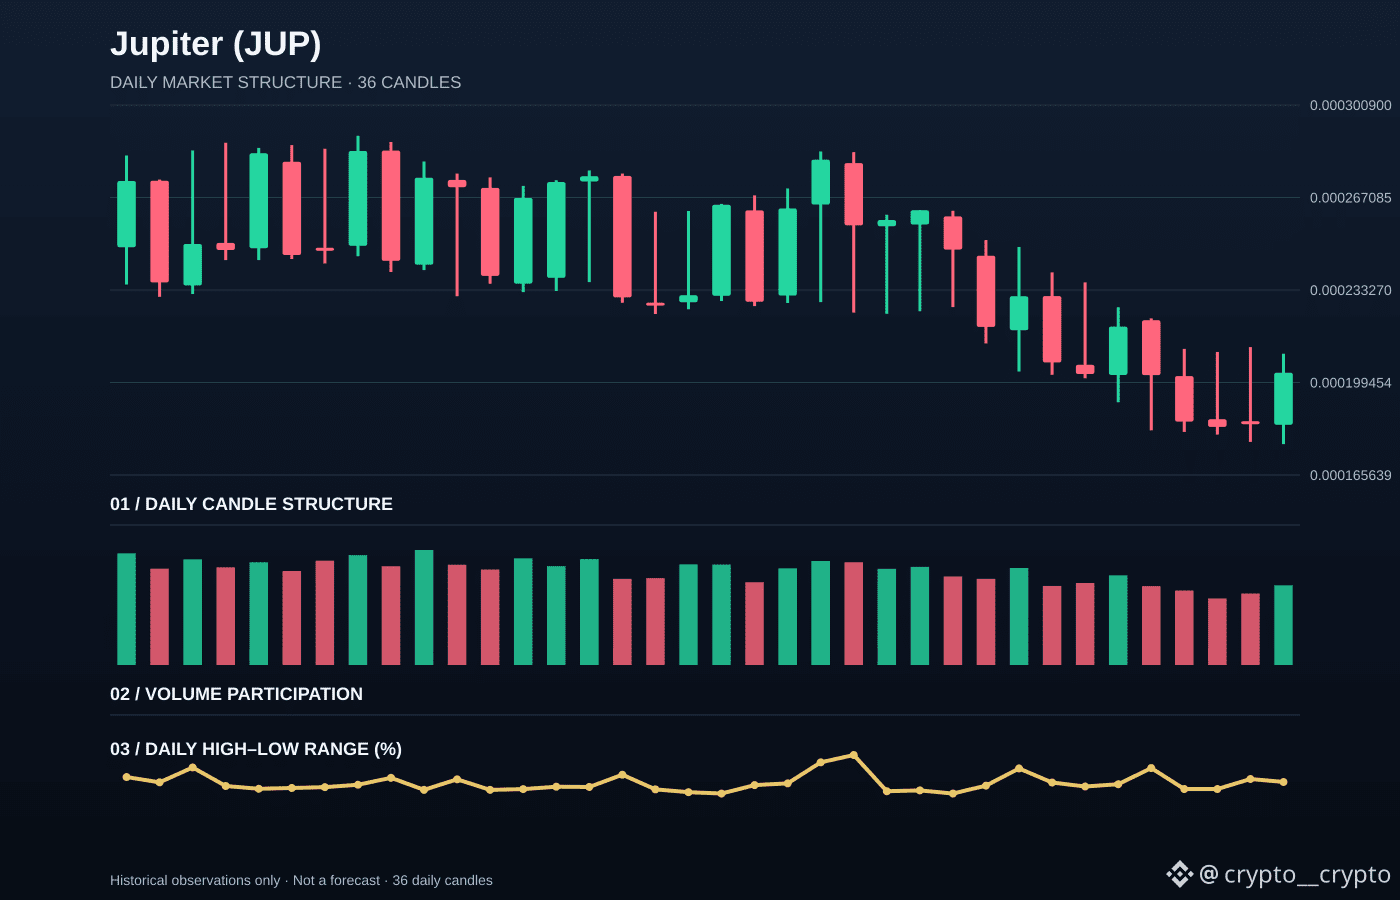
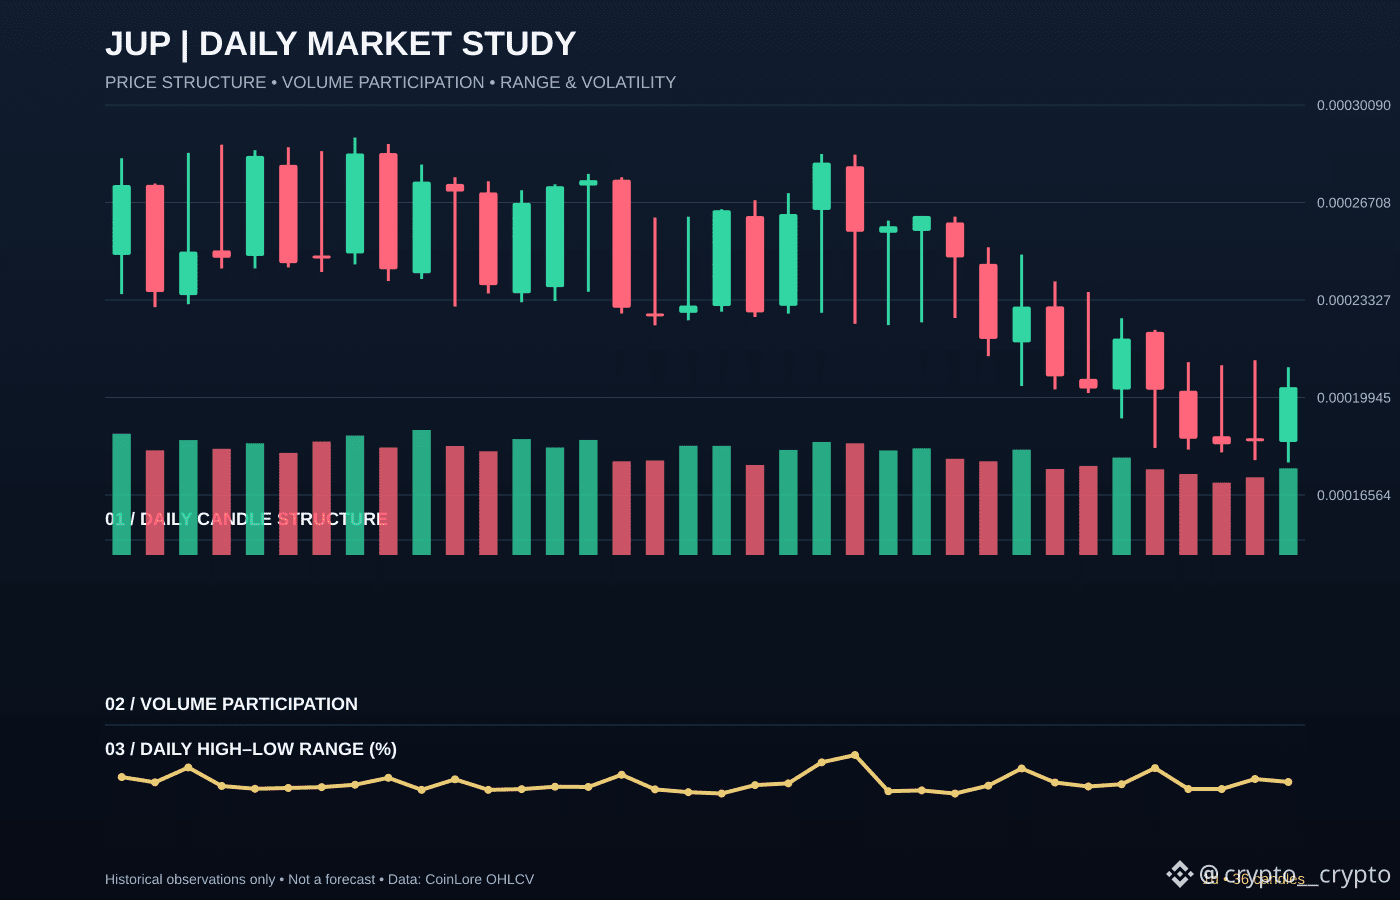
Jupiter (JUP) advanced 9.81% between the last two available daily closes. The detail I am watching is how that move finished, not just the headline percentage.
The daily close sat in the upper part of its range, showing buyers retained more of the session move. A follow-through close would strengthen the case that demand is persisting; a quick reversal would weaken it.
For Jupiter, the useful question is whether participation expands if price attempts to recover the latest session range. The latest candle covered 18.68% from low to high, with OHLC: 0.00018401425 / 0.00020995226 / 0.00017691083 / 0.00020305464.
For context, the 24-hour market move is +4.84%, while reported turnover is approximately 36.24M USD. CoinMarketCap rank: #60. Benchmark snapshot: BTC +0.90% · ETH +2.50%.
What level would change your view on JUP—the latest low, the latest high, or the previous close?
Data note: CMC listings market quote and CoinLore daily candles. These are observed market figures, not a price prediction or a trade instruction.
$JUP $BTC $ETH
Jupiter (JUP) advanced 9.81% between the last two available daily closes. The detail I am watching is how that move finished, not just the headline percentage.
The daily close sat in the upper part of its range, showing buyers retained more of the session move. A follow-through close would strengthen the case that demand is persisting; a quick reversal would weaken it.
For Jupiter, the useful question is whether participation expands if price attempts to recover the latest session range. The latest candle covered 18.68% from low to high, with OHLC: 0.00018401425 / 0.00020995226 / 0.00017691083 / 0.00020305464.
For context, the 24-hour market move is +4.84%, while reported turnover is approximately 36.24M USD. CoinMarketCap rank: #60. Benchmark snapshot: BTC +0.90% · ETH +2.50%.
What level would change your view on JUP—the latest low, the latest high, or the previous close?
Data note: CMC listings market quote and CoinLore daily candles. These are observed market figures, not a price prediction or a trade instruction.
$JUP $BTC $ETH
The daily close sat in the upper part of its range, showing buyers retained more of the session move. A follow-through close would strengthen the case that demand is persisting; a quick reversal would weaken it.
For Jupiter, the useful question is whether participation expands if price attempts to recover the latest session range. The latest candle covered 18.68% from low to high, with OHLC: 0.00018401425 / 0.00020995226 / 0.00017691083 / 0.00020305464.
For context, the 24-hour market move is +4.84%, while reported turnover is approximately 36.24M USD. CoinMarketCap rank: #60. Benchmark snapshot: BTC +0.90% · ETH +2.50%.
What level would change your view on JUP—the latest low, the latest high, or the previous close?
Data note: CMC listings market quote and CoinLore daily candles. These are observed market figures, not a price prediction or a trade instruction.
$JUP $BTC $ETH
1
83

🚀 RAY (RAY/USDT) – Is a Major Bullish Breakout Coming?
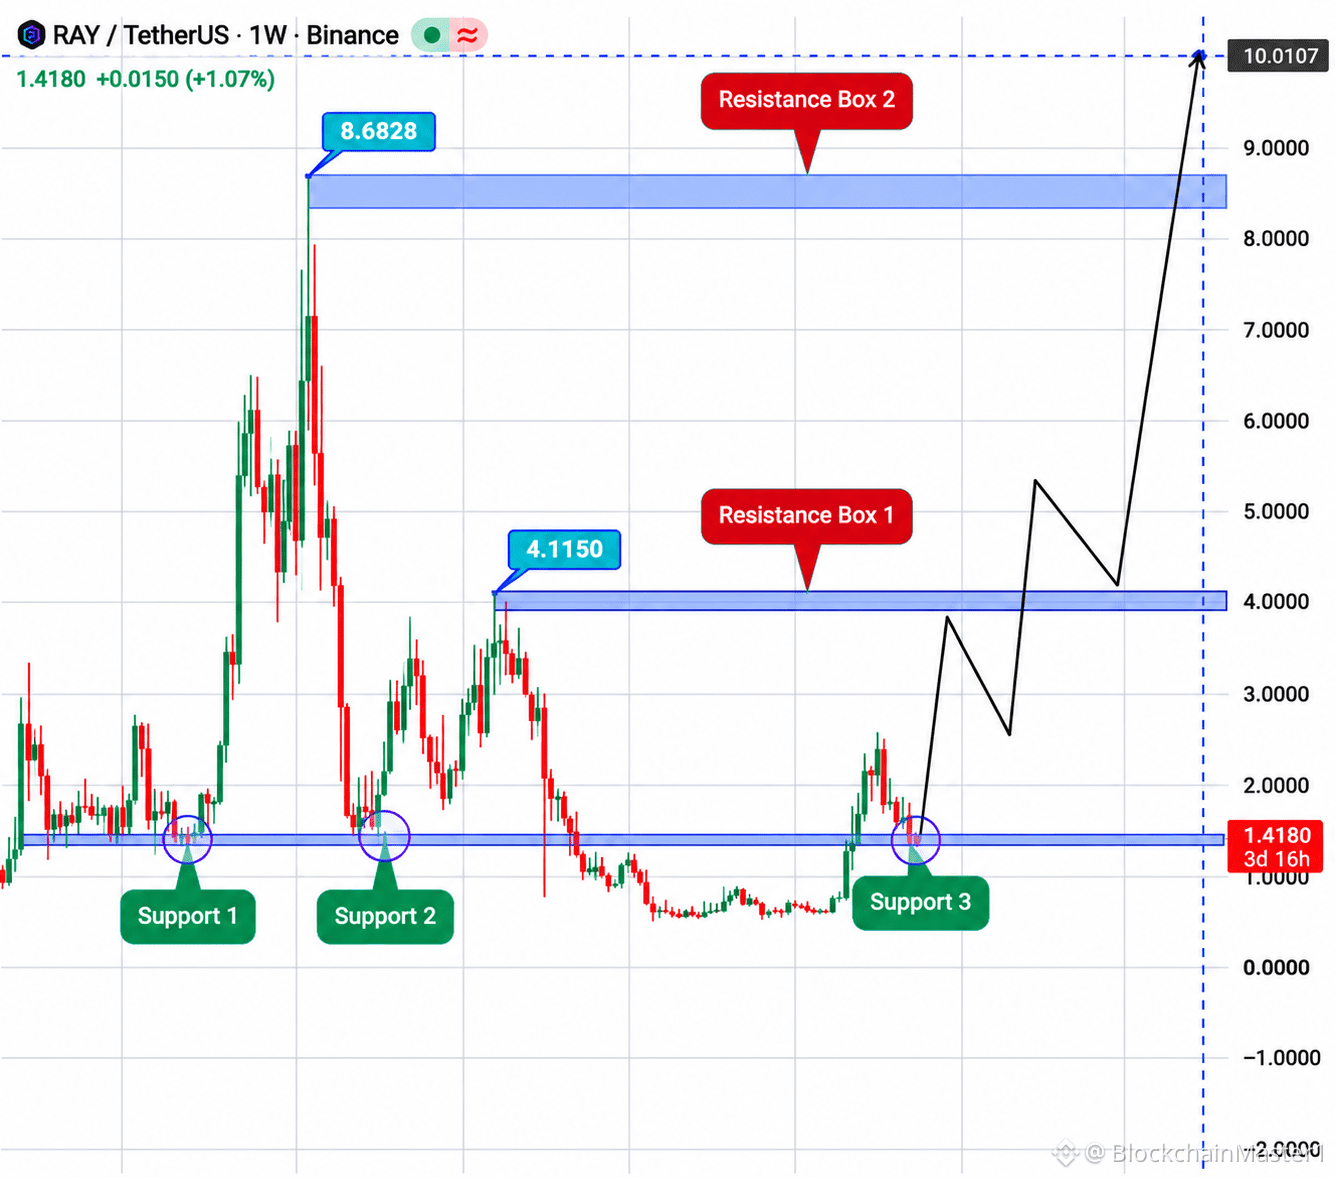
Raydium is showing an interesting long-term technical setup. RAY is currently trading around $1.4161, down approximately 0.89%. Despite recent market weakness, the weekly chart suggests price is testing an important support zone that could become a potential accumulation area.
📊 Market Overview:
Current Price: $1.4161
Market Cap: $784.77 Million
Fully Diluted Market Cap: $784.77 Million
24H Volume: $22.82 Million
Market Rank: #60 Circulating Supply: 555 Million RAY
🔥 Technical Outlook:
The weekly chart shows a long-term symmetrical consolidation structure. RAY is holding near the important $1.30–$1.45 support region. A successful bounce could trigger a recovery toward the first major resistance around $4.00–$4.12. A confirmed breakout could open the door for a stronger bullish move.
🎯 Potential Entry Zone: $1.30–$1.45
🎯 Take Profit Targets:
TP1: $4.00
TP2: $5.00
TP3: $8.60
TP4: $10.00
🛑 Risk: A sustained breakdown below support could invalidate the bullish setup.
⚡ Bullish Confirmation: Strong weekly closes above resistance with increasing volume.
Could RAY reach $10 in the next major bull run?
#RAY #Raydium #CryptoAnalysis $RAY $SENT $LUNC
{spot}(LUNCUSDT)
🚀 RAY (RAY/USDT) – Is a Major Bullish Breakout Coming?
Raydium is showing an interesting long-term technical setup. RAY is currently trading around $1.4161, down approximately 0.89%. Despite recent market weakness, the weekly chart suggests price is testing an important support zone that could become a potential accumulation area.
📊 Market Overview:
Current Price: $1.4161
Market Cap: $784.77 Million
Fully Diluted Market Cap: $784.77 Million
24H Volume: $22.82 Million
Market Rank: #60 Circulating Supply: 555 Million RAY
🔥 Technical Outlook:
The weekly chart shows a long-term symmetrical consolidation structure. RAY is holding near the important $1.30–$1.45 support region. A successful bounce could trigger a recovery toward the first major resistance around $4.00–$4.12. A confirmed breakout could open the door for a stronger bullish move.
🎯 Potential Entry Zone: $1.30–$1.45
🎯 Take Profit Targets:
TP1: $4.00
TP2: $5.00
TP3: $8.60
TP4: $10.00
🛑 Risk: A sustained breakdown below support could invalidate the bullish setup.
⚡ Bullish Confirmation: Strong weekly closes above resistance with increasing volume.
Could RAY reach $10 in the next major bull run?
#RAY #Raydium #CryptoAnalysis $RAY $SENT $LUNC
Raydium is showing an interesting long-term technical setup. RAY is currently trading around $1.4161, down approximately 0.89%. Despite recent market weakness, the weekly chart suggests price is testing an important support zone that could become a potential accumulation area.
📊 Market Overview:
Current Price: $1.4161
Market Cap: $784.77 Million
Fully Diluted Market Cap: $784.77 Million
24H Volume: $22.82 Million
Market Rank: #60 Circulating Supply: 555 Million RAY
🔥 Technical Outlook:
The weekly chart shows a long-term symmetrical consolidation structure. RAY is holding near the important $1.30–$1.45 support region. A successful bounce could trigger a recovery toward the first major resistance around $4.00–$4.12. A confirmed breakout could open the door for a stronger bullish move.
🎯 Potential Entry Zone: $1.30–$1.45
🎯 Take Profit Targets:
TP1: $4.00
TP2: $5.00
TP3: $8.60
TP4: $10.00
🛑 Risk: A sustained breakdown below support could invalidate the bullish setup.
⚡ Bullish Confirmation: Strong weekly closes above resistance with increasing volume.
Could RAY reach $10 in the next major bull run?
#RAY #Raydium #CryptoAnalysis $RAY $SENT $LUNC

128
Today's Jupiter snapshot is about follow-through: the latest close moved up 9.81% versus the prior daily close.
Price: $0.26550773 | 24h: +4.40% | 24h volume: $32.22M.
CMC currently lists it at rank #60.
CANDLE DETAIL — Open $0.00018401425, high $0.00020995226, low $0.00017691083, close $0.00020305464. The session range is 18.68%; the close closed in the upper part of its range.
STRUCTURE — The latest close is -18.42% versus the first candle open in this displayed sample. The latest candle changed +9.81% from the previous close.
READ-THROUGH — Buyers retained a relatively strong closing position in this candle, but the next session still needs to confirm it. Volume is context, not proof of direction.
Which level matters more to you on JUP: the latest high or the latest low? Explain your read.
Data: CoinMarketCap market snapshot and CoinLore daily OHLCV. Educational market commentary; not a forecast or financial advice.
$JUP #JUP #CryptoMarket
Today's Jupiter snapshot is about follow-through: the latest close moved up 9.81% versus the prior daily close.
Price: $0.26550773 | 24h: +4.40% | 24h volume: $32.22M.
CMC currently lists it at rank #60.
CANDLE DETAIL — Open $0.00018401425, high $0.00020995226, low $0.00017691083, close $0.00020305464. The session range is 18.68%; the close closed in the upper part of its range.
STRUCTURE — The latest close is -18.42% versus the first candle open in this displayed sample. The latest candle changed +9.81% from the previous close.
READ-THROUGH — Buyers retained a relatively strong closing position in this candle, but the next session still needs to confirm it. Volume is context, not proof of direction.
Which level matters more to you on JUP: the latest high or the latest low? Explain your read.
Data: CoinMarketCap market snapshot and CoinLore daily OHLCV. Educational market commentary; not a forecast or financial advice.
$JUP #JUP #CryptoMarket
Price: $0.26550773 | 24h: +4.40% | 24h volume: $32.22M.
CMC currently lists it at rank #60.
CANDLE DETAIL — Open $0.00018401425, high $0.00020995226, low $0.00017691083, close $0.00020305464. The session range is 18.68%; the close closed in the upper part of its range.
STRUCTURE — The latest close is -18.42% versus the first candle open in this displayed sample. The latest candle changed +9.81% from the previous close.
READ-THROUGH — Buyers retained a relatively strong closing position in this candle, but the next session still needs to confirm it. Volume is context, not proof of direction.
Which level matters more to you on JUP: the latest high or the latest low? Explain your read.
Data: CoinMarketCap market snapshot and CoinLore daily OHLCV. Educational market commentary; not a forecast or financial advice.
$JUP #JUP #CryptoMarket
44
Arbitrum is trading lower over the last 24 hours in this market snapshot.
CMC rank #60. The quoted price is $0.12794738, with a 24-hour change of -1.68%.
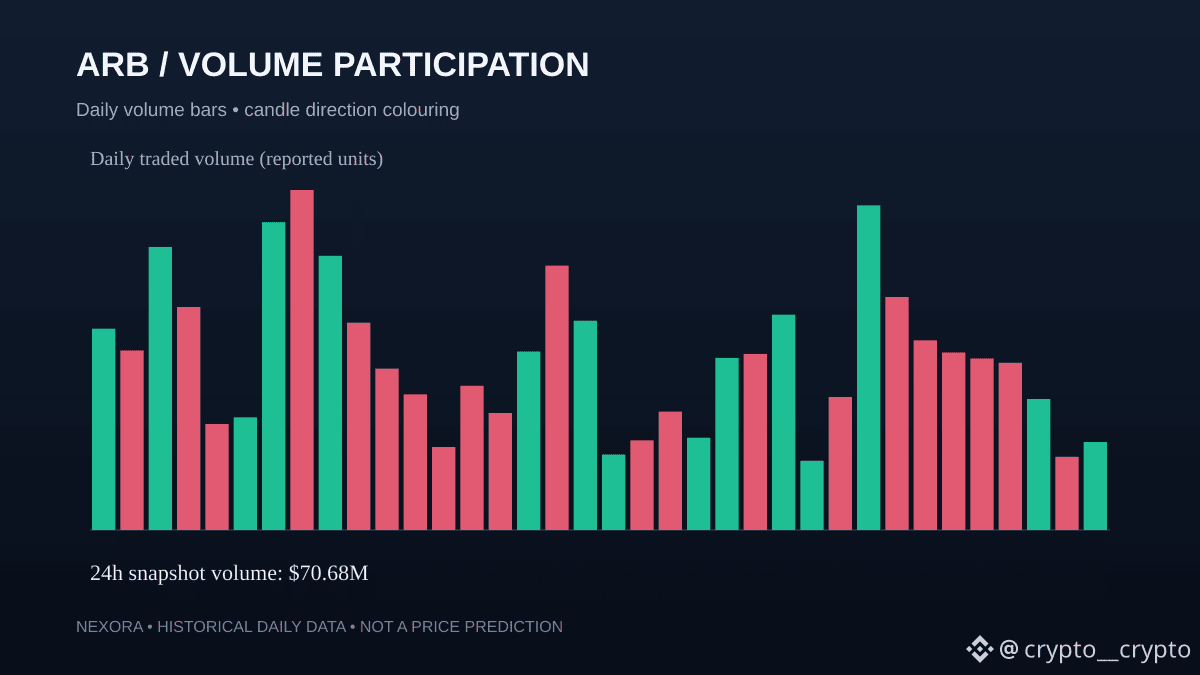
Reported 24-hour volume is $70.68M and market capitalization is $895.33M.
The current move is relatively contained; the daily structure matters more than the headline percentage.
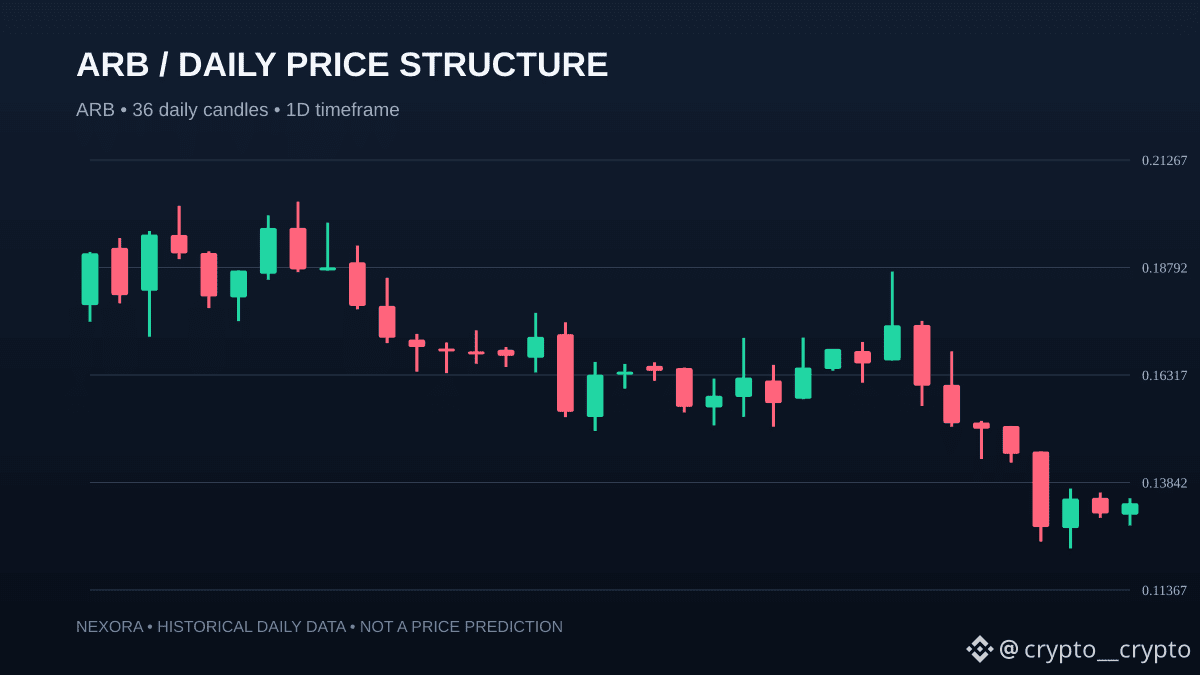
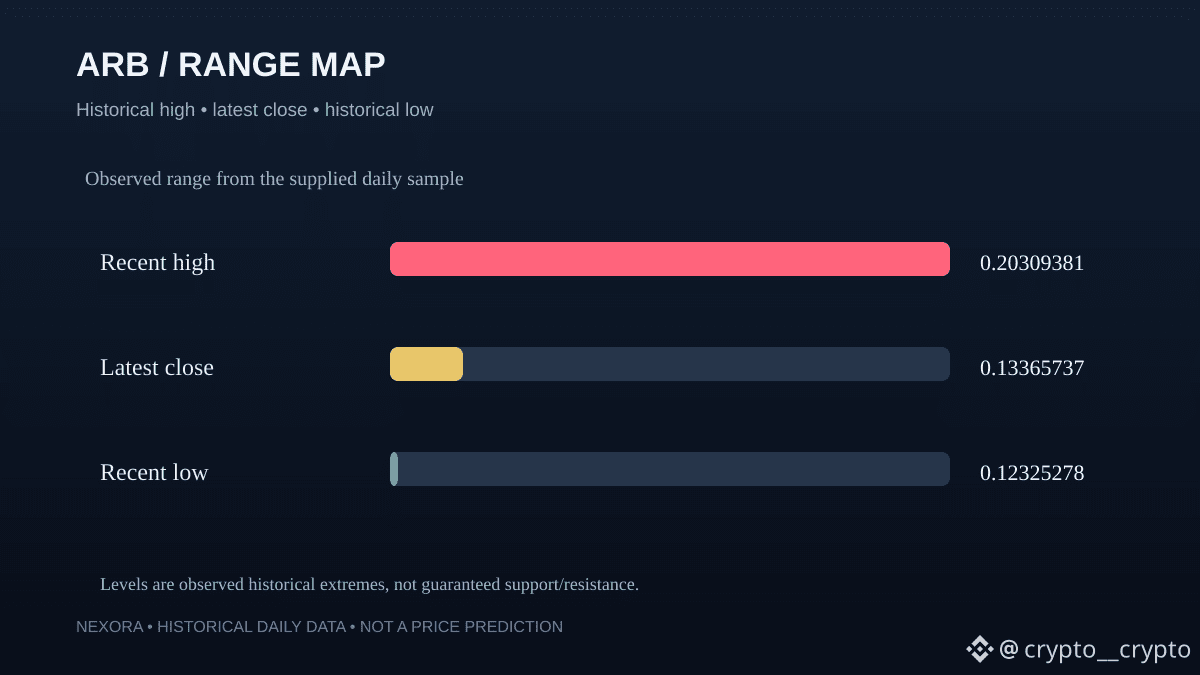
The latest daily candle ranges from $0.12851077 to $0.13477342 (4.87%). Its close changed +1.81% versus the previous candle.
Across the displayed sample, the latest close is 25.44% below the first candle's open.
What to watch next: whether the next daily close confirms or rejects this range, and whether volume expands with the move. These observations describe the supplied data, not a prediction.
Market data: CoinMarketCap snapshot; daily OHLCV: CoinLore.
Research commentary only; not financial advice.
$ARB #Crypto #NEXORA
Arbitrum is trading lower over the last 24 hours in this market snapshot.
CMC rank #60. The quoted price is $0.12794738, with a 24-hour change of -1.68%.
Reported 24-hour volume is $70.68M and market capitalization is $895.33M.
The current move is relatively contained; the daily structure matters more than the headline percentage.
The latest daily candle ranges from $0.12851077 to $0.13477342 (4.87%). Its close changed +1.81% versus the previous candle.
Across the displayed sample, the latest close is 25.44% below the first candle's open.
What to watch next: whether the next daily close confirms or rejects this range, and whether volume expands with the move. These observations describe the supplied data, not a prediction.
Market data: CoinMarketCap snapshot; daily OHLCV: CoinLore.
Research commentary only; not financial advice.
$ARB #Crypto #NEXORA
CMC rank #60. The quoted price is $0.12794738, with a 24-hour change of -1.68%.
Reported 24-hour volume is $70.68M and market capitalization is $895.33M.
The current move is relatively contained; the daily structure matters more than the headline percentage.
The latest daily candle ranges from $0.12851077 to $0.13477342 (4.87%). Its close changed +1.81% versus the previous candle.
Across the displayed sample, the latest close is 25.44% below the first candle's open.
What to watch next: whether the next daily close confirms or rejects this range, and whether volume expands with the move. These observations describe the supplied data, not a prediction.
Market data: CoinMarketCap snapshot; daily OHLCV: CoinLore.
Research commentary only; not financial advice.
$ARB #Crypto #NEXORA
154
NEXORA // THE STRUCTURE CHECK
━━━━━━━━━━━━━━━━━━━━
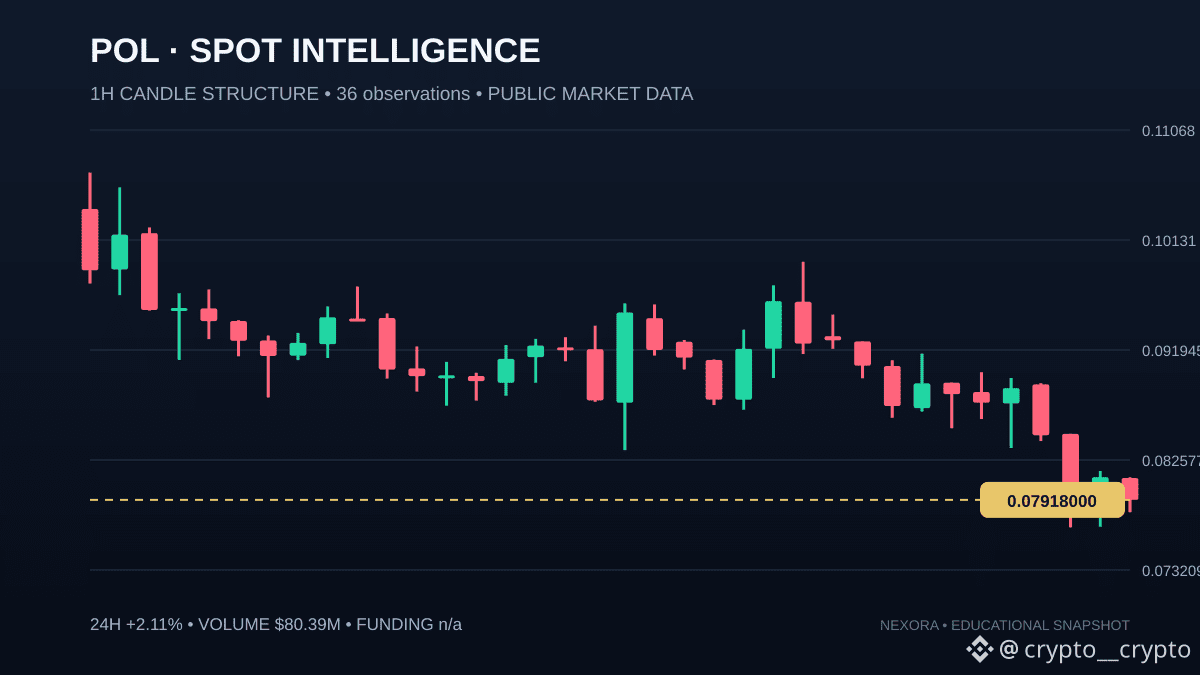
Polygon (prev. MATIC) / POL • SPOT MARKET
PRICE $0.081163231
24H MOVE +2.11%
24H VOLUME $80.39M
MARKET CAP $864.50M
MARKET RANK #60
LATEST DAILY RANGE 3.81%
A single percentage change is not a complete market read. Compare the latest daily candle with the broader sequence.
CHART READ: The latest daily close is below the first candle's open across the displayed sample. This is historical context, not a forecast.
DATA: CoinMarketCap market snapshot + CoinLore daily OHLCV. Captured 18 Nov 2026, 00:44 IST.
Research snapshot only — not a trade signal or financial advice.
#NEXORA #CryptoMarket #POL
NEXORA // THE STRUCTURE CHECK
━━━━━━━━━━━━━━━━━━━━
Polygon (prev. MATIC) / POL • SPOT MARKET
PRICE $0.081163231
24H MOVE +2.11%
24H VOLUME $80.39M
MARKET CAP $864.50M
MARKET RANK #60
LATEST DAILY RANGE 3.81%
A single percentage change is not a complete market read. Compare the latest daily candle with the broader sequence.
CHART READ: The latest daily close is below the first candle's open across the displayed sample. This is historical context, not a forecast.
DATA: CoinMarketCap market snapshot + CoinLore daily OHLCV. Captured 18 Nov 2026, 00:44 IST.
Research snapshot only — not a trade signal or financial advice.
#NEXORA #CryptoMarket #POL
━━━━━━━━━━━━━━━━━━━━
Polygon (prev. MATIC) / POL • SPOT MARKET
PRICE $0.081163231
24H MOVE +2.11%
24H VOLUME $80.39M
MARKET CAP $864.50M
MARKET RANK #60
LATEST DAILY RANGE 3.81%
A single percentage change is not a complete market read. Compare the latest daily candle with the broader sequence.
CHART READ: The latest daily close is below the first candle's open across the displayed sample. This is historical context, not a forecast.
DATA: CoinMarketCap market snapshot + CoinLore daily OHLCV. Captured 18 Nov 2026, 00:44 IST.
Research snapshot only — not a trade signal or financial advice.
#NEXORA #CryptoMarket #POL
44

·
--
🎮 RENDER: THE DECENTRALIZED NVIDIA?
{future}(RENDERUSDT)
VERIFIABLE DATA:
✅ Price: $1.40 (+3.72%)
✅ Market cap: $771M
✅ Founder spoke at NVIDIA GTC
✅ Decentralized GPU for AI/3D
✅ Ranking #60
THE QUESTION:
If NVIDIA is worth $3 TRILLION...
How much is RENDER worth with just $771M?
SETUP:
🎯 Entry: $1.35-$1.45
🛑 Stop: $1.15 (-18%)
🎯 Target: $3.00 (+115%)
#RenderNetwork #CTRARK
🎮 RENDER: THE DECENTRALIZED NVIDIA?
VERIFIABLE DATA:
✅ Price: $1.40 (+3.72%)
✅ Market cap: $771M
✅ Founder spoke at NVIDIA GTC
✅ Decentralized GPU for AI/3D
✅ Ranking #60
THE QUESTION:
If NVIDIA is worth $3 TRILLION...
How much is RENDER worth with just $771M?
SETUP:
🎯 Entry: $1.35-$1.45
🛑 Stop: $1.15 (-18%)
🎯 Target: $3.00 (+115%)
#RenderNetwork #CTRARK
VERIFIABLE DATA:
✅ Price: $1.40 (+3.72%)
✅ Market cap: $771M
✅ Founder spoke at NVIDIA GTC
✅ Decentralized GPU for AI/3D
✅ Ranking #60
THE QUESTION:
If NVIDIA is worth $3 TRILLION...
How much is RENDER worth with just $771M?
SETUP:
🎯 Entry: $1.35-$1.45
🛑 Stop: $1.15 (-18%)
🎯 Target: $3.00 (+115%)
#RenderNetwork #CTRARK

1
304

·
--
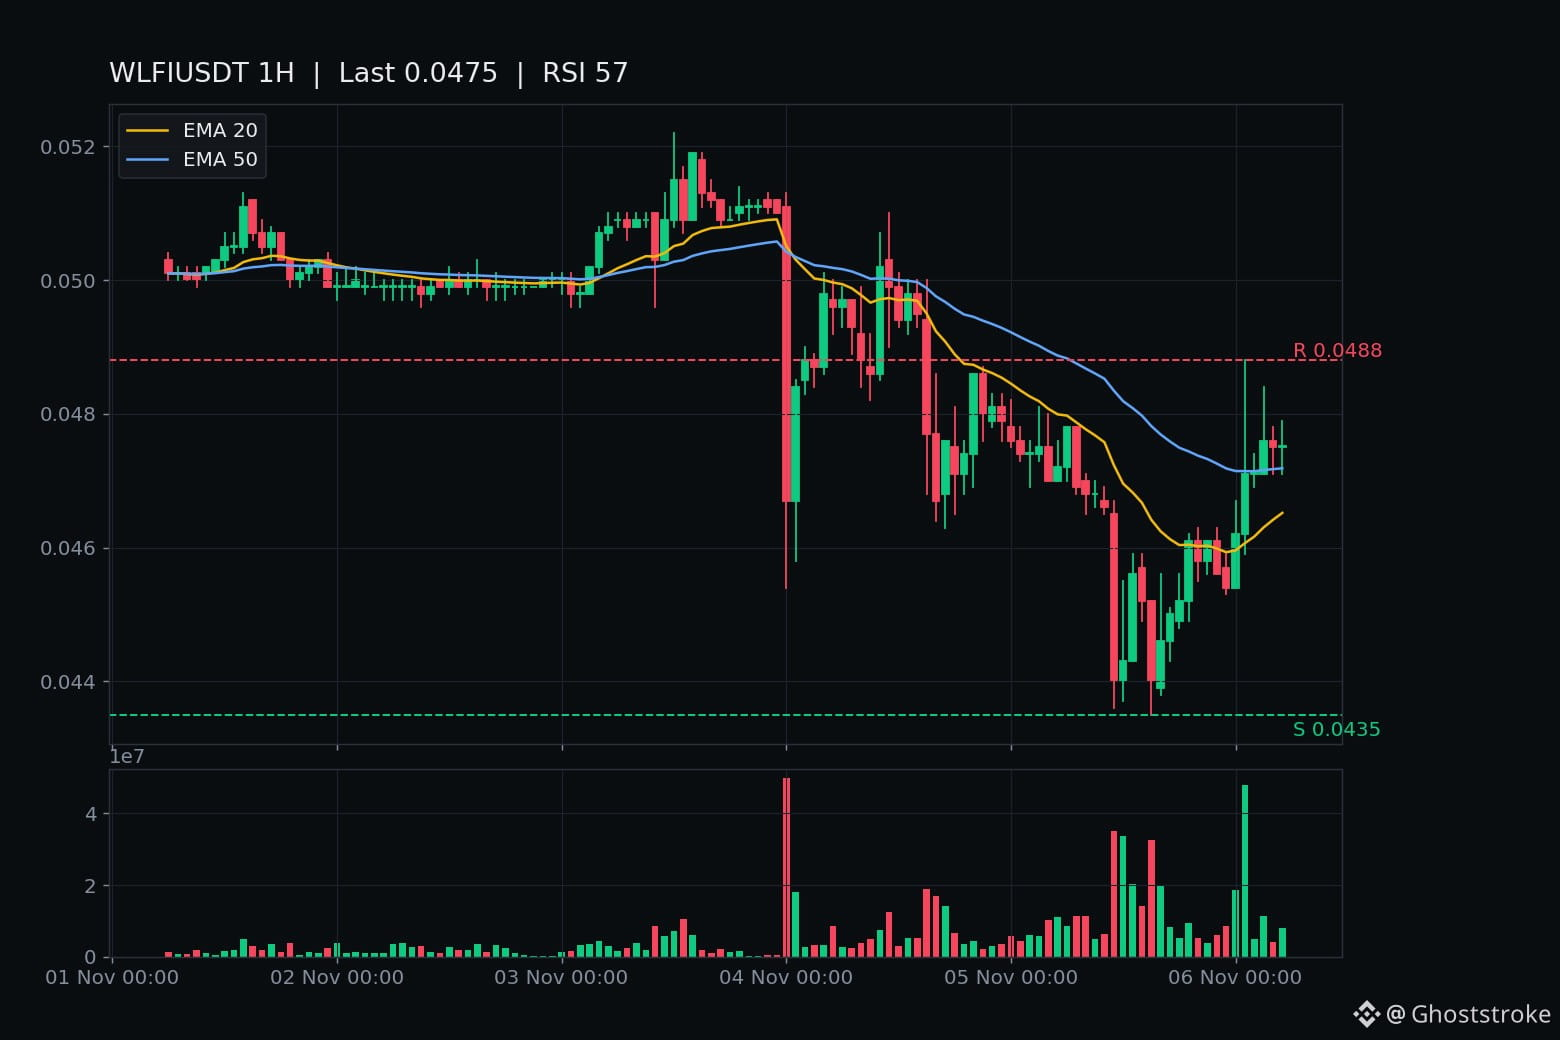
$WLFI just did what the flush said it wouldn't — six straight hourly closes back above $0.0454.
Yesterday's 11:00 UTC flush bar closed $0.0440 on 35M tokens, the day's heaviest, and took out the $0.0454 line. The rest of the day was a whipsaw — a second close under it, a reclaim, then chop $0.0440–$0.0461, and the 23:00 close printed exactly $0.0454, on the line.
Overnight it stopped arguing. 00:00 closed $0.0462, then the 01:00 hour tagged $0.0488 on 48M tokens — the biggest WLFI bar since the flush itself — and closed $0.0471. The next four closes held the line: $0.0471, $0.0476, $0.0475, $0.0475. Live $0.0474, -0.4% on the day, $15.5M Binance volume.
The chart agrees it's a reclaim, not a wick: RSI 57, price back above EMA20 $0.0465 and EMA50 $0.0472. Rank #60, $1.50B, still -86% off its $0.33 ATH — and the $0.0435 low it printed yesterday sits essentially on the all-time low, so the floor it just climbed off is the floor there is.
No fresh headline behind it — the newest WLFI news is still Nov 3–4, the election-night slide and the Sun sanctions motion. Tape, not news. And the board is still bleeding: BTC $75,700, -5.9%. A reclaim into a red board is the part worth watching, and the part that can unwind fastest.
The line that matters now is $0.0495 — the old shelf from election night. An hourly close above it reclaims the shelf itself. One closed hour back below $0.0454 unwrites this chapter; a closed hour below $0.0436 breaks the all-time low.
Not a call, either way. The 07:00 UTC close (12:30 IST) decides: does $0.0495 fall, or does $0.0454 give way first?
$WLFI just did what the flush said it wouldn't — six straight hourly closes back above $0.0454.
Yesterday's 11:00 UTC flush bar closed $0.0440 on 35M tokens, the day's heaviest, and took out the $0.0454 line. The rest of the day was a whipsaw — a second close under it, a reclaim, then chop $0.0440–$0.0461, and the 23:00 close printed exactly $0.0454, on the line.
Overnight it stopped arguing. 00:00 closed $0.0462, then the 01:00 hour tagged $0.0488 on 48M tokens — the biggest WLFI bar since the flush itself — and closed $0.0471. The next four closes held the line: $0.0471, $0.0476, $0.0475, $0.0475. Live $0.0474, -0.4% on the day, $15.5M Binance volume.
The chart agrees it's a reclaim, not a wick: RSI 57, price back above EMA20 $0.0465 and EMA50 $0.0472. Rank #60, $1.50B, still -86% off its $0.33 ATH — and the $0.0435 low it printed yesterday sits essentially on the all-time low, so the floor it just climbed off is the floor there is.
No fresh headline behind it — the newest WLFI news is still Nov 3–4, the election-night slide and the Sun sanctions motion. Tape, not news. And the board is still bleeding: BTC $75,700, -5.9%. A reclaim into a red board is the part worth watching, and the part that can unwind fastest.
The line that matters now is $0.0495 — the old shelf from election night. An hourly close above it reclaims the shelf itself. One closed hour back below $0.0454 unwrites this chapter; a closed hour below $0.0436 breaks the all-time low.
Not a call, either way. The 07:00 UTC close (12:30 IST) decides: does $0.0495 fall, or does $0.0454 give way first?
Yesterday's 11:00 UTC flush bar closed $0.0440 on 35M tokens, the day's heaviest, and took out the $0.0454 line. The rest of the day was a whipsaw — a second close under it, a reclaim, then chop $0.0440–$0.0461, and the 23:00 close printed exactly $0.0454, on the line.
Overnight it stopped arguing. 00:00 closed $0.0462, then the 01:00 hour tagged $0.0488 on 48M tokens — the biggest WLFI bar since the flush itself — and closed $0.0471. The next four closes held the line: $0.0471, $0.0476, $0.0475, $0.0475. Live $0.0474, -0.4% on the day, $15.5M Binance volume.
The chart agrees it's a reclaim, not a wick: RSI 57, price back above EMA20 $0.0465 and EMA50 $0.0472. Rank #60, $1.50B, still -86% off its $0.33 ATH — and the $0.0435 low it printed yesterday sits essentially on the all-time low, so the floor it just climbed off is the floor there is.
No fresh headline behind it — the newest WLFI news is still Nov 3–4, the election-night slide and the Sun sanctions motion. Tape, not news. And the board is still bleeding: BTC $75,700, -5.9%. A reclaim into a red board is the part worth watching, and the part that can unwind fastest.
The line that matters now is $0.0495 — the old shelf from election night. An hourly close above it reclaims the shelf itself. One closed hour back below $0.0454 unwrites this chapter; a closed hour below $0.0436 breaks the all-time low.
Not a call, either way. The 07:00 UTC close (12:30 IST) decides: does $0.0495 fall, or does $0.0454 give way first?
2

·
--
$ETC just posted a 6.29% weekly gain to $7.38, and the only headline actually about the coin is that its community runs the twitter account by committee.
that's literally how it works. tweets get proposed in github, reviewed for quality and relevance, then posted from a shared account. community call #59 already happened, #60 is booked for friday, same crowd showing up week after week to talk core-geth updates and a rebrand.
most coins this size don't have anyone left in the room. ETC still does, and that's the actual reason i'd bet on this dip getting bought before i'd bet on any headline moving it. no catalyst here, just people who never left.
right now $ETC trades at $7.39, off the 24h high of $7.43 and well above the 24h low of $7.09. if it holds $7.09, i think it grinds back toward that $7.43 high by the weekend. if it loses $7.09, i'm wrong on this and anyone who bought the bounce is holding a loss into a coin with no news catalyst to bail them out.
holding $7.09 or losing it?
follow me for more calls like this.
$ETC just posted a 6.29% weekly gain to $7.38, and the only headline actually about the coin is that its community runs the twitter account by committee.
that's literally how it works. tweets get proposed in github, reviewed for quality and relevance, then posted from a shared account. community call #59 already happened, #60 is booked for friday, same crowd showing up week after week to talk core-geth updates and a rebrand.
most coins this size don't have anyone left in the room. ETC still does, and that's the actual reason i'd bet on this dip getting bought before i'd bet on any headline moving it. no catalyst here, just people who never left.
right now $ETC trades at $7.39, off the 24h high of $7.43 and well above the 24h low of $7.09. if it holds $7.09, i think it grinds back toward that $7.43 high by the weekend. if it loses $7.09, i'm wrong on this and anyone who bought the bounce is holding a loss into a coin with no news catalyst to bail them out.
holding $7.09 or losing it?
follow me for more calls like this.
that's literally how it works. tweets get proposed in github, reviewed for quality and relevance, then posted from a shared account. community call #59 already happened, #60 is booked for friday, same crowd showing up week after week to talk core-geth updates and a rebrand.
most coins this size don't have anyone left in the room. ETC still does, and that's the actual reason i'd bet on this dip getting bought before i'd bet on any headline moving it. no catalyst here, just people who never left.
right now $ETC trades at $7.39, off the 24h high of $7.43 and well above the 24h low of $7.09. if it holds $7.09, i think it grinds back toward that $7.43 high by the weekend. if it loses $7.09, i'm wrong on this and anyone who bought the bounce is holding a loss into a coin with no news catalyst to bail them out.
holding $7.09 or losing it?
follow me for more calls like this.

111

·
--
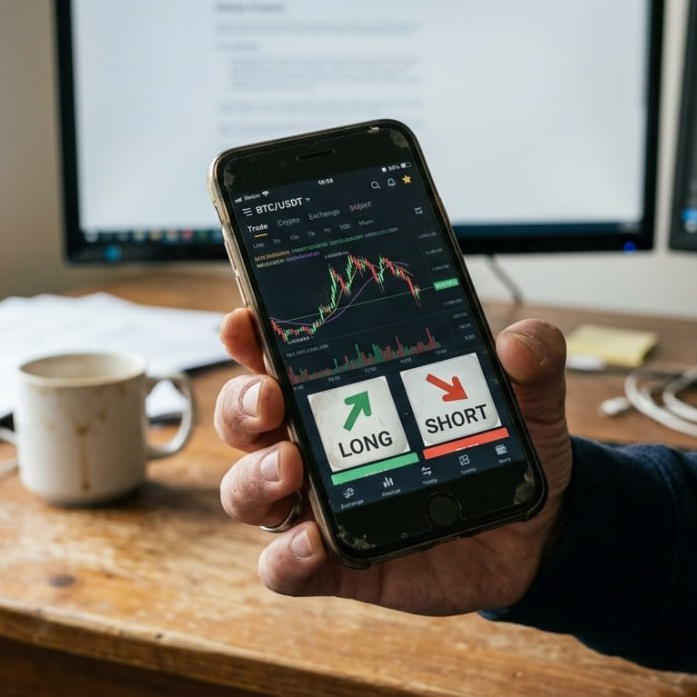
🎭 1 hour ago, Nine-Nine said "Leverage flip-flop script", 1 hour later, BTC shorts suddenly capitulated.
Just checked my phone, the entire market played a joke on me in 1 hour.
1 hour ago (14:41), I just finished writing about Nine-Nine, the theme was "Leverage funds flip-flopping within 2 hours" — BTC shorts ran scared 2 hours ago, then doubled down 2 hours later, SOL funding reversed deepening 1.48x, the most dramatic expression of "I don't believe it".
As a result, 1 hour later (15:44), the script flipped 180 degrees again:
❶ BTC funding flipped from -0.00001224% to +0.00000425% in 1 hour, turning from negative to positive. Translation: Leverage shorts actively closed their positions in 1 hour, "I don't believe it" turned into "I'm out first".
❷ However, ETH funding deepened by 15% (-0.00010253%, one of the deepest 4 levels), SOL funding deepened by 24% (-0.00023273%, the deepest in history!) — ETH and SOL shorts not only didn't close, but also crazily added more shorts.
❸ Price barely moved in 1 hour: BTC $62,154.90 (-0.01%) / ETH $1,610.51 (-0.23%) / BNB $588.89 (+0.02%) / SOL $64.82 (-0.09%). But the funding differentiation in 1 hour is the most dramatic since the weekend: BTC flat + ETH/SOL up, leverage funds are operating on a "BTC retreat + ETH/SOL surge" three-line strategy.
❹ BNB funding at 0% for the 8th consecutive day. The story I told a week ago about "being abandoned = being protected" continues to stabilize.
❺ FNG 12 EXTREME FEAR for the 8th consecutive day. Prices flat in 1 hour, sentiment also unchanged, "the market is immune to rebounds" = "the market is also immune to sideways movement".
I got slapped in the face 2 hours ago, slapped again 1 hour ago, now I've learned my lesson — the weekend funding script must be re-read on an hourly basis, any judgment made 30 minutes ago could be counter-trend, leverage funds themselves don’t even know the direction, why should I decide for them?
DCA 60th buy at 15:57, deducted 13 minutes later, BTC $62,154.90 = I don't care how you leverage plays out, I just follow the rhythm for deductions. The logic of 30 years of dollar-cost averaging has never been about "betting on the right script", but rather "not betting on the script".
5 controversial questions:
❶ BTC funding flipped from negative to positive in 1 hour = Leverage shorts capitulated OR just a technical closure (to avoid weekend volatility at midnight)?
❷ ETH funding deepened by 15% + SOL funding deepened by 24% = Is the showdown for mainstream coin shorts happening in ETH and SOL where they are also trapped and can only add more?
❸ SOL funding at -0.00023273% = the 4th deepest historical negative = Are SOL shorts the most stubborn OR is SOL the most shorted asset?
❹ BNB funding at 0% for 8 consecutive days = "being abandoned = being protected" OR is BNB being structurally marginalized?
❺ DCA #60 15:57 13 minutes later deducted, BTC $62,154.90 = Rebound top OR rebound continuation?
🎭 1 hour ago, Nine-Nine said "Leverage flip-flop script", 1 hour later, BTC shorts suddenly capitulated.
Just checked my phone, the entire market played a joke on me in 1 hour.
1 hour ago (14:41), I just finished writing about Nine-Nine, the theme was "Leverage funds flip-flopping within 2 hours" — BTC shorts ran scared 2 hours ago, then doubled down 2 hours later, SOL funding reversed deepening 1.48x, the most dramatic expression of "I don't believe it".
As a result, 1 hour later (15:44), the script flipped 180 degrees again:
❶ BTC funding flipped from -0.00001224% to +0.00000425% in 1 hour, turning from negative to positive. Translation: Leverage shorts actively closed their positions in 1 hour, "I don't believe it" turned into "I'm out first".
❷ However, ETH funding deepened by 15% (-0.00010253%, one of the deepest 4 levels), SOL funding deepened by 24% (-0.00023273%, the deepest in history!) — ETH and SOL shorts not only didn't close, but also crazily added more shorts.
❸ Price barely moved in 1 hour: BTC $62,154.90 (-0.01%) / ETH $1,610.51 (-0.23%) / BNB $588.89 (+0.02%) / SOL $64.82 (-0.09%). But the funding differentiation in 1 hour is the most dramatic since the weekend: BTC flat + ETH/SOL up, leverage funds are operating on a "BTC retreat + ETH/SOL surge" three-line strategy.
❹ BNB funding at 0% for the 8th consecutive day. The story I told a week ago about "being abandoned = being protected" continues to stabilize.
❺ FNG 12 EXTREME FEAR for the 8th consecutive day. Prices flat in 1 hour, sentiment also unchanged, "the market is immune to rebounds" = "the market is also immune to sideways movement".
I got slapped in the face 2 hours ago, slapped again 1 hour ago, now I've learned my lesson — the weekend funding script must be re-read on an hourly basis, any judgment made 30 minutes ago could be counter-trend, leverage funds themselves don’t even know the direction, why should I decide for them?
DCA 60th buy at 15:57, deducted 13 minutes later, BTC $62,154.90 = I don't care how you leverage plays out, I just follow the rhythm for deductions. The logic of 30 years of dollar-cost averaging has never been about "betting on the right script", but rather "not betting on the script".
5 controversial questions:
❶ BTC funding flipped from negative to positive in 1 hour = Leverage shorts capitulated OR just a technical closure (to avoid weekend volatility at midnight)?
❷ ETH funding deepened by 15% + SOL funding deepened by 24% = Is the showdown for mainstream coin shorts happening in ETH and SOL where they are also trapped and can only add more?
❸ SOL funding at -0.00023273% = the 4th deepest historical negative = Are SOL shorts the most stubborn OR is SOL the most shorted asset?
❹ BNB funding at 0% for 8 consecutive days = "being abandoned = being protected" OR is BNB being structurally marginalized?
❺ DCA #60 15:57 13 minutes later deducted, BTC $62,154.90 = Rebound top OR rebound continuation?
Just checked my phone, the entire market played a joke on me in 1 hour.
1 hour ago (14:41), I just finished writing about Nine-Nine, the theme was "Leverage funds flip-flopping within 2 hours" — BTC shorts ran scared 2 hours ago, then doubled down 2 hours later, SOL funding reversed deepening 1.48x, the most dramatic expression of "I don't believe it".
As a result, 1 hour later (15:44), the script flipped 180 degrees again:
❶ BTC funding flipped from -0.00001224% to +0.00000425% in 1 hour, turning from negative to positive. Translation: Leverage shorts actively closed their positions in 1 hour, "I don't believe it" turned into "I'm out first".
❷ However, ETH funding deepened by 15% (-0.00010253%, one of the deepest 4 levels), SOL funding deepened by 24% (-0.00023273%, the deepest in history!) — ETH and SOL shorts not only didn't close, but also crazily added more shorts.
❸ Price barely moved in 1 hour: BTC $62,154.90 (-0.01%) / ETH $1,610.51 (-0.23%) / BNB $588.89 (+0.02%) / SOL $64.82 (-0.09%). But the funding differentiation in 1 hour is the most dramatic since the weekend: BTC flat + ETH/SOL up, leverage funds are operating on a "BTC retreat + ETH/SOL surge" three-line strategy.
❹ BNB funding at 0% for the 8th consecutive day. The story I told a week ago about "being abandoned = being protected" continues to stabilize.
❺ FNG 12 EXTREME FEAR for the 8th consecutive day. Prices flat in 1 hour, sentiment also unchanged, "the market is immune to rebounds" = "the market is also immune to sideways movement".
I got slapped in the face 2 hours ago, slapped again 1 hour ago, now I've learned my lesson — the weekend funding script must be re-read on an hourly basis, any judgment made 30 minutes ago could be counter-trend, leverage funds themselves don’t even know the direction, why should I decide for them?
DCA 60th buy at 15:57, deducted 13 minutes later, BTC $62,154.90 = I don't care how you leverage plays out, I just follow the rhythm for deductions. The logic of 30 years of dollar-cost averaging has never been about "betting on the right script", but rather "not betting on the script".
5 controversial questions:
❶ BTC funding flipped from negative to positive in 1 hour = Leverage shorts capitulated OR just a technical closure (to avoid weekend volatility at midnight)?
❷ ETH funding deepened by 15% + SOL funding deepened by 24% = Is the showdown for mainstream coin shorts happening in ETH and SOL where they are also trapped and can only add more?
❸ SOL funding at -0.00023273% = the 4th deepest historical negative = Are SOL shorts the most stubborn OR is SOL the most shorted asset?
❹ BNB funding at 0% for 8 consecutive days = "being abandoned = being protected" OR is BNB being structurally marginalized?
❺ DCA #60 15:57 13 minutes later deducted, BTC $62,154.90 = Rebound top OR rebound continuation?
489
·
--
$BASED $VELVET $LINK
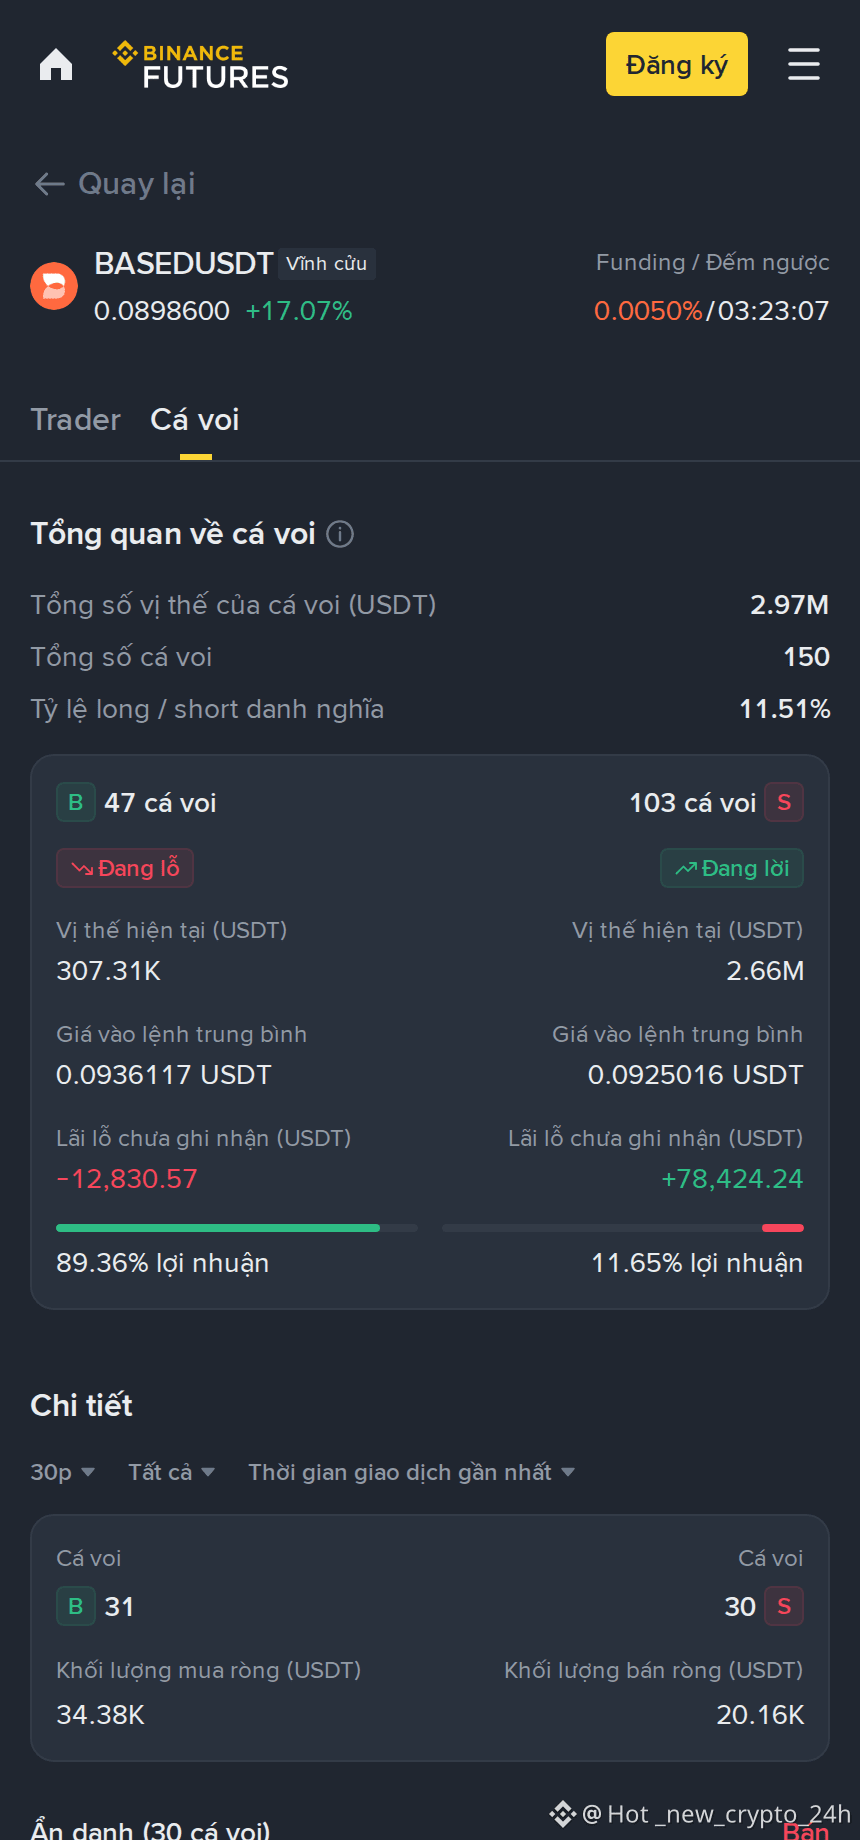
Whale Radar #60
$BASED just entered the watch zone.
The +17.01% figure is making the watchlist shine brighter than usual.
Whales may be quiet, but this segment is anything but sleepy.
Tomorrow we’ll dive back into some market segments to see what's unfolding.
$BASED $VELVET $LINK
Whale Radar #60
$BASED just entered the watch zone.
The +17.01% figure is making the watchlist shine brighter than usual.
Whales may be quiet, but this segment is anything but sleepy.
Tomorrow we’ll dive back into some market segments to see what's unfolding.
Whale Radar #60
$BASED just entered the watch zone.
The +17.01% figure is making the watchlist shine brighter than usual.
Whales may be quiet, but this segment is anything but sleepy.
Tomorrow we’ll dive back into some market segments to see what's unfolding.
352
·
--
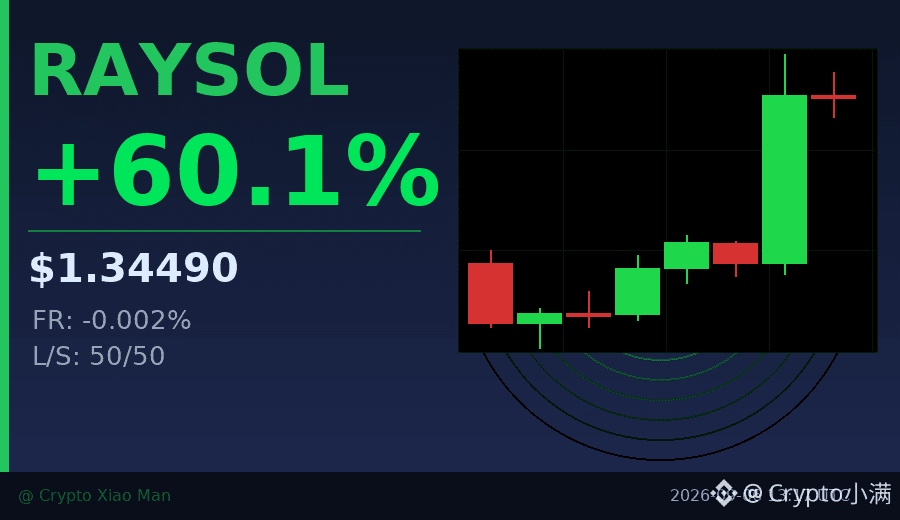
60% increase, but the funding rate is negative—what does that mean?
RAYSOL went from 0.83 to 1.39 today, with a trading volume of 180 million USDT.
Looks strong, right? But take a closer look: funding rate -0.00247%, long/short ratio 50/50.
Big players are using the rebound to distribute, while retail traders are chasing.
The overall trend strengthened within 8 hours, but the last candlestick started to see declining volume.
I’ve seen this kind of divergence too many times—
there may still be some short-term momentum, but don’t chase it; wait for a pullback.
$RAYSOL #资金费率背离 #60%
Click the small card below to quickly view the market👇
60% increase, but the funding rate is negative—what does that mean?
RAYSOL went from 0.83 to 1.39 today, with a trading volume of 180 million USDT.
Looks strong, right? But take a closer look: funding rate -0.00247%, long/short ratio 50/50.
Big players are using the rebound to distribute, while retail traders are chasing.
The overall trend strengthened within 8 hours, but the last candlestick started to see declining volume.
I’ve seen this kind of divergence too many times—
there may still be some short-term momentum, but don’t chase it; wait for a pullback.
$RAYSOL #资金费率背离 #60%
Click the small card below to quickly view the market👇
RAYSOL went from 0.83 to 1.39 today, with a trading volume of 180 million USDT.
Looks strong, right? But take a closer look: funding rate -0.00247%, long/short ratio 50/50.
Big players are using the rebound to distribute, while retail traders are chasing.
The overall trend strengthened within 8 hours, but the last candlestick started to see declining volume.
I’ve seen this kind of divergence too many times—
there may still be some short-term momentum, but don’t chase it; wait for a pullback.
$RAYSOL #资金费率背离 #60%
Click the small card below to quickly view the market👇
115

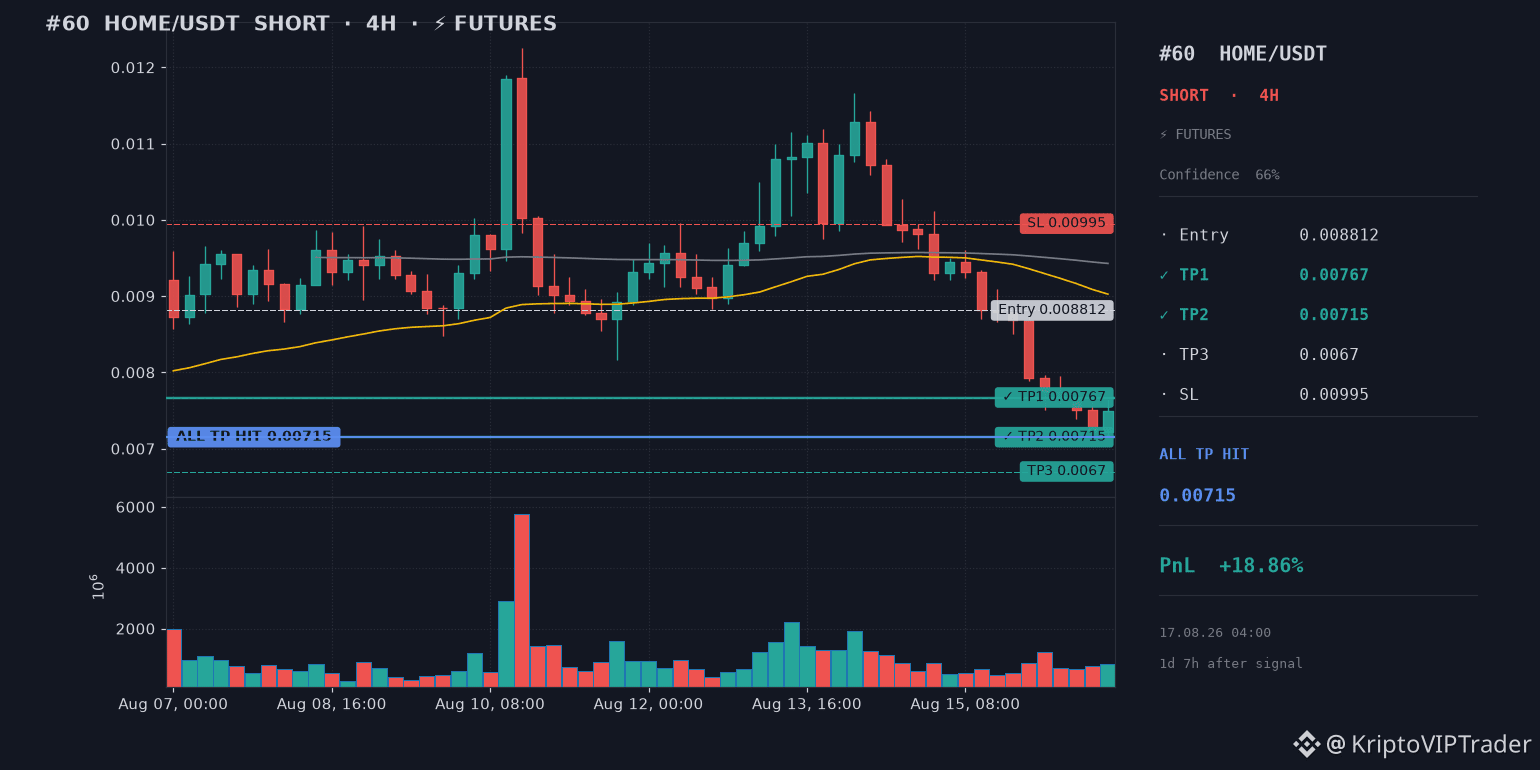
✅ TP2 HIT — TARGET SECURED — $HOME
↩️ #60 · 15.08.26 20:03
🔴 SHORT 🐻 · 4H
📊 Entry: 0.008812 → Exit: 0.007150
📈 Profit: +18.86%
⏱ 17.08.26 04:00 · 1d 7h after signal
↩️ Original post: https://app.binance.com/uni-qr/cpos/356019452495217?r=OSVK1NAK&l=ru
✅ TP2 HIT — TARGET SECURED — $HOME
↩️ #60 · 15.08.26 20:03
🔴 SHORT 🐻 · 4H
📊 Entry: 0.008812 → Exit: 0.007150
📈 Profit: +18.86%
⏱ 17.08.26 04:00 · 1d 7h after signal
↩️ Original post: https://app.binance.com/uni-qr/cpos/356019452495217?r=OSVK1NAK&l=ru
↩️ #60 · 15.08.26 20:03
🔴 SHORT 🐻 · 4H
📊 Entry: 0.008812 → Exit: 0.007150
📈 Profit: +18.86%
⏱ 17.08.26 04:00 · 1d 7h after signal
↩️ Original post: https://app.binance.com/uni-qr/cpos/356019452495217?r=OSVK1NAK&l=ru
119


·
--
Bullish
#Write2Earn Weekly Leaderboard Update
I'm excited to share a special milestone in my journey! ✈️
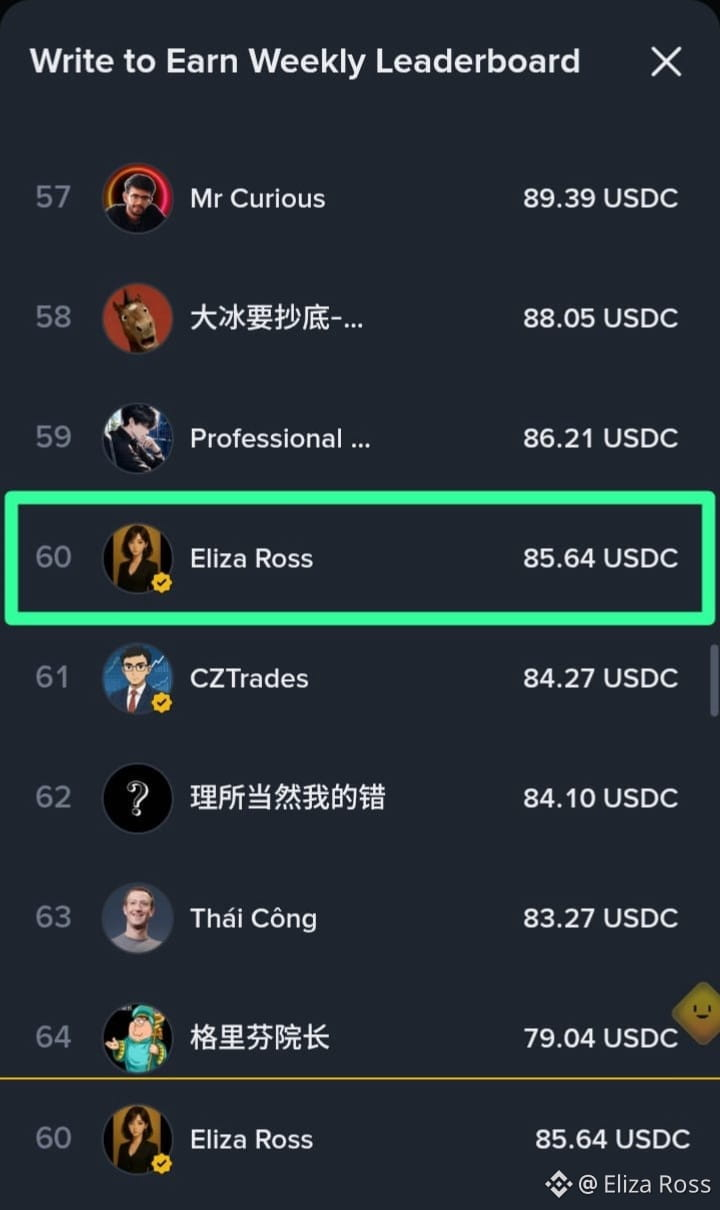
Proud to announce that @Eliza_Ross secured Rank #60 on the Binance Square Write2Earn Weekly Leaderboard, earning 85.64 USDC this week.
This achievement wouldn't have been possible without the incredible support of our amazing community. Thank you for your trust, engagement, and support on every post. Every milestone is possible because of you.
A special thanks to #Binance for creating opportunities through the Write2Earn program and empowering creators to grow while contributing to the crypto community.
A special thank you to @CZ , @richardteng , and @heyi He for building an incredible platform that gives creators the opportunity to share their knowledge, market insights, and experiences with the global crypto community.
This is just the beginning. More market insights, deeper analysis, and even greater achievements are ahead.
Thank you for being part of this journey!
#Write2Earn Weekly Leaderboard Update
I'm excited to share a special milestone in my journey! ✈️
Proud to announce that @Eliza Ross secured Rank #60 on the Binance Square Write2Earn Weekly Leaderboard, earning 85.64 USDC this week.
This achievement wouldn't have been possible without the incredible support of our amazing community. Thank you for your trust, engagement, and support on every post. Every milestone is possible because of you.
A special thanks to #Binance for creating opportunities through the Write2Earn program and empowering creators to grow while contributing to the crypto community.
A special thank you to @CZ , @Richard Teng , and @Yi He He for building an incredible platform that gives creators the opportunity to share their knowledge, market insights, and experiences with the global crypto community.
This is just the beginning. More market insights, deeper analysis, and even greater achievements are ahead.
Thank you for being part of this journey!
I'm excited to share a special milestone in my journey! ✈️
Proud to announce that @Eliza Ross secured Rank #60 on the Binance Square Write2Earn Weekly Leaderboard, earning 85.64 USDC this week.
This achievement wouldn't have been possible without the incredible support of our amazing community. Thank you for your trust, engagement, and support on every post. Every milestone is possible because of you.
A special thanks to #Binance for creating opportunities through the Write2Earn program and empowering creators to grow while contributing to the crypto community.
A special thank you to @CZ , @Richard Teng , and @Yi He He for building an incredible platform that gives creators the opportunity to share their knowledge, market insights, and experiences with the global crypto community.
This is just the beginning. More market insights, deeper analysis, and even greater achievements are ahead.
Thank you for being part of this journey!
48
54
409
·
--
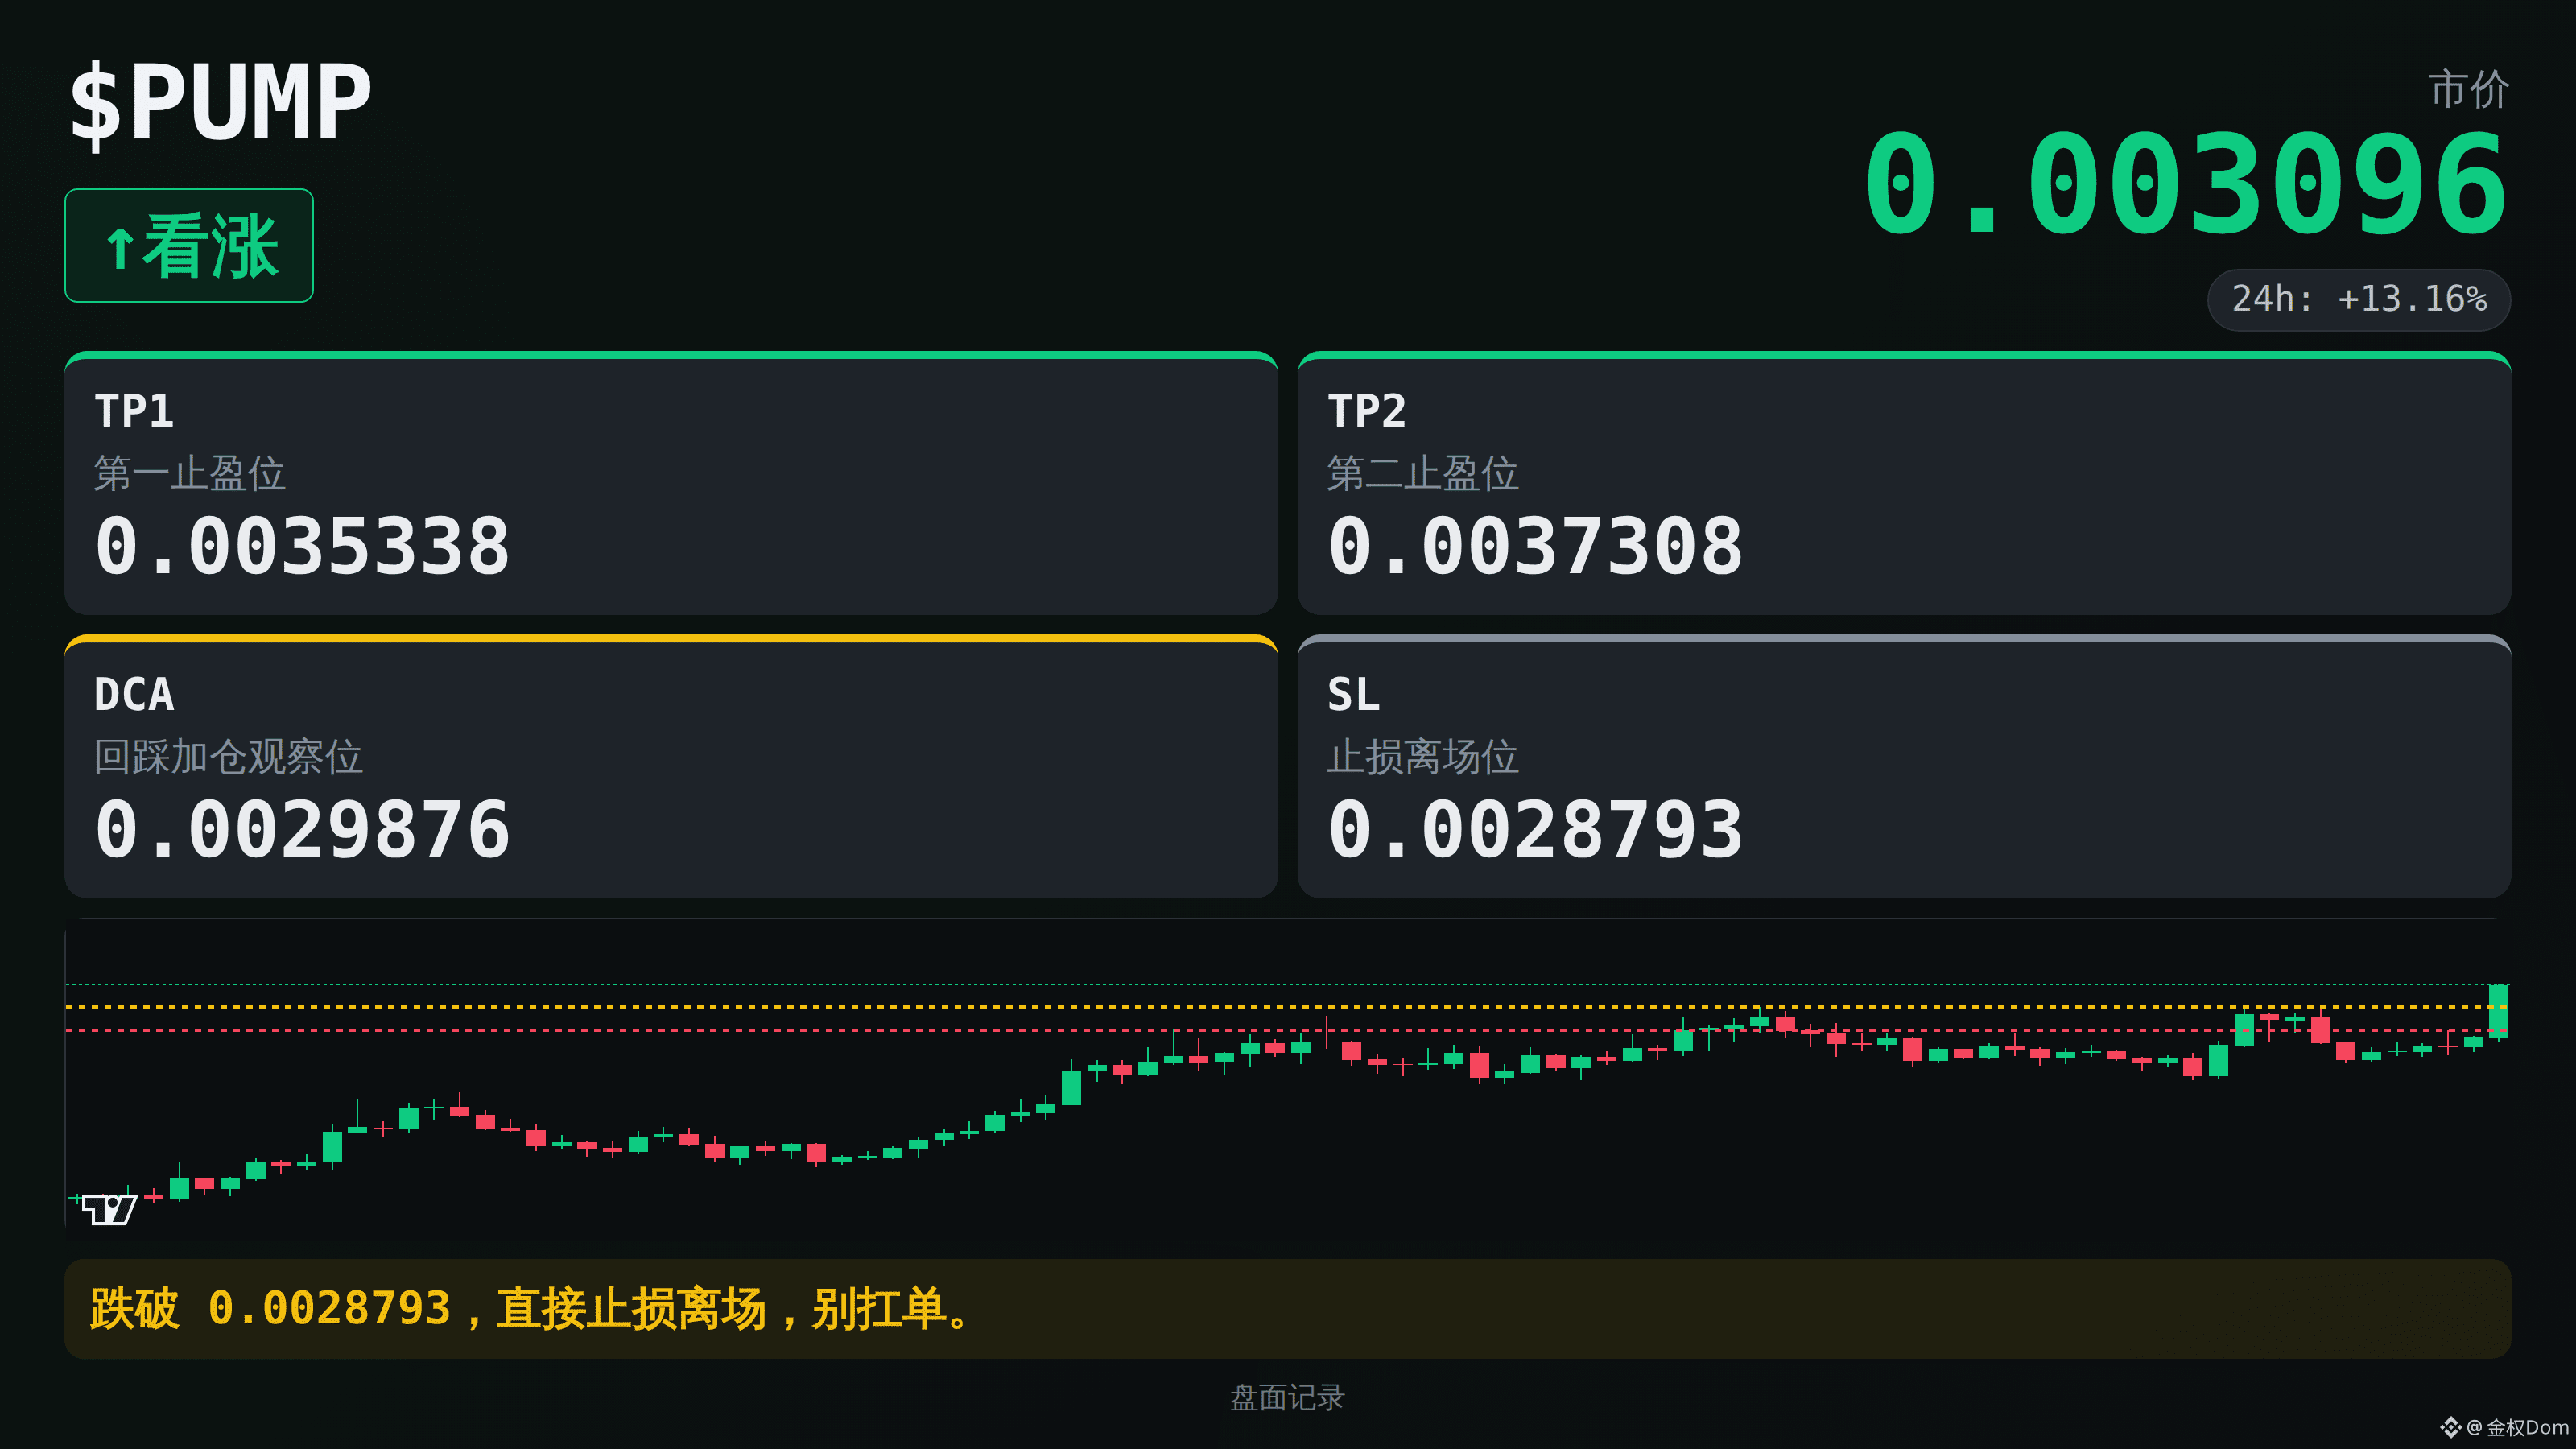
$PUMP Bullish, enter at market price directly: 0.003096
Above TP1: 0.0035338 (first take-profit level)
Above TP2: 0.0037308 (second take-profit level)
DCA: 0.0029876 (pullback/additional-buy observation level)
SL: 0.0028793 (stop-loss exit level)
The hype has picked up—yes, the market cap is now ranked #60, and sentiment has improved. In the past 24h it has risen 13%, broke above the 4H previous high. There are clearly more long accounts. The fee rate of 0.0007% isn’t high either; it looks like the hype may be turning into buying pressure. But positions have actually decreased slightly—so pay attention in case it’s just emotion-driven trading. Add a little at the current price, but don’t go heavy.
If it breaks below 0.0028793, stop out immediately and exit—don’t hold and hope.
$PUMP Bullish, enter at market price directly: 0.003096
Above TP1: 0.0035338 (first take-profit level)
Above TP2: 0.0037308 (second take-profit level)
DCA: 0.0029876 (pullback/additional-buy observation level)
SL: 0.0028793 (stop-loss exit level)
The hype has picked up—yes, the market cap is now ranked #60, and sentiment has improved. In the past 24h it has risen 13%, broke above the 4H previous high. There are clearly more long accounts. The fee rate of 0.0007% isn’t high either; it looks like the hype may be turning into buying pressure. But positions have actually decreased slightly—so pay attention in case it’s just emotion-driven trading. Add a little at the current price, but don’t go heavy.
If it breaks below 0.0028793, stop out immediately and exit—don’t hold and hope.
Above TP1: 0.0035338 (first take-profit level)
Above TP2: 0.0037308 (second take-profit level)
DCA: 0.0029876 (pullback/additional-buy observation level)
SL: 0.0028793 (stop-loss exit level)
The hype has picked up—yes, the market cap is now ranked #60, and sentiment has improved. In the past 24h it has risen 13%, broke above the 4H previous high. There are clearly more long accounts. The fee rate of 0.0007% isn’t high either; it looks like the hype may be turning into buying pressure. But positions have actually decreased slightly—so pay attention in case it’s just emotion-driven trading. Add a little at the current price, but don’t go heavy.
If it breaks below 0.0028793, stop out immediately and exit—don’t hold and hope.
273

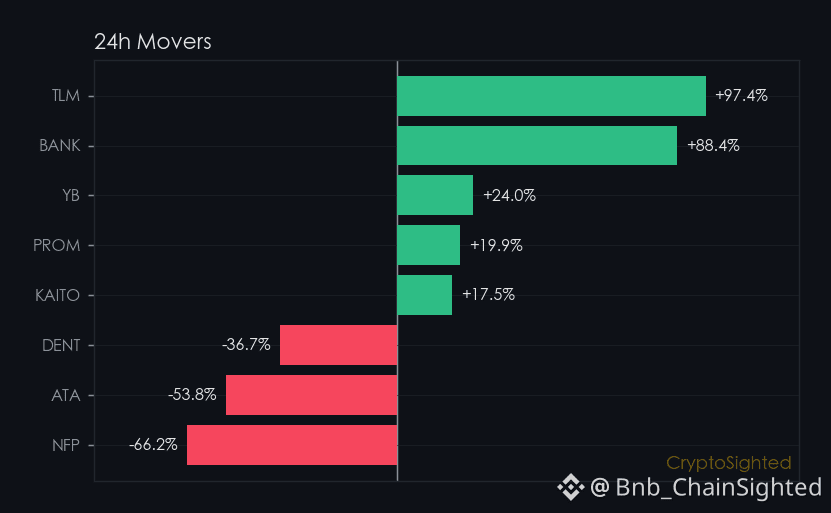
A token is up 8.1% in 24 hours - but its 7-day price-volume pattern tells a different story.
That’s the kind of tension that makes you pause.
$PUMP hit a 21-day high today, but the move feels a bit hollow.
Its 7-day price change is ↑17.3%, and volume has climbed ↑10.5% over the same period.
That’s not a sharp breakaway - it’s a slow, uneven push.
The price is up, but not with the kind of conviction you’d expect from a breakout.
Looking at the bigger picture, the macro is still weak.
Layer 1 and AI sectors are both down, and the meme sector is barely holding.
$BTC is still the dominant force, taking up 58.6% of the total market cap.
Small-caps like PUMP are rising, but they’re not leading a broader shift - they’re just reacting to what’s already in motion.
—
Not financial advice. DYOR.
📌 Gainers Radar · #60 · #Gainers #CryptoSighted $PUMP
A token is up 8.1% in 24 hours - but its 7-day price-volume pattern tells a different story.
That’s the kind of tension that makes you pause.
$PUMP hit a 21-day high today, but the move feels a bit hollow.
Its 7-day price change is ↑17.3%, and volume has climbed ↑10.5% over the same period.
That’s not a sharp breakaway - it’s a slow, uneven push.
The price is up, but not with the kind of conviction you’d expect from a breakout.
Looking at the bigger picture, the macro is still weak.
Layer 1 and AI sectors are both down, and the meme sector is barely holding.
$BTC is still the dominant force, taking up 58.6% of the total market cap.
Small-caps like PUMP are rising, but they’re not leading a broader shift - they’re just reacting to what’s already in motion.
—
Not financial advice. DYOR.
📌 Gainers Radar · #60 · #Gainers #CryptoSighted $PUMP
That’s the kind of tension that makes you pause.
$PUMP hit a 21-day high today, but the move feels a bit hollow.
Its 7-day price change is ↑17.3%, and volume has climbed ↑10.5% over the same period.
That’s not a sharp breakaway - it’s a slow, uneven push.
The price is up, but not with the kind of conviction you’d expect from a breakout.
Looking at the bigger picture, the macro is still weak.
Layer 1 and AI sectors are both down, and the meme sector is barely holding.
$BTC is still the dominant force, taking up 58.6% of the total market cap.
Small-caps like PUMP are rising, but they’re not leading a broader shift - they’re just reacting to what’s already in motion.
—
Not financial advice. DYOR.
📌 Gainers Radar · #60 · #Gainers #CryptoSighted $PUMP
328

·
--
$MATIC ONCE RULED THE CHARTS - NOW IT'S A CAUTIONARY TALE 💎
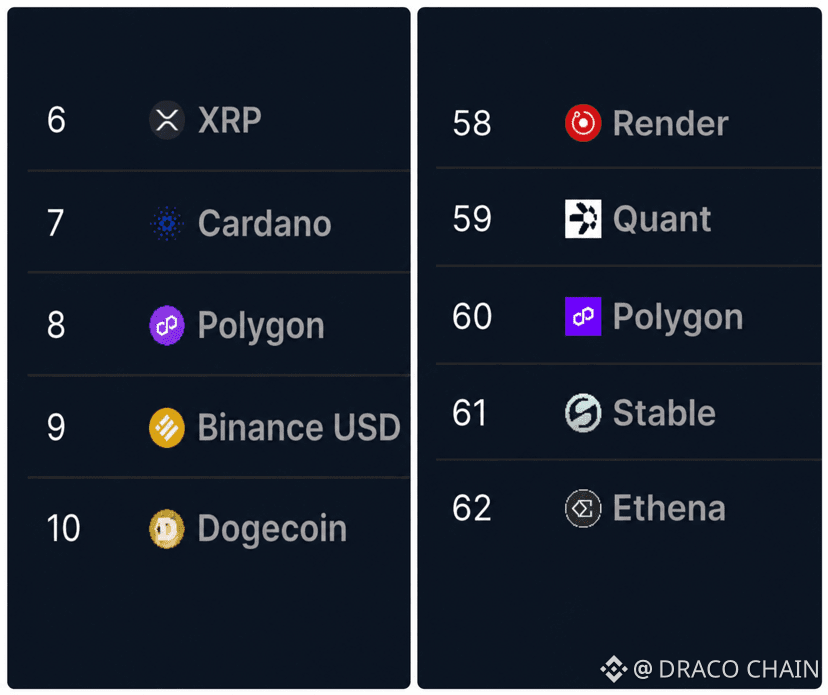
This isn't just a price correction. A coin that ranked #8 by market cap now sits at #60 . That's a structural shift in where institutional and retail liquidity flows. Narratives rotate faster than most traders adapt — money doesn't stay parked in broken stories.
Volume has decayed consistently month over month, and the daily structure shows lower highs since early 2024. The lesson is clinical: market cap is a lagging indicator, not a leading one. How many of your bags are still holding coins with fading narratives?
Not financial advice. Always manage your risk.
#MATIC #MarketStructure #Liquidity #Altcoins #CryptoLessons
💎
$MATIC ONCE RULED THE CHARTS - NOW IT'S A CAUTIONARY TALE 💎
This isn't just a price correction. A coin that ranked #8 by market cap now sits at #60 . That's a structural shift in where institutional and retail liquidity flows. Narratives rotate faster than most traders adapt — money doesn't stay parked in broken stories.
Volume has decayed consistently month over month, and the daily structure shows lower highs since early 2024. The lesson is clinical: market cap is a lagging indicator, not a leading one. How many of your bags are still holding coins with fading narratives?
Not financial advice. Always manage your risk.
#MATIC #MarketStructure #Liquidity #Altcoins #CryptoLessons
💎
This isn't just a price correction. A coin that ranked #8 by market cap now sits at #60 . That's a structural shift in where institutional and retail liquidity flows. Narratives rotate faster than most traders adapt — money doesn't stay parked in broken stories.
Volume has decayed consistently month over month, and the daily structure shows lower highs since early 2024. The lesson is clinical: market cap is a lagging indicator, not a leading one. How many of your bags are still holding coins with fading narratives?
Not financial advice. Always manage your risk.
#MATIC #MarketStructure #Liquidity #Altcoins #CryptoLessons
💎
78
What happens when tokenized securities start showing up on Binance - and who actually cares?
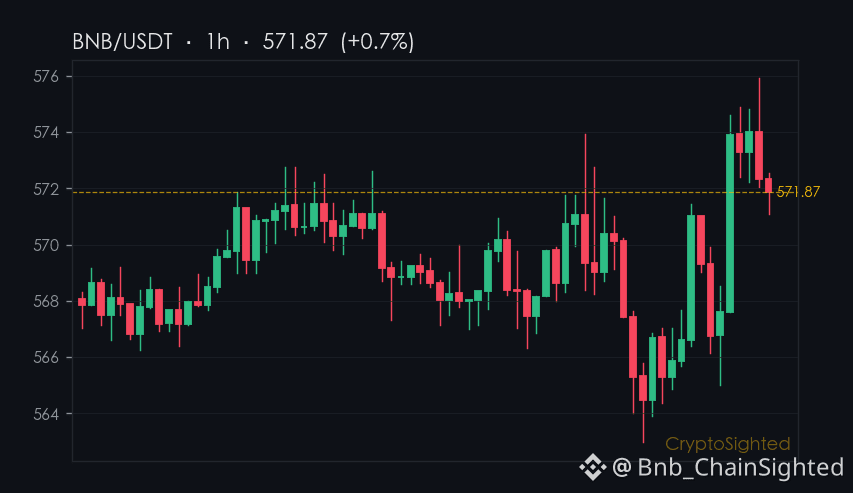
$BNB just added 10 bStocks tokenized securities as collateral assets - but what does that really mean for the broader tokenized asset narrative?
BNB’s 30-day price movement shows a gain, but its 7-day performance has been flat - a divergence that suggests momentum may be fading.
At the same time, funding rates for some of its perpetual contracts have turned negative, which typically indicates bearish pressure from longs.
BNB’s on-chain metrics haven’t shown a strong uptick in accumulation, and its TVL hasn’t spiked in line with the new listings.
That’s a key signal: tokenized assets are being added, but the market hasn’t yet responded with strong buying pressure.
defense or offense - one word
—
Not financial advice. DYOR.
📌 News Take · #60 · #CryptoNews #CryptoSighted $BNB
What happens when tokenized securities start showing up on Binance - and who actually cares?
$BNB just added 10 bStocks tokenized securities as collateral assets - but what does that really mean for the broader tokenized asset narrative?
BNB’s 30-day price movement shows a gain, but its 7-day performance has been flat - a divergence that suggests momentum may be fading.
At the same time, funding rates for some of its perpetual contracts have turned negative, which typically indicates bearish pressure from longs.
BNB’s on-chain metrics haven’t shown a strong uptick in accumulation, and its TVL hasn’t spiked in line with the new listings.
That’s a key signal: tokenized assets are being added, but the market hasn’t yet responded with strong buying pressure.
defense or offense - one word
—
Not financial advice. DYOR.
📌 News Take · #60 · #CryptoNews #CryptoSighted $BNB
$BNB just added 10 bStocks tokenized securities as collateral assets - but what does that really mean for the broader tokenized asset narrative?
BNB’s 30-day price movement shows a gain, but its 7-day performance has been flat - a divergence that suggests momentum may be fading.
At the same time, funding rates for some of its perpetual contracts have turned negative, which typically indicates bearish pressure from longs.
BNB’s on-chain metrics haven’t shown a strong uptick in accumulation, and its TVL hasn’t spiked in line with the new listings.
That’s a key signal: tokenized assets are being added, but the market hasn’t yet responded with strong buying pressure.
defense or offense - one word
—
Not financial advice. DYOR.
📌 News Take · #60 · #CryptoNews #CryptoSighted $BNB
270
·
--
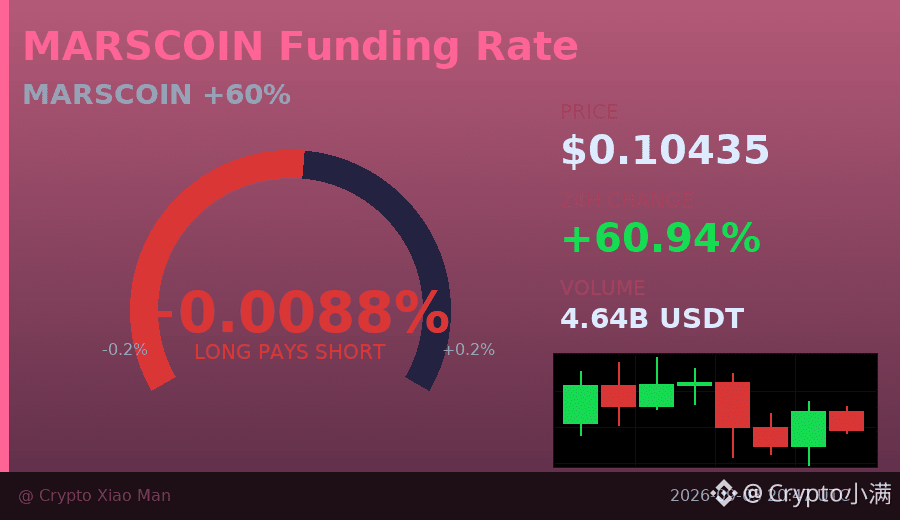
A 60% surge, but more than half the people are shorting—kind of interesting.
Today, MARSCOIN’s trading volume hit 464 million U. The price moved from 0.059 up to 0.123, and it has now pulled back to 0.104. On the surface it looks like a strong breakout, but the short position ratio is 56%, higher than the longs.
More importantly, over the past 8 hours the price has actually been weakening. This kind of “it’s pumping hard, but nobody believes it” situation is either the main players luring longs, or the final shakeout right before a real breakout.
I’ll wait until the direction is clear before I take action—chasing it now is too risky.
$MARSCOIN #多空分歧 #60%涨幅
Click the small card below to quickly check the market trend👇
A 60% surge, but more than half the people are shorting—kind of interesting.
Today, MARSCOIN’s trading volume hit 464 million U. The price moved from 0.059 up to 0.123, and it has now pulled back to 0.104. On the surface it looks like a strong breakout, but the short position ratio is 56%, higher than the longs.
More importantly, over the past 8 hours the price has actually been weakening. This kind of “it’s pumping hard, but nobody believes it” situation is either the main players luring longs, or the final shakeout right before a real breakout.
I’ll wait until the direction is clear before I take action—chasing it now is too risky.
$MARSCOIN #多空分歧 #60%涨幅
Click the small card below to quickly check the market trend👇
Today, MARSCOIN’s trading volume hit 464 million U. The price moved from 0.059 up to 0.123, and it has now pulled back to 0.104. On the surface it looks like a strong breakout, but the short position ratio is 56%, higher than the longs.
More importantly, over the past 8 hours the price has actually been weakening. This kind of “it’s pumping hard, but nobody believes it” situation is either the main players luring longs, or the final shakeout right before a real breakout.
I’ll wait until the direction is clear before I take action—chasing it now is too risky.
$MARSCOIN #多空分歧 #60%涨幅
Click the small card below to quickly check the market trend👇
95
·
--
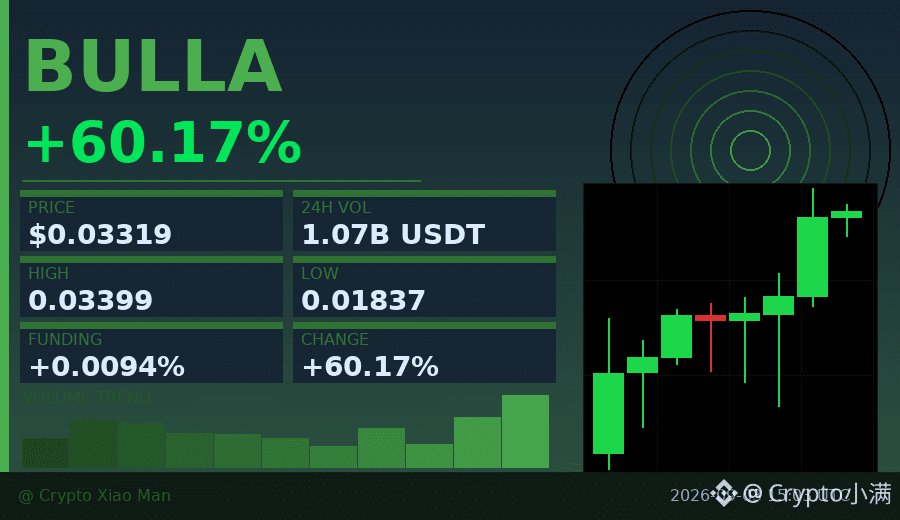
60% price increase, but the funding rate is only 0.009%—what does that mean?
When most people see BULLA rally, their first reaction is to chase longs,
but compared short-term and long-term signals, it’s 52% vs 48%, and almost nobody is extremely crowded.
Three consecutive hourly candles close green, and volume pushes to 107 million U. The price rises from 0.018 to 0.033, but the funding rate doesn’t keep up.
This kind of divergence usually indicates that the main players are quietly accumulating,
rather than a false breakout driven by FOMO from retail traders.
I’m watching the 0.030 level—if it holds, then we’ll look at 0.036.
$BULLA #低费率爆发 #60%
Click the small card below to quickly view the market行情👇
60% price increase, but the funding rate is only 0.009%—what does that mean?
When most people see BULLA rally, their first reaction is to chase longs,
but compared short-term and long-term signals, it’s 52% vs 48%, and almost nobody is extremely crowded.
Three consecutive hourly candles close green, and volume pushes to 107 million U. The price rises from 0.018 to 0.033, but the funding rate doesn’t keep up.
This kind of divergence usually indicates that the main players are quietly accumulating,
rather than a false breakout driven by FOMO from retail traders.
I’m watching the 0.030 level—if it holds, then we’ll look at 0.036.
$BULLA #低费率爆发 #60%
Click the small card below to quickly view the market行情👇
When most people see BULLA rally, their first reaction is to chase longs,
but compared short-term and long-term signals, it’s 52% vs 48%, and almost nobody is extremely crowded.
Three consecutive hourly candles close green, and volume pushes to 107 million U. The price rises from 0.018 to 0.033, but the funding rate doesn’t keep up.
This kind of divergence usually indicates that the main players are quietly accumulating,
rather than a false breakout driven by FOMO from retail traders.
I’m watching the 0.030 level—if it holds, then we’ll look at 0.036.
$BULLA #低费率爆发 #60%
Click the small card below to quickly view the market行情👇
20
Log in to explore more content
Join global crypto users on Binance Square
⚡️ Get latest and useful information about crypto.
💬 Trusted by the world’s largest crypto exchange.
👍 Discover real insights from verified creators.
Email / Phone number
Trending Topics
1
#CanBTCReboundAfterFallingBelow60K?
388,957 views
1,683 Discussing
2
#GlobalStocksFaceLongestLosingStreakSince2023
129,378 views
1,171 Discussing
3
#BlackRockIBITPostsRecord$541MSingleDayOutflow
1,028 views
32 Discussing
4
#AnthropicPlungesTowardIPOPriceonDay2
61,498 views
650 Discussing
5
#TwentyOneCapitalAdds172.25BTC
14,326 views
192 Discussing
6
#HKBillWouldExcludeTokenizedDepositsFromVirtualAssets
1,432 views
19 Discussing
7
#BNBDropsBelow540USDTWith8.46%DailyDecline
34,954 views
304 Discussing
8
#HKBillProposesHK$100KFineForUnauthorizedCryptoTitles
1,141 views
17 Discussing
9
#BitMineFaces$10.1BUnrealizedETHLoss
2,166 views
20 Discussing
10
#StrategyReports$35BNetReserves
2,128 views
18 Discussing