
#adpjobsurge
adpjobsurge
6,210 views
162 Discussing
Hot
Latest

$BTC Bitcoin is trading in a tight consolidation range around $64,800 – $65,000 (~17.68M PKR), stabilizing slightly after a steep two-week pullback from above $75,000.
Current Sentiment: Extreme Fear (Fear & Greed Index at 11). Following $1.07 billion in weekly spot ETF outflows, selling pressure has briefly paused as broader tech equities attempt a bounce ahead of key earnings.
Macro & Market Drivers: Renewed fears of Federal Reserve rate hikes and capital rotating toward AI stocks continue to weigh on crypto liquidity, though institutional dip-buying has helped defend the $64,000 floor.
Technical Outlook: Momentum remains bearish on higher timeframes, with BTC trading below its 50-day (~$65,000) and 200-day (~$71,000) moving averages. However, a deeply oversold daily RSI (~24) suggests the market is due for short-term relief bounces.
#ADPJobSurge #BinanceHODL
#PrivacyDebate
$BTC Bitcoin is trading in a tight consolidation range around $64,800 – $65,000 (~17.68M PKR), stabilizing slightly after a steep two-week pullback from above $75,000.
Current Sentiment: Extreme Fear (Fear & Greed Index at 11). Following $1.07 billion in weekly spot ETF outflows, selling pressure has briefly paused as broader tech equities attempt a bounce ahead of key earnings.
Macro & Market Drivers: Renewed fears of Federal Reserve rate hikes and capital rotating toward AI stocks continue to weigh on crypto liquidity, though institutional dip-buying has helped defend the $64,000 floor.
Technical Outlook: Momentum remains bearish on higher timeframes, with BTC trading below its 50-day (~$65,000) and 200-day (~$71,000) moving averages. However, a deeply oversold daily RSI (~24) suggests the market is due for short-term relief bounces.
#ADPJobSurge #BinanceHODL
#PrivacyDebate
Current Sentiment: Extreme Fear (Fear & Greed Index at 11). Following $1.07 billion in weekly spot ETF outflows, selling pressure has briefly paused as broader tech equities attempt a bounce ahead of key earnings.
Macro & Market Drivers: Renewed fears of Federal Reserve rate hikes and capital rotating toward AI stocks continue to weigh on crypto liquidity, though institutional dip-buying has helped defend the $64,000 floor.
Technical Outlook: Momentum remains bearish on higher timeframes, with BTC trading below its 50-day (~$65,000) and 200-day (~$71,000) moving averages. However, a deeply oversold daily RSI (~24) suggests the market is due for short-term relief bounces.
#ADPJobSurge #BinanceHODL
#PrivacyDebate

55
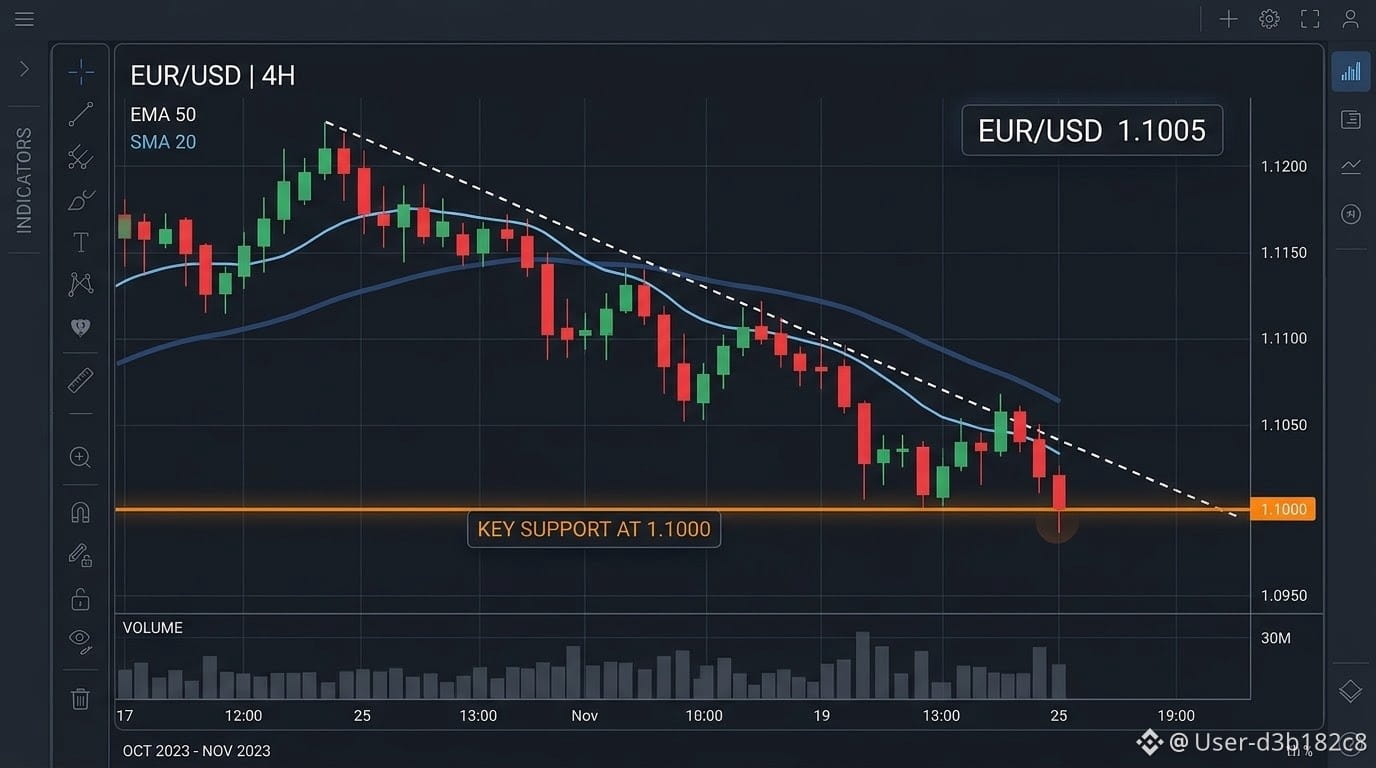
$USDS EUR/USD Market Snapshot (November 17, 2026)
Current Rate: 1.1005 (down ~1.36% month-to-date from 1.1156)
Primary Trend: Bearish
Technical & Market Drivers
Broad US Dollar strength has pushed EUR/USD down to multi-month lows, placing the critical 1.1000 psychological support level under heavy pressure. The pair continues to print lower highs and lower lows while trading firmly beneath its 50-day, 100-day, and 200-day moving averages. However, the 14-day Relative Strength Index (RSI) is hovering near 30–32, signaling that near-term selling momentum is stretched and approaching oversold territory.
Key Levels to Watch
#ADPJobSurge #binanceHODLeMMT #PrivacyCoinSurge
$USDS EUR/USD Market Snapshot (November 17, 2026)
Current Rate: 1.1005 (down ~1.36% month-to-date from 1.1156)
Primary Trend: Bearish
Technical & Market Drivers
Broad US Dollar strength has pushed EUR/USD down to multi-month lows, placing the critical 1.1000 psychological support level under heavy pressure. The pair continues to print lower highs and lower lows while trading firmly beneath its 50-day, 100-day, and 200-day moving averages. However, the 14-day Relative Strength Index (RSI) is hovering near 30–32, signaling that near-term selling momentum is stretched and approaching oversold territory.
Key Levels to Watch
#ADPJobSurge #binanceHODLeMMT #PrivacyCoinSurge
Current Rate: 1.1005 (down ~1.36% month-to-date from 1.1156)
Primary Trend: Bearish
Technical & Market Drivers
Broad US Dollar strength has pushed EUR/USD down to multi-month lows, placing the critical 1.1000 psychological support level under heavy pressure. The pair continues to print lower highs and lower lows while trading firmly beneath its 50-day, 100-day, and 200-day moving averages. However, the 14-day Relative Strength Index (RSI) is hovering near 30–32, signaling that near-term selling momentum is stretched and approaching oversold territory.
Key Levels to Watch
#ADPJobSurge #binanceHODLeMMT #PrivacyCoinSurge
57

·
--
🚨 $BTC
{spot}(BTCUSDT)
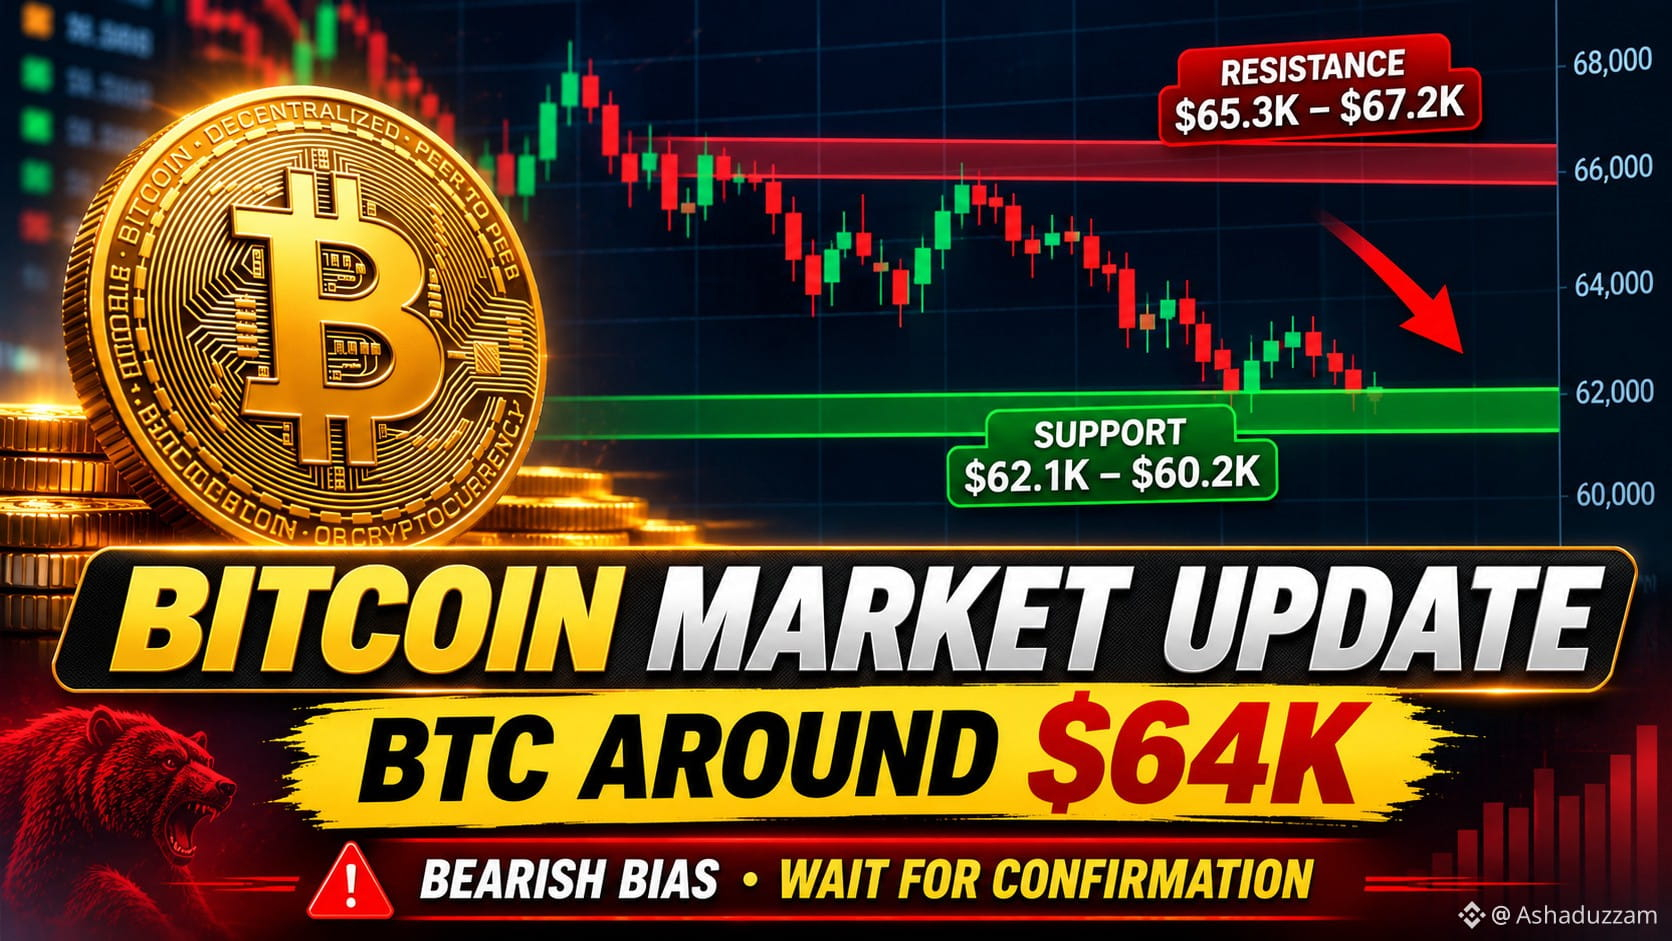
UPDATE: BEARS ARE STILL IN CONTROL! 📉
Bitcoin is trading around $64K, and the short-term market structure remains bearish.
🔍 Key Levels to Watch:
🟢 Support: $62,100 – $60,200
🔴 Resistance: $65,300 – $67,200
⚠️ Major recovery signal: A strong breakout above $67,200.
My Analysis:
Bearish momentum remains dominant on higher timeframes.
A bounce from support is possible, but reversal is not confirmed.
A breakdown below $62K could expose further downside.
🎯 Trading Strategy: Stay patient. Wait for confirmation, avoid emotional entries, and manage your risk.
What do you think? Will BTC recover to $70K or drop toward $60K?
👍 Like | 🔄 Share | 💬 Comment your prediction!
#Bitcoin #BTC #CryptoAnalysis #BinanceSquare #CryptoTrading
Educational content only. Not financial advice. DYOR.
#ADPJobSurge #BinanceHODL
🚨 $BTC
UPDATE: BEARS ARE STILL IN CONTROL! 📉
Bitcoin is trading around $64K, and the short-term market structure remains bearish.
🔍 Key Levels to Watch:
🟢 Support: $62,100 – $60,200
🔴 Resistance: $65,300 – $67,200
⚠️ Major recovery signal: A strong breakout above $67,200.
My Analysis:
Bearish momentum remains dominant on higher timeframes.
A bounce from support is possible, but reversal is not confirmed.
A breakdown below $62K could expose further downside.
🎯 Trading Strategy: Stay patient. Wait for confirmation, avoid emotional entries, and manage your risk.
What do you think? Will BTC recover to $70K or drop toward $60K?
👍 Like | 🔄 Share | 💬 Comment your prediction!
#Bitcoin #BTC #CryptoAnalysis #BinanceSquare #CryptoTrading
Educational content only. Not financial advice. DYOR.
#ADPJobSurge #BinanceHODL
UPDATE: BEARS ARE STILL IN CONTROL! 📉
Bitcoin is trading around $64K, and the short-term market structure remains bearish.
🔍 Key Levels to Watch:
🟢 Support: $62,100 – $60,200
🔴 Resistance: $65,300 – $67,200
⚠️ Major recovery signal: A strong breakout above $67,200.
My Analysis:
Bearish momentum remains dominant on higher timeframes.
A bounce from support is possible, but reversal is not confirmed.
A breakdown below $62K could expose further downside.
🎯 Trading Strategy: Stay patient. Wait for confirmation, avoid emotional entries, and manage your risk.
What do you think? Will BTC recover to $70K or drop toward $60K?
👍 Like | 🔄 Share | 💬 Comment your prediction!
#Bitcoin #BTC #CryptoAnalysis #BinanceSquare #CryptoTrading
Educational content only. Not financial advice. DYOR.
#ADPJobSurge #BinanceHODL
72

·
--
🚨 BITCOIN MARKET UPDATE 📊 | $BTC
{spot}(BTCUSDT)
/USD
💰 Current Price: $76,460.81
🔥 BITCOIN: A BIG MOVE COULD BE COMING!
Bitcoin is one of the most closely watched cryptocurrencies in the world. Traders are keeping an eye on important price levels to understand whether BTC could recover or face further downside.
📉 KEY SUPPORT LEVELS
• $76,000
• $75,200
If Bitcoin falls below support, selling pressure could increase. However, these levels are not guaranteed to hold.
📈 KEY RESISTANCE LEVELS
• $77,800
• $78,900
If BTC breaks above resistance and holds, it could indicate improving bullish momentum.
🐻 BEARISH SCENARIO: A confirmed break below support could lead to further weakness.
🐂 BULLISH SCENARIO: A sustained move above resistance could signal a potential recovery.
💡 CRYPTO KNOWLEDGE: Support is a price area where buying interest may emerge, while resistance is an area where selling pressure may increase. Neither level guarantees what happens next.
⚠️ Remember: Crypto markets are highly volatile. Always verify live prices, do your own research, and manage your risk before trading.
🔥 LET'S DISCUSS!
What do you think BTC will do next?
🟢 BULLISH 📈 — Bitcoin will rise
🔴 BEARISH 📉 — Bitcoin will fall
💬 Share your prediction below and tell us WHY!
🔔 Follow for more Bitcoin updates, crypto education, and market insights.
#Bitcoin #BTC #CryptoMarket #BitcoinAnalysis #CryptoNews #BinanceSquare #BTCUSD #ADPJobSurge #BinanceHODLEerMMT #PrivacyCoinSurge
🚨 BITCOIN MARKET UPDATE 📊 | $BTC
/USD
💰 Current Price: $76,460.81
🔥 BITCOIN: A BIG MOVE COULD BE COMING!
Bitcoin is one of the most closely watched cryptocurrencies in the world. Traders are keeping an eye on important price levels to understand whether BTC could recover or face further downside.
📉 KEY SUPPORT LEVELS
• $76,000
• $75,200
If Bitcoin falls below support, selling pressure could increase. However, these levels are not guaranteed to hold.
📈 KEY RESISTANCE LEVELS
• $77,800
• $78,900
If BTC breaks above resistance and holds, it could indicate improving bullish momentum.
🐻 BEARISH SCENARIO: A confirmed break below support could lead to further weakness.
🐂 BULLISH SCENARIO: A sustained move above resistance could signal a potential recovery.
💡 CRYPTO KNOWLEDGE: Support is a price area where buying interest may emerge, while resistance is an area where selling pressure may increase. Neither level guarantees what happens next.
⚠️ Remember: Crypto markets are highly volatile. Always verify live prices, do your own research, and manage your risk before trading.
🔥 LET'S DISCUSS!
What do you think BTC will do next?
🟢 BULLISH 📈 — Bitcoin will rise
🔴 BEARISH 📉 — Bitcoin will fall
💬 Share your prediction below and tell us WHY!
🔔 Follow for more Bitcoin updates, crypto education, and market insights.
#Bitcoin #BTC #CryptoMarket #BitcoinAnalysis #CryptoNews #BinanceSquare #BTCUSD #ADPJobSurge #BinanceHODLEerMMT #PrivacyCoinSurge
/USD
💰 Current Price: $76,460.81
🔥 BITCOIN: A BIG MOVE COULD BE COMING!
Bitcoin is one of the most closely watched cryptocurrencies in the world. Traders are keeping an eye on important price levels to understand whether BTC could recover or face further downside.
📉 KEY SUPPORT LEVELS
• $76,000
• $75,200
If Bitcoin falls below support, selling pressure could increase. However, these levels are not guaranteed to hold.
📈 KEY RESISTANCE LEVELS
• $77,800
• $78,900
If BTC breaks above resistance and holds, it could indicate improving bullish momentum.
🐻 BEARISH SCENARIO: A confirmed break below support could lead to further weakness.
🐂 BULLISH SCENARIO: A sustained move above resistance could signal a potential recovery.
💡 CRYPTO KNOWLEDGE: Support is a price area where buying interest may emerge, while resistance is an area where selling pressure may increase. Neither level guarantees what happens next.
⚠️ Remember: Crypto markets are highly volatile. Always verify live prices, do your own research, and manage your risk before trading.
🔥 LET'S DISCUSS!
What do you think BTC will do next?
🟢 BULLISH 📈 — Bitcoin will rise
🔴 BEARISH 📉 — Bitcoin will fall
💬 Share your prediction below and tell us WHY!
🔔 Follow for more Bitcoin updates, crypto education, and market insights.
#Bitcoin #BTC #CryptoMarket #BitcoinAnalysis #CryptoNews #BinanceSquare #BTCUSD #ADPJobSurge #BinanceHODLEerMMT #PrivacyCoinSurge

147

·
--
$LINK Chainlink (LINK)
$11.40
Short-term selling pressure
Technical outlook:
Support: $11.00 – $11.40
Resistance: $12.00 – $12.70
Bullish target: $13.30
Bearish target: $10.40 – $10.60
LINK is consolidating after a major correction from its recent highs. Momentum remains weak, but holding the $11 support zone could create an opportunity for recovery. A breakout above $12.70 would improve the bullish outlook.
Market data varies across exchanges. Prices are approximate; not financial advice.
My view: Wait for a confirmed breakout above $12.70 before treating LINK as bullish.
{spot}(LINKUSDT)
#ADPJobSurge #LINKHolder #PrivacyCoinSurge
$LINK Chainlink (LINK)
$11.40
Short-term selling pressure
Technical outlook:
Support: $11.00 – $11.40
Resistance: $12.00 – $12.70
Bullish target: $13.30
Bearish target: $10.40 – $10.60
LINK is consolidating after a major correction from its recent highs. Momentum remains weak, but holding the $11 support zone could create an opportunity for recovery. A breakout above $12.70 would improve the bullish outlook.
Market data varies across exchanges. Prices are approximate; not financial advice.
My view: Wait for a confirmed breakout above $12.70 before treating LINK as bullish.
#ADPJobSurge #LINKHolder #PrivacyCoinSurge
$11.40
Short-term selling pressure
Technical outlook:
Support: $11.00 – $11.40
Resistance: $12.00 – $12.70
Bullish target: $13.30
Bearish target: $10.40 – $10.60
LINK is consolidating after a major correction from its recent highs. Momentum remains weak, but holding the $11 support zone could create an opportunity for recovery. A breakout above $12.70 would improve the bullish outlook.
Market data varies across exchanges. Prices are approximate; not financial advice.
My view: Wait for a confirmed breakout above $12.70 before treating LINK as bullish.
#ADPJobSurge #LINKHolder #PrivacyCoinSurge

2
410

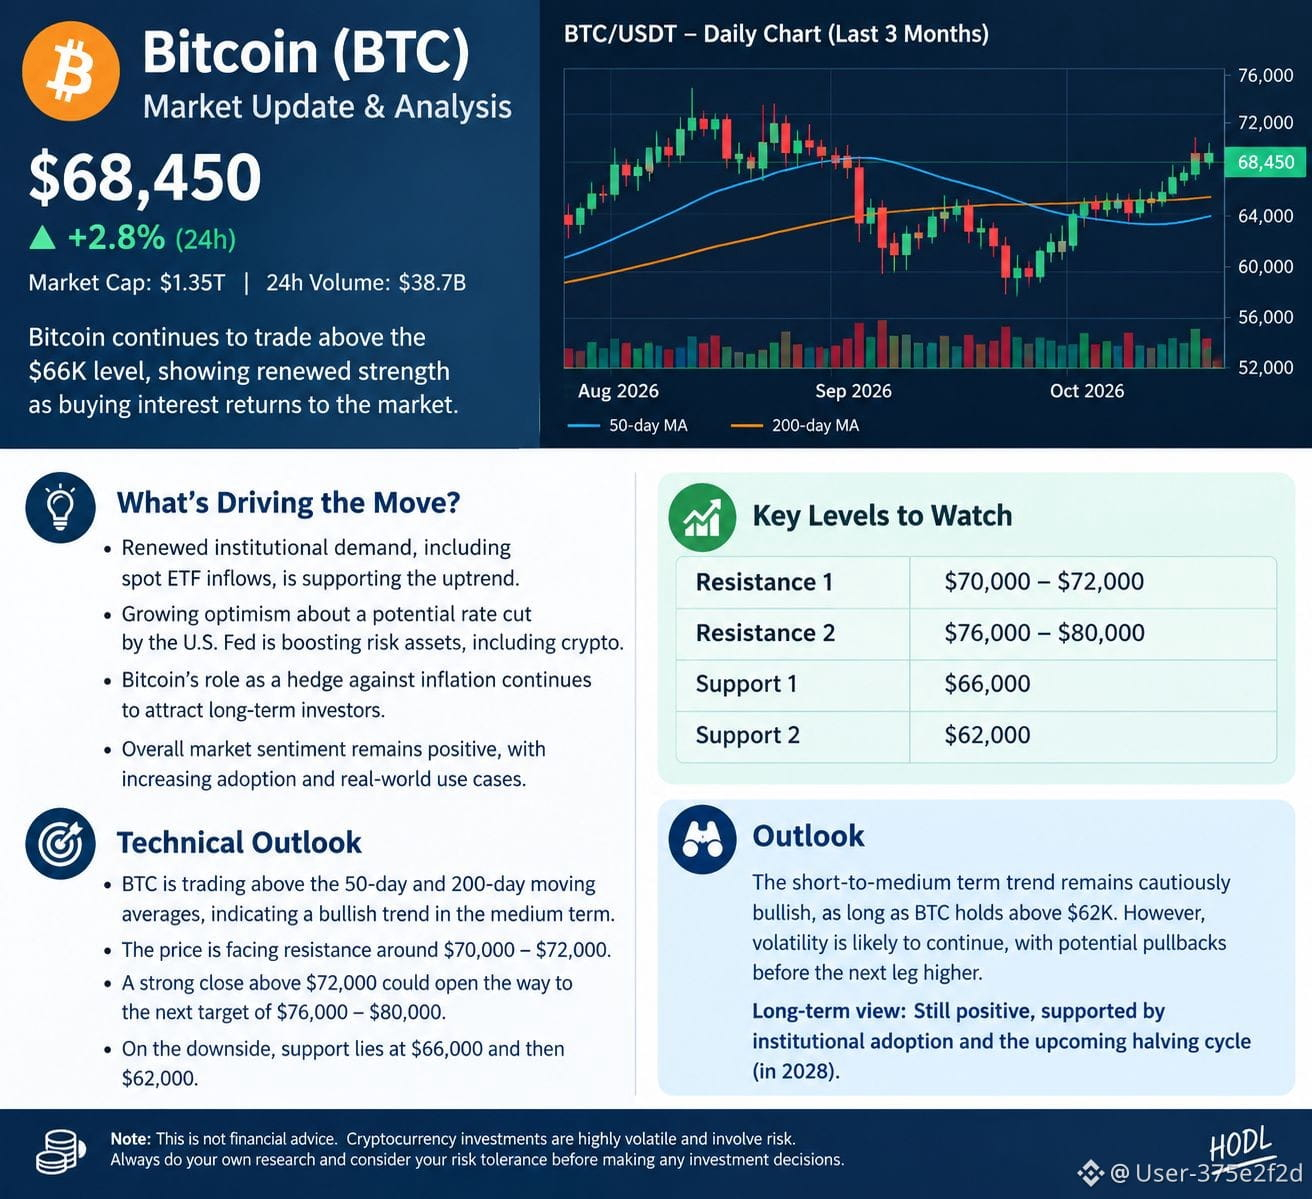
$BTC — Short Market Analysis
Market overview · 23 October 2026
Bitcoin's outlook depends on whether buyers can sustain momentum and push the price above nearby resistance. The key signals to watch are trading volume, institutional demand, interest-rate expectations, and broader market sentiment.
Technical outlook
Bullish: A sustained breakout above resistance, supported by strong volume, could signal further upside.
Bearish: Failure to break resistance could trigger profit-taking and a retest of support.
Key consideration: Bitcoin remains a highly volatile asset, and short-term price movements are difficult to predict.
Important: The figures in the accompanying graphic are illustrative, not verified live Bitcoin prices or market statistics. Check a live market chart before making any trading decision. This is market commentary, not financial advice.
#ADPJobSurge #BianceHODLerMMt #PrivacyCoinSurge
$BTC — Short Market Analysis
Market overview · 23 October 2026
Bitcoin's outlook depends on whether buyers can sustain momentum and push the price above nearby resistance. The key signals to watch are trading volume, institutional demand, interest-rate expectations, and broader market sentiment.
Technical outlook
Bullish: A sustained breakout above resistance, supported by strong volume, could signal further upside.
Bearish: Failure to break resistance could trigger profit-taking and a retest of support.
Key consideration: Bitcoin remains a highly volatile asset, and short-term price movements are difficult to predict.
Important: The figures in the accompanying graphic are illustrative, not verified live Bitcoin prices or market statistics. Check a live market chart before making any trading decision. This is market commentary, not financial advice.
#ADPJobSurge #BianceHODLerMMt #PrivacyCoinSurge
Market overview · 23 October 2026
Bitcoin's outlook depends on whether buyers can sustain momentum and push the price above nearby resistance. The key signals to watch are trading volume, institutional demand, interest-rate expectations, and broader market sentiment.
Technical outlook
Bullish: A sustained breakout above resistance, supported by strong volume, could signal further upside.
Bearish: Failure to break resistance could trigger profit-taking and a retest of support.
Key consideration: Bitcoin remains a highly volatile asset, and short-term price movements are difficult to predict.
Important: The figures in the accompanying graphic are illustrative, not verified live Bitcoin prices or market statistics. Check a live market chart before making any trading decision. This is market commentary, not financial advice.
#ADPJobSurge #BianceHODLerMMt #PrivacyCoinSurge
64

·
--
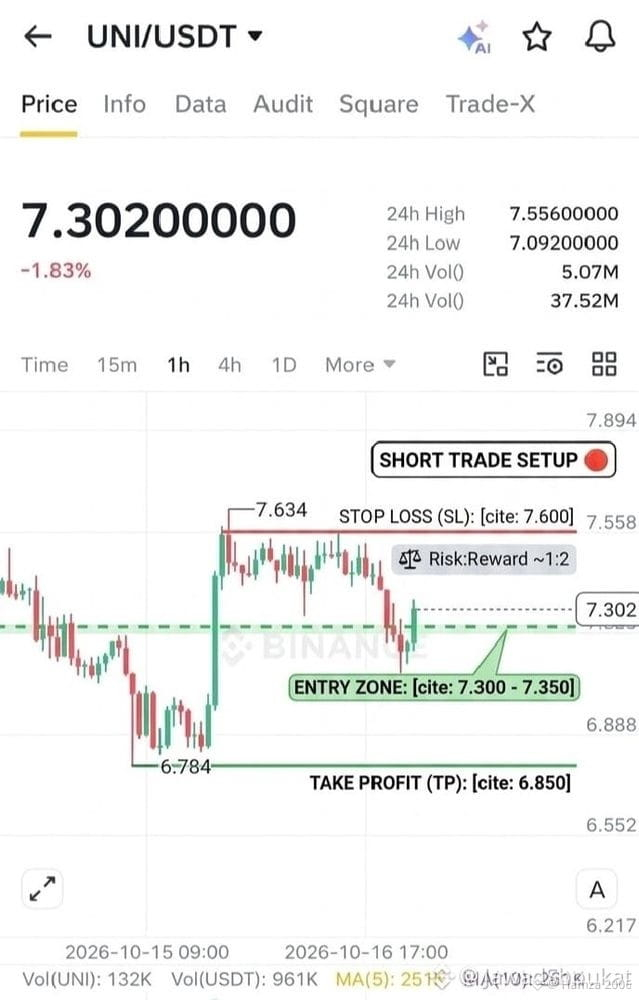
$UNI has broken down past its previous local support levels, dropping roughly 5.86% over the last session to sit at $7.11.
The asset has experienced high distribution over consecutive hours, forcing its price action below the short-to-medium term Exponential Moving Averages (EMA 7, 25, and 99) and piercing its lower Bollinger Band.
Intense intra day
profit-taking alongside massive whale and net institutional selling outflows (exceeding $1.7M) have overshadowed early ecosystem tailwinds, placing UNI in a strict short-term bearish control zone.
{spot}(UNIUSDT)
#ADPJobSurge #BinanceHODLEerMMT #PrivacyCoinSurge
$UNI has broken down past its previous local support levels, dropping roughly 5.86% over the last session to sit at $7.11.
The asset has experienced high distribution over consecutive hours, forcing its price action below the short-to-medium term Exponential Moving Averages (EMA 7, 25, and 99) and piercing its lower Bollinger Band.
Intense intra day
profit-taking alongside massive whale and net institutional selling outflows (exceeding $1.7M) have overshadowed early ecosystem tailwinds, placing UNI in a strict short-term bearish control zone.
#ADPJobSurge #BinanceHODLEerMMT #PrivacyCoinSurge
The asset has experienced high distribution over consecutive hours, forcing its price action below the short-to-medium term Exponential Moving Averages (EMA 7, 25, and 99) and piercing its lower Bollinger Band.
Intense intra day
profit-taking alongside massive whale and net institutional selling outflows (exceeding $1.7M) have overshadowed early ecosystem tailwinds, placing UNI in a strict short-term bearish control zone.
#ADPJobSurge #BinanceHODLEerMMT #PrivacyCoinSurge
121
·
--
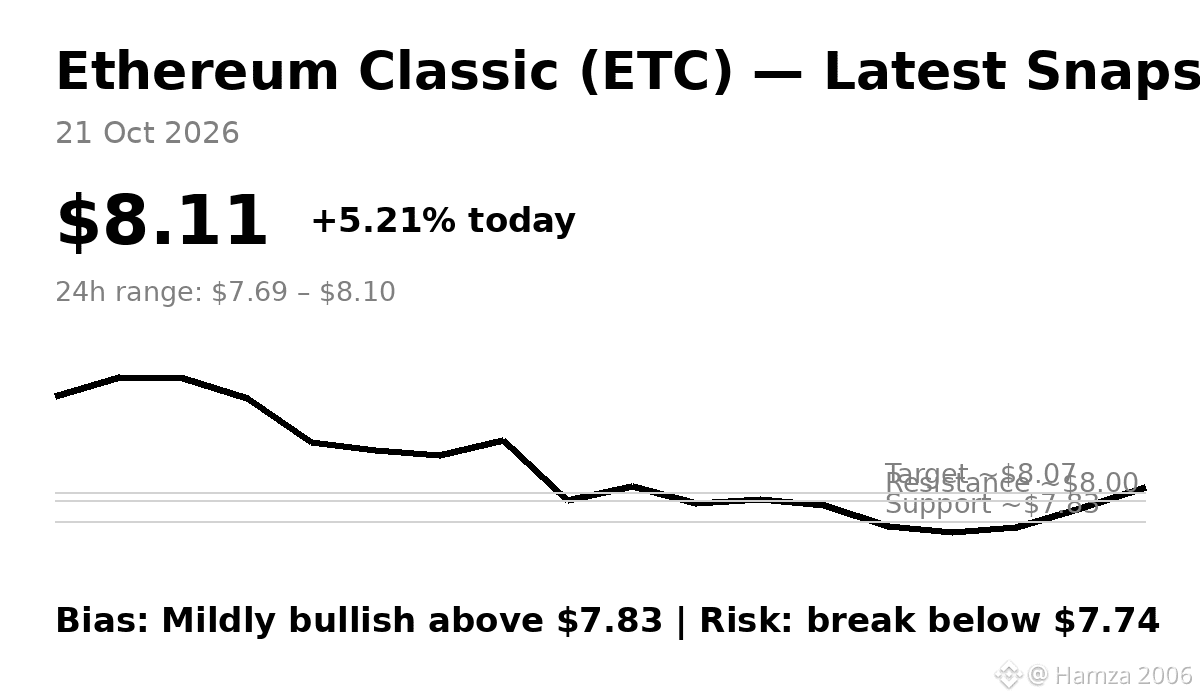
Current price: around $8.11, up about 5.2% today. $ETC has recently recovered from the $7.7 area and is showing improving short-term momentum.
Technical view:
🟢 Bullish while above: ~$7.83
🎯 Near-term target: ~$8.07–$8.20
🔴 Important downside level: ~$7.74
RSI and several technical indicators currently lean bullish, although ETC is approaching short-term resistance.
Overall: Mildly bullish 📈 — if ETC can hold above $7.83 and break decisively above $8.00–$8.10, another upward move becomes more likely. A drop below $7.74 would weaken the setup.
#ADPJobSurge #BinanceHODLEerMMT #PrivacyCoinSurge
{spot}(ETCUSDT)
Current price: around $8.11, up about 5.2% today. $ETC has recently recovered from the $7.7 area and is showing improving short-term momentum.
Technical view:
🟢 Bullish while above: ~$7.83
🎯 Near-term target: ~$8.07–$8.20
🔴 Important downside level: ~$7.74
RSI and several technical indicators currently lean bullish, although ETC is approaching short-term resistance.
Overall: Mildly bullish 📈 — if ETC can hold above $7.83 and break decisively above $8.00–$8.10, another upward move becomes more likely. A drop below $7.74 would weaken the setup.
#ADPJobSurge #BinanceHODLEerMMT #PrivacyCoinSurge
Technical view:
🟢 Bullish while above: ~$7.83
🎯 Near-term target: ~$8.07–$8.20
🔴 Important downside level: ~$7.74
RSI and several technical indicators currently lean bullish, although ETC is approaching short-term resistance.
Overall: Mildly bullish 📈 — if ETC can hold above $7.83 and break decisively above $8.00–$8.10, another upward move becomes more likely. A drop below $7.74 would weaken the setup.
#ADPJobSurge #BinanceHODLEerMMT #PrivacyCoinSurge
111

·
--
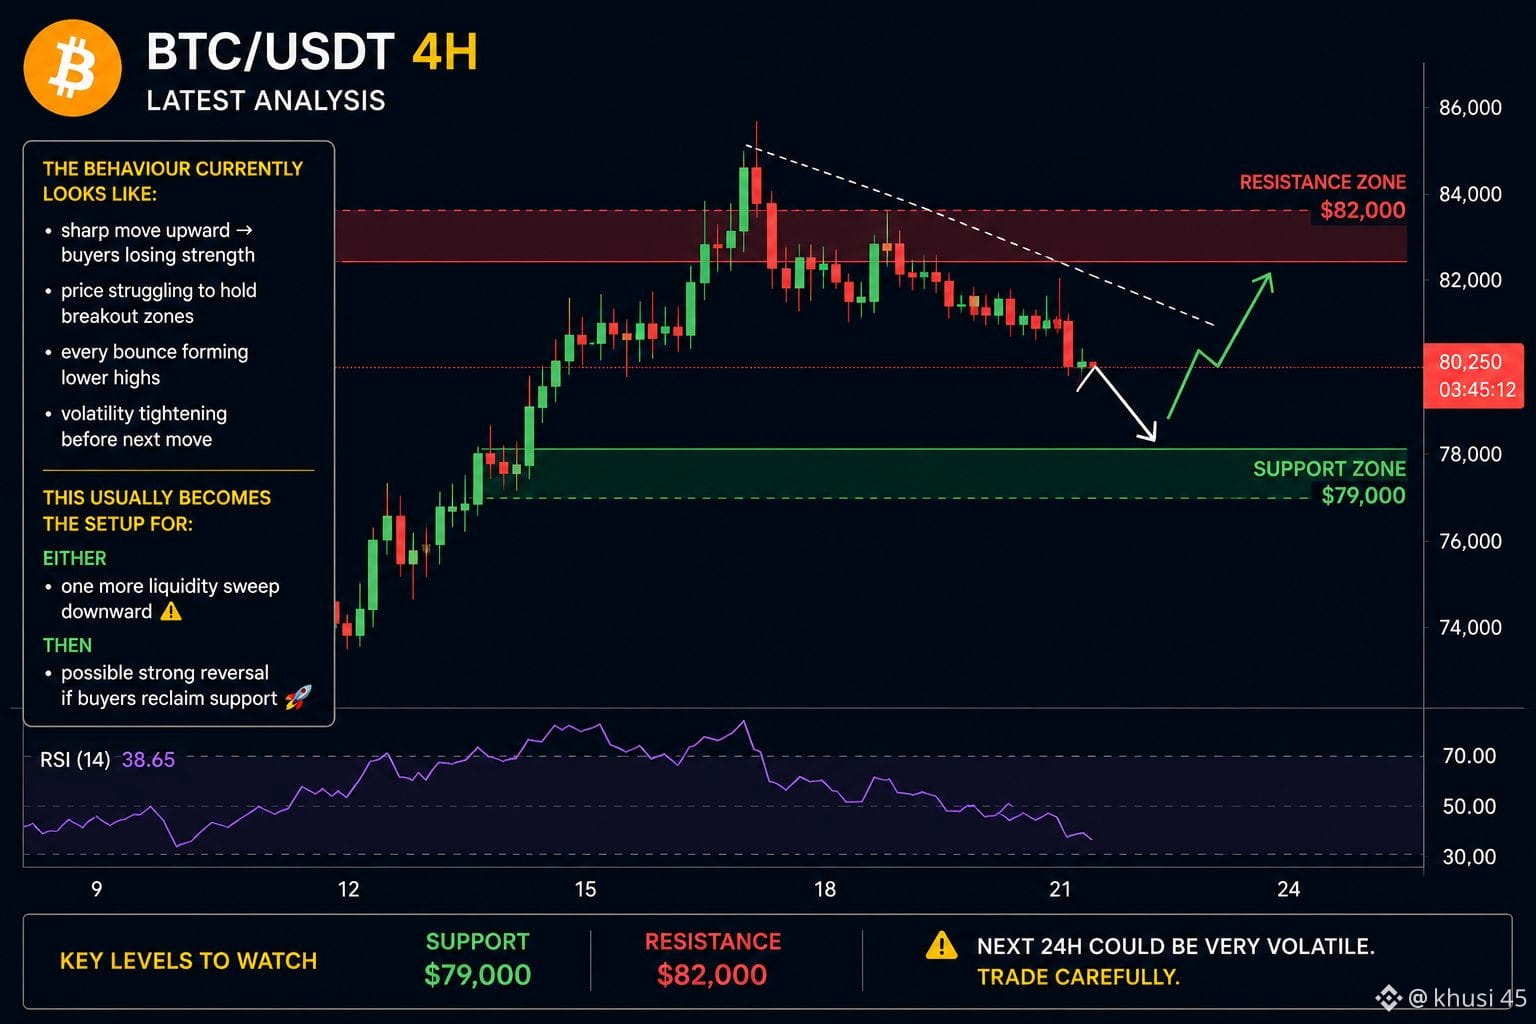
$BTC 4H is showing weak momentum near resistance.
The behaviour currently looks like:
• sharp move upward → buyers losing strength
• price struggling to hold breakout zones
• every bounce forming lower highs
• volatility tightening before next
move
This usually becomes the setup for:
either
• one more liquidity sweep downward ⚠️
then
• possible strong reversal if buyers reclaim support 🚀
Key zone to watch: Support: $79K
Resistance: $82K
Next 24H could be very volatile. Trade carefully.
#ADPJobSurge #BinanceHODLerMMT #StrategyBTCSalesLimitedToDividends
#BlackRockPlansMoneyMarketFundsforStablecoinUsers
{spot}(BTCUSDT)
$BTC 4H is showing weak momentum near resistance.
The behaviour currently looks like:
• sharp move upward → buyers losing strength
• price struggling to hold breakout zones
• every bounce forming lower highs
• volatility tightening before next
move
This usually becomes the setup for:
either
• one more liquidity sweep downward ⚠️
then
• possible strong reversal if buyers reclaim support 🚀
Key zone to watch: Support: $79K
Resistance: $82K
Next 24H could be very volatile. Trade carefully.
#ADPJobSurge #BinanceHODLerMMT #StrategyBTCSalesLimitedToDividends
#BlackRockPlansMoneyMarketFundsforStablecoinUsers
The behaviour currently looks like:
• sharp move upward → buyers losing strength
• price struggling to hold breakout zones
• every bounce forming lower highs
• volatility tightening before next
move
This usually becomes the setup for:
either
• one more liquidity sweep downward ⚠️
then
• possible strong reversal if buyers reclaim support 🚀
Key zone to watch: Support: $79K
Resistance: $82K
Next 24H could be very volatile. Trade carefully.
#ADPJobSurge #BinanceHODLerMMT #StrategyBTCSalesLimitedToDividends
#BlackRockPlansMoneyMarketFundsforStablecoinUsers
9
204

·
--
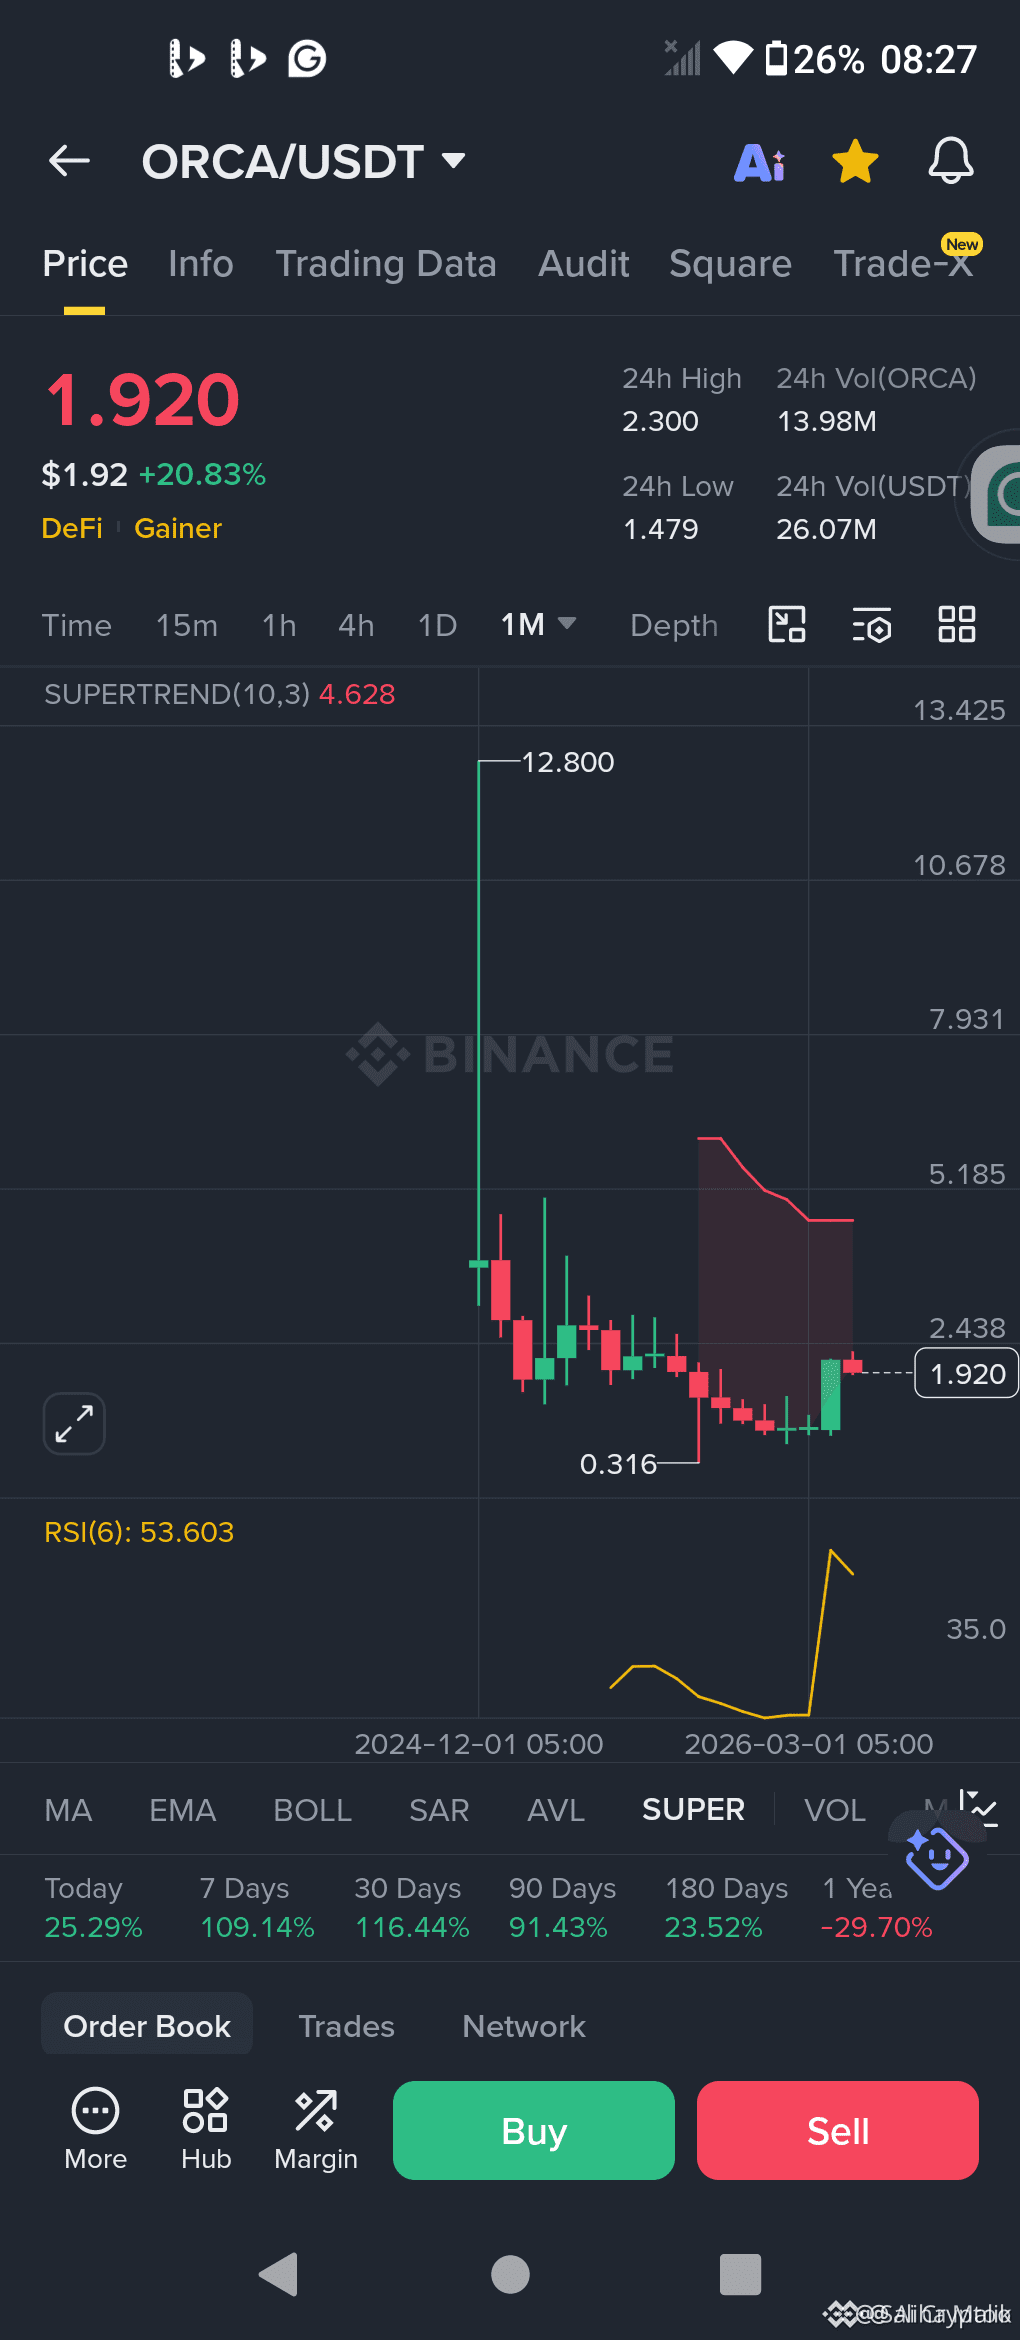
$ORCA This coin has only 75M total supply. You can get a good profit from the coin in a minimum time.
#ADPJobSurge #BinanceHODLerMMT #ORCA
{spot}(ORCAUSDT)
$ORCA This coin has only 75M total supply. You can get a good profit from the coin in a minimum time.
#ADPJobSurge #BinanceHODLerMMT #ORCA
#ADPJobSurge #BinanceHODLerMMT #ORCA
68

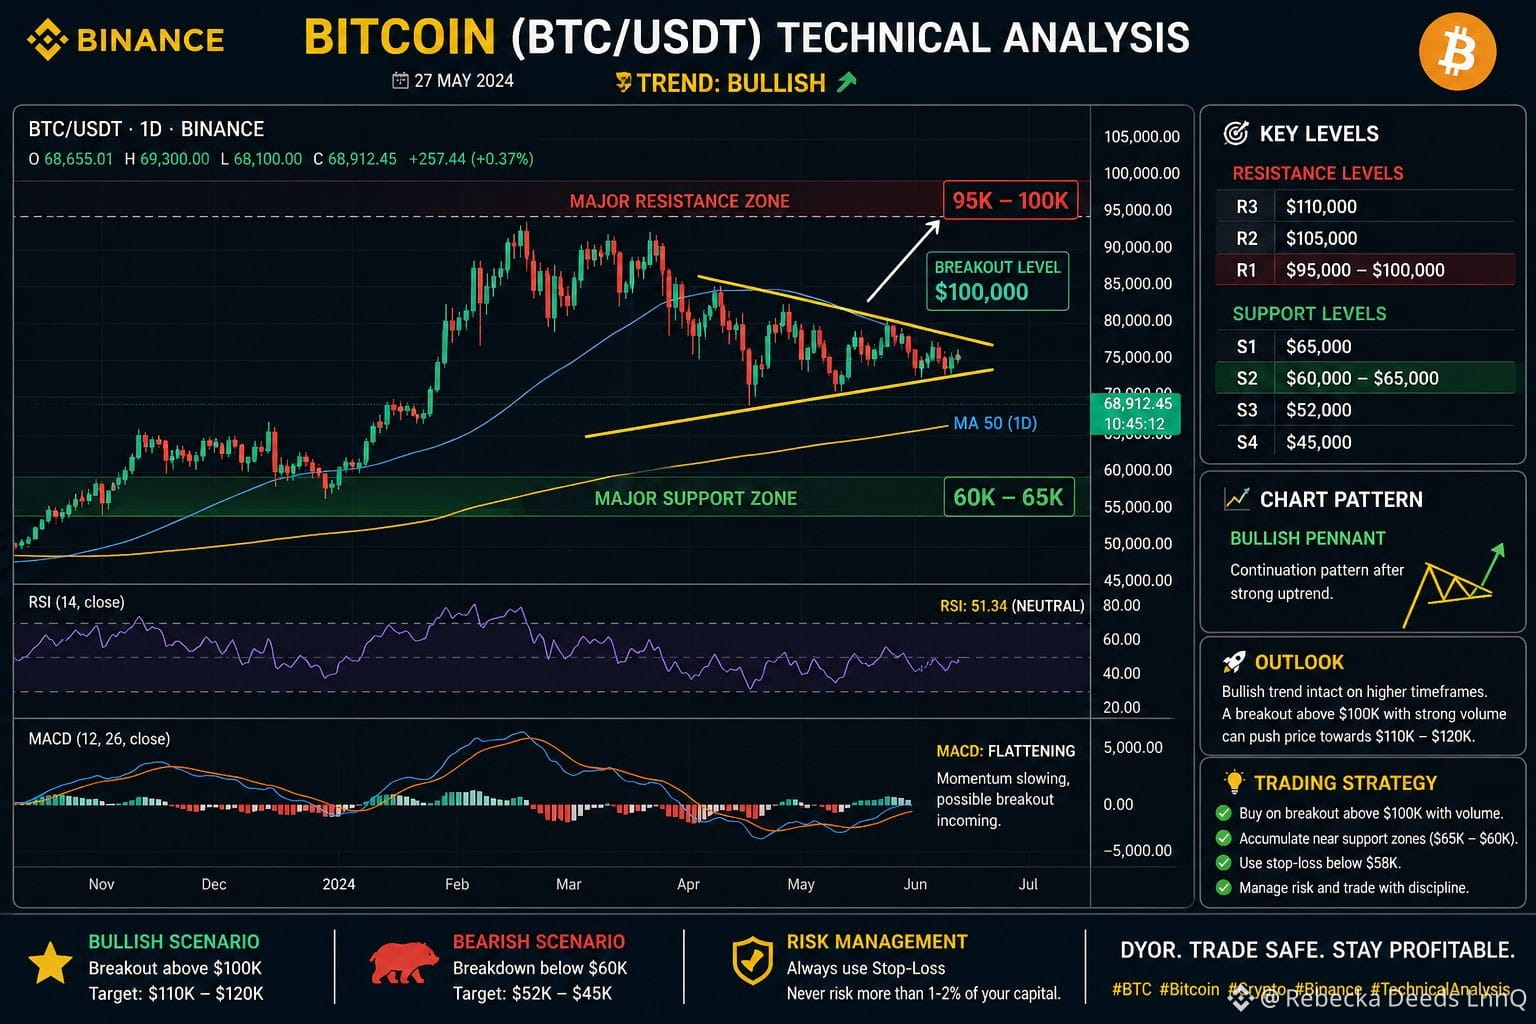
$BTC is currently trading in a consolidation phase after a strong bullish run. Price action suggests a potential breakout setup.
📉 Key Levels:
Resistance: $95K – $100K
Support: $60K – $65K
📈 Indicators:
RSI: Neutral (45–55 range) → No overbought/oversold signal
MACD: Flattening → Momentum slowing, possible breakout incoming
50 MA: Acting as dynamic support
200 MA: Strong long-term bullish trend intact
📊 Trend Analysis:
BTC is forming a bullish continuation pattern (flag/triangle). A breakout above $100K could push price toward $110K–$120K.
⚠️ Bearish Scenario:
If BTC breaks below $60K, we may see further downside toward $52K levels.
💡 Trading Strategy:
Buy on breakout above $100K with volume confirmation
Accumulate near support zones
Always use stop-loss (risk management is key)
📌 Conclusion:
Trend remains bullish on higher timeframes, but short-term consolidation suggests patience before the next big move.
#BTC #BitcoinDunyamiz #BinanceExplorers #ADPJobSurge #PrivacyCoinSurger
$BTC is currently trading in a consolidation phase after a strong bullish run. Price action suggests a potential breakout setup.
📉 Key Levels:
Resistance: $95K – $100K
Support: $60K – $65K
📈 Indicators:
RSI: Neutral (45–55 range) → No overbought/oversold signal
MACD: Flattening → Momentum slowing, possible breakout incoming
50 MA: Acting as dynamic support
200 MA: Strong long-term bullish trend intact
📊 Trend Analysis:
BTC is forming a bullish continuation pattern (flag/triangle). A breakout above $100K could push price toward $110K–$120K.
⚠️ Bearish Scenario:
If BTC breaks below $60K, we may see further downside toward $52K levels.
💡 Trading Strategy:
Buy on breakout above $100K with volume confirmation
Accumulate near support zones
Always use stop-loss (risk management is key)
📌 Conclusion:
Trend remains bullish on higher timeframes, but short-term consolidation suggests patience before the next big move.
#BTC #BitcoinDunyamiz #BinanceExplorers #ADPJobSurge #PrivacyCoinSurger
📉 Key Levels:
Resistance: $95K – $100K
Support: $60K – $65K
📈 Indicators:
RSI: Neutral (45–55 range) → No overbought/oversold signal
MACD: Flattening → Momentum slowing, possible breakout incoming
50 MA: Acting as dynamic support
200 MA: Strong long-term bullish trend intact
📊 Trend Analysis:
BTC is forming a bullish continuation pattern (flag/triangle). A breakout above $100K could push price toward $110K–$120K.
⚠️ Bearish Scenario:
If BTC breaks below $60K, we may see further downside toward $52K levels.
💡 Trading Strategy:
Buy on breakout above $100K with volume confirmation
Accumulate near support zones
Always use stop-loss (risk management is key)
📌 Conclusion:
Trend remains bullish on higher timeframes, but short-term consolidation suggests patience before the next big move.
#BTC #BitcoinDunyamiz #BinanceExplorers #ADPJobSurge #PrivacyCoinSurger
7
109
·
--
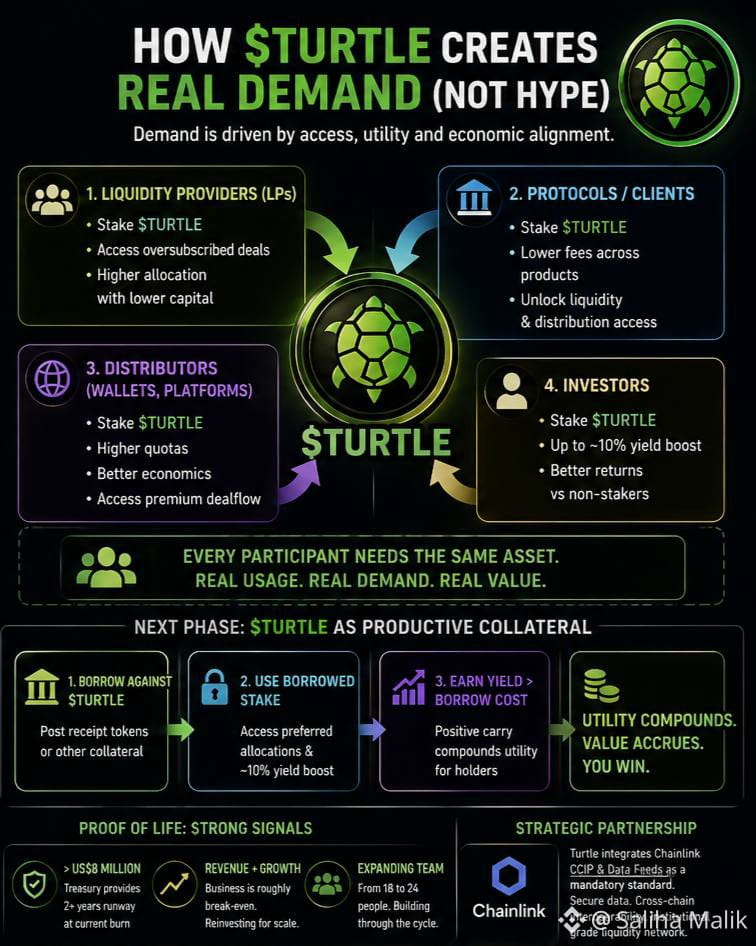
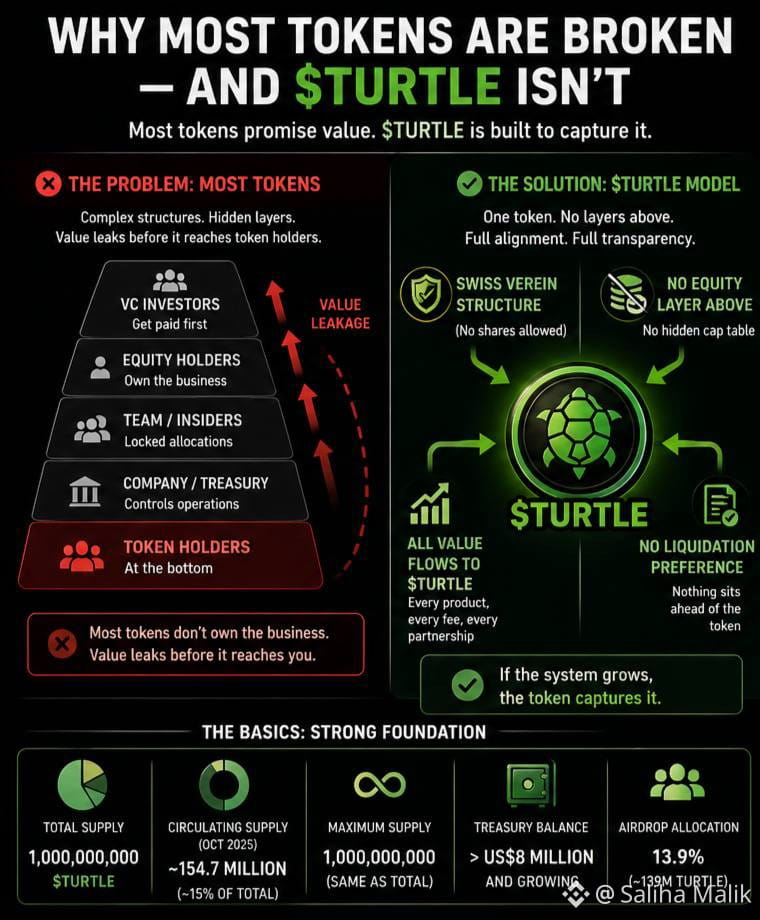
INTRODUCING $TURTLE : THE FIRST TOKEN WHERE VALUE DOESN’T LEAK UPWARD
$TURTLE – Why It’s Different?
|Problem with most tokens:
•Complex structures (VCs, equity holders, insiders above token holders)
•Value leakage before it reaches holders
•Token holders sit at the bottom
$TURTLE Model:
•One token structure (no equity layer above)
•Swiss Verein structure (no shares allowed)
•No liquidation preference
•Full transparency & alignment
•All product value flows to Turtle
|Token Basics :
•Total Supply: 1B
•Circulating: ~154.7M (~15%)
•Max Supply: 1B
•Treasury: $8M+ and growing
•Airdrop Allocation: 13.9%
Conclusion :
If the ecosystem grows, Turtle captures the value directly — no hidden layers.
#ADPJobSurge #BinanceHODLerMMT #PrivacyCoinSurge #BinanceSquareTalks
{spot}(TURTLEUSDT)
INTRODUCING $TURTLE : THE FIRST TOKEN WHERE VALUE DOESN’T LEAK UPWARD
$TURTLE – Why It’s Different?
|Problem with most tokens:
•Complex structures (VCs, equity holders, insiders above token holders)
•Value leakage before it reaches holders
•Token holders sit at the bottom
$TURTLE Model:
•One token structure (no equity layer above)
•Swiss Verein structure (no shares allowed)
•No liquidation preference
•Full transparency & alignment
•All product value flows to Turtle
|Token Basics :
•Total Supply: 1B
•Circulating: ~154.7M (~15%)
•Max Supply: 1B
•Treasury: $8M+ and growing
•Airdrop Allocation: 13.9%
Conclusion :
If the ecosystem grows, Turtle captures the value directly — no hidden layers.
#ADPJobSurge #BinanceHODLerMMT #PrivacyCoinSurge #BinanceSquareTalks
$TURTLE – Why It’s Different?
|Problem with most tokens:
•Complex structures (VCs, equity holders, insiders above token holders)
•Value leakage before it reaches holders
•Token holders sit at the bottom
$TURTLE Model:
•One token structure (no equity layer above)
•Swiss Verein structure (no shares allowed)
•No liquidation preference
•Full transparency & alignment
•All product value flows to Turtle
|Token Basics :
•Total Supply: 1B
•Circulating: ~154.7M (~15%)
•Max Supply: 1B
•Treasury: $8M+ and growing
•Airdrop Allocation: 13.9%
Conclusion :
If the ecosystem grows, Turtle captures the value directly — no hidden layers.
#ADPJobSurge #BinanceHODLerMMT #PrivacyCoinSurge #BinanceSquareTalks
142
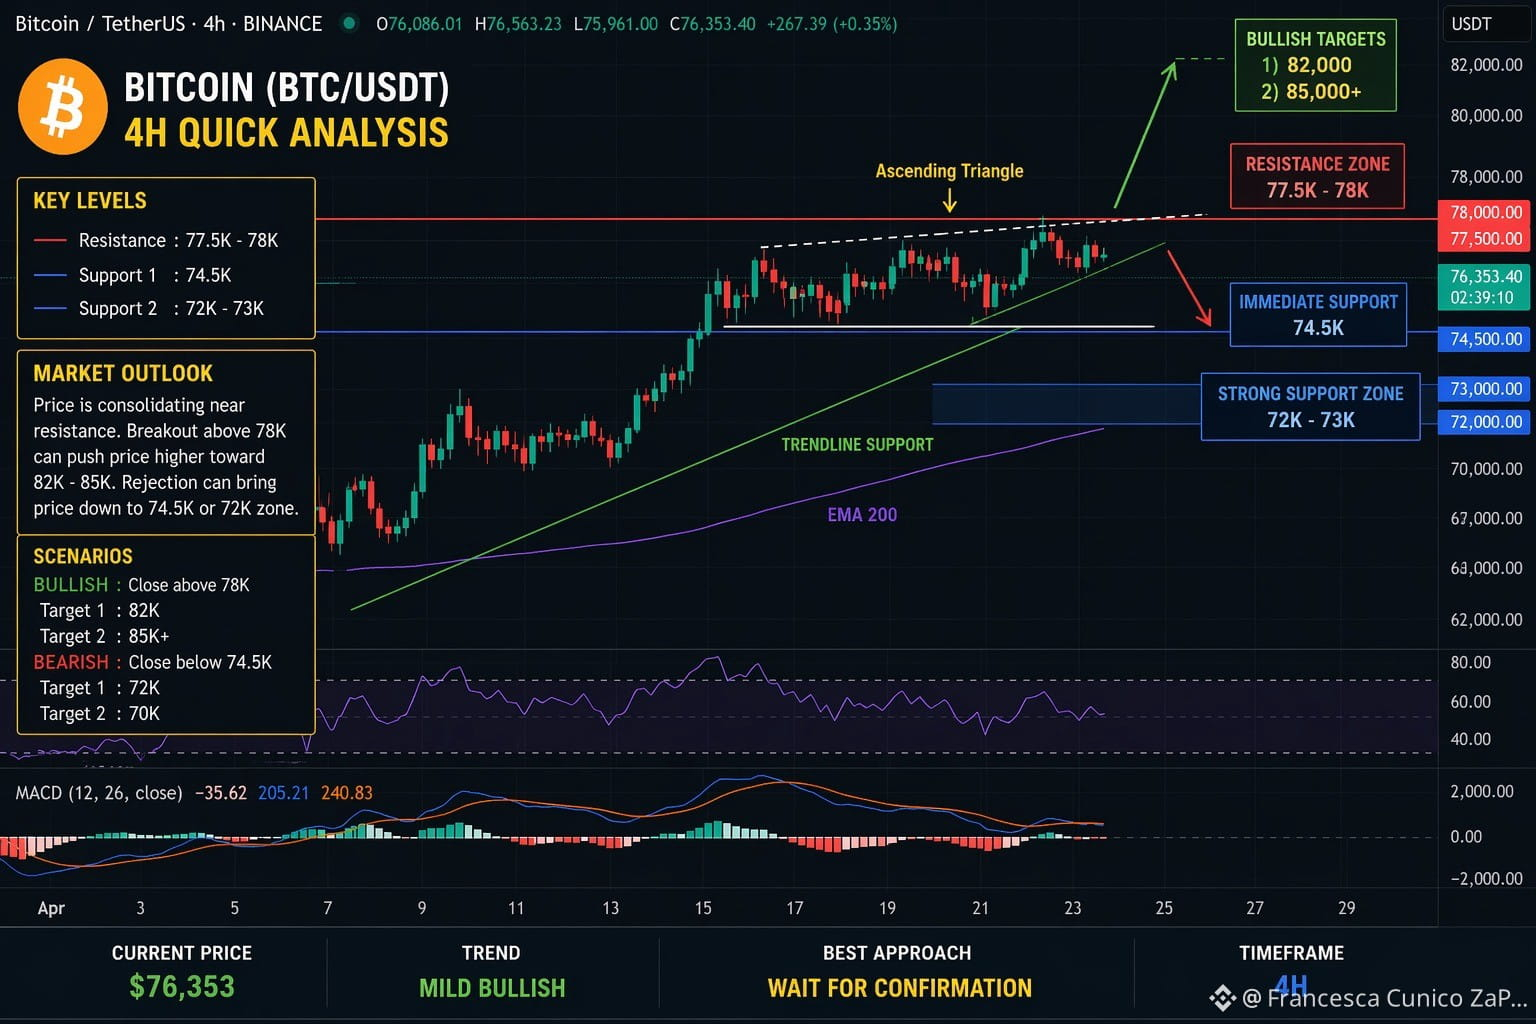
$BTC 4H is showing classic distribution style sliding
Price Range: Trading around $75K–$78K, recently tested ~$78K resistance
Trend: Recovery phase → cautiously bullish
Structure: Higher lows forming → buyers still in control
Resistance Zone: $77.5K – $78K (major decision level)
Support Levels:
$74.5K (short-term)
$70K–$73K (strong base)
Momentum: Slowing near resistance → consolidation phase
Market Behavior: Acting like a risk asset (moves with global sentiment)
Drivers:
Institutional buying
Short liquidations (fueling rallies)
Improved macro sentiment
Bullish Scenario:
Break above $78K → $82K–$90K possible
Bearish Scenario:
Rejection → pullback to $72K–$70K zone
Overall Insight:
👉 Market is at a critical breakout or rejection point
👉 Best approach: wait for confirmation, avoid guessing
{spot}(BTCUSDT)
#ADPJobSurge #JustinSunSuesWorldLibertyFinancial #KelpDAOExploitFreeze #MarketRebound
$BTC 4H is showing classic distribution style sliding
Price Range: Trading around $75K–$78K, recently tested ~$78K resistance
Trend: Recovery phase → cautiously bullish
Structure: Higher lows forming → buyers still in control
Resistance Zone: $77.5K – $78K (major decision level)
Support Levels:
$74.5K (short-term)
$70K–$73K (strong base)
Momentum: Slowing near resistance → consolidation phase
Market Behavior: Acting like a risk asset (moves with global sentiment)
Drivers:
Institutional buying
Short liquidations (fueling rallies)
Improved macro sentiment
Bullish Scenario:
Break above $78K → $82K–$90K possible
Bearish Scenario:
Rejection → pullback to $72K–$70K zone
Overall Insight:
👉 Market is at a critical breakout or rejection point
👉 Best approach: wait for confirmation, avoid guessing
#ADPJobSurge #JustinSunSuesWorldLibertyFinancial #KelpDAOExploitFreeze #MarketRebound
Price Range: Trading around $75K–$78K, recently tested ~$78K resistance
Trend: Recovery phase → cautiously bullish
Structure: Higher lows forming → buyers still in control
Resistance Zone: $77.5K – $78K (major decision level)
Support Levels:
$74.5K (short-term)
$70K–$73K (strong base)
Momentum: Slowing near resistance → consolidation phase
Market Behavior: Acting like a risk asset (moves with global sentiment)
Drivers:
Institutional buying
Short liquidations (fueling rallies)
Improved macro sentiment
Bullish Scenario:
Break above $78K → $82K–$90K possible
Bearish Scenario:
Rejection → pullback to $72K–$70K zone
Overall Insight:
👉 Market is at a critical breakout or rejection point
👉 Best approach: wait for confirmation, avoid guessing
#ADPJobSurge #JustinSunSuesWorldLibertyFinancial #KelpDAOExploitFreeze #MarketRebound
5
125

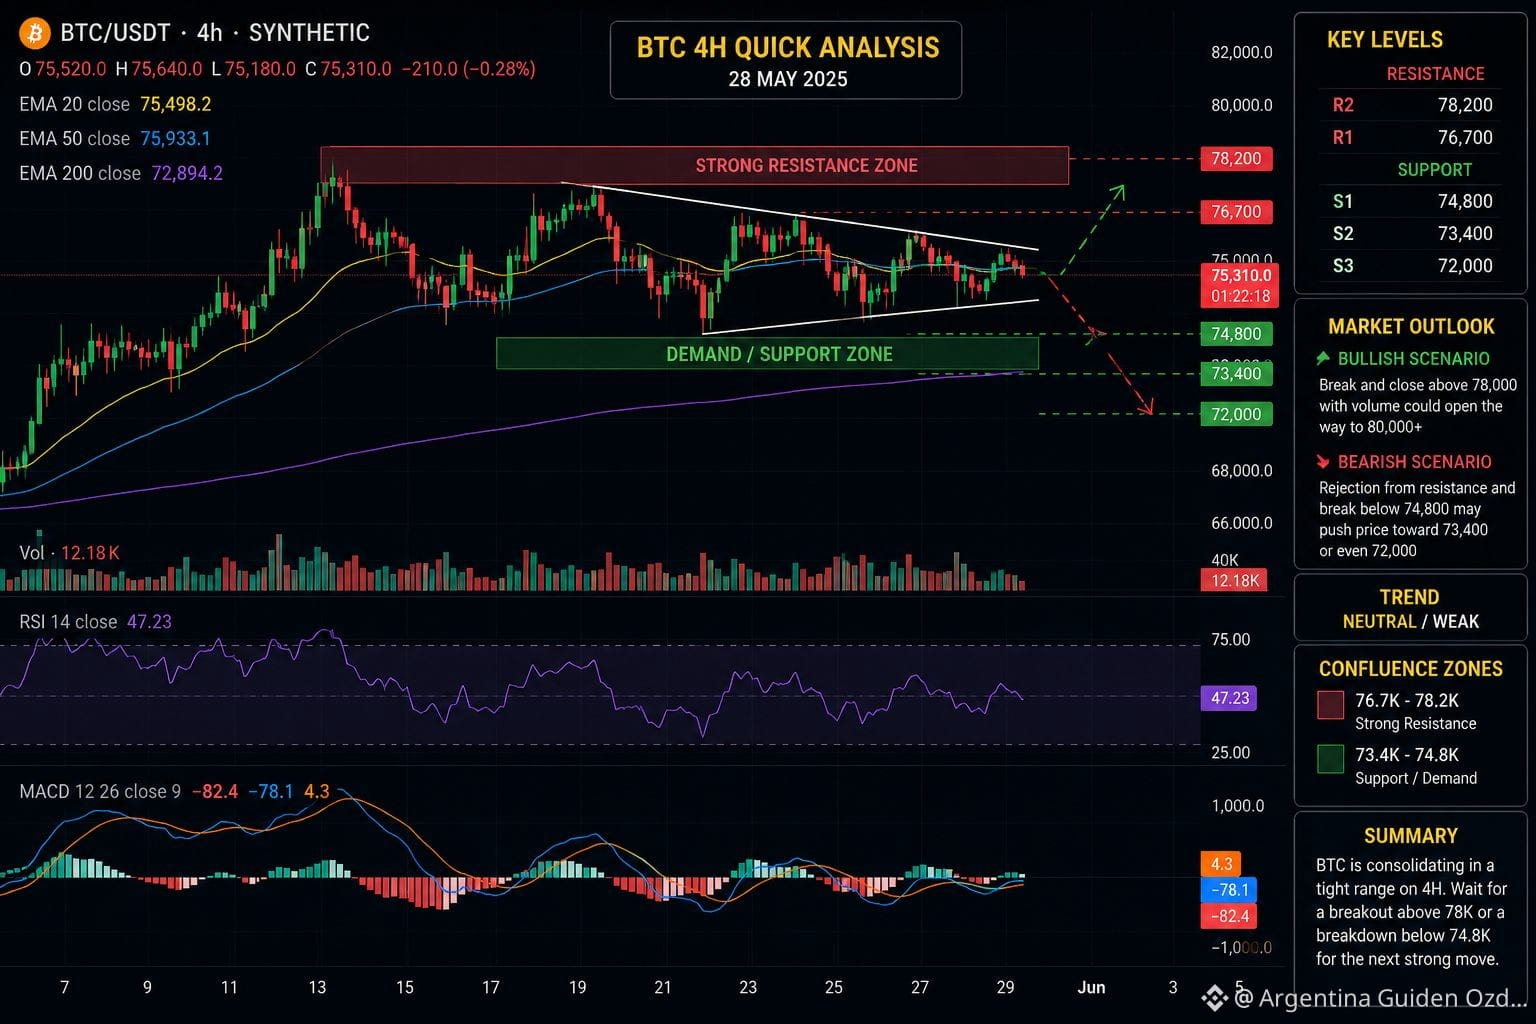
#$BTC Bitcoind — Quick 4H Outlook
Bitcoin is still trading in a corrective-to-sideways 4H structure after failing to reclaim the upper resistance cluster around the high-$70Ks / low-$80Ks. Current market tone is cautious with momentum trying to stabilize after recent volatility. �
investingLive +2
4H Structure
Bias: Neutral → slightly bearish unless BTC reclaims the key resistance zone.
Price is still respecting a lower-high structure on the 4H chart.
Bulls need a strong 4H candle close above the recent resistance band to flip momentum bullish again. �
Investing.com +1
Key Levels
Resistance: $77.8K → $79K
Major breakout zone: $80K+
Support: $74.5K → $73K
Critical support: ~$72K region
Momentum Read
Short-term RSI/momentum is recovering from oversold conditions, but not yet showing full trend reversal confirmation.
Volume remains relatively defensive compared to prior impulsive rallies.
If BTC loses the mid-$74Ks support cleanly on 4H, downside acceleration toward low-$72Ks becomes likely.
Bullish Scenario
If BTC gets:
a clean 4H close above ~$79K, and
holds above it on retest,
then continuation toward:
$81K
$83.5K
possibly $86K
becomes more probable. �
Investing.com +1
Bearish Scenario
If rejection continues below resistance:
expect continued range chop,
with possible sweep into $73K–$74K liquidity before any stronger bounce.
Trade Psychology (4H)
Right now this looks more like:
accumulation/range repair than a confirmed trend breakout.
Market is waiting for a decisive catalyst + volume expansion.
Simple 4H Setup
Bullish above: $79K
Bearish below: $74.5K
No-trade chop zone: between those levels.
�
investingLive +3
#ADPJobSurge #PrivacyCoinSignals
#BinanceHerYerde
{spot}(BTCUSDT)
#$BTC Bitcoind — Quick 4H Outlook
Bitcoin is still trading in a corrective-to-sideways 4H structure after failing to reclaim the upper resistance cluster around the high-$70Ks / low-$80Ks. Current market tone is cautious with momentum trying to stabilize after recent volatility. �
investingLive +2
4H Structure
Bias: Neutral → slightly bearish unless BTC reclaims the key resistance zone.
Price is still respecting a lower-high structure on the 4H chart.
Bulls need a strong 4H candle close above the recent resistance band to flip momentum bullish again. �
Investing.com +1
Key Levels
Resistance: $77.8K → $79K
Major breakout zone: $80K+
Support: $74.5K → $73K
Critical support: ~$72K region
Momentum Read
Short-term RSI/momentum is recovering from oversold conditions, but not yet showing full trend reversal confirmation.
Volume remains relatively defensive compared to prior impulsive rallies.
If BTC loses the mid-$74Ks support cleanly on 4H, downside acceleration toward low-$72Ks becomes likely.
Bullish Scenario
If BTC gets:
a clean 4H close above ~$79K, and
holds above it on retest,
then continuation toward:
$81K
$83.5K
possibly $86K
becomes more probable. �
Investing.com +1
Bearish Scenario
If rejection continues below resistance:
expect continued range chop,
with possible sweep into $73K–$74K liquidity before any stronger bounce.
Trade Psychology (4H)
Right now this looks more like:
accumulation/range repair than a confirmed trend breakout.
Market is waiting for a decisive catalyst + volume expansion.
Simple 4H Setup
Bullish above: $79K
Bearish below: $74.5K
No-trade chop zone: between those levels.
�
investingLive +3
#ADPJobSurge #PrivacyCoinSignals
#BinanceHerYerde
Bitcoin is still trading in a corrective-to-sideways 4H structure after failing to reclaim the upper resistance cluster around the high-$70Ks / low-$80Ks. Current market tone is cautious with momentum trying to stabilize after recent volatility. �
investingLive +2
4H Structure
Bias: Neutral → slightly bearish unless BTC reclaims the key resistance zone.
Price is still respecting a lower-high structure on the 4H chart.
Bulls need a strong 4H candle close above the recent resistance band to flip momentum bullish again. �
Investing.com +1
Key Levels
Resistance: $77.8K → $79K
Major breakout zone: $80K+
Support: $74.5K → $73K
Critical support: ~$72K region
Momentum Read
Short-term RSI/momentum is recovering from oversold conditions, but not yet showing full trend reversal confirmation.
Volume remains relatively defensive compared to prior impulsive rallies.
If BTC loses the mid-$74Ks support cleanly on 4H, downside acceleration toward low-$72Ks becomes likely.
Bullish Scenario
If BTC gets:
a clean 4H close above ~$79K, and
holds above it on retest,
then continuation toward:
$81K
$83.5K
possibly $86K
becomes more probable. �
Investing.com +1
Bearish Scenario
If rejection continues below resistance:
expect continued range chop,
with possible sweep into $73K–$74K liquidity before any stronger bounce.
Trade Psychology (4H)
Right now this looks more like:
accumulation/range repair than a confirmed trend breakout.
Market is waiting for a decisive catalyst + volume expansion.
Simple 4H Setup
Bullish above: $79K
Bearish below: $74.5K
No-trade chop zone: between those levels.
�
investingLive +3
#ADPJobSurge #PrivacyCoinSignals
#BinanceHerYerde
88

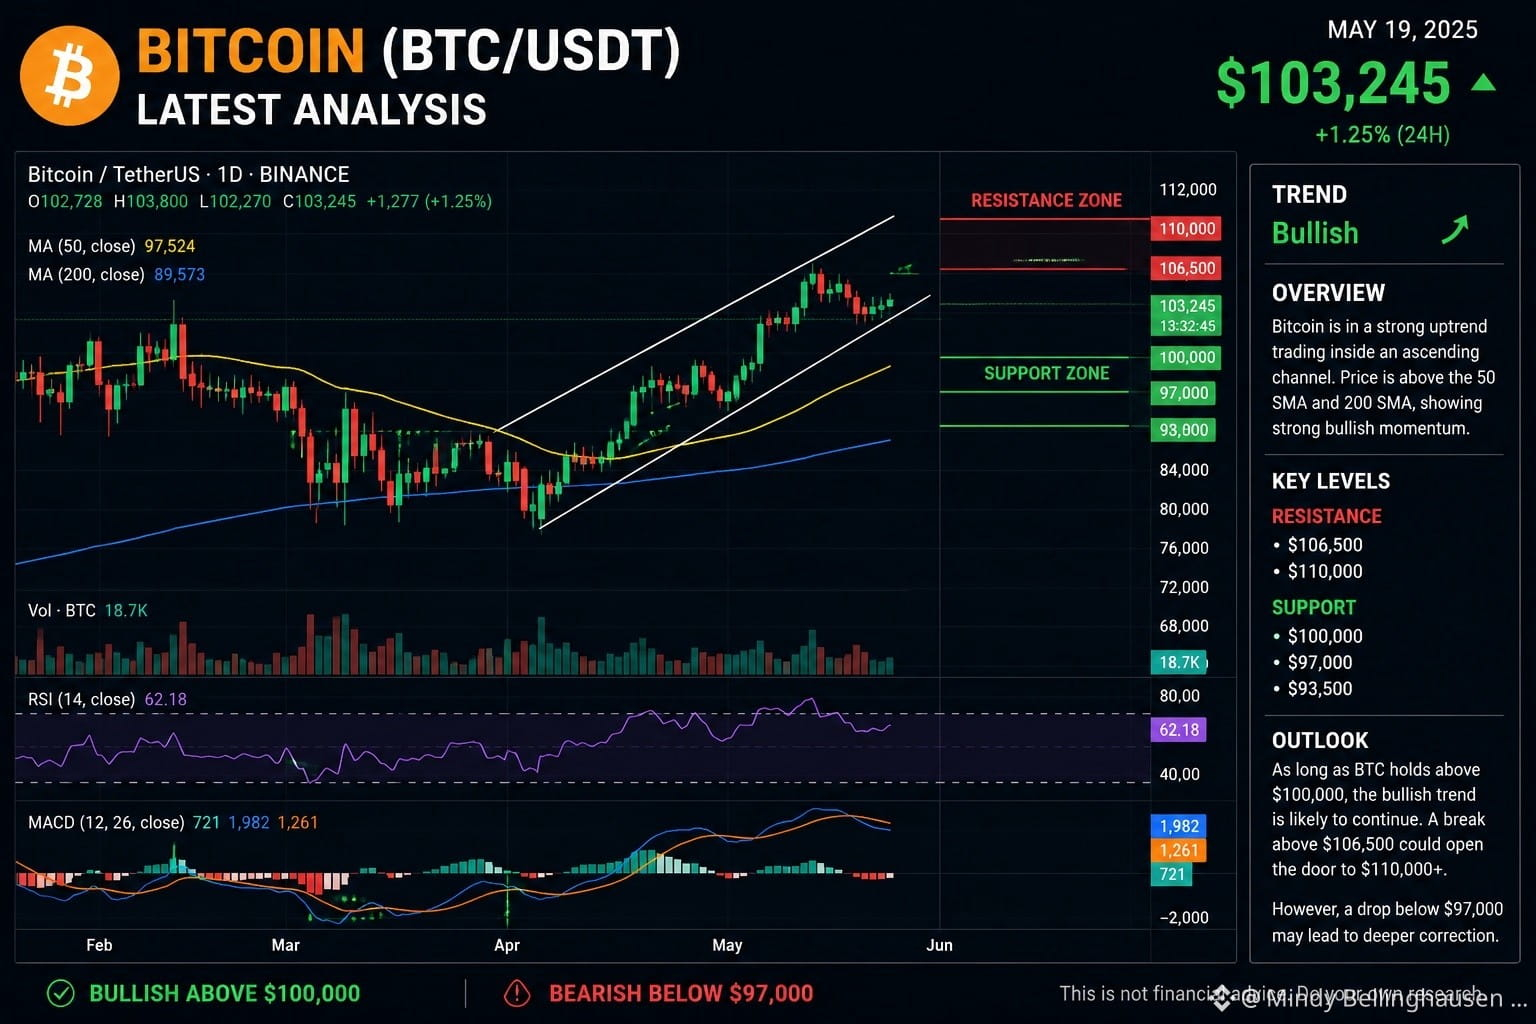
$BTC 4H is showing classic distribution style sliding Bitcoin continues to maintain a bullish market structure despite short-term volatility. Buyers are still defending key support zones, showing that overall momentum remains positive. If BTC successfully breaks above the next major resistance, we could see another strong bullish move in the coming sessions.
However, traders should remain cautious, as failure to hold support may trigger a healthy correction before the next leg up. Trading volume, ETF inflows, macroeconomic news, interest rate decisions, and market sentiment will be the key factors driving Bitcoin's next direction.
Key Outlook:
🟢 Trend: Bullish
📈 Watch for a breakout above resistance.
📉 A drop below support could lead to a short-term pullback.
Always use proper risk management and never invest more than you can afford to lose. This analysis is for educational purposes only and not financial advice.#ADPJobSurge #BinanceHODL #PrivacyCoinSurge #SolanaETF
{spot}(BTCUSDT)
$BTC 4H is showing classic distribution style sliding Bitcoin continues to maintain a bullish market structure despite short-term volatility. Buyers are still defending key support zones, showing that overall momentum remains positive. If BTC successfully breaks above the next major resistance, we could see another strong bullish move in the coming sessions.
However, traders should remain cautious, as failure to hold support may trigger a healthy correction before the next leg up. Trading volume, ETF inflows, macroeconomic news, interest rate decisions, and market sentiment will be the key factors driving Bitcoin's next direction.
Key Outlook:
🟢 Trend: Bullish
📈 Watch for a breakout above resistance.
📉 A drop below support could lead to a short-term pullback.
Always use proper risk management and never invest more than you can afford to lose. This analysis is for educational purposes only and not financial advice.#ADPJobSurge #BinanceHODL #PrivacyCoinSurge #SolanaETF
However, traders should remain cautious, as failure to hold support may trigger a healthy correction before the next leg up. Trading volume, ETF inflows, macroeconomic news, interest rate decisions, and market sentiment will be the key factors driving Bitcoin's next direction.
Key Outlook:
🟢 Trend: Bullish
📈 Watch for a breakout above resistance.
📉 A drop below support could lead to a short-term pullback.
Always use proper risk management and never invest more than you can afford to lose. This analysis is for educational purposes only and not financial advice.#ADPJobSurge #BinanceHODL #PrivacyCoinSurge #SolanaETF
111

·
--
$ETH Ethereum (ETH) Market Update – June 29, 2026
Ethereum (ETH) is trading with steady bullish momentum as buyers continue to defend key support levels. Strong network activity and healthy trading volume are supporting the current trend. If ETH breaks above the next resistance with strong volume, it could extend its upward move. Traders should still watch for short-term volatility near resistance.
Outlook: Bullish 📈
Key Levels: Support: Current demand zone | Resistance: Recent swing high
{spot}(ETHUSDT)
#ADPJobSurge #BinanceHODMMT #PrivacyCoinSurge
$ETH Ethereum (ETH) Market Update – June 29, 2026
Ethereum (ETH) is trading with steady bullish momentum as buyers continue to defend key support levels. Strong network activity and healthy trading volume are supporting the current trend. If ETH breaks above the next resistance with strong volume, it could extend its upward move. Traders should still watch for short-term volatility near resistance.
Outlook: Bullish 📈
Key Levels: Support: Current demand zone | Resistance: Recent swing high
#ADPJobSurge #BinanceHODMMT #PrivacyCoinSurge
Ethereum (ETH) is trading with steady bullish momentum as buyers continue to defend key support levels. Strong network activity and healthy trading volume are supporting the current trend. If ETH breaks above the next resistance with strong volume, it could extend its upward move. Traders should still watch for short-term volatility near resistance.
Outlook: Bullish 📈
Key Levels: Support: Current demand zone | Resistance: Recent swing high
#ADPJobSurge #BinanceHODMMT #PrivacyCoinSurge

37

·
--
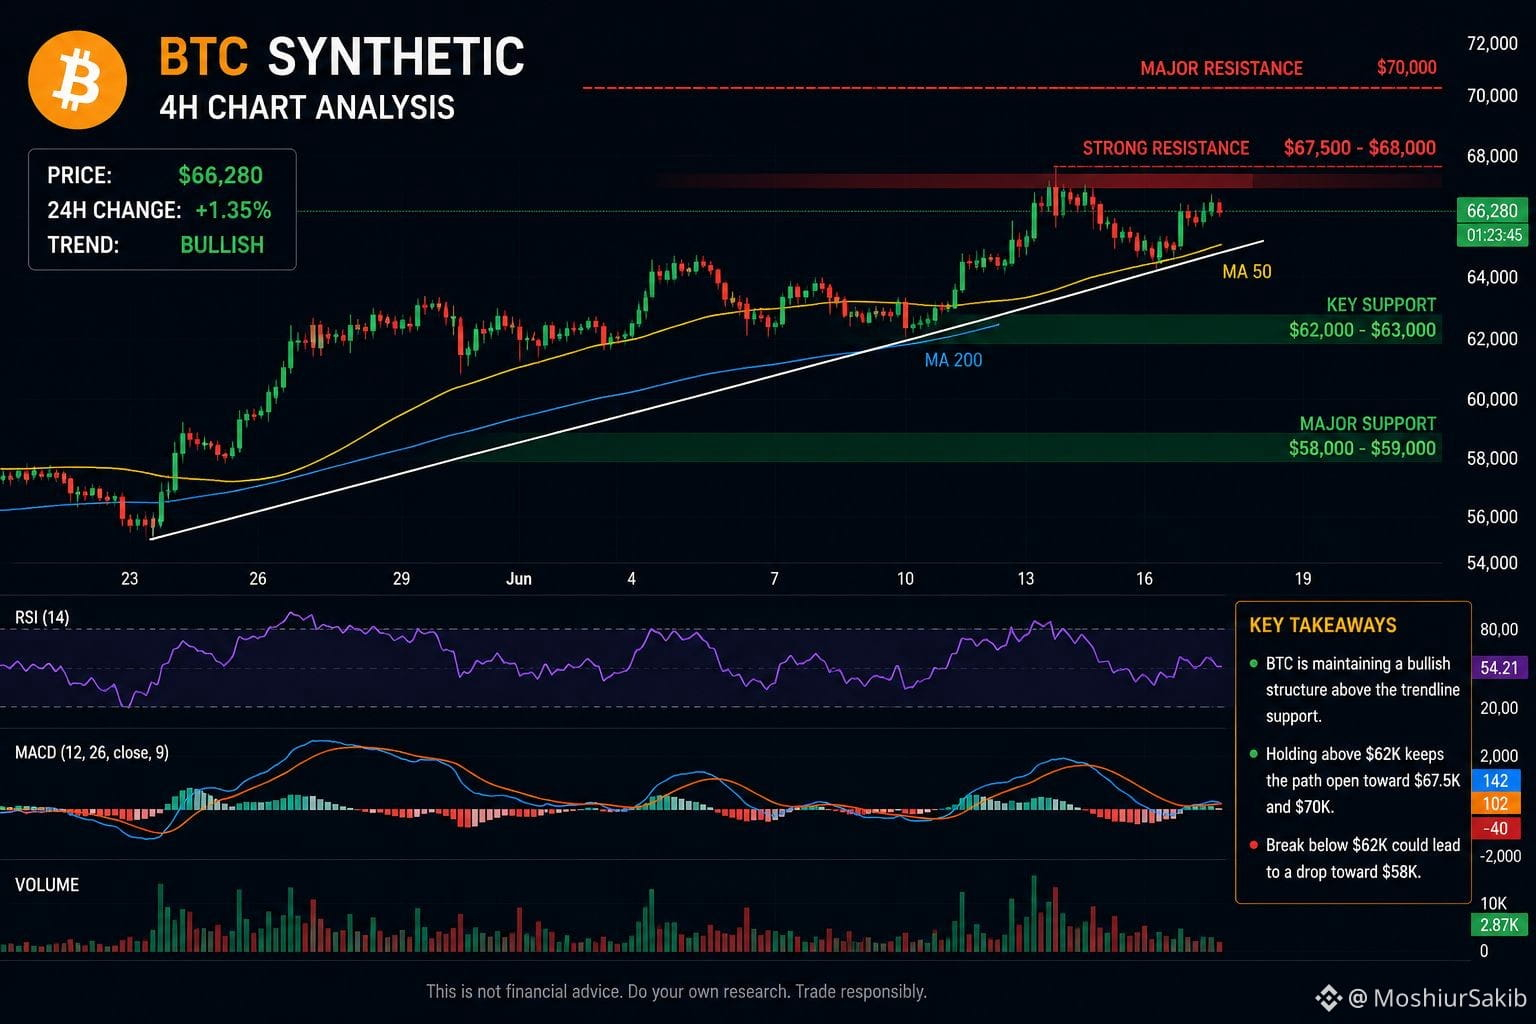
$BTC 4H is showing a classic distribution-style slide.
Price continues to print lower highs while upside momentum weakens, suggesting rallies are being sold rather than accumulated. Unless bulls can reclaim key resistance with strong volume, the risk remains tilted toward a support breakdown.
Key signals: • Lower highs forming • Fading bullish momentum • Repeated resistance rejections • Increasing downside pressure
A confirmed break of support could trigger a move into the next liquidity zone. Until then, BTC remains in a critical decision area.
{spot}(BTCUSDT)
#ADPJobSurge #YenNears40YearLow #BTCBelowMinerProductionCost5Months #TeslaLagsSpaceXInIPOWeek #SOXRises6.4%ToRecordHigh
$BTC 4H is showing a classic distribution-style slide.
Price continues to print lower highs while upside momentum weakens, suggesting rallies are being sold rather than accumulated. Unless bulls can reclaim key resistance with strong volume, the risk remains tilted toward a support breakdown.
Key signals: • Lower highs forming • Fading bullish momentum • Repeated resistance rejections • Increasing downside pressure
A confirmed break of support could trigger a move into the next liquidity zone. Until then, BTC remains in a critical decision area.
#ADPJobSurge #YenNears40YearLow #BTCBelowMinerProductionCost5Months #TeslaLagsSpaceXInIPOWeek #SOXRises6.4%ToRecordHigh
Price continues to print lower highs while upside momentum weakens, suggesting rallies are being sold rather than accumulated. Unless bulls can reclaim key resistance with strong volume, the risk remains tilted toward a support breakdown.
Key signals: • Lower highs forming • Fading bullish momentum • Repeated resistance rejections • Increasing downside pressure
A confirmed break of support could trigger a move into the next liquidity zone. Until then, BTC remains in a critical decision area.
#ADPJobSurge #YenNears40YearLow #BTCBelowMinerProductionCost5Months #TeslaLagsSpaceXInIPOWeek #SOXRises6.4%ToRecordHigh
86

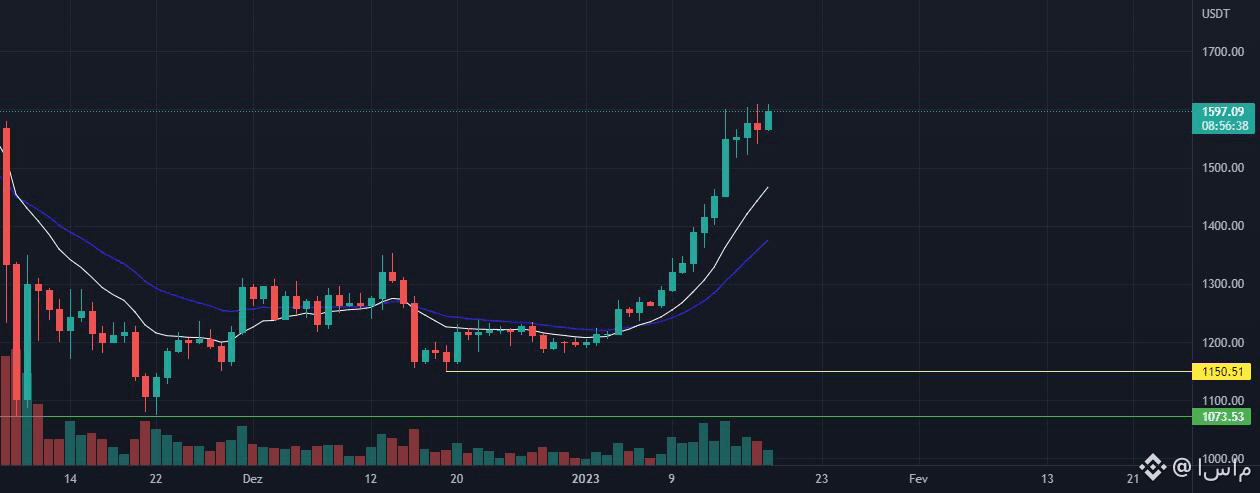
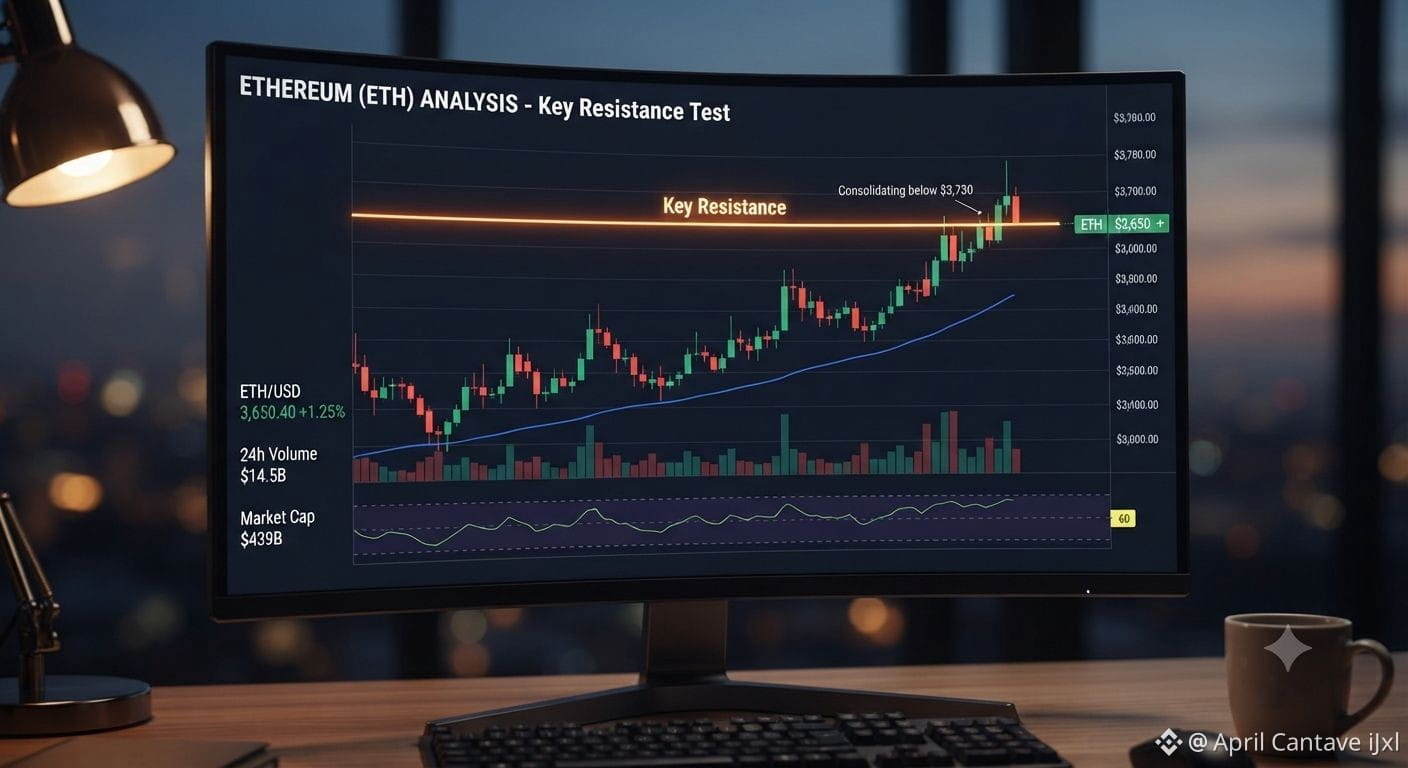
Ethereum (ETH) Latest Analysis: Navigating Key Resistance
Current Price Snapshot: Ethereum (ETH) is trading around $3,650 during the mid-week session, showing resilience despite broader market consolidation.
Technical Outlook:
Ethereum remains in a strong medium-term uptrend, consistently finding support above the 50-day moving average (the blue line in the chart below). The asset is currently facing a critical test at the $3,730 resistance level. This zone has proven difficult to break in recent attempts.
A decisive daily close above $3,730 would likely trigger renewed bullish momentum, potentially retesting the psychologically significant $4,000 level. Conversely, failure to hold current levels could see a pullback toward the $3,500 support zone.
{spot}(ETHUSDT)
$NVDAB #ADPJobSurge
Ethereum (ETH) Latest Analysis: Navigating Key Resistance
Current Price Snapshot: Ethereum (ETH) is trading around $3,650 during the mid-week session, showing resilience despite broader market consolidation.
Technical Outlook:
Ethereum remains in a strong medium-term uptrend, consistently finding support above the 50-day moving average (the blue line in the chart below). The asset is currently facing a critical test at the $3,730 resistance level. This zone has proven difficult to break in recent attempts.
A decisive daily close above $3,730 would likely trigger renewed bullish momentum, potentially retesting the psychologically significant $4,000 level. Conversely, failure to hold current levels could see a pullback toward the $3,500 support zone.
$NVDAB #ADPJobSurge
Current Price Snapshot: Ethereum (ETH) is trading around $3,650 during the mid-week session, showing resilience despite broader market consolidation.
Technical Outlook:
Ethereum remains in a strong medium-term uptrend, consistently finding support above the 50-day moving average (the blue line in the chart below). The asset is currently facing a critical test at the $3,730 resistance level. This zone has proven difficult to break in recent attempts.
A decisive daily close above $3,730 would likely trigger renewed bullish momentum, potentially retesting the psychologically significant $4,000 level. Conversely, failure to hold current levels could see a pullback toward the $3,500 support zone.
$NVDAB #ADPJobSurge
82

·
--
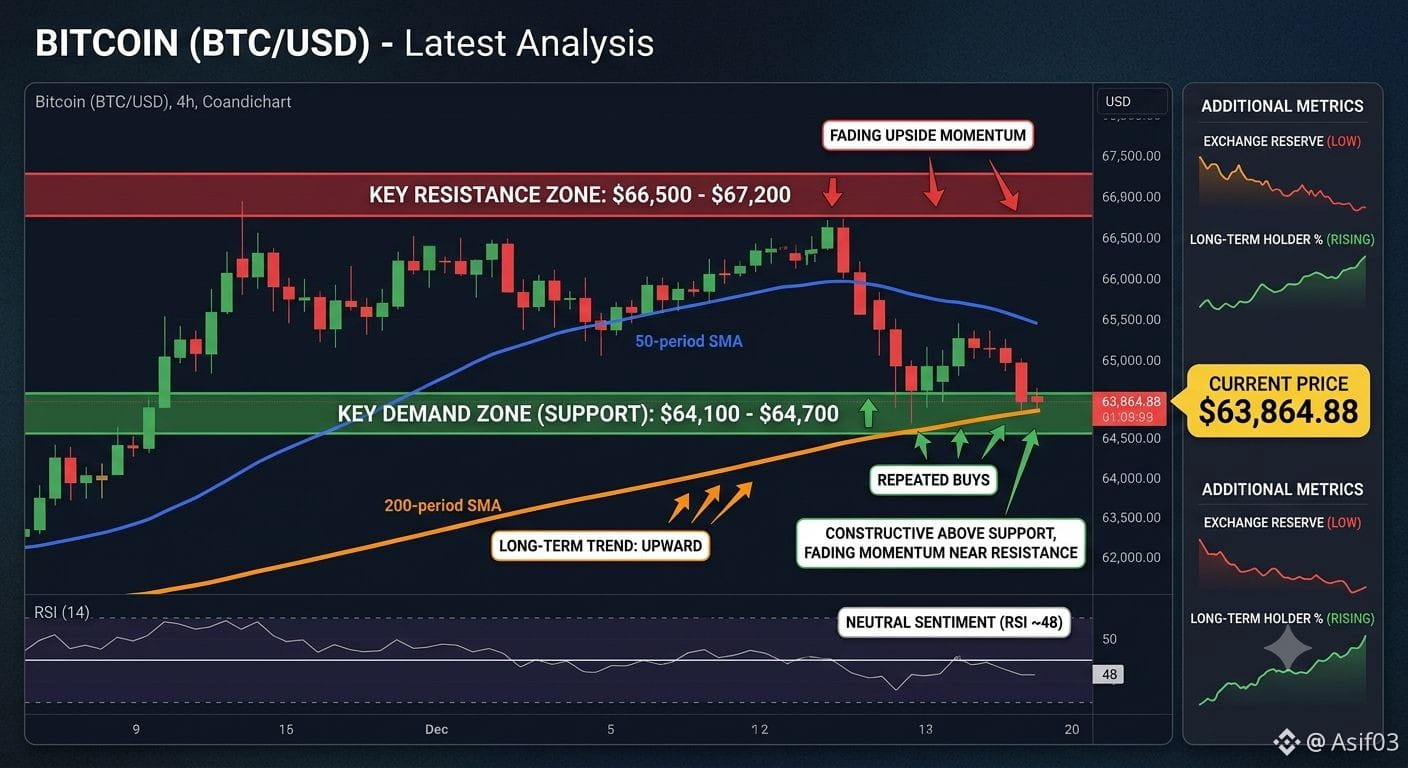
$BTC is currently trading around $63,500–$64,600, remaining in a consolidation phase after a period of heightened volatility. Recent price action suggests traders are waiting for stronger macroeconomic signals, particularly around central bank policy and institutional fund flows.
C
CoinMarketCap
+1
Market Outlook
Bullish case: A sustained move above $65,000 could attract fresh buying momentum and improve short-term sentiment.
C
CoinMarketCap
Bearish case: If Bitcoin falls below the $62,500–$63,000 support area, sellers could push prices toward lower support levels.
C
CoinMarketCap
Key drivers: Spot Bitcoin ETF flows, U.S. Federal Reserve decisions, and overall risk sentiment continue to be the main catalysts for BTC's next major move.
B
Barron's
+1
Summary: Bitcoin's long-term outlook remains constructive, but the short term is likely to stay volatile until a clear breakout or breakdown occurs. Traders should monitor support and resistance levels closely and manage risk appropriately.
#ADPJobSurge #BinanceHODLEerMMT #FOMCWatching #WTIAndBrentOilRiseOver6% #USCourtRejectsCFTCWisconsinInjunctionBid
{future}(BTCUSDT)
$BTC is currently trading around $63,500–$64,600, remaining in a consolidation phase after a period of heightened volatility. Recent price action suggests traders are waiting for stronger macroeconomic signals, particularly around central bank policy and institutional fund flows.
C
CoinMarketCap
+1
Market Outlook
Bullish case: A sustained move above $65,000 could attract fresh buying momentum and improve short-term sentiment.
C
CoinMarketCap
Bearish case: If Bitcoin falls below the $62,500–$63,000 support area, sellers could push prices toward lower support levels.
C
CoinMarketCap
Key drivers: Spot Bitcoin ETF flows, U.S. Federal Reserve decisions, and overall risk sentiment continue to be the main catalysts for BTC's next major move.
B
Barron's
+1
Summary: Bitcoin's long-term outlook remains constructive, but the short term is likely to stay volatile until a clear breakout or breakdown occurs. Traders should monitor support and resistance levels closely and manage risk appropriately.
#ADPJobSurge #BinanceHODLEerMMT #FOMCWatching #WTIAndBrentOilRiseOver6% #USCourtRejectsCFTCWisconsinInjunctionBid
C
CoinMarketCap
+1
Market Outlook
Bullish case: A sustained move above $65,000 could attract fresh buying momentum and improve short-term sentiment.
C
CoinMarketCap
Bearish case: If Bitcoin falls below the $62,500–$63,000 support area, sellers could push prices toward lower support levels.
C
CoinMarketCap
Key drivers: Spot Bitcoin ETF flows, U.S. Federal Reserve decisions, and overall risk sentiment continue to be the main catalysts for BTC's next major move.
B
Barron's
+1
Summary: Bitcoin's long-term outlook remains constructive, but the short term is likely to stay volatile until a clear breakout or breakdown occurs. Traders should monitor support and resistance levels closely and manage risk appropriately.
#ADPJobSurge #BinanceHODLEerMMT #FOMCWatching #WTIAndBrentOilRiseOver6% #USCourtRejectsCFTCWisconsinInjunctionBid
2
65
Log in to explore more content
Join global crypto users on Binance Square
⚡️ Get latest and useful information about crypto.
💬 Trusted by the world’s largest crypto exchange.
👍 Discover real insights from verified creators.
Email / Phone number
Trending Topics
1
#BTCReboundsAbove$60KAmidWhaleDipBuying
73,642 views
328 Discussing
2
#SolanaSets2027RoadmapToDoubleComputeCapacity
57,994 views
977 Discussing
3
#CaliforniaNvidiaProbeExaminesPotentialCriminalViolations
15,543 views
132 Discussing
4
#BlackRockLaunchesHKDollarDigitalLiquidityFund
47,691 views
747 Discussing
5
#NvidiaLoses$2.7TrillionInMonthAndAHalf
76,900 views
311 Discussing
6
#GlobalStocksFaceLongestLosingStreakSince2023
567,357 views
3,478 Discussing
7
#BlackRockIBITPostsRecord$541MSingleDayOutflow
94,323 views
186 Discussing
8
#AnthropicPlungesTowardIPOPriceonDay2
314,467 views
2,332 Discussing
9
#TwentyOneCapitalAdds172.25BTC
166,658 views
1,641 Discussing
10
#HKBillWouldExcludeTokenizedDepositsFromVirtualAssets
18,311 views
105 Discussing