
#amdb
amdb
11,476 views
354 Discussing
Hot
Latest

·
--
📊 Market Analysis – November 19, 2026
🚀 $AMDB (AMD): Trading near $545.56, showing bullish momentum with a 5.19% gain. Buyers are showing strength, but watch for profit-taking near resistance.
⚡ $TSLAB (Tesla): Trading around $383.26, showing a modest recovery. A breakout above $386 could strengthen bullish momentum.
🔹 $EWYB (South Korea ETF): Trading near $137.51, facing short-term selling pressure. Buyers need stronger volume to confirm a recovery.
📈 Overall Outlook: AMDB shows the strongest momentum, TSLAB is attempting recovery, while EWYB remains under pressure. Stay patient and manage risk.
#AMDB #TSLAB #EWYB #bStocks #MarketAnalysis #Trading
{spot}(AMDBUSDT)
{spot}(TSLABUSDT)
{spot}(EWYBUSDT)
📊 Market Analysis – November 19, 2026
🚀 $AMDB (AMD): Trading near $545.56, showing bullish momentum with a 5.19% gain. Buyers are showing strength, but watch for profit-taking near resistance.
⚡ $TSLAB (Tesla): Trading around $383.26, showing a modest recovery. A breakout above $386 could strengthen bullish momentum.
🔹 $EWYB (South Korea ETF): Trading near $137.51, facing short-term selling pressure. Buyers need stronger volume to confirm a recovery.
📈 Overall Outlook: AMDB shows the strongest momentum, TSLAB is attempting recovery, while EWYB remains under pressure. Stay patient and manage risk.
#AMDB #TSLAB #EWYB #bStocks #MarketAnalysis #Trading
🚀 $AMDB (AMD): Trading near $545.56, showing bullish momentum with a 5.19% gain. Buyers are showing strength, but watch for profit-taking near resistance.
⚡ $TSLAB (Tesla): Trading around $383.26, showing a modest recovery. A breakout above $386 could strengthen bullish momentum.
🔹 $EWYB (South Korea ETF): Trading near $137.51, facing short-term selling pressure. Buyers need stronger volume to confirm a recovery.
📈 Overall Outlook: AMDB shows the strongest momentum, TSLAB is attempting recovery, while EWYB remains under pressure. Stay patient and manage risk.
#AMDB #TSLAB #EWYB #bStocks #MarketAnalysis #Trading
1

·
--
### ASMA DOLL PREMIUM SIGNAL
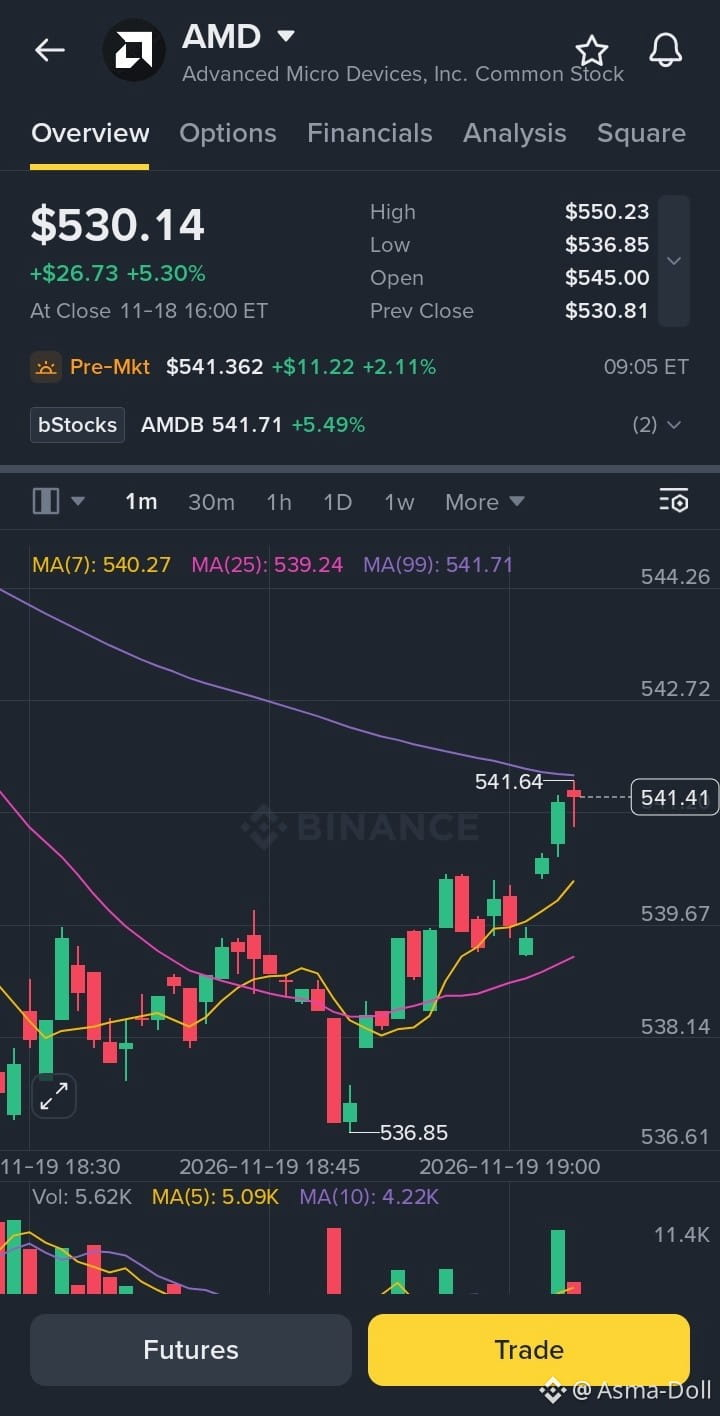
$AMD /USDT – SHORT
Advanced Micro Devices | bStocks
### $541.70
Reference price based on your supplied AMDB snapshot
Trade Plan
| Level | Price |
| ---------- | ----------------- |
| Entry Zone | $541.00 – $544.00 |
| Stop Loss | $551.00 |
| TP1 | $536.85 |
| TP2 | $532.00 |
| TP3 | $525.00 |
Trade here $AMD
{future}(AMDUSDT)
Market Analysis
* AMD showed strong upward movement, gaining around 5.30%.
* Price faced rejection near the $544–$550 resistance area.
* Short-term chart shows selling pressure after the move toward $544.
* Buyers are still active, so bearish confirmation is necessary.
* A breakdown below $536.85 could open the way toward lower targets.
* A recovery above $550 would weaken this short setup.
Confirmation
* Rejection from $544–$550 followed by a lower high.
* Strong breakdown below $536.85 with volume.
* Avoid shorting if price reclaims $550.
Invalidation: Sustained move above $550.
#AMD #AMDB #ShortSignal #StockTrading #ASMADOLL
Important: AMD's regular-market close and AMDB's bStocks quote are different price references. The setup uses your AMDB chart levels. Recent pre-market strength makes an unconfirmed short risky. Advanced Micro Devices, Inc. +1
Trade smart ⚡ Protect your capital.
### ASMA DOLL PREMIUM SIGNAL
$AMD /USDT – SHORT
Advanced Micro Devices | bStocks
### $541.70
Reference price based on your supplied AMDB snapshot
Trade Plan
| Level | Price |
| ---------- | ----------------- |
| Entry Zone | $541.00 – $544.00 |
| Stop Loss | $551.00 |
| TP1 | $536.85 |
| TP2 | $532.00 |
| TP3 | $525.00 |
Trade here $AMD
Market Analysis
* AMD showed strong upward movement, gaining around 5.30%.
* Price faced rejection near the $544–$550 resistance area.
* Short-term chart shows selling pressure after the move toward $544.
* Buyers are still active, so bearish confirmation is necessary.
* A breakdown below $536.85 could open the way toward lower targets.
* A recovery above $550 would weaken this short setup.
Confirmation
* Rejection from $544–$550 followed by a lower high.
* Strong breakdown below $536.85 with volume.
* Avoid shorting if price reclaims $550.
Invalidation: Sustained move above $550.
#AMD #AMDB #ShortSignal #StockTrading #ASMADOLL
Important: AMD's regular-market close and AMDB's bStocks quote are different price references. The setup uses your AMDB chart levels. Recent pre-market strength makes an unconfirmed short risky. Advanced Micro Devices, Inc. +1
Trade smart ⚡ Protect your capital.
$AMD /USDT – SHORT
Advanced Micro Devices | bStocks
### $541.70
Reference price based on your supplied AMDB snapshot
Trade Plan
| Level | Price |
| ---------- | ----------------- |
| Entry Zone | $541.00 – $544.00 |
| Stop Loss | $551.00 |
| TP1 | $536.85 |
| TP2 | $532.00 |
| TP3 | $525.00 |
Trade here $AMD
Market Analysis
* AMD showed strong upward movement, gaining around 5.30%.
* Price faced rejection near the $544–$550 resistance area.
* Short-term chart shows selling pressure after the move toward $544.
* Buyers are still active, so bearish confirmation is necessary.
* A breakdown below $536.85 could open the way toward lower targets.
* A recovery above $550 would weaken this short setup.
Confirmation
* Rejection from $544–$550 followed by a lower high.
* Strong breakdown below $536.85 with volume.
* Avoid shorting if price reclaims $550.
Invalidation: Sustained move above $550.
#AMD #AMDB #ShortSignal #StockTrading #ASMADOLL
Important: AMD's regular-market close and AMDB's bStocks quote are different price references. The setup uses your AMDB chart levels. Recent pre-market strength makes an unconfirmed short risky. Advanced Micro Devices, Inc. +1
Trade smart ⚡ Protect your capital.
3
56

·
--
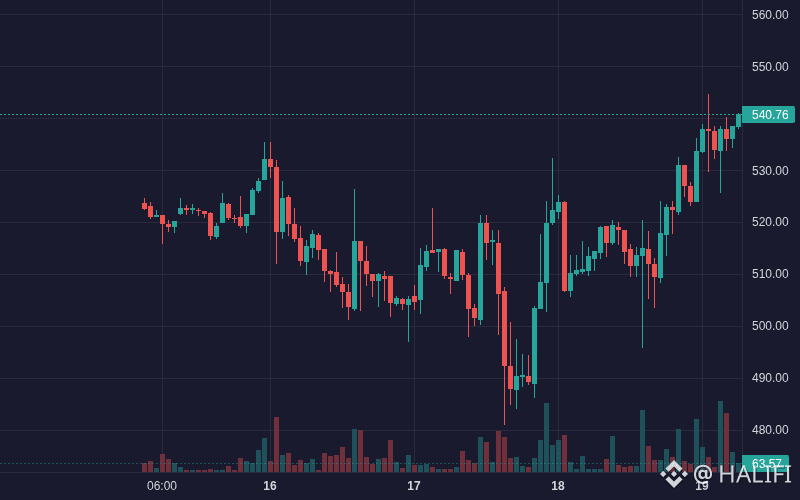
$AMDB AMDB is showing bullish movement: 5.71% (Crypto).
Volume: 2.32M | Last: $540.70
Key signals: strong momentum, high volatility.
Bias Daily: BULLISH 🟢 | Weekly: BULLISH 🟢
AMDB climbed 4.42% over the last 24 hours to $536.14, driven by AI capital rotation and strong inflows.
**Capital rotation (High)**: Trader interest shifted into AI semiconductor alternatives → AMDB surged from $513.41 to $536.14 (+4.42%).
- **Inflow acceleration (High)**: Surges in buying volume and large-order inflows, including a +$308.8K net hourly inflow peak, reinforced bullish momentum.
- **Trend continuation (Medium)**: Price crossed above EMA 7, 25, and 99 alongside positive MACD expansion → sustained buying pressure.
#AMDB #Bitcoin #BinanceSquare #TerraClassic #Crypto
$AMDB AMDB is showing bullish movement: 5.71% (Crypto).
Volume: 2.32M | Last: $540.70
Key signals: strong momentum, high volatility.
Bias Daily: BULLISH 🟢 | Weekly: BULLISH 🟢
AMDB climbed 4.42% over the last 24 hours to $536.14, driven by AI capital rotation and strong inflows.
**Capital rotation (High)**: Trader interest shifted into AI semiconductor alternatives → AMDB surged from $513.41 to $536.14 (+4.42%).
- **Inflow acceleration (High)**: Surges in buying volume and large-order inflows, including a +$308.8K net hourly inflow peak, reinforced bullish momentum.
- **Trend continuation (Medium)**: Price crossed above EMA 7, 25, and 99 alongside positive MACD expansion → sustained buying pressure.
#AMDB #Bitcoin #BinanceSquare #TerraClassic #Crypto
Volume: 2.32M | Last: $540.70
Key signals: strong momentum, high volatility.
Bias Daily: BULLISH 🟢 | Weekly: BULLISH 🟢
AMDB climbed 4.42% over the last 24 hours to $536.14, driven by AI capital rotation and strong inflows.
**Capital rotation (High)**: Trader interest shifted into AI semiconductor alternatives → AMDB surged from $513.41 to $536.14 (+4.42%).
- **Inflow acceleration (High)**: Surges in buying volume and large-order inflows, including a +$308.8K net hourly inflow peak, reinforced bullish momentum.
- **Trend continuation (Medium)**: Price crossed above EMA 7, 25, and 99 alongside positive MACD expansion → sustained buying pressure.
#AMDB #Bitcoin #BinanceSquare #TerraClassic #Crypto
40

·
--
$AMDB +3.66% | $LA +3.51% | $MARSCOIN +3.10%
#AMDB nudged to $526.19, up +3.66% on $2.0 M of volume. The modest rise suggests fresh buying interest after a quiet session.
#LA ticked at $0.0442, gaining +3.51% with $1.4 M traded. That volume supports the price move, hinting at a short‑term bounce.
#MARSCOIN moved to $0.0333, up +3.10% on $1.7 M of volume. The consistency across the three shows a small‑cap rally pattern.
👀 Watch whether this coordinated uptick holds, as similar volume levels could signal a broader sector push.
#Write2Earn #Binance
$AMDB +3.66% | $LA +3.51% | $MARSCOIN +3.10%
#AMDB nudged to $526.19, up +3.66% on $2.0 M of volume. The modest rise suggests fresh buying interest after a quiet session.
#LA ticked at $0.0442, gaining +3.51% with $1.4 M traded. That volume supports the price move, hinting at a short‑term bounce.
#MARSCOIN moved to $0.0333, up +3.10% on $1.7 M of volume. The consistency across the three shows a small‑cap rally pattern.
👀 Watch whether this coordinated uptick holds, as similar volume levels could signal a broader sector push.
#Write2Earn #Binance
#AMDB nudged to $526.19, up +3.66% on $2.0 M of volume. The modest rise suggests fresh buying interest after a quiet session.
#LA ticked at $0.0442, gaining +3.51% with $1.4 M traded. That volume supports the price move, hinting at a short‑term bounce.
#MARSCOIN moved to $0.0333, up +3.10% on $1.7 M of volume. The consistency across the three shows a small‑cap rally pattern.
👀 Watch whether this coordinated uptick holds, as similar volume levels could signal a broader sector push.
#Write2Earn #Binance
23

·
--
$AMDB +6.72% | $KITE +5.84% | $BLUR +5.67%
#AMDB climbs to $523.48, up +6.72% on $1.9 M volume. The move suggests renewed interest after a recent dip, though the modest flow means the rally could wobble.
#KITE pushes higher to $0.1359, gaining +5.84% with the same $1.9 M of trading. Its price jump feels supported, yet the flat volume compared to peers leaves room for volatility.
#BLUR nudges to $0.00652000, up +5.67% on $1.4 M volume. The lower volume may limit the strength of this advance, so a pullback isn’t out of the question.
📈 Watch the narrowing gap between AMDB and KITE’s volumes; if one side accelerates, it could tip short‑term momentum.
#Write2Earn #Binance
$AMDB +6.72% | $KITE +5.84% | $BLUR +5.67%
#AMDB climbs to $523.48, up +6.72% on $1.9 M volume. The move suggests renewed interest after a recent dip, though the modest flow means the rally could wobble.
#KITE pushes higher to $0.1359, gaining +5.84% with the same $1.9 M of trading. Its price jump feels supported, yet the flat volume compared to peers leaves room for volatility.
#BLUR nudges to $0.00652000, up +5.67% on $1.4 M volume. The lower volume may limit the strength of this advance, so a pullback isn’t out of the question.
📈 Watch the narrowing gap between AMDB and KITE’s volumes; if one side accelerates, it could tip short‑term momentum.
#Write2Earn #Binance
#AMDB climbs to $523.48, up +6.72% on $1.9 M volume. The move suggests renewed interest after a recent dip, though the modest flow means the rally could wobble.
#KITE pushes higher to $0.1359, gaining +5.84% with the same $1.9 M of trading. Its price jump feels supported, yet the flat volume compared to peers leaves room for volatility.
#BLUR nudges to $0.00652000, up +5.67% on $1.4 M volume. The lower volume may limit the strength of this advance, so a pullback isn’t out of the question.
📈 Watch the narrowing gap between AMDB and KITE’s volumes; if one side accelerates, it could tip short‑term momentum.
#Write2Earn #Binance
9

·
--
Silicon Surge: $AMDB Climbs on Binance Spot 🚀
Price action – $AMDB closed at $515.43 on Binance Spot, up 4.99 % over the past 24 h with healthy trading volume. Advanced Micro Devices (AMD) continues to ride the broader semiconductor demand wave, keeping the stock in focus despite no direct news.
Key levels – Immediate support sits near $500, offering a cushion if buying pressure eases. The next resistance is around $525, while a mid‑range pivot at $512.5 serves as a reference for short‑term traders.
Short outlook – Cautious tone: the rally appears stretched; a pullback toward the $500 support could test the downside before any further upside is justified. Traders should watch for early signs of reversal and keep risk management tight. 📈⚠️
#AMDB #Stocks #BinanceSquare
Silicon Surge: $AMDB Climbs on Binance Spot 🚀
Price action – $AMDB closed at $515.43 on Binance Spot, up 4.99 % over the past 24 h with healthy trading volume. Advanced Micro Devices (AMD) continues to ride the broader semiconductor demand wave, keeping the stock in focus despite no direct news.
Key levels – Immediate support sits near $500, offering a cushion if buying pressure eases. The next resistance is around $525, while a mid‑range pivot at $512.5 serves as a reference for short‑term traders.
Short outlook – Cautious tone: the rally appears stretched; a pullback toward the $500 support could test the downside before any further upside is justified. Traders should watch for early signs of reversal and keep risk management tight. 📈⚠️
#AMDB #Stocks #BinanceSquare
Price action – $AMDB closed at $515.43 on Binance Spot, up 4.99 % over the past 24 h with healthy trading volume. Advanced Micro Devices (AMD) continues to ride the broader semiconductor demand wave, keeping the stock in focus despite no direct news.
Key levels – Immediate support sits near $500, offering a cushion if buying pressure eases. The next resistance is around $525, while a mid‑range pivot at $512.5 serves as a reference for short‑term traders.
Short outlook – Cautious tone: the rally appears stretched; a pullback toward the $500 support could test the downside before any further upside is justified. Traders should watch for early signs of reversal and keep risk management tight. 📈⚠️
#AMDB #Stocks #BinanceSquare
2

·
--
🔍 $AMDB Price Drop Breakdown
5m: +0.07%
1h: -3.58%
4h: +0.11%
24h: -14.07%
Current price: 454.41, 24h trading volume: $5.5 million
The decline was mainly concentrated in the 1h timeframe, indicating a sudden sell-off.
Do you think this is a sentiment-driven exit or a deteriorating trend? 👇
(Data breakdown, not investment advice. DYOR)
#AMDB
🔍 $AMDB Price Drop Breakdown
5m: +0.07%
1h: -3.58%
4h: +0.11%
24h: -14.07%
Current price: 454.41, 24h trading volume: $5.5 million
The decline was mainly concentrated in the 1h timeframe, indicating a sudden sell-off.
Do you think this is a sentiment-driven exit or a deteriorating trend? 👇
(Data breakdown, not investment advice. DYOR)
#AMDB
5m: +0.07%
1h: -3.58%
4h: +0.11%
24h: -14.07%
Current price: 454.41, 24h trading volume: $5.5 million
The decline was mainly concentrated in the 1h timeframe, indicating a sudden sell-off.
Do you think this is a sentiment-driven exit or a deteriorating trend? 👇
(Data breakdown, not investment advice. DYOR)
#AMDB

·
--
📉 AMDBUSDT under pressure, probing lower: U.S. stocks extend premarket losses; short-term bearish warning
Trend outlook for the next 4–24 hours: Bearish ⚡
AMDB tracks U.S. stock AMD. Hit by a short-seller report from Hunterbrook and tighter export controls, AMD closed down 7.72% yesterday at $489.19. It is down more than 5% in U.S. premarket trading today, near $462, and has fallen below its 20- and 50-day moving averages on the daily chart. With Nasdaq futures weakening, the VIX rising above 28, and semiconductor stocks broadly lower, AMDBUSDT (recent low around 468 USDT) faces downside catch-up and premium-convergence pressure amid thin spot-market liquidity.
Key levels (AMDBUSDT): Watch support at 468 USDT; a decisive break below could expose the 460 and 440 USDT range. Resistance is at 485–490 USDT; failure to break above it on a rebound would signal continued weakness.
Short-term outlook: Volatility is expected to rise tonight as the U.S. market opens, coinciding with monthly options expiration, the University of Michigan consumer sentiment data, and remarks from Fed officials. The bias is toward further downside in search of a bottom 🔥. A high-volume move back above 490 USDT and a sustained hold there would invalidate the bearish view.
#AMDB #AMD #美股 #半导体 #RWA
📉 AMDBUSDT under pressure, probing lower: U.S. stocks extend premarket losses; short-term bearish warning
Trend outlook for the next 4–24 hours: Bearish ⚡
AMDB tracks U.S. stock AMD. Hit by a short-seller report from Hunterbrook and tighter export controls, AMD closed down 7.72% yesterday at $489.19. It is down more than 5% in U.S. premarket trading today, near $462, and has fallen below its 20- and 50-day moving averages on the daily chart. With Nasdaq futures weakening, the VIX rising above 28, and semiconductor stocks broadly lower, AMDBUSDT (recent low around 468 USDT) faces downside catch-up and premium-convergence pressure amid thin spot-market liquidity.
Key levels (AMDBUSDT): Watch support at 468 USDT; a decisive break below could expose the 460 and 440 USDT range. Resistance is at 485–490 USDT; failure to break above it on a rebound would signal continued weakness.
Short-term outlook: Volatility is expected to rise tonight as the U.S. market opens, coinciding with monthly options expiration, the University of Michigan consumer sentiment data, and remarks from Fed officials. The bias is toward further downside in search of a bottom 🔥. A high-volume move back above 490 USDT and a sustained hold there would invalidate the bearish view.
#AMDB #AMD #美股 #半导体 #RWA
Trend outlook for the next 4–24 hours: Bearish ⚡
AMDB tracks U.S. stock AMD. Hit by a short-seller report from Hunterbrook and tighter export controls, AMD closed down 7.72% yesterday at $489.19. It is down more than 5% in U.S. premarket trading today, near $462, and has fallen below its 20- and 50-day moving averages on the daily chart. With Nasdaq futures weakening, the VIX rising above 28, and semiconductor stocks broadly lower, AMDBUSDT (recent low around 468 USDT) faces downside catch-up and premium-convergence pressure amid thin spot-market liquidity.
Key levels (AMDBUSDT): Watch support at 468 USDT; a decisive break below could expose the 460 and 440 USDT range. Resistance is at 485–490 USDT; failure to break above it on a rebound would signal continued weakness.
Short-term outlook: Volatility is expected to rise tonight as the U.S. market opens, coinciding with monthly options expiration, the University of Michigan consumer sentiment data, and remarks from Fed officials. The bias is toward further downside in search of a bottom 🔥. A high-volume move back above 490 USDT and a sustained hold there would invalidate the bearish view.
#AMDB #AMD #美股 #半导体 #RWA
74

·
--

Article
AMDB|Methodology Breakdown|2026-11-20📊 Interesting data: $AMDB PRICE_CHANGE_24H reading 473.15. The 24-hour rolling price change is -13.4600%, reaching the 5% observation threshold; this does not predict price direction.
📊 Data Snapshot
· Metric: PRICE_CHANGE_24H
· Reading: 473.15
· Methodology: Based on a sequence of closed candlesticks
Seasoned traders like to lay the data out first, then see which way sentiment is going. Volume and price both matter, and bulls and bears are battling it out in these readings.
What do you think? 👇
## How to read this data
This observation is calculated from the source API's sequence of closed candlesticks. The metric is a mathematical transformation of historical prices; it describes only the time of observation, does not predict price direction, and is not a buy or sell instruction.
AMDB|Methodology Breakdown|2026-11-20
📊 Interesting data: $AMDB PRICE_CHANGE_24H reading 473.15. The 24-hour rolling price change is -13.4600%, reaching the 5% observation threshold; this does not predict price direction.
📊 Data Snapshot
· Metric: PRICE_CHANGE_24H
· Reading: 473.15
· Methodology: Based on a sequence of closed candlesticks
Seasoned traders like to lay the data out first, then see which way sentiment is going. Volume and price both matter, and bulls and bears are battling it out in these readings.
What do you think? 👇
## How to read this data
This observation is calculated from the source API's sequence of closed candlesticks. The metric is a mathematical transformation of historical prices; it describes only the time of observation, does not predict price direction, and is not a buy or sell instruction.
📊 Data Snapshot
· Metric: PRICE_CHANGE_24H
· Reading: 473.15
· Methodology: Based on a sequence of closed candlesticks
Seasoned traders like to lay the data out first, then see which way sentiment is going. Volume and price both matter, and bulls and bears are battling it out in these readings.
What do you think? 👇
## How to read this data
This observation is calculated from the source API's sequence of closed candlesticks. The metric is a mathematical transformation of historical prices; it describes only the time of observation, does not predict price direction, and is not a buy or sell instruction.

·
--
Between the number of transactions per second and the price, the $AMDB reading shows: 0.17 transactions/s.
$AMDB is among the coins trending now, but popularity does not determine its direction; the reading here points to higher-than-usual trading activity.
Reading: Increased activity means greater participation, while the price trend is downward; whether they continue to align is what remains to be tested.
Key evidence: Transactions per second: 0.17 transactions/s | Price: 476.80 USDT | 24-hour price change: -11.42%
Confirmation condition: Volume continues alongside price gains. When does the reading weaken? When activity rises without a corresponding price move.
For $AMDB, the most important test remains whether the indicators are consistent in the next reading, while monitoring transactions per second and price. Confidence is moderate, and any subsequent reading may change this assessment.
#AMDB #ترند_العملات #Market_Analysis
Between the number of transactions per second and the price, the $AMDB reading shows: 0.17 transactions/s.
$AMDB is among the coins trending now, but popularity does not determine its direction; the reading here points to higher-than-usual trading activity.
Reading: Increased activity means greater participation, while the price trend is downward; whether they continue to align is what remains to be tested.
Key evidence: Transactions per second: 0.17 transactions/s | Price: 476.80 USDT | 24-hour price change: -11.42%
Confirmation condition: Volume continues alongside price gains. When does the reading weaken? When activity rises without a corresponding price move.
For $AMDB , the most important test remains whether the indicators are consistent in the next reading, while monitoring transactions per second and price. Confidence is moderate, and any subsequent reading may change this assessment.
#AMDB #ترند_العملات #Market_Analysis
$AMDB is among the coins trending now, but popularity does not determine its direction; the reading here points to higher-than-usual trading activity.
Reading: Increased activity means greater participation, while the price trend is downward; whether they continue to align is what remains to be tested.
Key evidence: Transactions per second: 0.17 transactions/s | Price: 476.80 USDT | 24-hour price change: -11.42%
Confirmation condition: Volume continues alongside price gains. When does the reading weaken? When activity rises without a corresponding price move.
For $AMDB , the most important test remains whether the indicators are consistent in the next reading, while monitoring transactions per second and price. Confidence is moderate, and any subsequent reading may change this assessment.
#AMDB #ترند_العملات #Market_Analysis

·
--
📉 AMDB Short-Term Bearish; 469 USDT Is the First Support Level
AMDB tracks AMD common stock 1:1. A third-party snapshot of Binance Spot shows 470.57 USDT, down 12.42% over 24 hours, with a range of 469–555.41. The price is near the low, and order book depth has not yet been verified. Binance announcement (https://www.binance.com/en/support/announcement/detail/d1343e10bc2648cd8302c83a5b1223a9) · Spot snapshot (https://www.cryptometer.io/data/binance/amdb/usdt)
On November 19, AMD closed down 7.72% at $489.19 on heavy volume. It was quoted at $472.50 in after-hours trading at 21:23 ET, while the Philadelphia Semiconductor Index closed down 2.41%. Short sellers questioned compliance with export rules for China; AMD said it complies with applicable regulations. After-hours quote (https://finance.yahoo.com/quote/AMD/financials/) · Sector performance (https://ca.marketscreener.com/quote/index/PHLX-SEMICONDUCTOR-5333609/quotes/) · Company response (https://ca.finance.yahoo.com/news/amd-stock-drops-after-hunterbrook-media-raises-export-control-concerns-171508145.html)
The outlook is bearish over the next 4–24 hours, with a retest of 469 USDT expected first. If that level breaks, the next target is the 460 round-number level. After the U.S. market opens at 22:30 Beijing time tonight, a simultaneous rebound in AMD and AMDB holding above 490 USDT on rising volume would invalidate the bearish outlook.
#AMDB #AMD #半导体 #美股 #RWA
📉 AMDB Short-Term Bearish; 469 USDT Is the First Support Level
AMDB tracks AMD common stock 1:1. A third-party snapshot of Binance Spot shows 470.57 USDT, down 12.42% over 24 hours, with a range of 469–555.41. The price is near the low, and order book depth has not yet been verified. Binance announcement (https://www.binance.com/en/support/announcement/detail/d1343e10bc2648cd8302c83a5b1223a9) · Spot snapshot (https://www.cryptometer.io/data/binance/amdb/usdt)
On November 19, AMD closed down 7.72% at $489.19 on heavy volume. It was quoted at $472.50 in after-hours trading at 21:23 ET, while the Philadelphia Semiconductor Index closed down 2.41%. Short sellers questioned compliance with export rules for China; AMD said it complies with applicable regulations. After-hours quote (https://finance.yahoo.com/quote/AMD/financials/) · Sector performance (https://ca.marketscreener.com/quote/index/PHLX-SEMICONDUCTOR-5333609/quotes/) · Company response (https://ca.finance.yahoo.com/news/amd-stock-drops-after-hunterbrook-media-raises-export-control-concerns-171508145.html)
The outlook is bearish over the next 4–24 hours, with a retest of 469 USDT expected first. If that level breaks, the next target is the 460 round-number level. After the U.S. market opens at 22:30 Beijing time tonight, a simultaneous rebound in AMD and AMDB holding above 490 USDT on rising volume would invalidate the bearish outlook.
#AMDB #AMD #半导体 #美股 #RWA
AMDB tracks AMD common stock 1:1. A third-party snapshot of Binance Spot shows 470.57 USDT, down 12.42% over 24 hours, with a range of 469–555.41. The price is near the low, and order book depth has not yet been verified. Binance announcement (https://www.binance.com/en/support/announcement/detail/d1343e10bc2648cd8302c83a5b1223a9) · Spot snapshot (https://www.cryptometer.io/data/binance/amdb/usdt)
On November 19, AMD closed down 7.72% at $489.19 on heavy volume. It was quoted at $472.50 in after-hours trading at 21:23 ET, while the Philadelphia Semiconductor Index closed down 2.41%. Short sellers questioned compliance with export rules for China; AMD said it complies with applicable regulations. After-hours quote (https://finance.yahoo.com/quote/AMD/financials/) · Sector performance (https://ca.marketscreener.com/quote/index/PHLX-SEMICONDUCTOR-5333609/quotes/) · Company response (https://ca.finance.yahoo.com/news/amd-stock-drops-after-hunterbrook-media-raises-export-control-concerns-171508145.html)
The outlook is bearish over the next 4–24 hours, with a retest of 469 USDT expected first. If that level breaks, the next target is the 460 round-number level. After the U.S. market opens at 22:30 Beijing time tonight, a simultaneous rebound in AMD and AMDB holding above 490 USDT on rising volume would invalidate the bearish outlook.
#AMDB #AMD #半导体 #美股 #RWA
·
--
📉 AMDB bearish in the short term, facing resistance at 480
Early on November 20, a third-party Binance Spot snapshot showed AMDB/USDT at 479.91, down 7.85% over 24 hours, with a trading volume of approximately 4.33 million USDT. Spot market data (https://chainregistry.net/exchanges/binance)
Underlying U.S. stock AMD fell 7.72% on heavy volume Thursday to close at $489.19, then dropped further to $480.31 after hours, significantly underperforming the Philadelphia Semiconductor Index, which closed down 0.57%. A short-selling firm has raised questions about AMD's compliance with China-related export regulations; the allegations have yet to be verified. AMD market data (https://stockanalysis.com/stocks/amd/) Semiconductor index (https://www.stockquote.io/stocks/%5ESOX/history) Short-seller report (https://newsletter.hntrbrk.com/p/amd-has-its-own-china-problem)
Bearish outlook for the next 4–24 hours. If AMDB remains below 480, the next downside target is 470–473 USDT, with rebound resistance at 493–497. A sustained move above 497 on rising volume would invalidate the bearish outlook. Watch for the final University of Michigan Consumer Sentiment reading at 23:00 Beijing time tonight. Token historical data (https://tradealmanac.com/en/crypto/advanced-micro-devices-bstocks-tokenized-stock/history) Data calendar (https://www.sca.isr.umich.edu/?os=win)
#AMDB #AMD #半导体 #RWA
📉 AMDB bearish in the short term, facing resistance at 480
Early on November 20, a third-party Binance Spot snapshot showed AMDB/USDT at 479.91, down 7.85% over 24 hours, with a trading volume of approximately 4.33 million USDT. Spot market data (https://chainregistry.net/exchanges/binance)
Underlying U.S. stock AMD fell 7.72% on heavy volume Thursday to close at $489.19, then dropped further to $480.31 after hours, significantly underperforming the Philadelphia Semiconductor Index, which closed down 0.57%. A short-selling firm has raised questions about AMD's compliance with China-related export regulations; the allegations have yet to be verified. AMD market data (https://stockanalysis.com/stocks/amd/) Semiconductor index (https://www.stockquote.io/stocks/%5ESOX/history) Short-seller report (https://newsletter.hntrbrk.com/p/amd-has-its-own-china-problem)
Bearish outlook for the next 4–24 hours. If AMDB remains below 480, the next downside target is 470–473 USDT, with rebound resistance at 493–497. A sustained move above 497 on rising volume would invalidate the bearish outlook. Watch for the final University of Michigan Consumer Sentiment reading at 23:00 Beijing time tonight. Token historical data (https://tradealmanac.com/en/crypto/advanced-micro-devices-bstocks-tokenized-stock/history) Data calendar (https://www.sca.isr.umich.edu/?os=win)
#AMDB #AMD #半导体 #RWA
Early on November 20, a third-party Binance Spot snapshot showed AMDB/USDT at 479.91, down 7.85% over 24 hours, with a trading volume of approximately 4.33 million USDT. Spot market data (https://chainregistry.net/exchanges/binance)
Underlying U.S. stock AMD fell 7.72% on heavy volume Thursday to close at $489.19, then dropped further to $480.31 after hours, significantly underperforming the Philadelphia Semiconductor Index, which closed down 0.57%. A short-selling firm has raised questions about AMD's compliance with China-related export regulations; the allegations have yet to be verified. AMD market data (https://stockanalysis.com/stocks/amd/) Semiconductor index (https://www.stockquote.io/stocks/%5ESOX/history) Short-seller report (https://newsletter.hntrbrk.com/p/amd-has-its-own-china-problem)
Bearish outlook for the next 4–24 hours. If AMDB remains below 480, the next downside target is 470–473 USDT, with rebound resistance at 493–497. A sustained move above 497 on rising volume would invalidate the bearish outlook. Watch for the final University of Michigan Consumer Sentiment reading at 23:00 Beijing time tonight. Token historical data (https://tradealmanac.com/en/crypto/advanced-micro-devices-bstocks-tokenized-stock/history) Data calendar (https://www.sca.isr.umich.edu/?os=win)
#AMDB #AMD #半导体 #RWA
15
·
--
Tech Tension: $AMDB Tests Support on Binance Spot 🚧
Advanced Micro Devices bStock (AMDB/USDT) is trading at $517.72, down 0.94 % over the past 24 hours. $AMDB’s modest slide comes amid neutral crypto sentiment and a broader pause in semiconductor pricing. The move matters because AMD is slated to release its Q3 earnings next week, and any surprise could ripple through the chip sector and influence tokenized equity demand.
Price action – The bStock slipped below the $520‑$525 range, signaling a loss of short‑term momentum. Volume remains average, suggesting the decline is driven by profit‑taking rather than panic.
Key levels – Immediate support sits at $512, a floor that held during the March pullback. Resistance clusters around $525‑$530, where sellers previously capped upside. Mid‑range lies near $518, aligning closely with the current price and acting as a pivot for intraday traders.
Outlook – With the price stretched toward the $525 resistance and earnings on the horizon, the cautious outlook calls for a potential pullback toward the $512 support zone. Traders should monitor order flow for signs of a reversal before committing to longer positions.
#AMDB #bStocks #BinanceSquare
Tech Tension: $AMDB Tests Support on Binance Spot 🚧
Advanced Micro Devices bStock (AMDB/USDT) is trading at $517.72, down 0.94 % over the past 24 hours. $AMDB ’s modest slide comes amid neutral crypto sentiment and a broader pause in semiconductor pricing. The move matters because AMD is slated to release its Q3 earnings next week, and any surprise could ripple through the chip sector and influence tokenized equity demand.
Price action – The bStock slipped below the $520‑$525 range, signaling a loss of short‑term momentum. Volume remains average, suggesting the decline is driven by profit‑taking rather than panic.
Key levels – Immediate support sits at $512, a floor that held during the March pullback. Resistance clusters around $525‑$530, where sellers previously capped upside. Mid‑range lies near $518, aligning closely with the current price and acting as a pivot for intraday traders.
Outlook – With the price stretched toward the $525 resistance and earnings on the horizon, the cautious outlook calls for a potential pullback toward the $512 support zone. Traders should monitor order flow for signs of a reversal before committing to longer positions.
#AMDB #bStocks #BinanceSquare
Advanced Micro Devices bStock (AMDB/USDT) is trading at $517.72, down 0.94 % over the past 24 hours. $AMDB ’s modest slide comes amid neutral crypto sentiment and a broader pause in semiconductor pricing. The move matters because AMD is slated to release its Q3 earnings next week, and any surprise could ripple through the chip sector and influence tokenized equity demand.
Price action – The bStock slipped below the $520‑$525 range, signaling a loss of short‑term momentum. Volume remains average, suggesting the decline is driven by profit‑taking rather than panic.
Key levels – Immediate support sits at $512, a floor that held during the March pullback. Resistance clusters around $525‑$530, where sellers previously capped upside. Mid‑range lies near $518, aligning closely with the current price and acting as a pivot for intraday traders.
Outlook – With the price stretched toward the $525 resistance and earnings on the horizon, the cautious outlook calls for a potential pullback toward the $512 support zone. Traders should monitor order flow for signs of a reversal before committing to longer positions.
#AMDB #bStocks #BinanceSquare
4
·
--
Silicon Slide: AMDB Tumbles on Binance Spot
$AMDB is trading at $524.61 on Binance Spot (AMDB/USDT), down 9.91% over the past 24 hours with solid volume. The dip comes ahead of AMD’s Q3 earnings, a key catalyst for the semiconductor sector and broader tech indices.
Key levels – Immediate support holds around $520.00, a zone that previously anchored a brief rebound. A secondary floor lies near $515.00, which could attract buyers if the price retests. On the upside, resistance clusters at $540.00, with a mid‑range pivot at $530.00 offering a potential springboard for a short‑term bounce.
Outlook – Cautious. The recent slide appears stretched; momentum indicators suggest a pullback toward the $520 support band before any upside revival. Traders should watch for confirmation of the support hold and stay wary of further downside if earnings miss expectations. 📉🔧
#AMDB #Stocks #BinanceSquare
Silicon Slide: AMDB Tumbles on Binance Spot
$AMDB is trading at $524.61 on Binance Spot (AMDB/USDT), down 9.91% over the past 24 hours with solid volume. The dip comes ahead of AMD’s Q3 earnings, a key catalyst for the semiconductor sector and broader tech indices.
Key levels – Immediate support holds around $520.00, a zone that previously anchored a brief rebound. A secondary floor lies near $515.00, which could attract buyers if the price retests. On the upside, resistance clusters at $540.00, with a mid‑range pivot at $530.00 offering a potential springboard for a short‑term bounce.
Outlook – Cautious. The recent slide appears stretched; momentum indicators suggest a pullback toward the $520 support band before any upside revival. Traders should watch for confirmation of the support hold and stay wary of further downside if earnings miss expectations. 📉🔧
#AMDB #Stocks #BinanceSquare
$AMDB is trading at $524.61 on Binance Spot (AMDB/USDT), down 9.91% over the past 24 hours with solid volume. The dip comes ahead of AMD’s Q3 earnings, a key catalyst for the semiconductor sector and broader tech indices.
Key levels – Immediate support holds around $520.00, a zone that previously anchored a brief rebound. A secondary floor lies near $515.00, which could attract buyers if the price retests. On the upside, resistance clusters at $540.00, with a mid‑range pivot at $530.00 offering a potential springboard for a short‑term bounce.
Outlook – Cautious. The recent slide appears stretched; momentum indicators suggest a pullback toward the $520 support band before any upside revival. Traders should watch for confirmation of the support hold and stay wary of further downside if earnings miss expectations. 📉🔧
#AMDB #Stocks #BinanceSquare
1


$AMDB: Questioning the Certainty of Liquidation Spirals
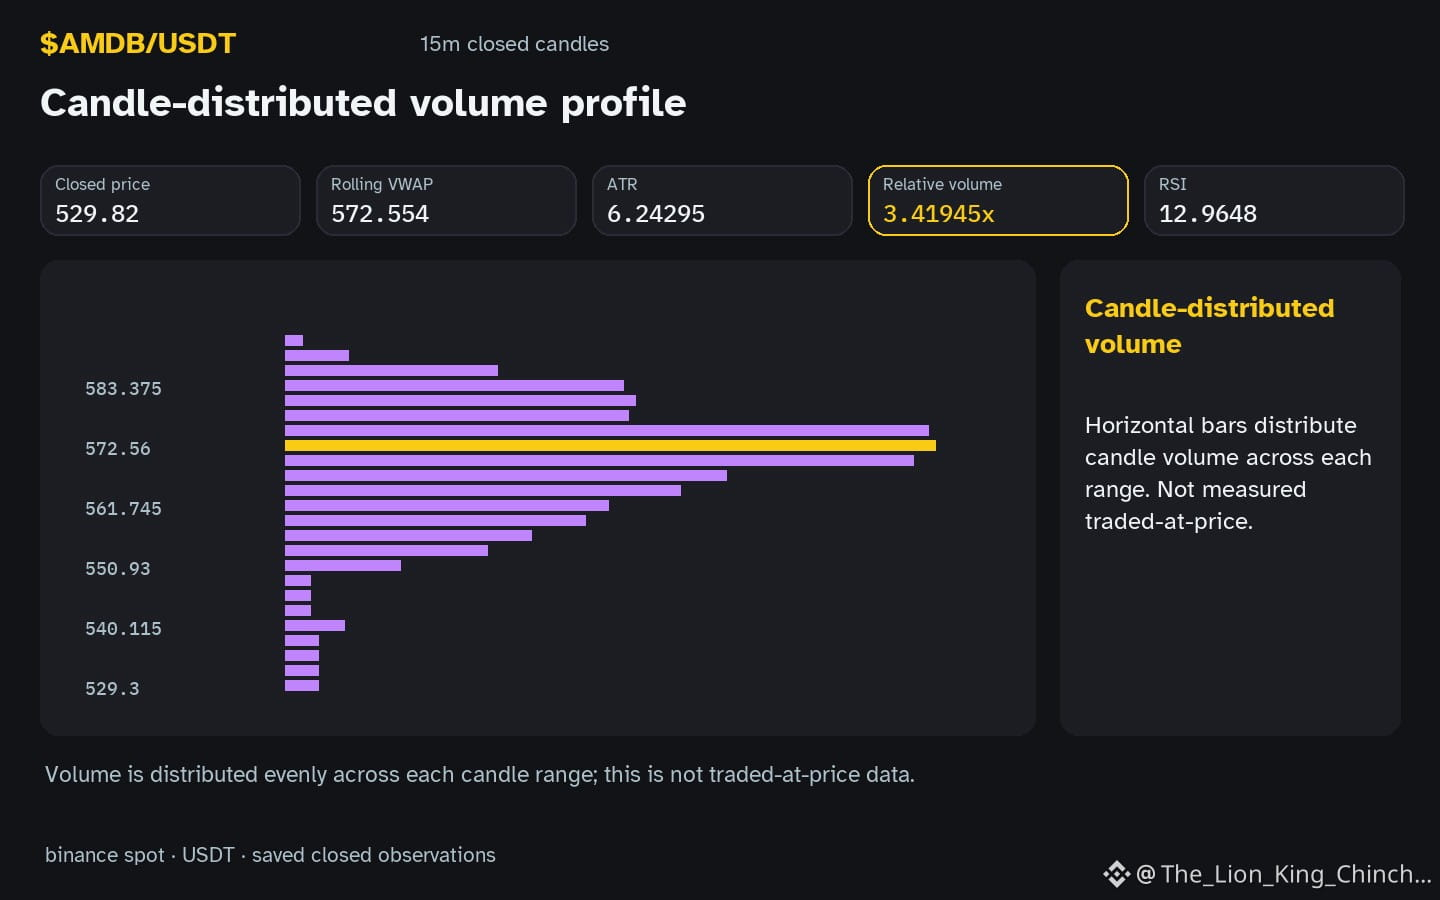
Does every sharp price move in $AMDB signify a liquidation chain? While the hourly candle shows a down direction below support 540.5, volume is notably 3.42x the baseline.
A common misconception is that high volume during a support breach guarantees a cascade of long liquidations. In theory, a liquidation occurs when a price drop forces a platform to sell a leveraged position to protect the lending environment. This mechanical selling can push prices further down, creating more liquidations. However, high volume alone does not prove this mechanism is active. It could simply reflect a cluster of limit orders being hit or a shift in spot sentiment without any leveraged pressure involved.
To better understand the risks, consider a scenario where price stabilizes quickly despite high volume. If this were a forced liquidation spiral, the mechanical selling would likely persist until the leverage is cleared. A counterexample occurs when volume spikes but the daily change -5.58318% remains relatively narrow. This suggests that the activity might be a high-turnover exchange of assets rather than a structural collapse of positions.
We can reassess this interpretation by watching the next few closed candles. If $AMDB stays below resistance 580.16 with declining RSI 13.0 and stays heavy, the mechanical pressure theory remains a possibility. Conversely, if price recovers the support level on lower volume, it suggests the initial drop was not driven by an irreversible liquidation chain. Monitoring for a failure to sustain the downward velocity helps distinguish a temporary event from a structural trend. ☖
Probabilistic market research, not a recommendation or guaranteed return.
#AMDB
$AMDB : Questioning the Certainty of Liquidation Spirals
Does every sharp price move in $AMDB signify a liquidation chain? While the hourly candle shows a down direction below support 540.5, volume is notably 3.42x the baseline.
A common misconception is that high volume during a support breach guarantees a cascade of long liquidations. In theory, a liquidation occurs when a price drop forces a platform to sell a leveraged position to protect the lending environment. This mechanical selling can push prices further down, creating more liquidations. However, high volume alone does not prove this mechanism is active. It could simply reflect a cluster of limit orders being hit or a shift in spot sentiment without any leveraged pressure involved.
To better understand the risks, consider a scenario where price stabilizes quickly despite high volume. If this were a forced liquidation spiral, the mechanical selling would likely persist until the leverage is cleared. A counterexample occurs when volume spikes but the daily change -5.58318% remains relatively narrow. This suggests that the activity might be a high-turnover exchange of assets rather than a structural collapse of positions.
We can reassess this interpretation by watching the next few closed candles. If $AMDB stays below resistance 580.16 with declining RSI 13.0 and stays heavy, the mechanical pressure theory remains a possibility. Conversely, if price recovers the support level on lower volume, it suggests the initial drop was not driven by an irreversible liquidation chain. Monitoring for a failure to sustain the downward velocity helps distinguish a temporary event from a structural trend. ☖
Probabilistic market research, not a recommendation or guaranteed return.
#AMDB
Does every sharp price move in $AMDB signify a liquidation chain? While the hourly candle shows a down direction below support 540.5, volume is notably 3.42x the baseline.
A common misconception is that high volume during a support breach guarantees a cascade of long liquidations. In theory, a liquidation occurs when a price drop forces a platform to sell a leveraged position to protect the lending environment. This mechanical selling can push prices further down, creating more liquidations. However, high volume alone does not prove this mechanism is active. It could simply reflect a cluster of limit orders being hit or a shift in spot sentiment without any leveraged pressure involved.
To better understand the risks, consider a scenario where price stabilizes quickly despite high volume. If this were a forced liquidation spiral, the mechanical selling would likely persist until the leverage is cleared. A counterexample occurs when volume spikes but the daily change -5.58318% remains relatively narrow. This suggests that the activity might be a high-turnover exchange of assets rather than a structural collapse of positions.
We can reassess this interpretation by watching the next few closed candles. If $AMDB stays below resistance 580.16 with declining RSI 13.0 and stays heavy, the mechanical pressure theory remains a possibility. Conversely, if price recovers the support level on lower volume, it suggests the initial drop was not driven by an irreversible liquidation chain. Monitoring for a failure to sustain the downward velocity helps distinguish a temporary event from a structural trend. ☖
Probabilistic market research, not a recommendation or guaranteed return.
#AMDB
40
$AMDB: Is Attention Anchored to Resistance?
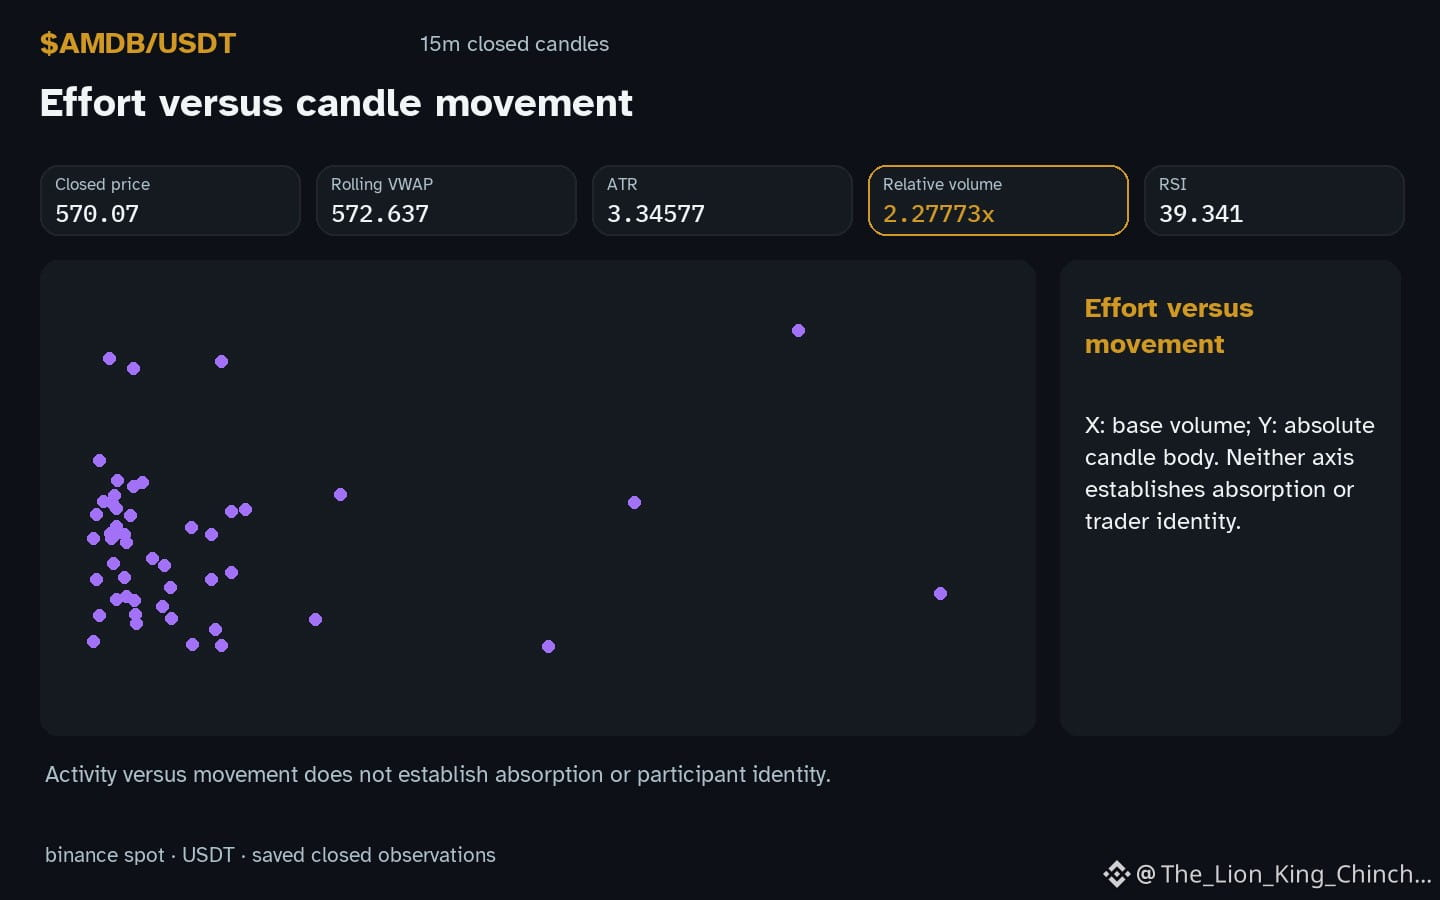
$AMDB: When AMDB moves down with volume above baseline, does crowd enthusiasm peak at the worst location?
The Anchor Trap
Traders often fix on a visible price level. If AMDB tests resistance at 580.03, attention spikes. This creates an anchor. Viewers may assume a reversal is imminent because the level looks important. In reality, a local bound does not predict continuation. The observation shows hourly direction down while volume sits above baseline. This mix suggests participation, but it does not confirm intent. A hypothesis is that heavy attention at a boundary can create a self-fulfilling pause. However, candles and volume alone cannot prove causation.
Counterexample
Consider a scenario where price rejects the level purely due to supply. Without order flow data, we cannot know if traders are exiting or waiting. The RSI reading of 39.3 provides context on momentum saturation but does not validate a specific strategy. Relying solely on the resistance line ignores the broader range structure between 566.86 and 580.03.
Self-Check
Ask yourself: am I choosing this level because it is statistically relevant, or because it grabbed my attention? If the latter, the bias is active. Look for closed-candle confirmation beyond the immediate touch. A break below 566.86 would weaken the resistance interpretation. Until then, treat the peak attention as a neutral observation, not a signal. This mental step separates the mechanism of anchoring from the market reality.
Probabilistic market research, not a recommendation or guaranteed return.
Watchlist contrast: $BTC has hourly direction up and volume not above its baseline; $BARD has hourly direction up and volume above its baseline. This alone does not establish correlation.
#AMDB #BTC #BARD #TradingPsychology #CryptoLearning
$AMDB : Is Attention Anchored to Resistance?
$AMDB : When AMDB moves down with volume above baseline, does crowd enthusiasm peak at the worst location?
The Anchor Trap
Traders often fix on a visible price level. If AMDB tests resistance at 580.03, attention spikes. This creates an anchor. Viewers may assume a reversal is imminent because the level looks important. In reality, a local bound does not predict continuation. The observation shows hourly direction down while volume sits above baseline. This mix suggests participation, but it does not confirm intent. A hypothesis is that heavy attention at a boundary can create a self-fulfilling pause. However, candles and volume alone cannot prove causation.
Counterexample
Consider a scenario where price rejects the level purely due to supply. Without order flow data, we cannot know if traders are exiting or waiting. The RSI reading of 39.3 provides context on momentum saturation but does not validate a specific strategy. Relying solely on the resistance line ignores the broader range structure between 566.86 and 580.03.
Self-Check
Ask yourself: am I choosing this level because it is statistically relevant, or because it grabbed my attention? If the latter, the bias is active. Look for closed-candle confirmation beyond the immediate touch. A break below 566.86 would weaken the resistance interpretation. Until then, treat the peak attention as a neutral observation, not a signal. This mental step separates the mechanism of anchoring from the market reality.
Probabilistic market research, not a recommendation or guaranteed return.
Watchlist contrast: $BTC has hourly direction up and volume not above its baseline; $BARD has hourly direction up and volume above its baseline. This alone does not establish correlation.
#AMDB #BTC #BARD #TradingPsychology #CryptoLearning
$AMDB : When AMDB moves down with volume above baseline, does crowd enthusiasm peak at the worst location?
The Anchor Trap
Traders often fix on a visible price level. If AMDB tests resistance at 580.03, attention spikes. This creates an anchor. Viewers may assume a reversal is imminent because the level looks important. In reality, a local bound does not predict continuation. The observation shows hourly direction down while volume sits above baseline. This mix suggests participation, but it does not confirm intent. A hypothesis is that heavy attention at a boundary can create a self-fulfilling pause. However, candles and volume alone cannot prove causation.
Counterexample
Consider a scenario where price rejects the level purely due to supply. Without order flow data, we cannot know if traders are exiting or waiting. The RSI reading of 39.3 provides context on momentum saturation but does not validate a specific strategy. Relying solely on the resistance line ignores the broader range structure between 566.86 and 580.03.
Self-Check
Ask yourself: am I choosing this level because it is statistically relevant, or because it grabbed my attention? If the latter, the bias is active. Look for closed-candle confirmation beyond the immediate touch. A break below 566.86 would weaken the resistance interpretation. Until then, treat the peak attention as a neutral observation, not a signal. This mental step separates the mechanism of anchoring from the market reality.
Probabilistic market research, not a recommendation or guaranteed return.
Watchlist contrast: $BTC has hourly direction up and volume not above its baseline; $BARD has hourly direction up and volume above its baseline. This alone does not establish correlation.
#AMDB #BTC #BARD #TradingPsychology #CryptoLearning
42
·
--
$AMDB +2.60% | $ONE +2.41% | $NVDAB +2.29%
#AMDB nudged up to $575.42, gaining +2.60% on $3.5 M of trades. The modest volume hints the move could be a short‑term pullback rather than a breakout.
#ONE climbed to $0.00148800, up +2.41% with a solid $13.0 M flowing through the market. Its low price and decent turnover suggest a steady interest from smaller players.
#NVDAB rose to $164.10, adding +2.29% on a hefty $217.6 M volume. Such deep liquidity often supports price stability, though a reversal can still catch traders off guard.
📈 Watching whether NVDAB’s large‑cap volume sustains the upward drift could signal broader market sentiment.
#Write2Earn #Binance
$AMDB +2.60% | $ONE +2.41% | $NVDAB +2.29%
#AMDB nudged up to $575.42, gaining +2.60% on $3.5 M of trades. The modest volume hints the move could be a short‑term pullback rather than a breakout.
#ONE climbed to $0.00148800, up +2.41% with a solid $13.0 M flowing through the market. Its low price and decent turnover suggest a steady interest from smaller players.
#NVDAB rose to $164.10, adding +2.29% on a hefty $217.6 M volume. Such deep liquidity often supports price stability, though a reversal can still catch traders off guard.
📈 Watching whether NVDAB’s large‑cap volume sustains the upward drift could signal broader market sentiment.
#Write2Earn #Binance
#AMDB nudged up to $575.42, gaining +2.60% on $3.5 M of trades. The modest volume hints the move could be a short‑term pullback rather than a breakout.
#ONE climbed to $0.00148800, up +2.41% with a solid $13.0 M flowing through the market. Its low price and decent turnover suggest a steady interest from smaller players.
#NVDAB rose to $164.10, adding +2.29% on a hefty $217.6 M volume. Such deep liquidity often supports price stability, though a reversal can still catch traders off guard.
📈 Watching whether NVDAB’s large‑cap volume sustains the upward drift could signal broader market sentiment.
#Write2Earn #Binance
13

·
--
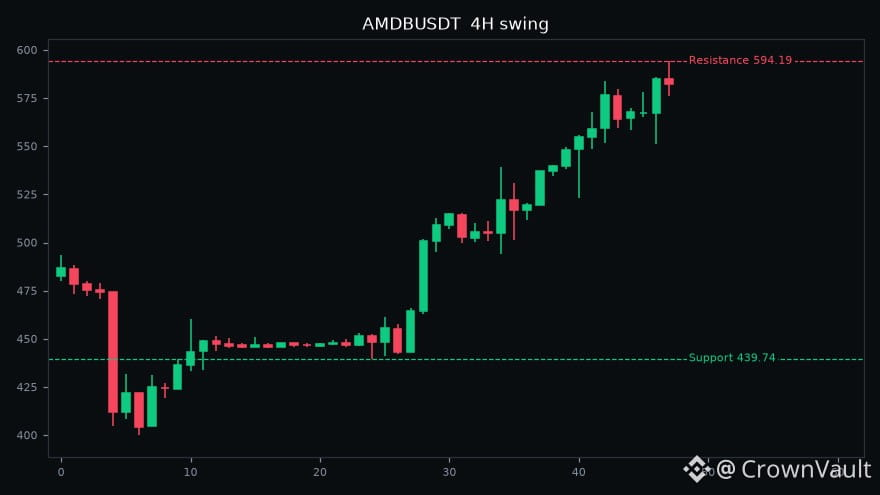
🚀 $AMDB among today's top gainers (+3.9%)
Price: 582.55
24h High: 594.19 | 24h Low: 551.00
24h Volume: $5.5M
Support: 439.74 | Resistance: 594.19
RSI 83: overbought zone. (4H swing)
Volume is picking up, don't chase blindly.
#AMDB #Crypto #CryptoTrading #Trading
⚠️ For education only. Trade at your own risk.
🚀 $AMDB among today's top gainers (+3.9%)
Price: 582.55
24h High: 594.19 | 24h Low: 551.00
24h Volume: $5.5M
Support: 439.74 | Resistance: 594.19
RSI 83: overbought zone. (4H swing)
Volume is picking up, don't chase blindly.
#AMDB #Crypto #CryptoTrading #Trading
⚠️ For education only. Trade at your own risk.
Price: 582.55
24h High: 594.19 | 24h Low: 551.00
24h Volume: $5.5M
Support: 439.74 | Resistance: 594.19
RSI 83: overbought zone. (4H swing)
Volume is picking up, don't chase blindly.
#AMDB #Crypto #CryptoTrading #Trading
⚠️ For education only. Trade at your own risk.
13

·
--
$AMDB looks ready to break higher right now
Buy $AMDB 577.6654 to 586.4586
SL 545.1379
Targets 644.0432 / 683.6054 / 742.9486
Volume is 2.5 times higher than the 7 day average
Price is holding near today's high of $585.7800
It is pushing right through the 7 day high
Sitting inside the zone as I type this
Tap $AMDB to buy
Last 7 days of my calls, 33 hit target and 79 hit stop
Who else is in
#AMDB #TradingSignals
$AMDB looks ready to break higher right now
Buy $AMDB 577.6654 to 586.4586
SL 545.1379
Targets 644.0432 / 683.6054 / 742.9486
Volume is 2.5 times higher than the 7 day average
Price is holding near today's high of $585.7800
It is pushing right through the 7 day high
Sitting inside the zone as I type this
Tap $AMDB to buy
Last 7 days of my calls, 33 hit target and 79 hit stop
Who else is in
#AMDB #TradingSignals
Buy $AMDB 577.6654 to 586.4586
SL 545.1379
Targets 644.0432 / 683.6054 / 742.9486
Volume is 2.5 times higher than the 7 day average
Price is holding near today's high of $585.7800
It is pushing right through the 7 day high
Sitting inside the zone as I type this
Tap $AMDB to buy
Last 7 days of my calls, 33 hit target and 79 hit stop
Who else is in
#AMDB #TradingSignals
5
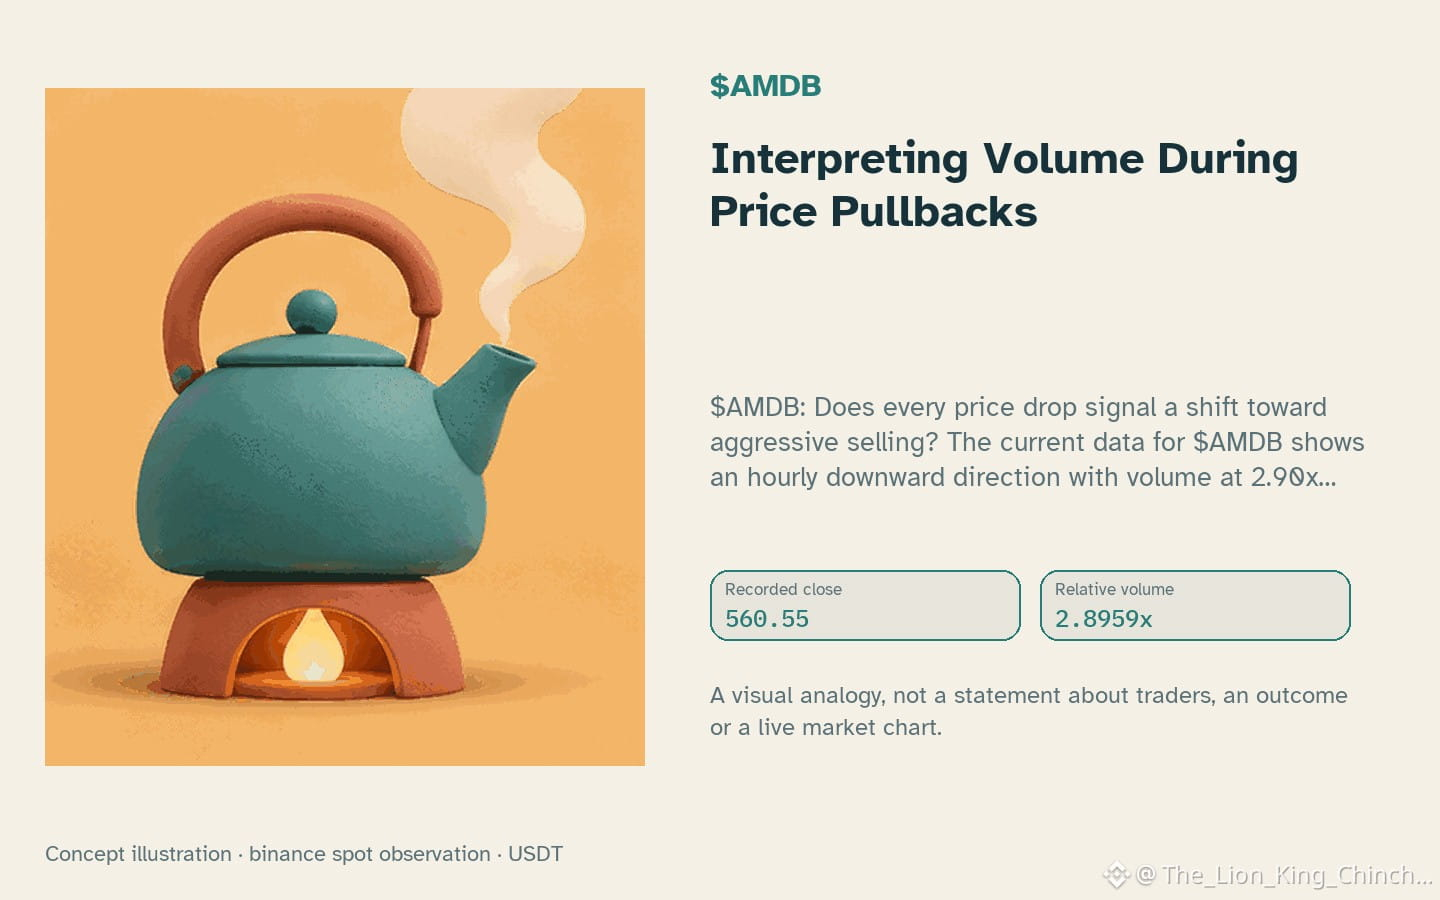
$AMDB: Interpreting Volume During Price Pullbacks
$AMDB: Does every price drop signal a shift toward aggressive selling? The current data for $AMDB shows an hourly downward direction with volume at 2.90x the baseline.
A common misconception is that all selling volume indicates a trend reversal. In a hypothetical mechanism called constructive digestion, a price might settle within a range to find a new equilibrium. This process often looks like a pullback where volume stays relatively low or decreases as the price approaches local support 553.59. If the volume remains high during a drop, as seen here, it suggests more active participation than a quiet digestion phase. However, high volume alone does not prove a permanent change in sentiment; it simply marks an area of intense activity.
This analogy fails if we assume volume reflects specific motives. Volume is just a count of completed transactions, not a measure of intent or future direction. For example, $AMDB is currently trading inside its recorded range with an RSI of 43.3. This RSI level provides a snapshot of momentum but cannot guarantee that support will hold. A high daily change of 2.96846% adds context to the recent volatility but does not define the next candle.
To reassess this interpretation, one should monitor for a closed candle below the local support level. If the price breaks that level on even higher relative volume, the idea of constructive digestion becomes less likely than a more persistent downward move. Consistent closes above the recent resistance 578.24 would instead suggest the digestion phase has concluded.
Probabilistic market research, not a recommendation or guaranteed return.
#AMDB #CryptoLearning
$AMDB : Interpreting Volume During Price Pullbacks
$AMDB : Does every price drop signal a shift toward aggressive selling? The current data for $AMDB shows an hourly downward direction with volume at 2.90x the baseline.
A common misconception is that all selling volume indicates a trend reversal. In a hypothetical mechanism called constructive digestion, a price might settle within a range to find a new equilibrium. This process often looks like a pullback where volume stays relatively low or decreases as the price approaches local support 553.59. If the volume remains high during a drop, as seen here, it suggests more active participation than a quiet digestion phase. However, high volume alone does not prove a permanent change in sentiment; it simply marks an area of intense activity.
This analogy fails if we assume volume reflects specific motives. Volume is just a count of completed transactions, not a measure of intent or future direction. For example, $AMDB is currently trading inside its recorded range with an RSI of 43.3. This RSI level provides a snapshot of momentum but cannot guarantee that support will hold. A high daily change of 2.96846% adds context to the recent volatility but does not define the next candle.
To reassess this interpretation, one should monitor for a closed candle below the local support level. If the price breaks that level on even higher relative volume, the idea of constructive digestion becomes less likely than a more persistent downward move. Consistent closes above the recent resistance 578.24 would instead suggest the digestion phase has concluded.
Probabilistic market research, not a recommendation or guaranteed return.
#AMDB #CryptoLearning
$AMDB : Does every price drop signal a shift toward aggressive selling? The current data for $AMDB shows an hourly downward direction with volume at 2.90x the baseline.
A common misconception is that all selling volume indicates a trend reversal. In a hypothetical mechanism called constructive digestion, a price might settle within a range to find a new equilibrium. This process often looks like a pullback where volume stays relatively low or decreases as the price approaches local support 553.59. If the volume remains high during a drop, as seen here, it suggests more active participation than a quiet digestion phase. However, high volume alone does not prove a permanent change in sentiment; it simply marks an area of intense activity.
This analogy fails if we assume volume reflects specific motives. Volume is just a count of completed transactions, not a measure of intent or future direction. For example, $AMDB is currently trading inside its recorded range with an RSI of 43.3. This RSI level provides a snapshot of momentum but cannot guarantee that support will hold. A high daily change of 2.96846% adds context to the recent volatility but does not define the next candle.
To reassess this interpretation, one should monitor for a closed candle below the local support level. If the price breaks that level on even higher relative volume, the idea of constructive digestion becomes less likely than a more persistent downward move. Consistent closes above the recent resistance 578.24 would instead suggest the digestion phase has concluded.
Probabilistic market research, not a recommendation or guaranteed return.
#AMDB #CryptoLearning
21
Log in to explore more content
Join global crypto users on Binance Square
⚡️ Get latest and useful information about crypto.
💬 Trusted by the world’s largest crypto exchange.
👍 Discover real insights from verified creators.
Email / Phone number
Trending Topics
1
#CanBTCReboundAfterFallingBelow60K?
355,715 views
1,492 Discussing
2
#GlobalStocksFaceLongestLosingStreakSince2023
117,251 views
1,060 Discussing
3
#BlackRockIBITPostsRecord$541MSingleDayOutflow
588 views
15 Discussing
4
#AnthropicPlungesTowardIPOPriceonDay2
56,610 views
572 Discussing
5
#TwentyOneCapitalAdds172.25BTC
9,276 views
146 Discussing
6
#HKBillWouldExcludeTokenizedDepositsFromVirtualAssets
819 views
14 Discussing
7
#BNBDropsBelow540USDTWith8.46%DailyDecline
30,205 views
254 Discussing
8
#HKBillProposesHK$100KFineForUnauthorizedCryptoTitles
999 views
14 Discussing
9
#BitMineFaces$10.1BUnrealizedETHLoss
1,955 views
18 Discussing
10
#StrategyReports$35BNetReserves
1,814 views
17 Discussing