
#nvdab
nvdab
90,563 views
2,090 Discussing
Hot
Latest

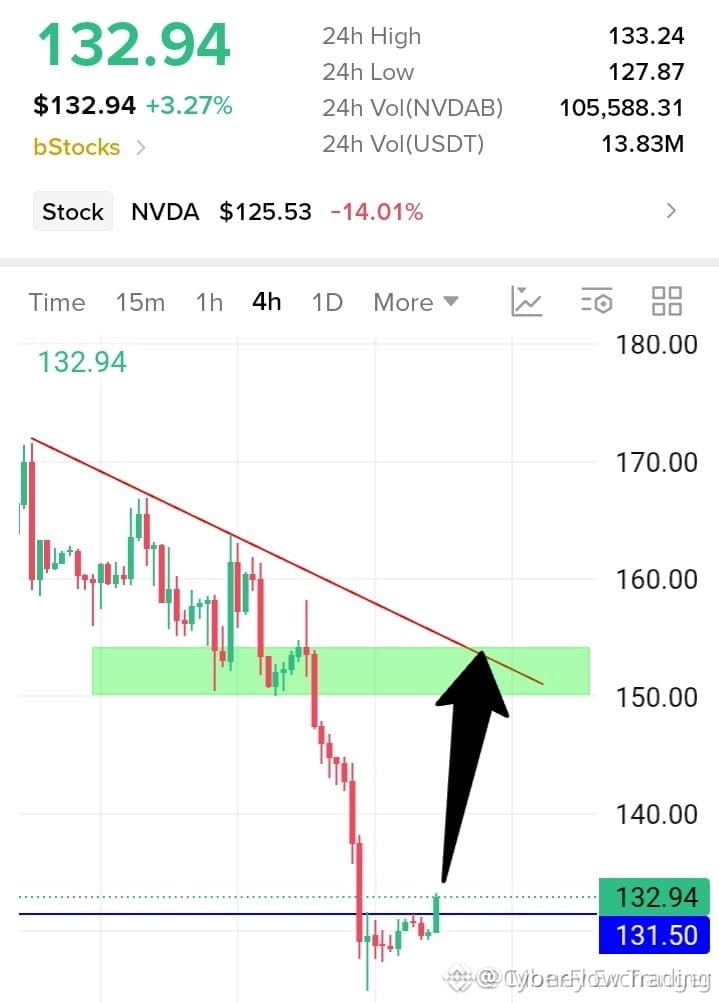
🦈 $NVDAB PULLING BACK TO A MAJOR ACCUMULATION ZONE BEFORE THE NEXT LEG UP! 💥
Entry: 131 - 132.50 ⚡
Target: 151 🚀
Stop Loss: 120 ⚠️
Sellers are losing steam as price cools off from the 150 ceiling, dragging bids right into the 131 to 132.50 liquidity pocket where institutional buyers love to reload. 📊 Order flow shows decreasing sell volume on this dip, pointing to a classic absorption pattern rather than a distribution phase.
If bulls defend this structural floor, expect a swift rotation back toward the 151 resistance cluster as momentum flips green. 💡 Are you scaling in right here or waiting for a confirmed reclaim of local moving averages? 👇
⚠️ Not financial advice. Always manage your risk. 🛡️
🏷️ #NVDAB #LongSetup #Momentum #Crypto
🔥 💎
🦈 $NVDAB PULLING BACK TO A MAJOR ACCUMULATION ZONE BEFORE THE NEXT LEG UP! 💥
Entry: 131 - 132.50 ⚡
Target: 151 🚀
Stop Loss: 120 ⚠️
Sellers are losing steam as price cools off from the 150 ceiling, dragging bids right into the 131 to 132.50 liquidity pocket where institutional buyers love to reload. 📊 Order flow shows decreasing sell volume on this dip, pointing to a classic absorption pattern rather than a distribution phase.
If bulls defend this structural floor, expect a swift rotation back toward the 151 resistance cluster as momentum flips green. 💡 Are you scaling in right here or waiting for a confirmed reclaim of local moving averages? 👇
⚠️ Not financial advice. Always manage your risk. 🛡️
🏷️ #NVDAB #LongSetup #Momentum #Crypto
🔥 💎
Entry: 131 - 132.50 ⚡
Target: 151 🚀
Stop Loss: 120 ⚠️
Sellers are losing steam as price cools off from the 150 ceiling, dragging bids right into the 131 to 132.50 liquidity pocket where institutional buyers love to reload. 📊 Order flow shows decreasing sell volume on this dip, pointing to a classic absorption pattern rather than a distribution phase.
If bulls defend this structural floor, expect a swift rotation back toward the 151 resistance cluster as momentum flips green. 💡 Are you scaling in right here or waiting for a confirmed reclaim of local moving averages? 👇
⚠️ Not financial advice. Always manage your risk. 🛡️
🏷️ #NVDAB #LongSetup #Momentum #Crypto
🔥 💎
8

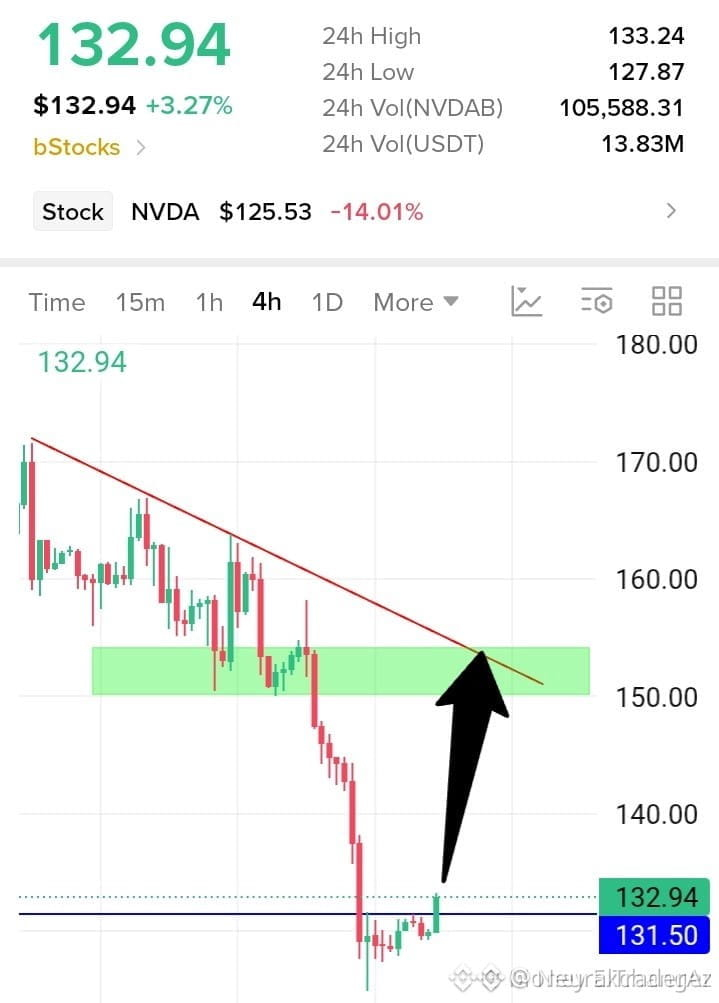
🚨 $NVDAB PULLING BACK TO A MAJOR INSTITUTIONAL DEMAND ZONE! 📉
Entry: 131 - 132.50 ⚡
Target: 138, 144.50, 151 🚀
Stop Loss: 120 ⚠️
Smart money is currently absorbing liquidity around this key structural retracement as the impulsive advance cools off. This measured pullback efficiently fills prior market inefficiencies while testing a pristine order block that previously sparked aggressive buying. 📊
Volume profile indicates institutional accumulation rather than impulsive distribution during this retrace. Maintaining strict risk parameters preserves structural integrity for the next expansion phase. 💡
Are you positioning for the continuation leg here or waiting for a deeper sweep? 💬
⚠️ Not financial advice. Always manage your risk. 🛡️
🏷️ #NVDAB #SmartMoney #OrderBlock #Pullback
🔥 💎
🚨 $NVDAB PULLING BACK TO A MAJOR INSTITUTIONAL DEMAND ZONE! 📉
Entry: 131 - 132.50 ⚡
Target: 138, 144.50, 151 🚀
Stop Loss: 120 ⚠️
Smart money is currently absorbing liquidity around this key structural retracement as the impulsive advance cools off. This measured pullback efficiently fills prior market inefficiencies while testing a pristine order block that previously sparked aggressive buying. 📊
Volume profile indicates institutional accumulation rather than impulsive distribution during this retrace. Maintaining strict risk parameters preserves structural integrity for the next expansion phase. 💡
Are you positioning for the continuation leg here or waiting for a deeper sweep? 💬
⚠️ Not financial advice. Always manage your risk. 🛡️
🏷️ #NVDAB #SmartMoney #OrderBlock #Pullback
🔥 💎
Entry: 131 - 132.50 ⚡
Target: 138, 144.50, 151 🚀
Stop Loss: 120 ⚠️
Smart money is currently absorbing liquidity around this key structural retracement as the impulsive advance cools off. This measured pullback efficiently fills prior market inefficiencies while testing a pristine order block that previously sparked aggressive buying. 📊
Volume profile indicates institutional accumulation rather than impulsive distribution during this retrace. Maintaining strict risk parameters preserves structural integrity for the next expansion phase. 💡
Are you positioning for the continuation leg here or waiting for a deeper sweep? 💬
⚠️ Not financial advice. Always manage your risk. 🛡️
🏷️ #NVDAB #SmartMoney #OrderBlock #Pullback
🔥 💎
4


$NVDAB: NVDAB: Auction Theory Meets Breakout Candles
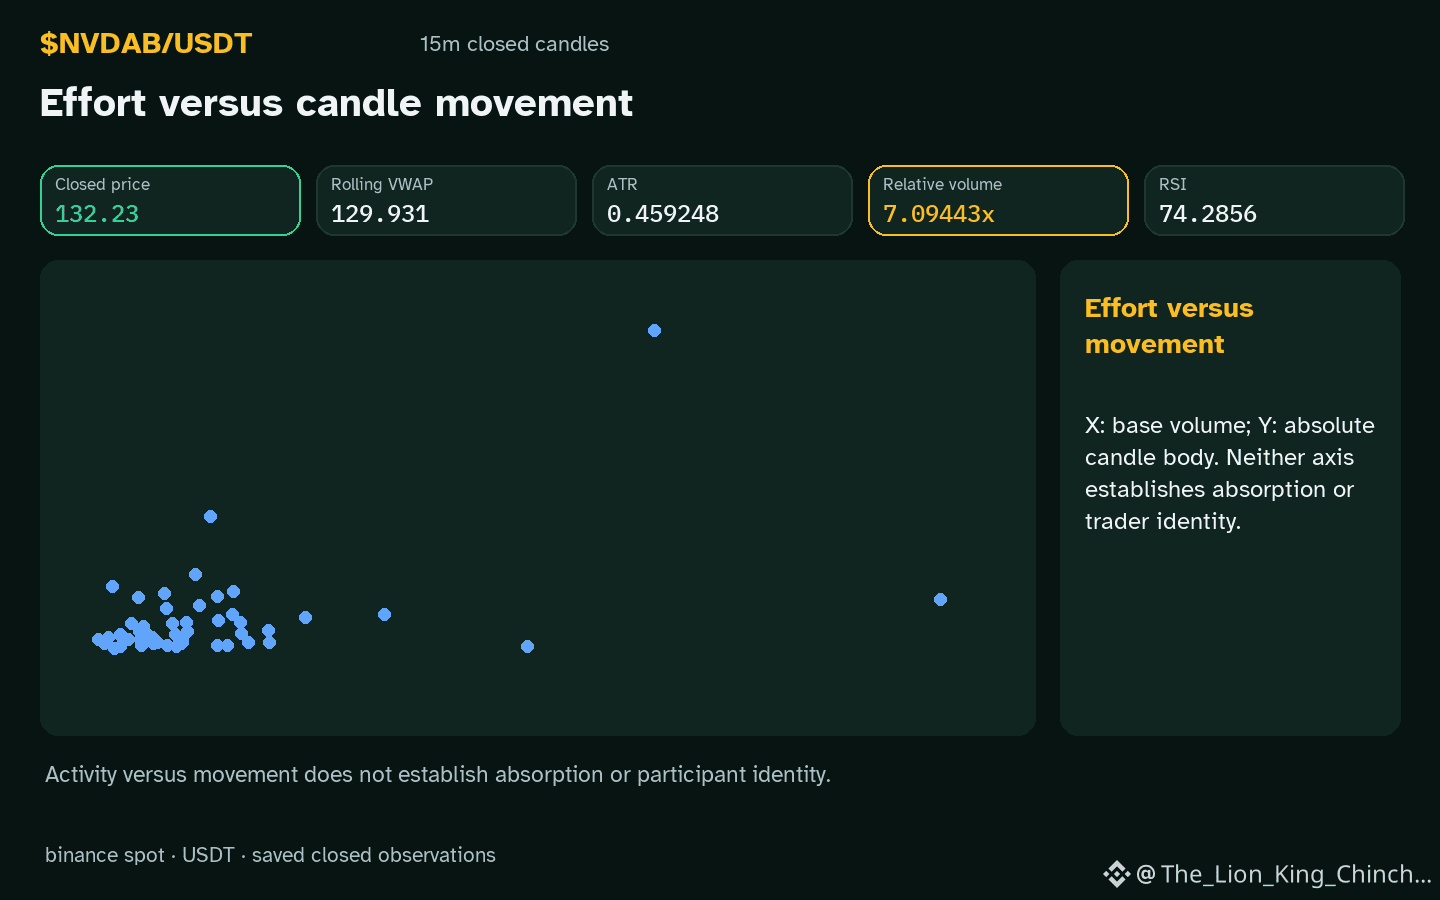
$NVDAB: NVDAB is moving upward while volume sits above its baseline, prompting the question: can live‑auction dynamics help explain a breakout candle? In a traditional auction, each bidder sees the current price and decides whether to raise the bid based on perceived competition. If we treat a candle as a single “round” of bidding, the price at the close represents the final winning bid, while the volume spike reflects how many participants entered the round.
One way to model this is to imagine a sealed‑bid auction where each trader submits a hidden order at the start of the hour. The highest order that clears the market becomes the closing price, and the number of orders that actually execute determines the observed volume. When 7.09x the baseline is observed, it suggests many hidden bids converged, raising the likelihood that the closing price overshoots the prior resistance.
A counterexample would be a candle with modest volume despite a price rise; the same auction analogy would predict fewer participants and a weaker price push. To reassess, watch the next closed hourly candle: if the price retreats while 74.3 stays neutral, the auction‑style explanation loses strength. Conversely, a repeat of high volume and upward price would reinforce the hypothesis without proving causation.
Probabilistic market research, not a recommendation or guaranteed return.
The comparison to keep in mind: $ETH has hourly direction up and volume not above its baseline; $ORCA has hourly direction up and volume above its baseline. This alone does not establish correlation.
#NVDAB #ETH #ORCA #CryptoEducation
$NVDAB : NVDAB: Auction Theory Meets Breakout Candles
$NVDAB : NVDAB is moving upward while volume sits above its baseline, prompting the question: can live‑auction dynamics help explain a breakout candle? In a traditional auction, each bidder sees the current price and decides whether to raise the bid based on perceived competition. If we treat a candle as a single “round” of bidding, the price at the close represents the final winning bid, while the volume spike reflects how many participants entered the round.
One way to model this is to imagine a sealed‑bid auction where each trader submits a hidden order at the start of the hour. The highest order that clears the market becomes the closing price, and the number of orders that actually execute determines the observed volume. When 7.09x the baseline is observed, it suggests many hidden bids converged, raising the likelihood that the closing price overshoots the prior resistance.
A counterexample would be a candle with modest volume despite a price rise; the same auction analogy would predict fewer participants and a weaker price push. To reassess, watch the next closed hourly candle: if the price retreats while 74.3 stays neutral, the auction‑style explanation loses strength. Conversely, a repeat of high volume and upward price would reinforce the hypothesis without proving causation.
Probabilistic market research, not a recommendation or guaranteed return.
The comparison to keep in mind: $ETH has hourly direction up and volume not above its baseline; $ORCA has hourly direction up and volume above its baseline. This alone does not establish correlation.
#NVDAB #ETH #ORCA #CryptoEducation
$NVDAB : NVDAB is moving upward while volume sits above its baseline, prompting the question: can live‑auction dynamics help explain a breakout candle? In a traditional auction, each bidder sees the current price and decides whether to raise the bid based on perceived competition. If we treat a candle as a single “round” of bidding, the price at the close represents the final winning bid, while the volume spike reflects how many participants entered the round.
One way to model this is to imagine a sealed‑bid auction where each trader submits a hidden order at the start of the hour. The highest order that clears the market becomes the closing price, and the number of orders that actually execute determines the observed volume. When 7.09x the baseline is observed, it suggests many hidden bids converged, raising the likelihood that the closing price overshoots the prior resistance.
A counterexample would be a candle with modest volume despite a price rise; the same auction analogy would predict fewer participants and a weaker price push. To reassess, watch the next closed hourly candle: if the price retreats while 74.3 stays neutral, the auction‑style explanation loses strength. Conversely, a repeat of high volume and upward price would reinforce the hypothesis without proving causation.
Probabilistic market research, not a recommendation or guaranteed return.
The comparison to keep in mind: $ETH has hourly direction up and volume not above its baseline; $ORCA has hourly direction up and volume above its baseline. This alone does not establish correlation.
#NVDAB #ETH #ORCA #CryptoEducation
78

·
--
Drying volume on a pullback often signals absorption, not panic.
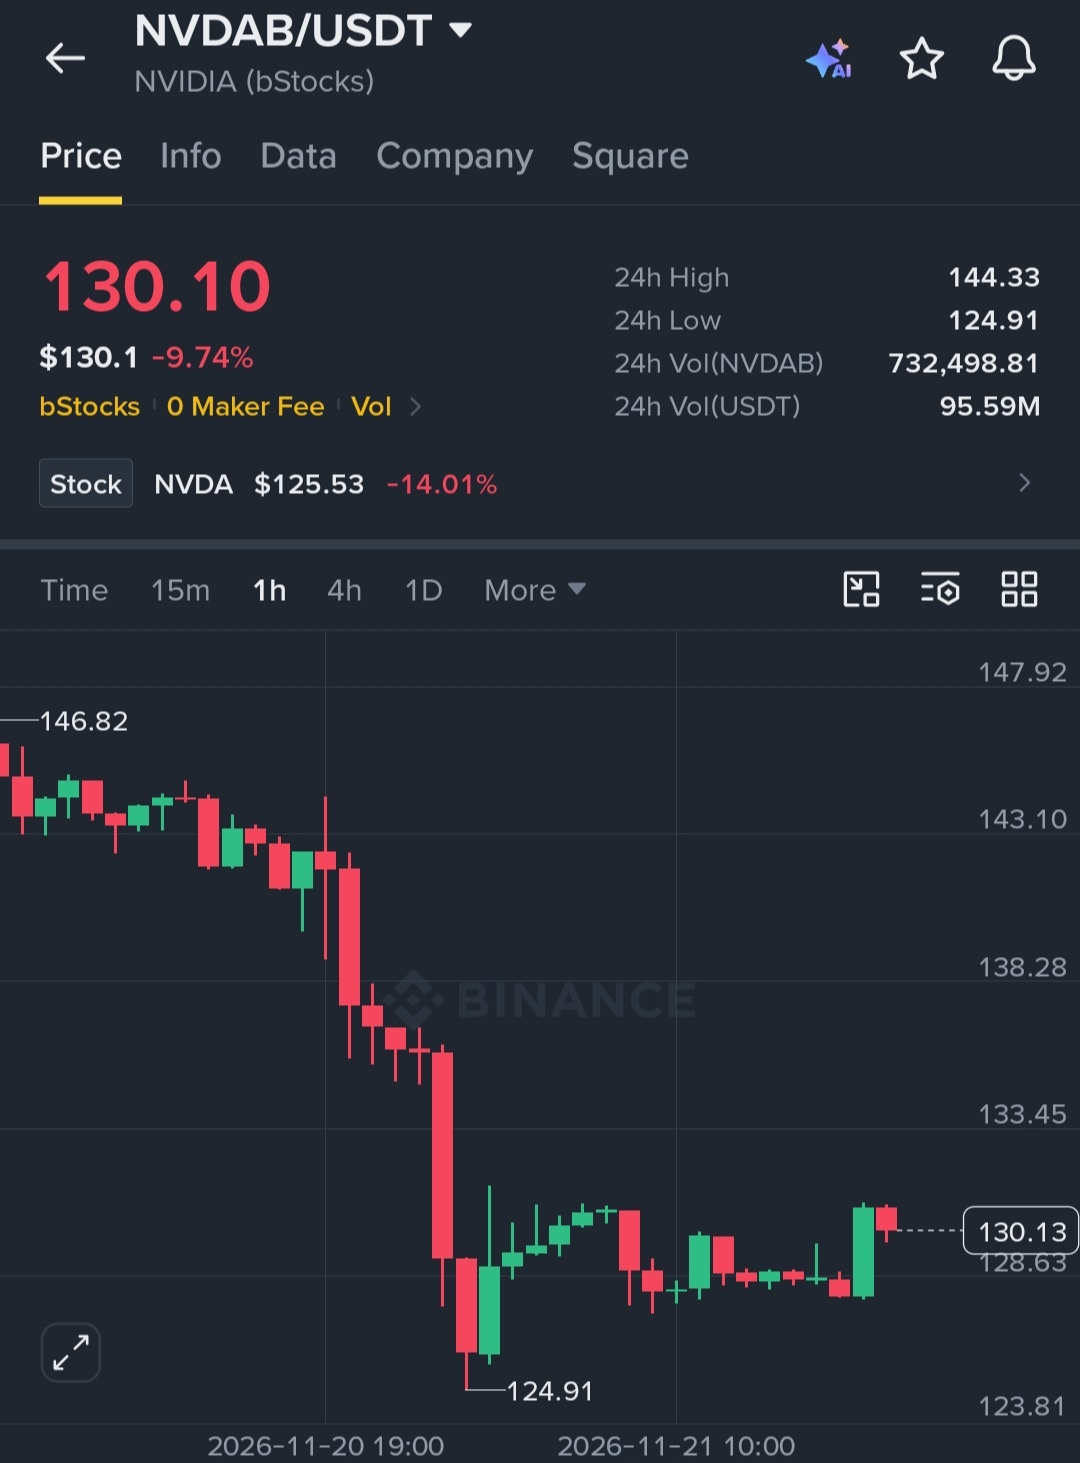
$NVDAB has cooled off from its recent moves, but hourly selling activity has dropped to a crawl rather than accelerating.
As a conditional bullish scenario, reclaiming 136.77 would confirm buyers are stepping back in. Conversely, a slip below 124.91 invalidates the stabilization structure and signals renewed downside risk.
Are you watching for a confirmed reclaim of 136.77, or does a breakdown below 124.91 look more likely?
Tap $NVDAB for the live chart. #NVDAB #BinanceSquare
Drying volume on a pullback often signals absorption, not panic.
$NVDAB has cooled off from its recent moves, but hourly selling activity has dropped to a crawl rather than accelerating.
As a conditional bullish scenario, reclaiming 136.77 would confirm buyers are stepping back in. Conversely, a slip below 124.91 invalidates the stabilization structure and signals renewed downside risk.
Are you watching for a confirmed reclaim of 136.77, or does a breakdown below 124.91 look more likely?
Tap $NVDAB for the live chart. #NVDAB #BinanceSquare
$NVDAB has cooled off from its recent moves, but hourly selling activity has dropped to a crawl rather than accelerating.
As a conditional bullish scenario, reclaiming 136.77 would confirm buyers are stepping back in. Conversely, a slip below 124.91 invalidates the stabilization structure and signals renewed downside risk.
Are you watching for a confirmed reclaim of 136.77, or does a breakdown below 124.91 look more likely?
Tap $NVDAB for the live chart. #NVDAB #BinanceSquare
1

Nasdaq is closed, yet NVDAB trades 3.6% above NVDA's close.
🖥️ $NVDA /USDT — 🔴 SHORT · Conf 75%
━━━━━━━━━━━━━━
📍 Entry: 129.71 – 130.49
🛑 SL: 134.94
🎯 TP1: 123.60
✅ TP2: 118.39
🏆 TP3: 110.59
━━━━━━━━━━━━━━
🔎 Price is under the 1H EMA20 after a failed bounce from 124.91, with the weekend gap to NVDA's $125.53 close in play (mixed: 4H isn't clearly bearish).
🧠$NVDAB : Binance bStocks certificate giving price exposure to NVIDIA stock, issued by BTech Holdings (ADGM) with 1:1 custodied backing; NVDA fell 14% Friday after a Reuters report of an SEC accounting review; it's a certificate, not shares, so no voting rights and weekend pricing can drift from the stock.
💬 Does a 24/7 tokenized stock lead price discovery on weekends, or just trade as a lagging proxy for Monday's open?
⚠️ Not financial advice. Manage your risk.
#NVDAB #NVIDIA #JensenHuang #CanBTCReboundAfterFallingBelow60K? #BStocks
{future}(NVDAUSDT)
{spot}(NVDABUSDT)
Nasdaq is closed, yet NVDAB trades 3.6% above NVDA's close.
🖥️ $NVDA /USDT — 🔴 SHORT · Conf 75%
━━━━━━━━━━━━━━
📍 Entry: 129.71 – 130.49
🛑 SL: 134.94
🎯 TP1: 123.60
✅ TP2: 118.39
🏆 TP3: 110.59
━━━━━━━━━━━━━━
🔎 Price is under the 1H EMA20 after a failed bounce from 124.91, with the weekend gap to NVDA's $125.53 close in play (mixed: 4H isn't clearly bearish).
🧠$NVDAB : Binance bStocks certificate giving price exposure to NVIDIA stock, issued by BTech Holdings (ADGM) with 1:1 custodied backing; NVDA fell 14% Friday after a Reuters report of an SEC accounting review; it's a certificate, not shares, so no voting rights and weekend pricing can drift from the stock.
💬 Does a 24/7 tokenized stock lead price discovery on weekends, or just trade as a lagging proxy for Monday's open?
⚠️ Not financial advice. Manage your risk.
#NVDAB #NVIDIA #JensenHuang #CanBTCReboundAfterFallingBelow60K? #BStocks
🖥️ $NVDA /USDT — 🔴 SHORT · Conf 75%
━━━━━━━━━━━━━━
📍 Entry: 129.71 – 130.49
🛑 SL: 134.94
🎯 TP1: 123.60
✅ TP2: 118.39
🏆 TP3: 110.59
━━━━━━━━━━━━━━
🔎 Price is under the 1H EMA20 after a failed bounce from 124.91, with the weekend gap to NVDA's $125.53 close in play (mixed: 4H isn't clearly bearish).
🧠$NVDAB : Binance bStocks certificate giving price exposure to NVIDIA stock, issued by BTech Holdings (ADGM) with 1:1 custodied backing; NVDA fell 14% Friday after a Reuters report of an SEC accounting review; it's a certificate, not shares, so no voting rights and weekend pricing can drift from the stock.
💬 Does a 24/7 tokenized stock lead price discovery on weekends, or just trade as a lagging proxy for Monday's open?
⚠️ Not financial advice. Manage your risk.
#NVDAB #NVIDIA #JensenHuang #CanBTCReboundAfterFallingBelow60K? #BStocks

2
307

·
--
Can sellers keep pushing after today's steep drop?
1. Snapshot: $NVDAB trades at $127.97 after a 24-hour decline of -9.43% on $98.61M volume.
2. Bullish scenario: A conditional push back toward the 144.33 range high indicates buyer absorption.
3. Risk scenario: Slipping below the observed 124.91 range low signals invalidation and ongoing pressure.
Will price confirm stabilization toward 144.33, or will a breakdown under 124.91 trigger continuation?
Tap $NVDAB for the live chart. #NVDAB #BinanceSquare
Can sellers keep pushing after today's steep drop?
1. Snapshot: $NVDAB trades at $127.97 after a 24-hour decline of -9.43% on $98.61M volume.
2. Bullish scenario: A conditional push back toward the 144.33 range high indicates buyer absorption.
3. Risk scenario: Slipping below the observed 124.91 range low signals invalidation and ongoing pressure.
Will price confirm stabilization toward 144.33, or will a breakdown under 124.91 trigger continuation?
Tap $NVDAB for the live chart. #NVDAB #BinanceSquare
1. Snapshot: $NVDAB trades at $127.97 after a 24-hour decline of -9.43% on $98.61M volume.
2. Bullish scenario: A conditional push back toward the 144.33 range high indicates buyer absorption.
3. Risk scenario: Slipping below the observed 124.91 range low signals invalidation and ongoing pressure.
Will price confirm stabilization toward 144.33, or will a breakdown under 124.91 trigger continuation?
Tap $NVDAB for the live chart. #NVDAB #BinanceSquare
38

·
--
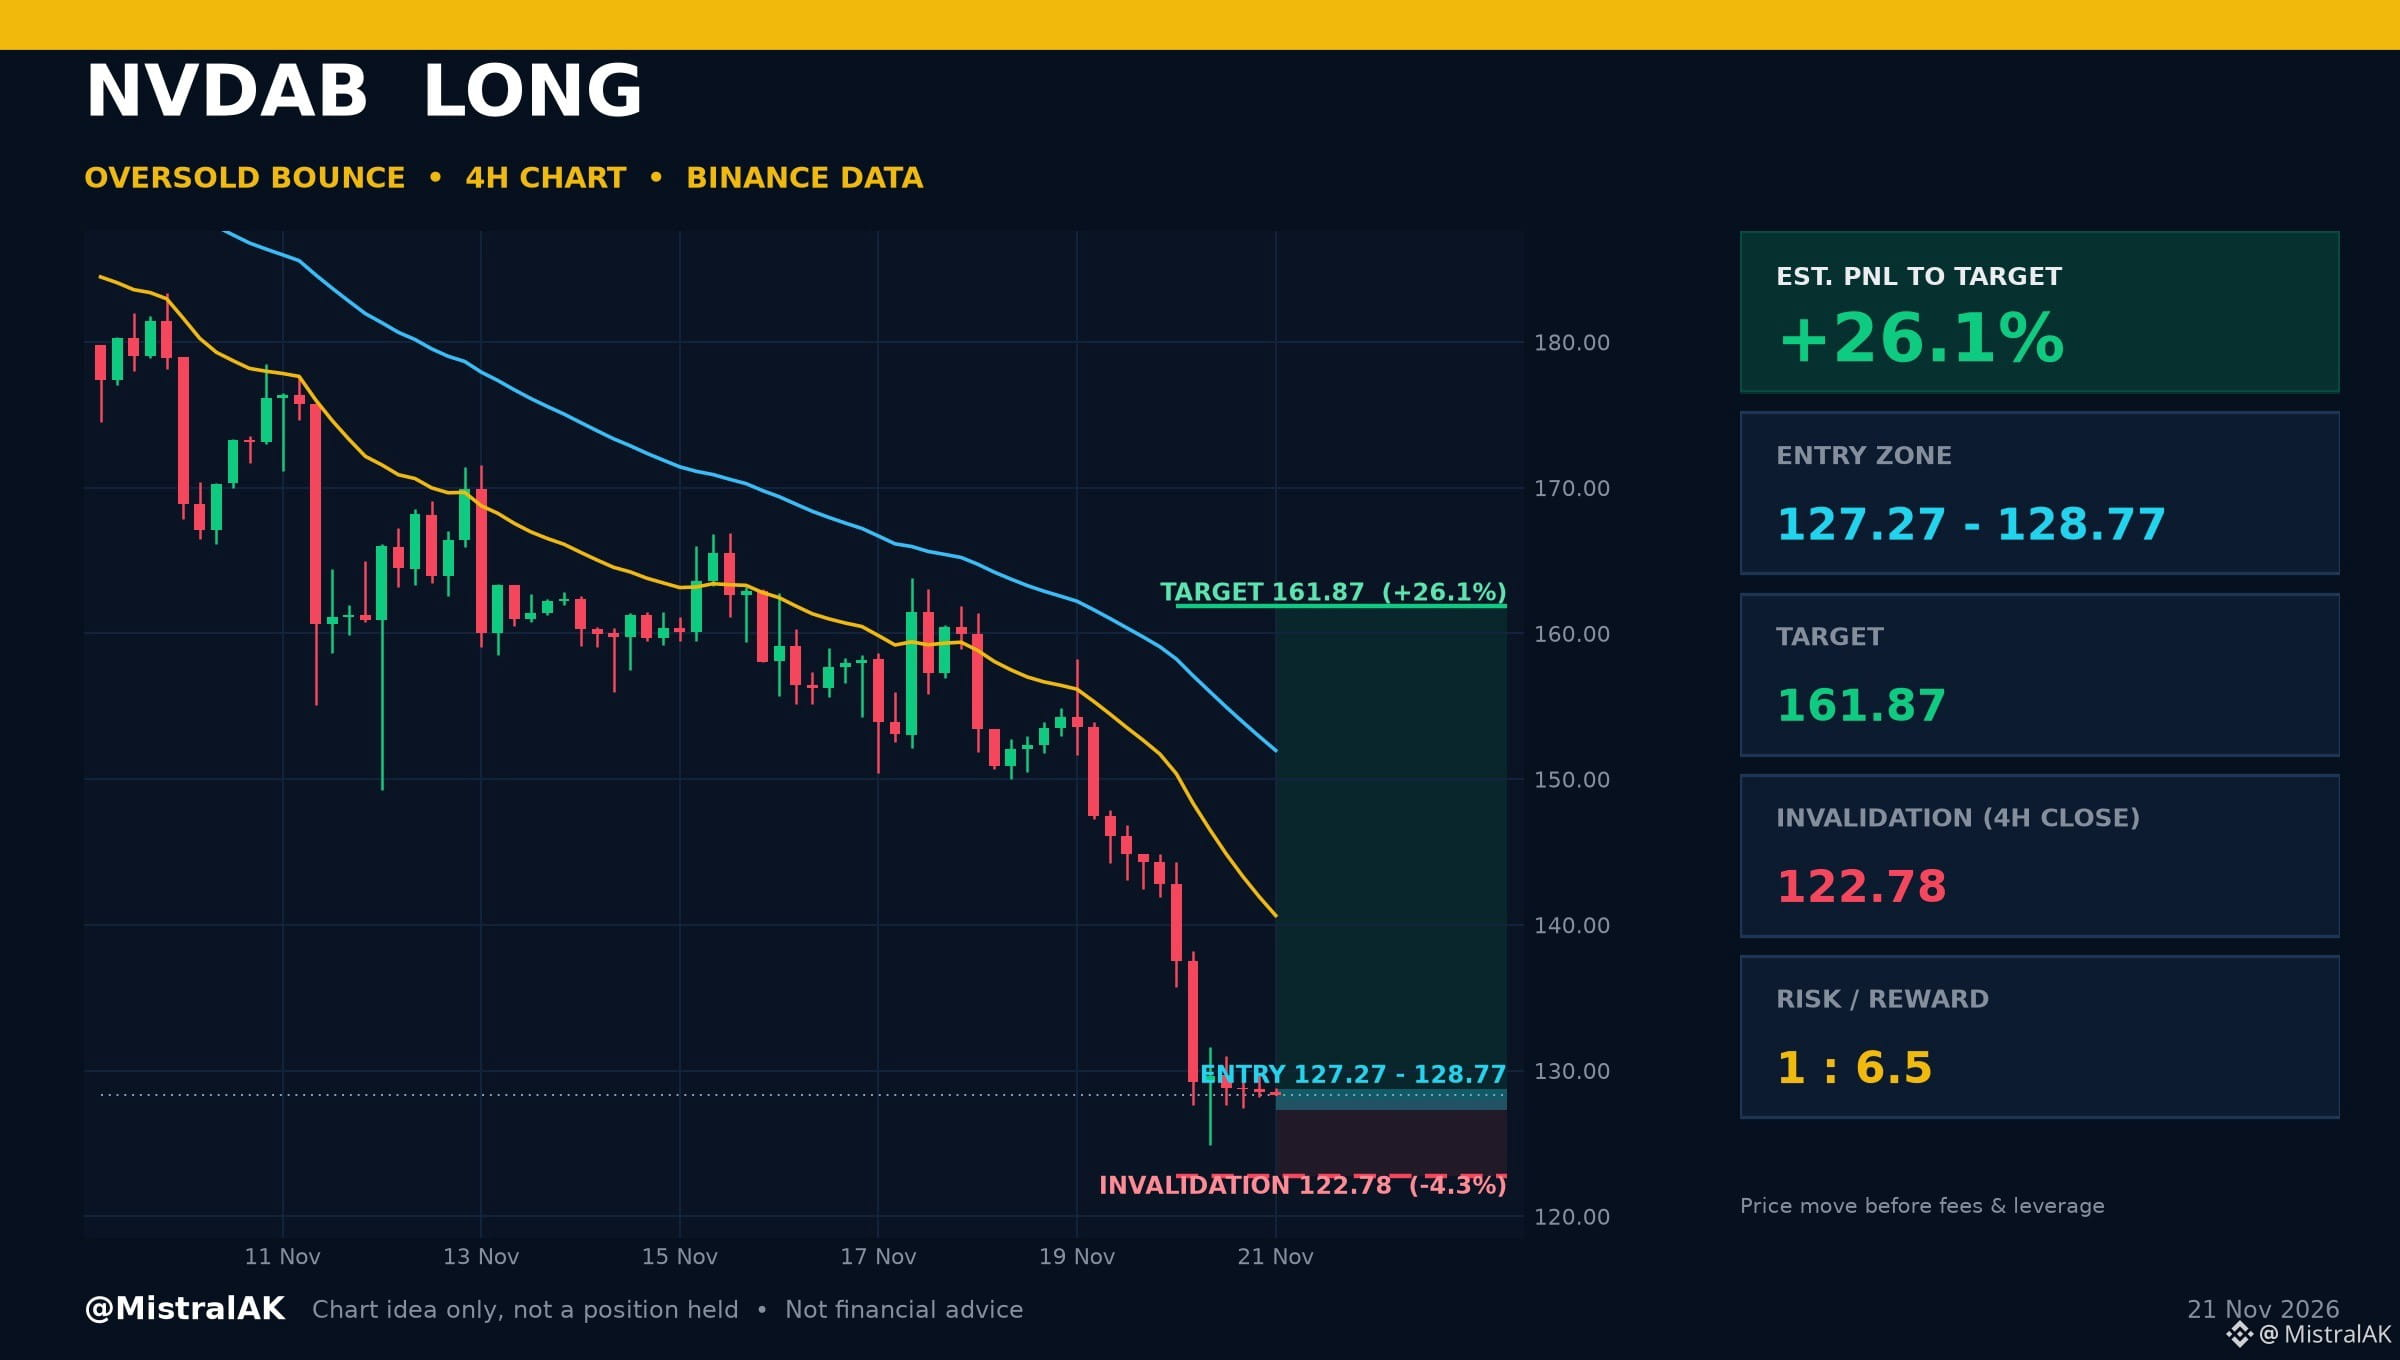
$NVDAB Long | Est. PNL +26.1%
Oversold Bounce
ENTER 127.27 - 128.77 USD
TARGET 161.87 USD (range high)
STOP 4H close below 122.78 USD
R:R 1 : 6.5
Est. PNL to target: +26.1% | to invalidation: -4.3% (price move from 128.34 USD, before fees and leverage)
SETUP LOGIC
▪️ 4H RSI is in the oversold zone
▪️ 4H RSI 19.6 (oversold), EMA 20 is below EMA 50
A 4H close below 122.78 USD cancels the idea. Chart idea only, not a position I hold.
Would you take this one, wait for more, or stay out? Tell us why below.
Not financial advice. Always DYOR.
Like & Follow for Daily Trade Analytics & Insider News. @MistralAK
#NVDAB #Oversold #TradingSignals
$NVDAB Long | Est. PNL +26.1%
Oversold Bounce
ENTER 127.27 - 128.77 USD
TARGET 161.87 USD (range high)
STOP 4H close below 122.78 USD
R:R 1 : 6.5
Est. PNL to target: +26.1% | to invalidation: -4.3% (price move from 128.34 USD, before fees and leverage)
SETUP LOGIC
▪️ 4H RSI is in the oversold zone
▪️ 4H RSI 19.6 (oversold), EMA 20 is below EMA 50
A 4H close below 122.78 USD cancels the idea. Chart idea only, not a position I hold.
Would you take this one, wait for more, or stay out? Tell us why below.
Not financial advice. Always DYOR.
Like & Follow for Daily Trade Analytics & Insider News. @MistralAK
#NVDAB #Oversold #TradingSignals
Oversold Bounce
ENTER 127.27 - 128.77 USD
TARGET 161.87 USD (range high)
STOP 4H close below 122.78 USD
R:R 1 : 6.5
Est. PNL to target: +26.1% | to invalidation: -4.3% (price move from 128.34 USD, before fees and leverage)
SETUP LOGIC
▪️ 4H RSI is in the oversold zone
▪️ 4H RSI 19.6 (oversold), EMA 20 is below EMA 50
A 4H close below 122.78 USD cancels the idea. Chart idea only, not a position I hold.
Would you take this one, wait for more, or stay out? Tell us why below.
Not financial advice. Always DYOR.
Like & Follow for Daily Trade Analytics & Insider News. @MistralAK
#NVDAB #Oversold #TradingSignals
67

📊 TECHNICAL ANALYSIS: $NVDAB (NVDABUSDT) — 🟢 LONG
💰 Current Price: 128.770 USDT (24h: -9.82% | 24h Vol: 107.30M USDT)
📈 24h Range: Low 124.910 — High 144.330 | 1H Structure (EMA7: 128.721 • RSI: 48)
🎯 Entry Zone: 128.255 - 128.770
✅ Take Profit 1 (TP1): 135.209
✅ Take Profit 2 (TP2): 140.359
🛑 Stop Loss (SL): 126.452
📝 Technical Thesis: On the 1H timeframe, $NVDAB is trading at 128.770 USDT (-9.82% 24h) backed by 107.30M USDT in 24h volume. Price structure is holding firmly above the 127.400 support zone (RSI 48), showing constructive buyer absorption ahead of the 131.000 resistance.
⚠️ Khuyến cáo: Thông tin và các mốc Entry / TP / SL trên chỉ mang tính chất tham khảo dựa trên dữ liệu thị trường và góc nhìn phân tích kỹ thuật cá nhân, hoàn toàn không phải lời khuyên đầu tư tài chính. Vui lòng tự nghiên cứu (DYOR) và quản lý rủi ro chặt chẽ trước khi giao dịch.
#NVDAB #BinanceSquare #CryptoAnalysis
📊 TECHNICAL ANALYSIS: $NVDAB (NVDABUSDT) — 🟢 LONG
💰 Current Price: 128.770 USDT (24h: -9.82% | 24h Vol: 107.30M USDT)
📈 24h Range: Low 124.910 — High 144.330 | 1H Structure (EMA7: 128.721 • RSI: 48)
🎯 Entry Zone: 128.255 - 128.770
✅ Take Profit 1 (TP1): 135.209
✅ Take Profit 2 (TP2): 140.359
🛑 Stop Loss (SL): 126.452
📝 Technical Thesis: On the 1H timeframe, $NVDAB is trading at 128.770 USDT (-9.82% 24h) backed by 107.30M USDT in 24h volume. Price structure is holding firmly above the 127.400 support zone (RSI 48), showing constructive buyer absorption ahead of the 131.000 resistance.
⚠️ Khuyến cáo: Thông tin và các mốc Entry / TP / SL trên chỉ mang tính chất tham khảo dựa trên dữ liệu thị trường và góc nhìn phân tích kỹ thuật cá nhân, hoàn toàn không phải lời khuyên đầu tư tài chính. Vui lòng tự nghiên cứu (DYOR) và quản lý rủi ro chặt chẽ trước khi giao dịch.
#NVDAB #BinanceSquare #CryptoAnalysis
💰 Current Price: 128.770 USDT (24h: -9.82% | 24h Vol: 107.30M USDT)
📈 24h Range: Low 124.910 — High 144.330 | 1H Structure (EMA7: 128.721 • RSI: 48)
🎯 Entry Zone: 128.255 - 128.770
✅ Take Profit 1 (TP1): 135.209
✅ Take Profit 2 (TP2): 140.359
🛑 Stop Loss (SL): 126.452
📝 Technical Thesis: On the 1H timeframe, $NVDAB is trading at 128.770 USDT (-9.82% 24h) backed by 107.30M USDT in 24h volume. Price structure is holding firmly above the 127.400 support zone (RSI 48), showing constructive buyer absorption ahead of the 131.000 resistance.
⚠️ Khuyến cáo: Thông tin và các mốc Entry / TP / SL trên chỉ mang tính chất tham khảo dựa trên dữ liệu thị trường và góc nhìn phân tích kỹ thuật cá nhân, hoàn toàn không phải lời khuyên đầu tư tài chính. Vui lòng tự nghiên cứu (DYOR) và quản lý rủi ro chặt chẽ trước khi giao dịch.
#NVDAB #BinanceSquare #CryptoAnalysis
3



·
--
Nasdaq is shut until Monday. Nvidia's price isn't.
$NVDAB, Binance's tokenized Nvidia share, is at $127.7, about 1.7% above where the stock closed Friday.
That close was $125.53, down 14% on the day and 23% on the week, per 24/7 Wall St. CNN has it as Nvidia's worst week since October 2008.
Friday's trigger: a Reuters report that SEC enforcement staff are examining potential accounting issues at the company. Per Decrypt (20:36 UTC Nov 20), the SEC declined to comment, and a probe isn't evidence of wrongdoing. It lands after Jensen Huang resigned as CEO the week before.
The AI angle: Nvidia is the AI trade's anchor, and AI coins took the same hit. $FET -12.48%, Worldcoin -12.77%, Render -9.99%, Bittensor -9.43% in 24h. Bitcoin -8.93%.
What changes for a holder: until Monday's open, any new probe headline gets priced in the token first, with no stock quote to lean on.
NVDAB's 24h range is $124.9 to $144.8 on $107M volume, down 20.99% on the week. The level I'm watching on $NVDAB is that $124.9 low, about 2.2% below and just under Friday's close. Fear & Greed sits at 12.
Would you hold a weekend token through an SEC probe headline, or wait for Monday's open?
#NVDAB #Nvidia #AIStocks #SEC
Nasdaq is shut until Monday. Nvidia's price isn't.
$NVDAB , Binance's tokenized Nvidia share, is at $127.7, about 1.7% above where the stock closed Friday.
That close was $125.53, down 14% on the day and 23% on the week, per 24/7 Wall St. CNN has it as Nvidia's worst week since October 2008.
Friday's trigger: a Reuters report that SEC enforcement staff are examining potential accounting issues at the company. Per Decrypt (20:36 UTC Nov 20), the SEC declined to comment, and a probe isn't evidence of wrongdoing. It lands after Jensen Huang resigned as CEO the week before.
The AI angle: Nvidia is the AI trade's anchor, and AI coins took the same hit. $FET -12.48%, Worldcoin -12.77%, Render -9.99%, Bittensor -9.43% in 24h. Bitcoin -8.93%.
What changes for a holder: until Monday's open, any new probe headline gets priced in the token first, with no stock quote to lean on.
NVDAB's 24h range is $124.9 to $144.8 on $107M volume, down 20.99% on the week. The level I'm watching on $NVDAB is that $124.9 low, about 2.2% below and just under Friday's close. Fear & Greed sits at 12.
Would you hold a weekend token through an SEC probe headline, or wait for Monday's open?
#NVDAB #Nvidia #AIStocks #SEC
$NVDAB , Binance's tokenized Nvidia share, is at $127.7, about 1.7% above where the stock closed Friday.
That close was $125.53, down 14% on the day and 23% on the week, per 24/7 Wall St. CNN has it as Nvidia's worst week since October 2008.
Friday's trigger: a Reuters report that SEC enforcement staff are examining potential accounting issues at the company. Per Decrypt (20:36 UTC Nov 20), the SEC declined to comment, and a probe isn't evidence of wrongdoing. It lands after Jensen Huang resigned as CEO the week before.
The AI angle: Nvidia is the AI trade's anchor, and AI coins took the same hit. $FET -12.48%, Worldcoin -12.77%, Render -9.99%, Bittensor -9.43% in 24h. Bitcoin -8.93%.
What changes for a holder: until Monday's open, any new probe headline gets priced in the token first, with no stock quote to lean on.
NVDAB's 24h range is $124.9 to $144.8 on $107M volume, down 20.99% on the week. The level I'm watching on $NVDAB is that $124.9 low, about 2.2% below and just under Friday's close. Fear & Greed sits at 12.
Would you hold a weekend token through an SEC probe headline, or wait for Monday's open?
#NVDAB #Nvidia #AIStocks #SEC
349

·
--
$ETH -8.32% | $NVDAB -11.79% | $PROM -16.97%
Ethereum sits at $1,599.74, slipping 8.32% despite a solid $1.10 B of daily volume. The platform’s broad dApp ecosystem keeps it in focus even as the price pulls back.
#NVDAB trades around $128.30, down 11.79% on $113.7 M of volume. The sharper decline hints at lingering pressure in its sector.
#PROM is at $4.62, down 16.97% with $12.0 M moving through the market. Such a steep slide on modest volume suggests limited buying interest.
👀 Keep an eye on #ETH’s high turnover; if volume stays strong, the dip could be a short‑term correction rather than a deeper trend.
#Write2Earn #Binance
$ETH -8.32% | $NVDAB -11.79% | $PROM -16.97%
Ethereum sits at $1,599.74, slipping 8.32% despite a solid $1.10 B of daily volume. The platform’s broad dApp ecosystem keeps it in focus even as the price pulls back.
#NVDAB trades around $128.30, down 11.79% on $113.7 M of volume. The sharper decline hints at lingering pressure in its sector.
#PROM is at $4.62, down 16.97% with $12.0 M moving through the market. Such a steep slide on modest volume suggests limited buying interest.
👀 Keep an eye on #ETH’s high turnover; if volume stays strong, the dip could be a short‑term correction rather than a deeper trend.
#Write2Earn #Binance
Ethereum sits at $1,599.74, slipping 8.32% despite a solid $1.10 B of daily volume. The platform’s broad dApp ecosystem keeps it in focus even as the price pulls back.
#NVDAB trades around $128.30, down 11.79% on $113.7 M of volume. The sharper decline hints at lingering pressure in its sector.
#PROM is at $4.62, down 16.97% with $12.0 M moving through the market. Such a steep slide on modest volume suggests limited buying interest.
👀 Keep an eye on #ETH’s high turnover; if volume stays strong, the dip could be a short‑term correction rather than a deeper trend.
#Write2Earn #Binance
2
·
--
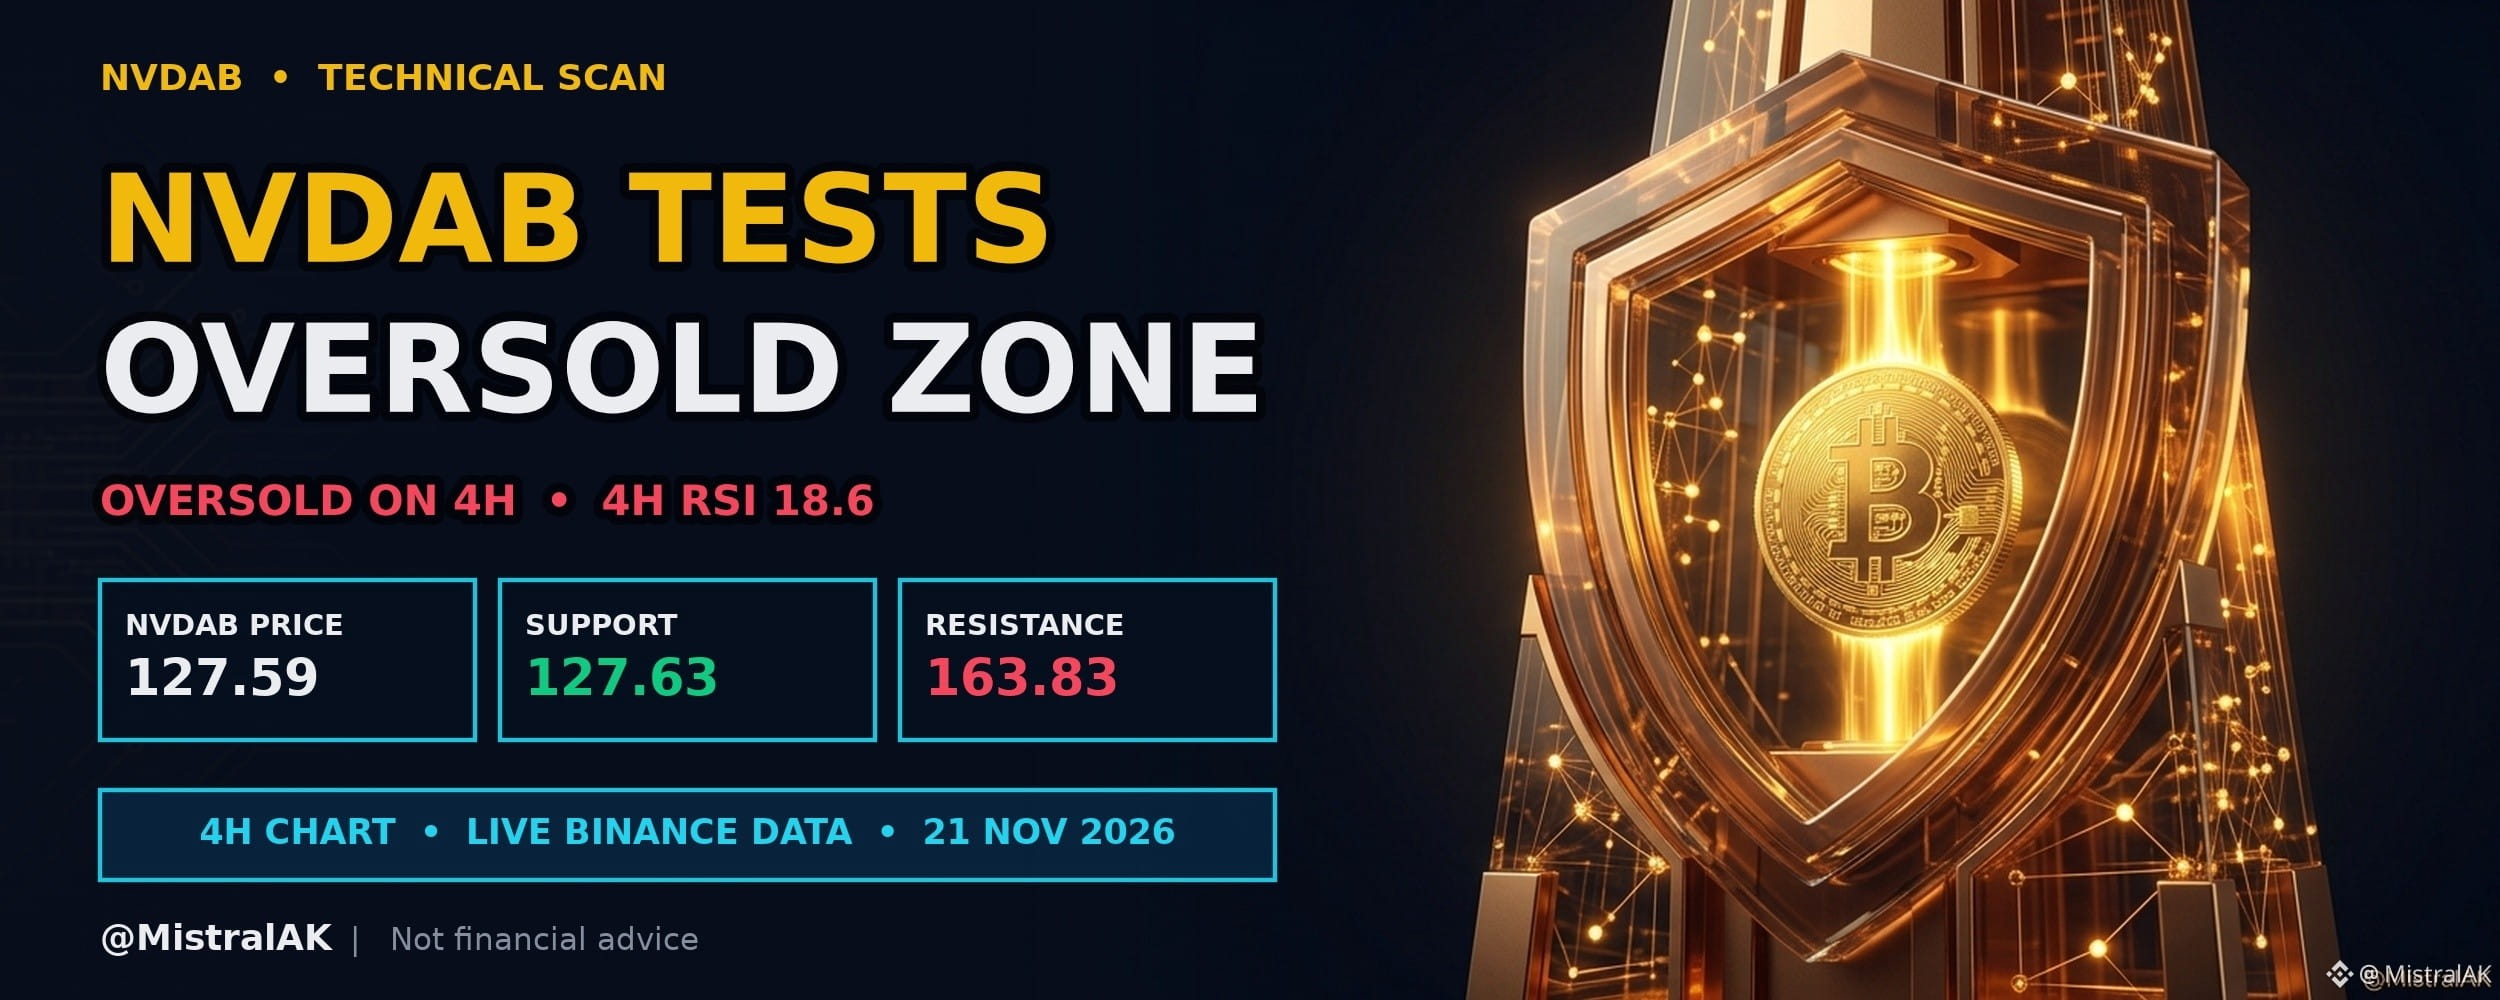
$NVDAB Four Hour Chart Enters Oversold Zone
$NVDAB trades at 127.59 USD, down 13.3% over the past 24 hours, with 4H RSI at 18.6 (oversold).
Selling pressure over the past twenty-four hours has pushed momentum into oversold territory on the four-hour chart. Market participants typically observe whether price stabilizes near these momentum extremes or continues its downward trajectory.
TECHNICAL READ
▪️ Momentum: 4H RSI 18.6 sits in the oversold zone
▪️ Trend filter: EMA 20 is below EMA 50, and price is below EMA 20
▪️ Range: price is 28.4% below the range high and 0.0% below the range low
WHAT WOULD CONFIRM A BOUNCE
▪️ RSI recovering above 30 with a 4H close above EMA 20 (146.37 USD)
▪️ Price defending 127.63 USD on retests
WHAT WOULD INVALIDATE IT
▪️ A 4H close below 127.63 USD
▪️ RSI staying pinned in oversold territory while price makes lower lows
Do you expect a technical bounce from oversold territory, or will downward pressure persist?
Not financial advice. Always DYOR.
Like & Follow for Daily Trade Analytics & Insider News. @MistralAK
#NVDAB #Oversold #HotTrends
{spot}(NVDABUSDT)
$NVDAB Four Hour Chart Enters Oversold Zone
$NVDAB trades at 127.59 USD, down 13.3% over the past 24 hours, with 4H RSI at 18.6 (oversold).
Selling pressure over the past twenty-four hours has pushed momentum into oversold territory on the four-hour chart. Market participants typically observe whether price stabilizes near these momentum extremes or continues its downward trajectory.
TECHNICAL READ
▪️ Momentum: 4H RSI 18.6 sits in the oversold zone
▪️ Trend filter: EMA 20 is below EMA 50, and price is below EMA 20
▪️ Range: price is 28.4% below the range high and 0.0% below the range low
WHAT WOULD CONFIRM A BOUNCE
▪️ RSI recovering above 30 with a 4H close above EMA 20 (146.37 USD)
▪️ Price defending 127.63 USD on retests
WHAT WOULD INVALIDATE IT
▪️ A 4H close below 127.63 USD
▪️ RSI staying pinned in oversold territory while price makes lower lows
Do you expect a technical bounce from oversold territory, or will downward pressure persist?
Not financial advice. Always DYOR.
Like & Follow for Daily Trade Analytics & Insider News. @MistralAK
#NVDAB #Oversold #HotTrends
$NVDAB trades at 127.59 USD, down 13.3% over the past 24 hours, with 4H RSI at 18.6 (oversold).
Selling pressure over the past twenty-four hours has pushed momentum into oversold territory on the four-hour chart. Market participants typically observe whether price stabilizes near these momentum extremes or continues its downward trajectory.
TECHNICAL READ
▪️ Momentum: 4H RSI 18.6 sits in the oversold zone
▪️ Trend filter: EMA 20 is below EMA 50, and price is below EMA 20
▪️ Range: price is 28.4% below the range high and 0.0% below the range low
WHAT WOULD CONFIRM A BOUNCE
▪️ RSI recovering above 30 with a 4H close above EMA 20 (146.37 USD)
▪️ Price defending 127.63 USD on retests
WHAT WOULD INVALIDATE IT
▪️ A 4H close below 127.63 USD
▪️ RSI staying pinned in oversold territory while price makes lower lows
Do you expect a technical bounce from oversold territory, or will downward pressure persist?
Not financial advice. Always DYOR.
Like & Follow for Daily Trade Analytics & Insider News. @MistralAK
#NVDAB #Oversold #HotTrends
14

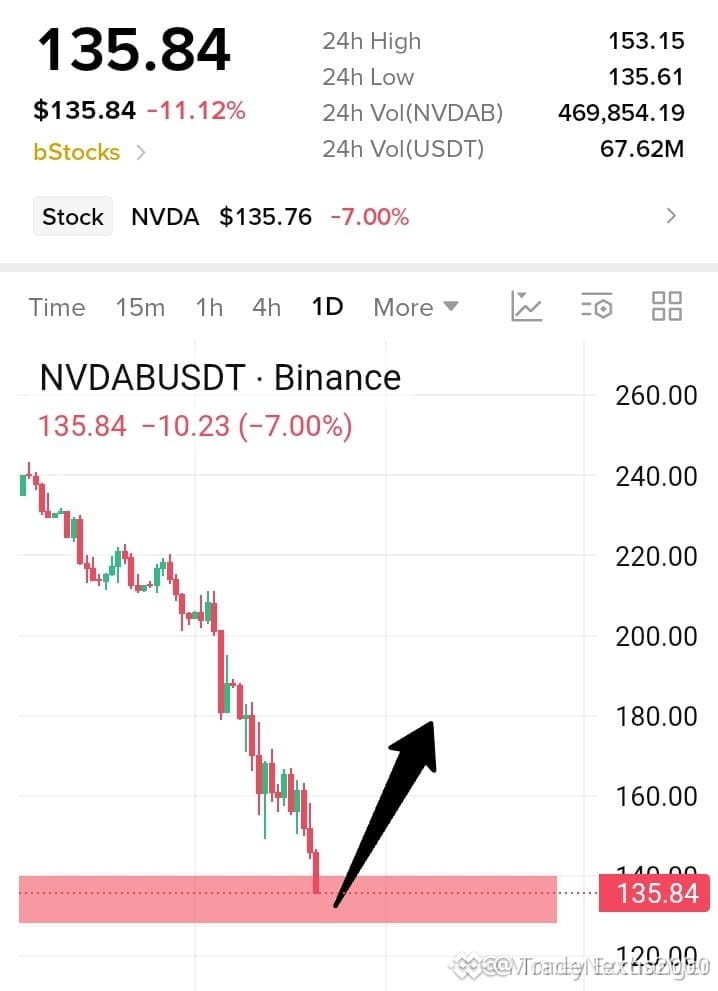
🦈 $NVDAB IGNITING A MASSIVE MOMENTUM EXPANSION ACROSS INSTITUTIONAL ORDER BLOCKS! 💥
Entry: 135$ ⚡
Target: 148$ 🚀
Smart money is aggressively absorbing supply at current valuations while retail hesitates on the sidelines. 🌊 Price action is carving out a clean accumulation phase right above local structural support, leaving major inefficiencies overhead waiting to be filled. 📊
Momentum indicators suggest buyers are stepping in with high conviction to clear out liquidity clusters near the upper range. 💡 Are you positioning alongside institutional order flow before the next leg expands, or waiting for a deeper retest? 👇
⚠️ Not financial advice. Always manage your risk. 🛡️
🏷️ #NVDAB #SmartMoney #Momentum #Breakout
🔥 💎
🦈 $NVDAB IGNITING A MASSIVE MOMENTUM EXPANSION ACROSS INSTITUTIONAL ORDER BLOCKS! 💥
Entry: 135$ ⚡
Target: 148$ 🚀
Smart money is aggressively absorbing supply at current valuations while retail hesitates on the sidelines. 🌊 Price action is carving out a clean accumulation phase right above local structural support, leaving major inefficiencies overhead waiting to be filled. 📊
Momentum indicators suggest buyers are stepping in with high conviction to clear out liquidity clusters near the upper range. 💡 Are you positioning alongside institutional order flow before the next leg expands, or waiting for a deeper retest? 👇
⚠️ Not financial advice. Always manage your risk. 🛡️
🏷️ #NVDAB #SmartMoney #Momentum #Breakout
🔥 💎
Entry: 135$ ⚡
Target: 148$ 🚀
Smart money is aggressively absorbing supply at current valuations while retail hesitates on the sidelines. 🌊 Price action is carving out a clean accumulation phase right above local structural support, leaving major inefficiencies overhead waiting to be filled. 📊
Momentum indicators suggest buyers are stepping in with high conviction to clear out liquidity clusters near the upper range. 💡 Are you positioning alongside institutional order flow before the next leg expands, or waiting for a deeper retest? 👇
⚠️ Not financial advice. Always manage your risk. 🛡️
🏷️ #NVDAB #SmartMoney #Momentum #Breakout
🔥 💎
7

·
--
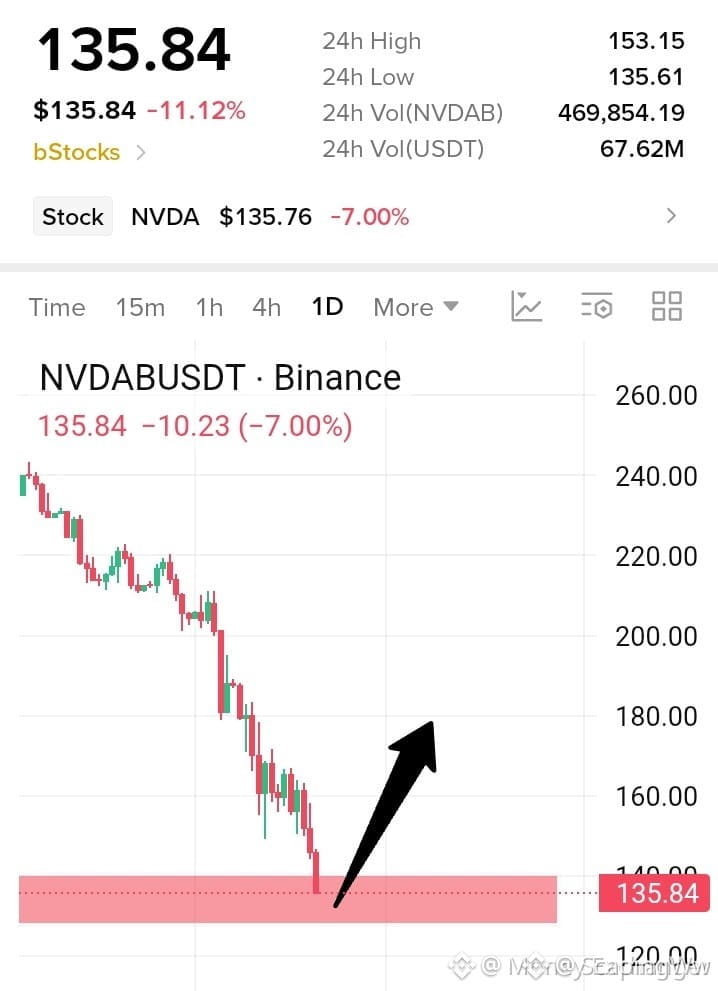
🔥 $NVDAB MOMENTUM IS TEARING THROUGH RESISTANCE WITH ZERO INTENTION OF SLOWING DOWN! 🚀
Entry: 135$ ⚡
Target: 175$ 🚀
Order flow is aggressively leaning into continuation as relentless buyers refuse to wait for a deep retracement. When structural conviction overrides standard patience, momentum feeds on itself across every single order book layer. 📊
The tape is printing constant aggressive bids at 135$ as market participants rush to secure exposure before the next leg higher unfolds. ⚡
💬 Are you riding this momentum wave right now or waiting for a minor liquidity sweep? 👇
⚠️ Not financial advice. Always manage your risk. 🛡️
🏷️ #NVDAB #Momentum #Breakout #Crypto #LongSetup
🔥 💎
🔥 $NVDAB MOMENTUM IS TEARING THROUGH RESISTANCE WITH ZERO INTENTION OF SLOWING DOWN! 🚀
Entry: 135$ ⚡
Target: 175$ 🚀
Order flow is aggressively leaning into continuation as relentless buyers refuse to wait for a deep retracement. When structural conviction overrides standard patience, momentum feeds on itself across every single order book layer. 📊
The tape is printing constant aggressive bids at 135$ as market participants rush to secure exposure before the next leg higher unfolds. ⚡
💬 Are you riding this momentum wave right now or waiting for a minor liquidity sweep? 👇
⚠️ Not financial advice. Always manage your risk. 🛡️
🏷️ #NVDAB #Momentum #Breakout #Crypto #LongSetup
🔥 💎
Entry: 135$ ⚡
Target: 175$ 🚀
Order flow is aggressively leaning into continuation as relentless buyers refuse to wait for a deep retracement. When structural conviction overrides standard patience, momentum feeds on itself across every single order book layer. 📊
The tape is printing constant aggressive bids at 135$ as market participants rush to secure exposure before the next leg higher unfolds. ⚡
💬 Are you riding this momentum wave right now or waiting for a minor liquidity sweep? 👇
⚠️ Not financial advice. Always manage your risk. 🛡️
🏷️ #NVDAB #Momentum #Breakout #Crypto #LongSetup
🔥 💎
15
·
--
Red candles do not always mean traders are walking away.
Trader checklist for $NVDAB:
- Liquidity: $66.11M quote volume reflects active participation despite a -10.56% dip.
- Current zone: At $136.74, hovering just below the 139.92 prior range low.
- Bullish trigger: A clean reclaim of 139.92 suggests buyer absorption.
- Downside risk: Rejection below $136.74 invalidates stabilization hopes.
Can buyers step in to reclaim 139.92, or does rejection under $136.74 confirm another drop?
Tap $NVDAB for the live chart. #NVDAB #BinanceSquare
Red candles do not always mean traders are walking away.
Trader checklist for $NVDAB :
- Liquidity: $66.11M quote volume reflects active participation despite a -10.56% dip.
- Current zone: At $136.74, hovering just below the 139.92 prior range low.
- Bullish trigger: A clean reclaim of 139.92 suggests buyer absorption.
- Downside risk: Rejection below $136.74 invalidates stabilization hopes.
Can buyers step in to reclaim 139.92, or does rejection under $136.74 confirm another drop?
Tap $NVDAB for the live chart. #NVDAB #BinanceSquare
Trader checklist for $NVDAB :
- Liquidity: $66.11M quote volume reflects active participation despite a -10.56% dip.
- Current zone: At $136.74, hovering just below the 139.92 prior range low.
- Bullish trigger: A clean reclaim of 139.92 suggests buyer absorption.
- Downside risk: Rejection below $136.74 invalidates stabilization hopes.
Can buyers step in to reclaim 139.92, or does rejection under $136.74 confirm another drop?
Tap $NVDAB for the live chart. #NVDAB #BinanceSquare
6

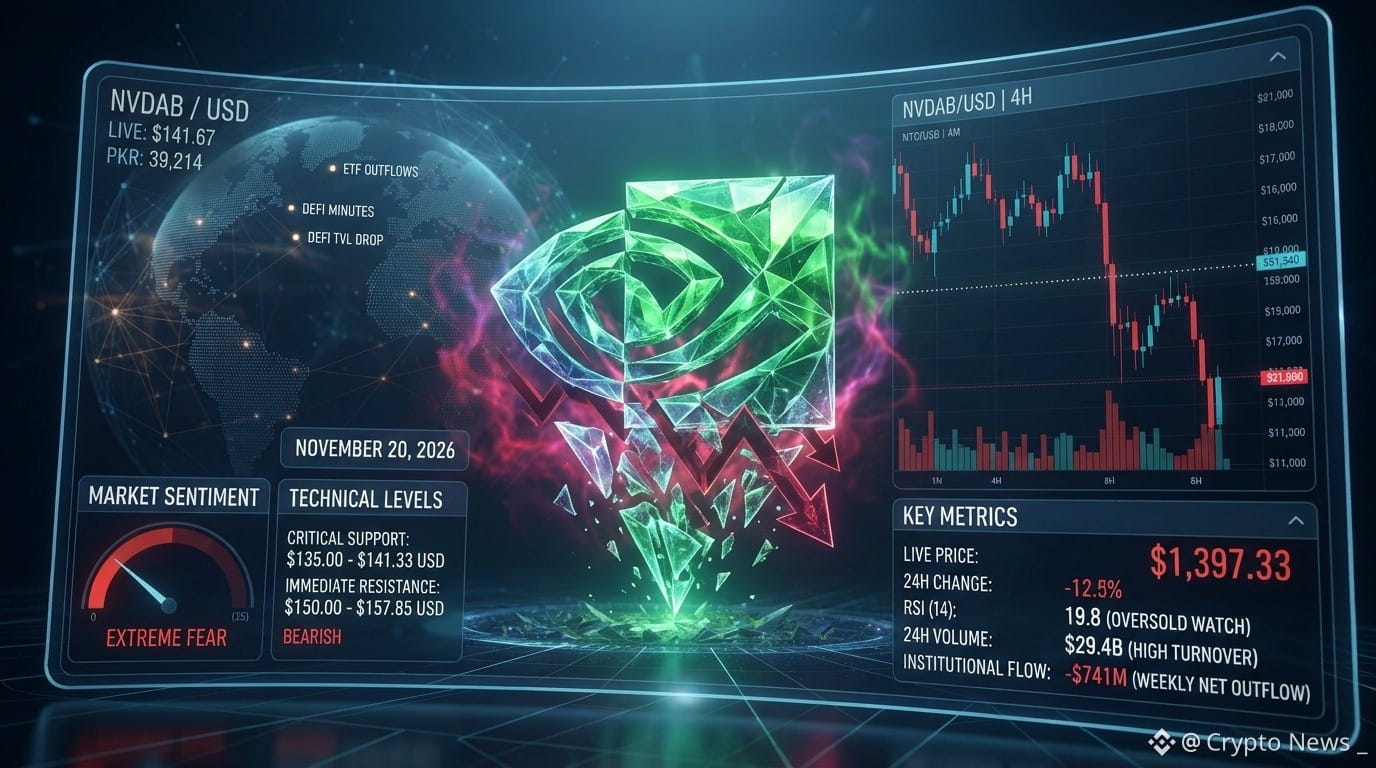
NVIDIA Tokenized bStocks ($NVDAB ) is trading near $141.67 USD (approximately Rs. 39,214 PKR at current spot FX, though certain P2P/local trackers quote higher premiums), down roughly 7.5% over the past 24 hours and 41.6% below its October 6 all-time high of $242.62. Despite NVIDIA delivering a massive Q3 revenue beat ($115.84 billion vs. $109.10 billion consensus), $NVDAB$ has decisively broken below its $150.00 structural floor as underlying equity weakness drags the token lower.
Key Technical Levels & Market Metrics
Support Zones: Immediate intraday support rests right at the 24-hour low of $141.33, followed by a broader secondary demand zone around $135.00. With underlying $NVDA$ shares breaching their 52-week low of $148.80, downside momentum remains elevated.
Resistance Barriers: The breached $150.00 psychological level and the 24-hour high at $157.85 now form a heavy overhead supply ceiling. Reclaiming $157.85 on strong volume is required to neutralize the post-earnings breakdown.
Sentiment & Catalyst Context: Market sentiment is heavily bearish despite blockbuster AI data center demand ($107.6 billion, up 110% YoY). Investors are pricing in corporate governance uncertainty following CEO Jensen Huang's November 12 resignation—which the board confirmed will not be reversed—alongside tightened U.S. Commerce Department AI chip export rules. High 24-hour turnover (~$119.4M) and leverage on futures/margin venues continue to amplify volatility.
$NVDAB
#NVDAB #CanGTA6'sLaunchLiftTTWOShares? #NvidiaBoardReportedlySplitOverHuang’sReturn #TradFiForBeginners #BTCBelow$62KAmidHikeFearsAndShiftToAnthropic
{spot}(NVDABUSDT)
NVIDIA Tokenized bStocks ($NVDAB ) is trading near $141.67 USD (approximately Rs. 39,214 PKR at current spot FX, though certain P2P/local trackers quote higher premiums), down roughly 7.5% over the past 24 hours and 41.6% below its October 6 all-time high of $242.62. Despite NVIDIA delivering a massive Q3 revenue beat ($115.84 billion vs. $109.10 billion consensus), $NVDAB $ has decisively broken below its $150.00 structural floor as underlying equity weakness drags the token lower.
Key Technical Levels & Market Metrics
Support Zones: Immediate intraday support rests right at the 24-hour low of $141.33, followed by a broader secondary demand zone around $135.00. With underlying $NVDA$ shares breaching their 52-week low of $148.80, downside momentum remains elevated.
Resistance Barriers: The breached $150.00 psychological level and the 24-hour high at $157.85 now form a heavy overhead supply ceiling. Reclaiming $157.85 on strong volume is required to neutralize the post-earnings breakdown.
Sentiment & Catalyst Context: Market sentiment is heavily bearish despite blockbuster AI data center demand ($107.6 billion, up 110% YoY). Investors are pricing in corporate governance uncertainty following CEO Jensen Huang's November 12 resignation—which the board confirmed will not be reversed—alongside tightened U.S. Commerce Department AI chip export rules. High 24-hour turnover (~$119.4M) and leverage on futures/margin venues continue to amplify volatility.
$NVDAB
#NVDAB #CanGTA6'sLaunchLiftTTWOShares? #NvidiaBoardReportedlySplitOverHuang’sReturn #TradFiForBeginners #BTCBelow$62KAmidHikeFearsAndShiftToAnthropic
Key Technical Levels & Market Metrics
Support Zones: Immediate intraday support rests right at the 24-hour low of $141.33, followed by a broader secondary demand zone around $135.00. With underlying $NVDA$ shares breaching their 52-week low of $148.80, downside momentum remains elevated.
Resistance Barriers: The breached $150.00 psychological level and the 24-hour high at $157.85 now form a heavy overhead supply ceiling. Reclaiming $157.85 on strong volume is required to neutralize the post-earnings breakdown.
Sentiment & Catalyst Context: Market sentiment is heavily bearish despite blockbuster AI data center demand ($107.6 billion, up 110% YoY). Investors are pricing in corporate governance uncertainty following CEO Jensen Huang's November 12 resignation—which the board confirmed will not be reversed—alongside tightened U.S. Commerce Department AI chip export rules. High 24-hour turnover (~$119.4M) and leverage on futures/margin venues continue to amplify volatility.
$NVDAB
#NVDAB #CanGTA6'sLaunchLiftTTWOShares? #NvidiaBoardReportedlySplitOverHuang’sReturn #TradFiForBeginners #BTCBelow$62KAmidHikeFearsAndShiftToAnthropic
328
·
--
Is $NVDAB stabilizing or preparing for another leg down?
1. Price action: Sitting at $143.63 after a -5.92% 24-hour pullback.
2. Bullish trigger: A steady bounce keeps a scenario toward the 158.21 range high viable.
3. Invalidation signal: A sustained drop below the 143.06 range low breaks the stabilization thesis.
Will buyers confirm stabilization toward 158.21, or does a drop below 143.06 trigger invalidation?
Tap $NVDAB for the live chart. #NVDAB #BinanceSquare
Is $NVDAB stabilizing or preparing for another leg down?
1. Price action: Sitting at $143.63 after a -5.92% 24-hour pullback.
2. Bullish trigger: A steady bounce keeps a scenario toward the 158.21 range high viable.
3. Invalidation signal: A sustained drop below the 143.06 range low breaks the stabilization thesis.
Will buyers confirm stabilization toward 158.21, or does a drop below 143.06 trigger invalidation?
Tap $NVDAB for the live chart. #NVDAB #BinanceSquare
1. Price action: Sitting at $143.63 after a -5.92% 24-hour pullback.
2. Bullish trigger: A steady bounce keeps a scenario toward the 158.21 range high viable.
3. Invalidation signal: A sustained drop below the 143.06 range low breaks the stabilization thesis.
Will buyers confirm stabilization toward 158.21, or does a drop below 143.06 trigger invalidation?
Tap $NVDAB for the live chart. #NVDAB #BinanceSquare
2

·
--
$NVDAB -5.50% | $BNB -1.65% | $SOXLB -17.64%
#NVDAB slipped to $143.59, down -5.50% on $72.5 M of volume, suggesting sellers are stepping in as liquidity stays solid.
#BNB sits at $572.50, off -1.65% with $63.8 M traded; the modest pullback comes despite its role as the BNB Chain’s utility backbone.
#SOXLB fell sharply to $42.50, down -17.64% on $61.1 M of volume, indicating a strong bearish push that may test support levels.
⚡️ Watch the relative volume drop for SOXLB versus the milder declines in NVDAB and BNB – a widening gap could signal shifting market focus.
#Write2Earn #Binance
$NVDAB -5.50% | $BNB -1.65% | $SOXLB -17.64%
#NVDAB slipped to $143.59, down -5.50% on $72.5 M of volume, suggesting sellers are stepping in as liquidity stays solid.
#BNB sits at $572.50, off -1.65% with $63.8 M traded; the modest pullback comes despite its role as the BNB Chain’s utility backbone.
#SOXLB fell sharply to $42.50, down -17.64% on $61.1 M of volume, indicating a strong bearish push that may test support levels.
⚡️ Watch the relative volume drop for SOXLB versus the milder declines in NVDAB and BNB – a widening gap could signal shifting market focus.
#Write2Earn #Binance
#NVDAB slipped to $143.59, down -5.50% on $72.5 M of volume, suggesting sellers are stepping in as liquidity stays solid.
#BNB sits at $572.50, off -1.65% with $63.8 M traded; the modest pullback comes despite its role as the BNB Chain’s utility backbone.
#SOXLB fell sharply to $42.50, down -17.64% on $61.1 M of volume, indicating a strong bearish push that may test support levels.
⚡️ Watch the relative volume drop for SOXLB versus the milder declines in NVDAB and BNB – a widening gap could signal shifting market focus.
#Write2Earn #Binance
·
--
Is $NVDAB facing seller exhaustion or a crowded breakdown?
1. Momentum cooled with a -3.98% decline to $145.1 on $73.21M volume.
2. Bullish scenario: Reclaiming momentum requires pushing back toward the 158.21 range high.
3. Invalidation risk: Slipping beneath the 144.22 range low invalidates consolidation and signals downside.
Will buyers confirm strength by reclaiming 158.21, or does a drop below 144.22 trigger invalidation?
Tap $NVDAB for the live chart. #NVDAB #BinanceSquare
Is $NVDAB facing seller exhaustion or a crowded breakdown?
1. Momentum cooled with a -3.98% decline to $145.1 on $73.21M volume.
2. Bullish scenario: Reclaiming momentum requires pushing back toward the 158.21 range high.
3. Invalidation risk: Slipping beneath the 144.22 range low invalidates consolidation and signals downside.
Will buyers confirm strength by reclaiming 158.21, or does a drop below 144.22 trigger invalidation?
Tap $NVDAB for the live chart. #NVDAB #BinanceSquare
1. Momentum cooled with a -3.98% decline to $145.1 on $73.21M volume.
2. Bullish scenario: Reclaiming momentum requires pushing back toward the 158.21 range high.
3. Invalidation risk: Slipping beneath the 144.22 range low invalidates consolidation and signals downside.
Will buyers confirm strength by reclaiming 158.21, or does a drop below 144.22 trigger invalidation?
Tap $NVDAB for the live chart. #NVDAB #BinanceSquare
38
·
--
$NVDAB -4.29% | $BNB -0.38% | $SOXLB -14.28%
#NVDAB slipped to $145.17, down -4.29% on $73.4 M of trades.
#BNB held near $580.07, edging down -0.38% with $62.1 M moving through its order books.
#SOXLB fell sharply to $43.76, down -14.28% while $61.0 M volume kept the market active.
📊 The spread in volume between NVDAB and the others is narrowing, which could tighten short‑term price swings.
#Write2Earn #Binance
$NVDAB -4.29% | $BNB -0.38% | $SOXLB -14.28%
#NVDAB slipped to $145.17, down -4.29% on $73.4 M of trades.
#BNB held near $580.07, edging down -0.38% with $62.1 M moving through its order books.
#SOXLB fell sharply to $43.76, down -14.28% while $61.0 M volume kept the market active.
📊 The spread in volume between NVDAB and the others is narrowing, which could tighten short‑term price swings.
#Write2Earn #Binance
#NVDAB slipped to $145.17, down -4.29% on $73.4 M of trades.
#BNB held near $580.07, edging down -0.38% with $62.1 M moving through its order books.
#SOXLB fell sharply to $43.76, down -14.28% while $61.0 M volume kept the market active.
📊 The spread in volume between NVDAB and the others is narrowing, which could tighten short‑term price swings.
#Write2Earn #Binance
42
Log in to explore more content
Join global crypto users on Binance Square
⚡️ Get latest and useful information about crypto.
💬 Trusted by the world’s largest crypto exchange.
👍 Discover real insights from verified creators.
Email / Phone number
Trending Topics
1
#BTCReboundsAbove$60KAmidWhaleDipBuying
34,591 views
203 Discussing
2
#SolanaSets2027RoadmapToDoubleComputeCapacity
20,513 views
503 Discussing
3
#CaliforniaNvidiaProbeExaminesPotentialCriminalViolations
5,521 views
69 Discussing
4
#BlackRockLaunchesHKDollarDigitalLiquidityFund
16,680 views
422 Discussing
5
#NvidiaLoses$2.7TrillionInMonthAndAHalf
60,515 views
268 Discussing
6
#GlobalStocksFaceLongestLosingStreakSince2023
491,274 views
3,154 Discussing
7
#BlackRockIBITPostsRecord$541MSingleDayOutflow
79,690 views
160 Discussing
8
#AnthropicPlungesTowardIPOPriceonDay2
266,272 views
2,092 Discussing
9
#TwentyOneCapitalAdds172.25BTC
136,700 views
1,430 Discussing
10
#HKBillWouldExcludeTokenizedDepositsFromVirtualAssets
16,455 views
95 Discussing