
#app
app
86,702 views
606 Discussing
Hot
Latest

·
--
$MEGA $APP $VELVET 30-minute bullish alignment confluence🔥
════════════════════
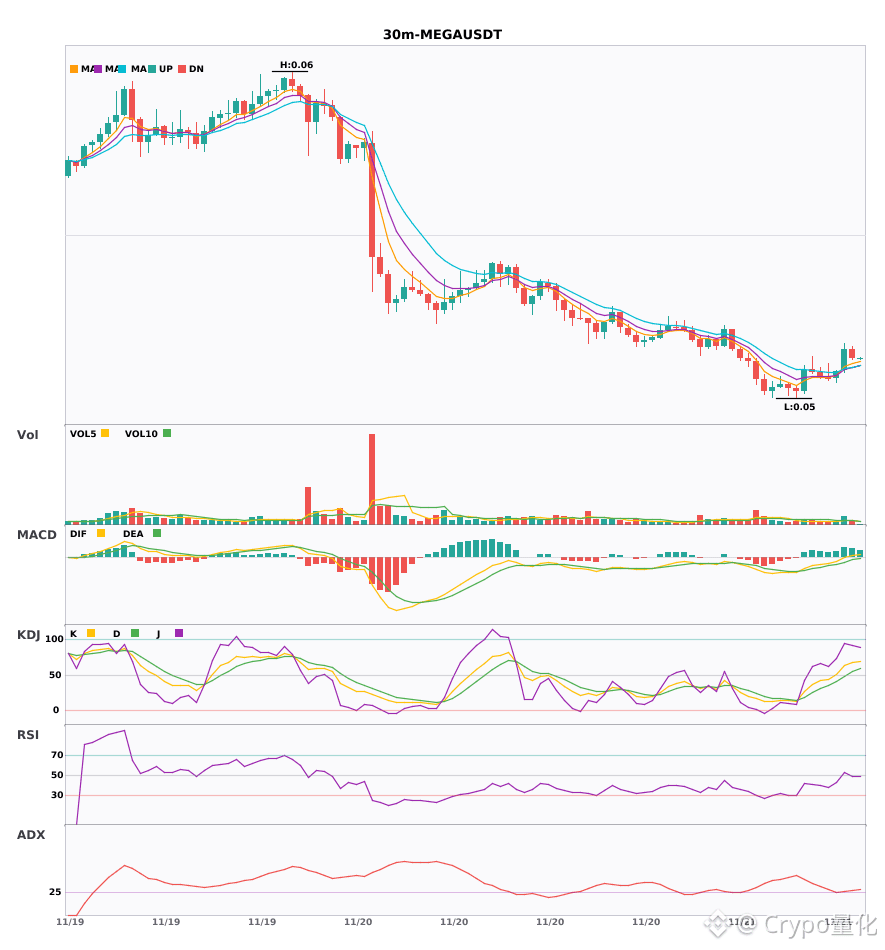
🔴 $MEGA 30-minute bullish signal
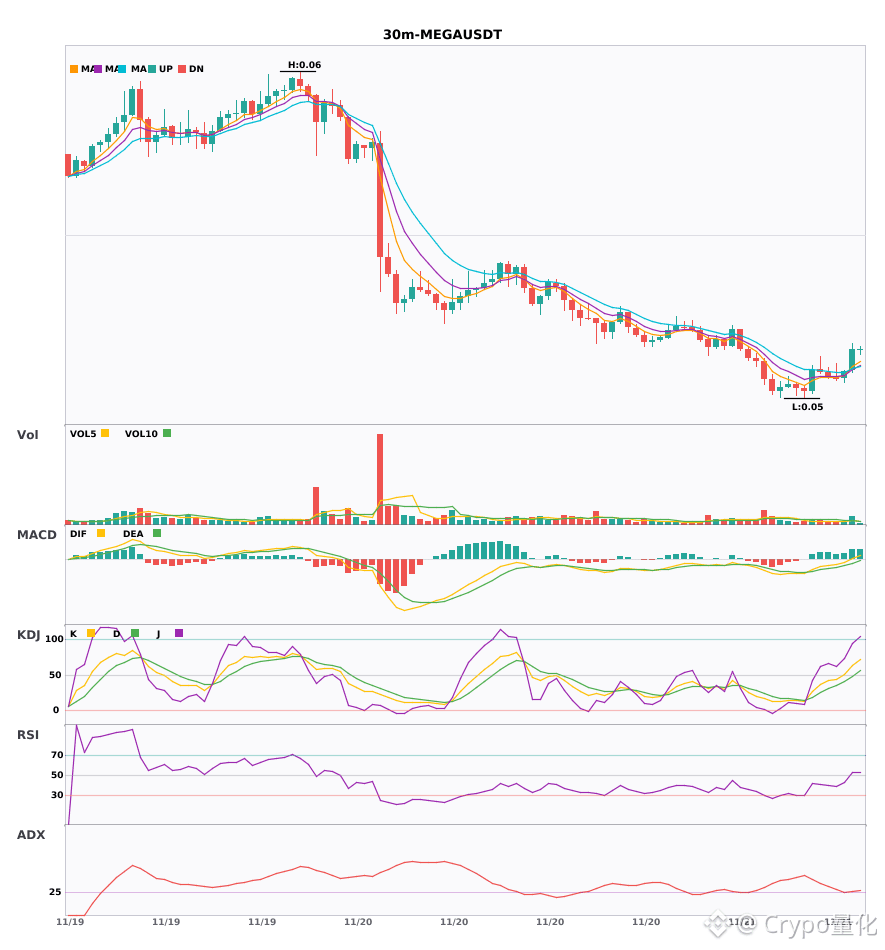
⚠️Technical analysis: The ADX trend has just formed and can be followed. After the MACD golden cross, the red bars are shrinking and momentum is weakening. The moving averages are in a bullish alignment and spreading out. K has crossed above D but is not yet overbought. Volume has increased 2x.
════════════════════
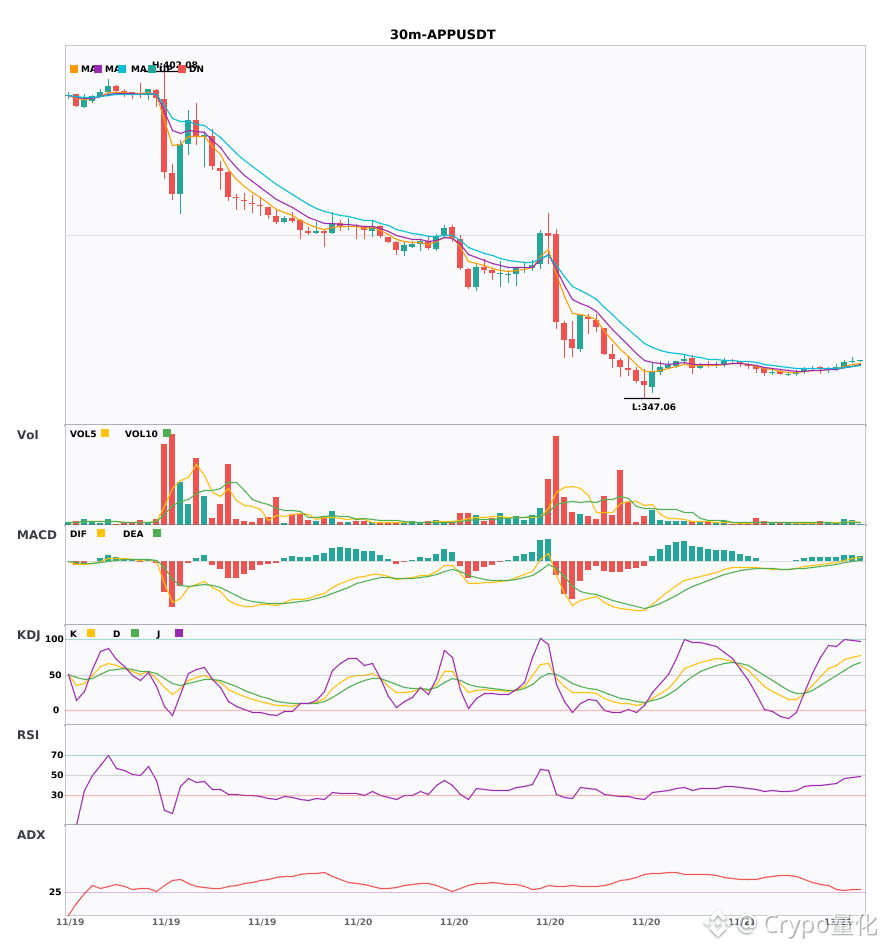
🔴 $APP 30-minute bullish signal
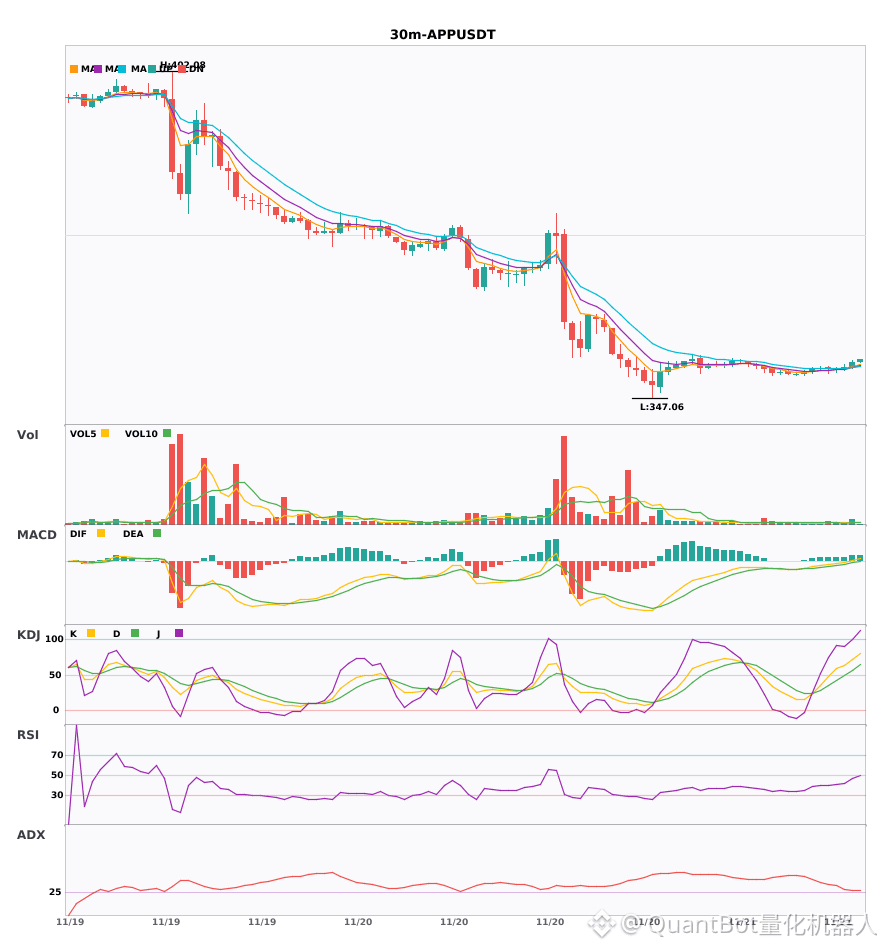
⚠️Technical analysis: The ADX trend has just formed; an entry is possible | MACD DIF has crossed above the zero line, turning bullish | Moving averages are in a bullish alignment and spreading upward | In KDJ, K has crossed above D and is not overbought | Trading volume has increased 2.7x
════════════════════
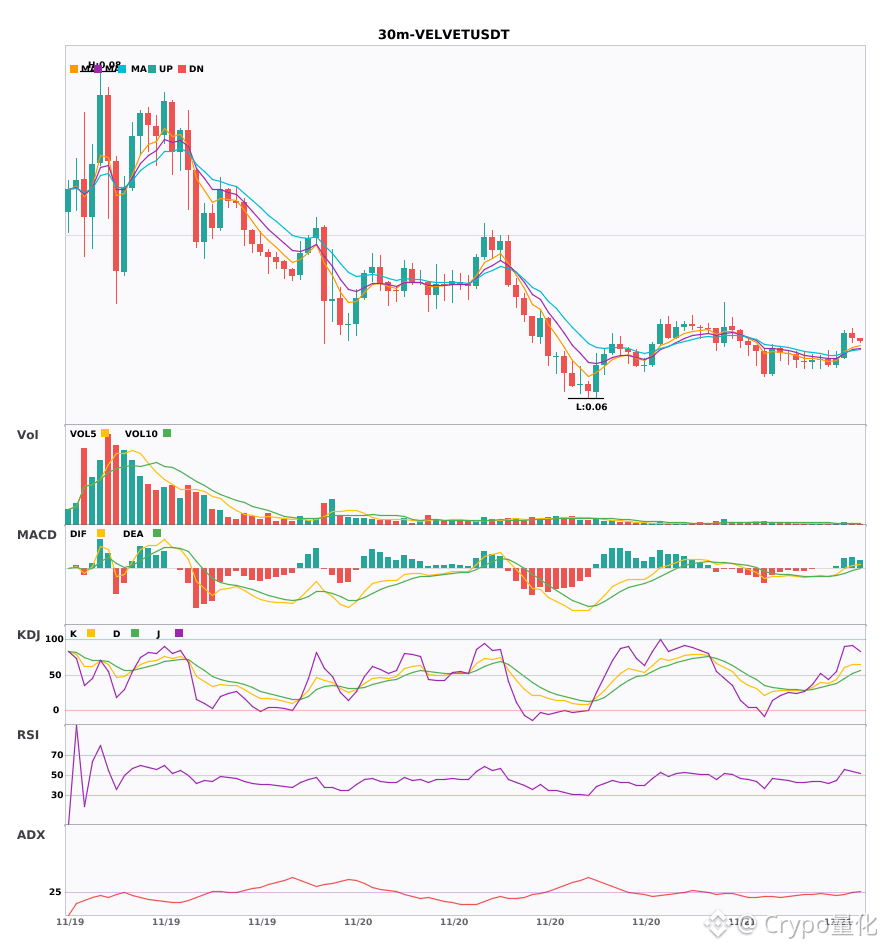
🔴 $VELVET 30-minute bullish signal
⚠️Technical analysis: The ADX trend has just started and offers an opportunity to participate. After the MACD golden cross, the red bars are expanding. The moving averages are in a bullish alignment and trending upward. K has crossed above D but is not overbought. Volume has increased 1.6x.
════════════════════
🔔 Follow to get first-hand market movement alerts 🔔
#技术分析 #MEGA #APP #VELVET
📌 When trading, pay attention to whether the candlestick pattern meets the criteria
$MEGA $APP $VELVET 30-minute bullish alignment confluence🔥
════════════════════
🔴 $MEGA 30-minute bullish signal
⚠️Technical analysis: The ADX trend has just formed and can be followed. After the MACD golden cross, the red bars are shrinking and momentum is weakening. The moving averages are in a bullish alignment and spreading out. K has crossed above D but is not yet overbought. Volume has increased 2x.
════════════════════
🔴 $APP 30-minute bullish signal
⚠️Technical analysis: The ADX trend has just formed; an entry is possible | MACD DIF has crossed above the zero line, turning bullish | Moving averages are in a bullish alignment and spreading upward | In KDJ, K has crossed above D and is not overbought | Trading volume has increased 2.7x
════════════════════
🔴 $VELVET 30-minute bullish signal
⚠️Technical analysis: The ADX trend has just started and offers an opportunity to participate. After the MACD golden cross, the red bars are expanding. The moving averages are in a bullish alignment and trending upward. K has crossed above D but is not overbought. Volume has increased 1.6x.
════════════════════
🔔 Follow to get first-hand market movement alerts 🔔
#技术分析 #MEGA #APP #VELVET
📌 When trading, pay attention to whether the candlestick pattern meets the criteria
════════════════════
🔴 $MEGA 30-minute bullish signal
⚠️Technical analysis: The ADX trend has just formed and can be followed. After the MACD golden cross, the red bars are shrinking and momentum is weakening. The moving averages are in a bullish alignment and spreading out. K has crossed above D but is not yet overbought. Volume has increased 2x.
════════════════════
🔴 $APP 30-minute bullish signal
⚠️Technical analysis: The ADX trend has just formed; an entry is possible | MACD DIF has crossed above the zero line, turning bullish | Moving averages are in a bullish alignment and spreading upward | In KDJ, K has crossed above D and is not overbought | Trading volume has increased 2.7x
════════════════════
🔴 $VELVET 30-minute bullish signal
⚠️Technical analysis: The ADX trend has just started and offers an opportunity to participate. After the MACD golden cross, the red bars are expanding. The moving averages are in a bullish alignment and trending upward. K has crossed above D but is not overbought. Volume has increased 1.6x.
════════════════════
🔔 Follow to get first-hand market movement alerts 🔔
#技术分析 #MEGA #APP #VELVET
📌 When trading, pay attention to whether the candlestick pattern meets the criteria
5

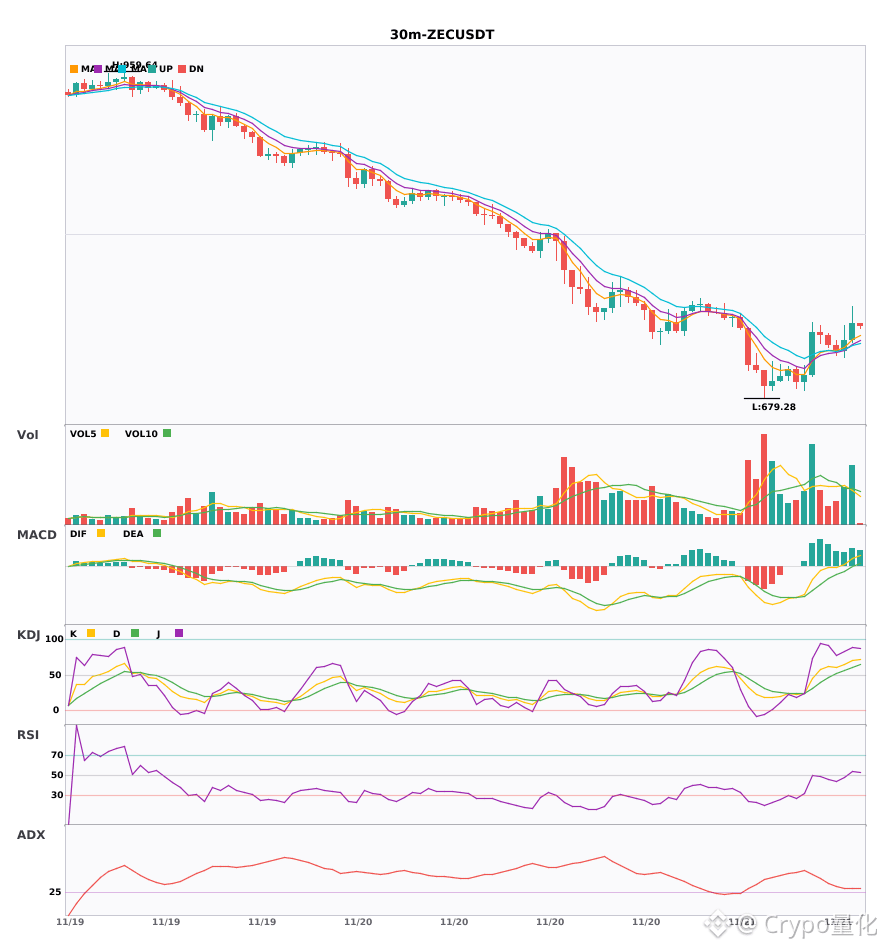
$MEGA $APP $ZEC 30-minute technical indicators showing convergent upward momentum
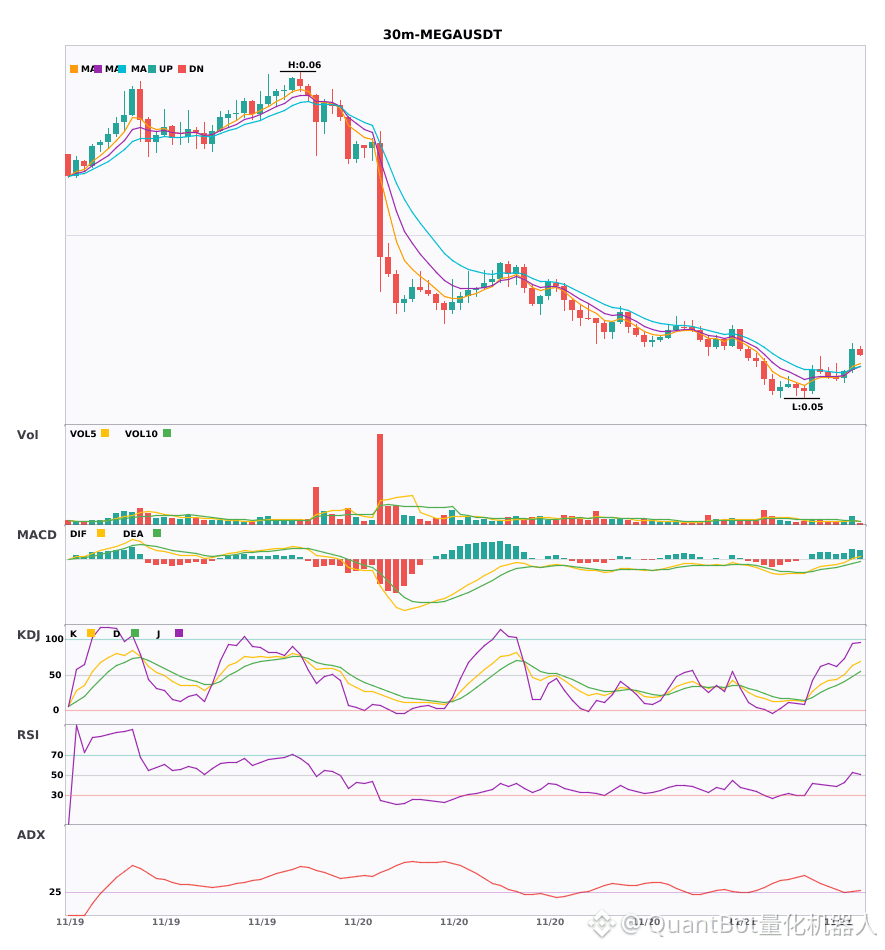
📈 $MEGA | 30-minute bullish signal
━━━━━━━━━━━━━━━━━━
Technical analysis: ADX(26) confirms an upward trend; participation is recommended. MACD DIF crossed above zero, confirming a bullish signal. EMA5 golden-crossed EMA8, indicating a short-term bullish bias. Trading volume increased 2.0x.
Price change: 2.2200%
📈 $APP | 30-minute bullish signal
━━━━━━━━━━━━━━━━━━
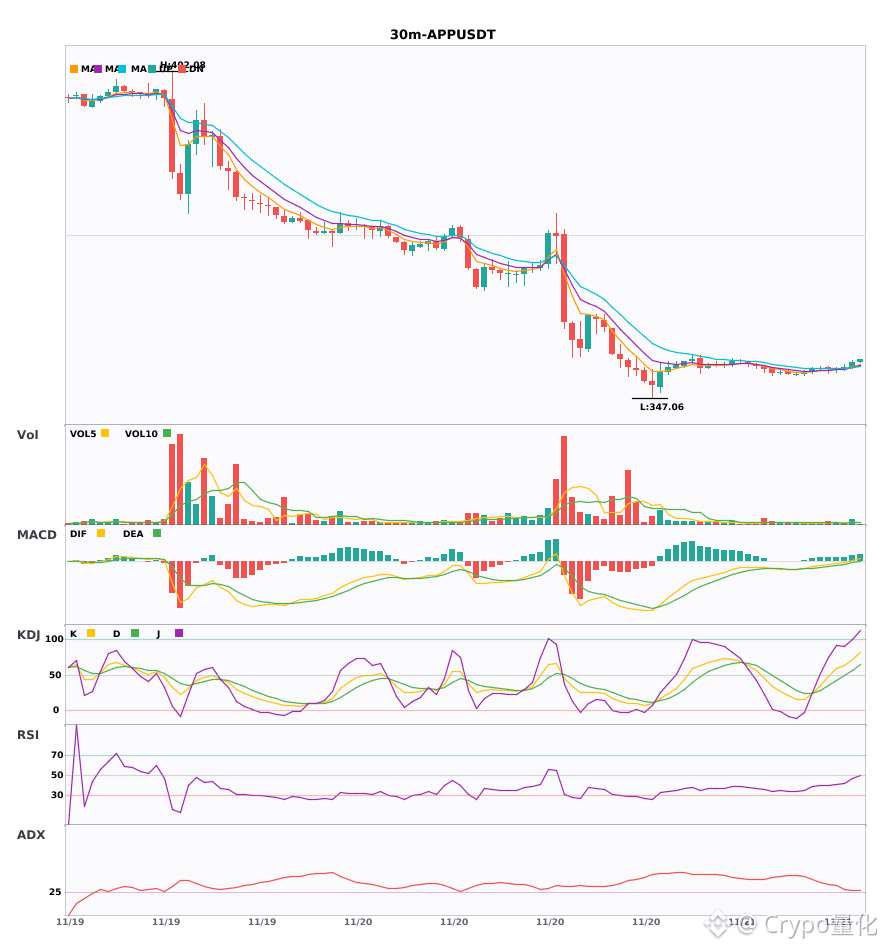
Technical analysis: ADX(26) trend confirmed; participation is possible | MACD DIF crossed above zero, turning bullish | EMA5>EMA8>EMA13 bullish alignment | Strong KDJ, K(71.2)>D(56.8), bulls in control | Trading volume increased 2.7x
Price change: 0.2600%
📈 $ZEC | 30-minute bullish signal
━━━━━━━━━━━━━━━━━━
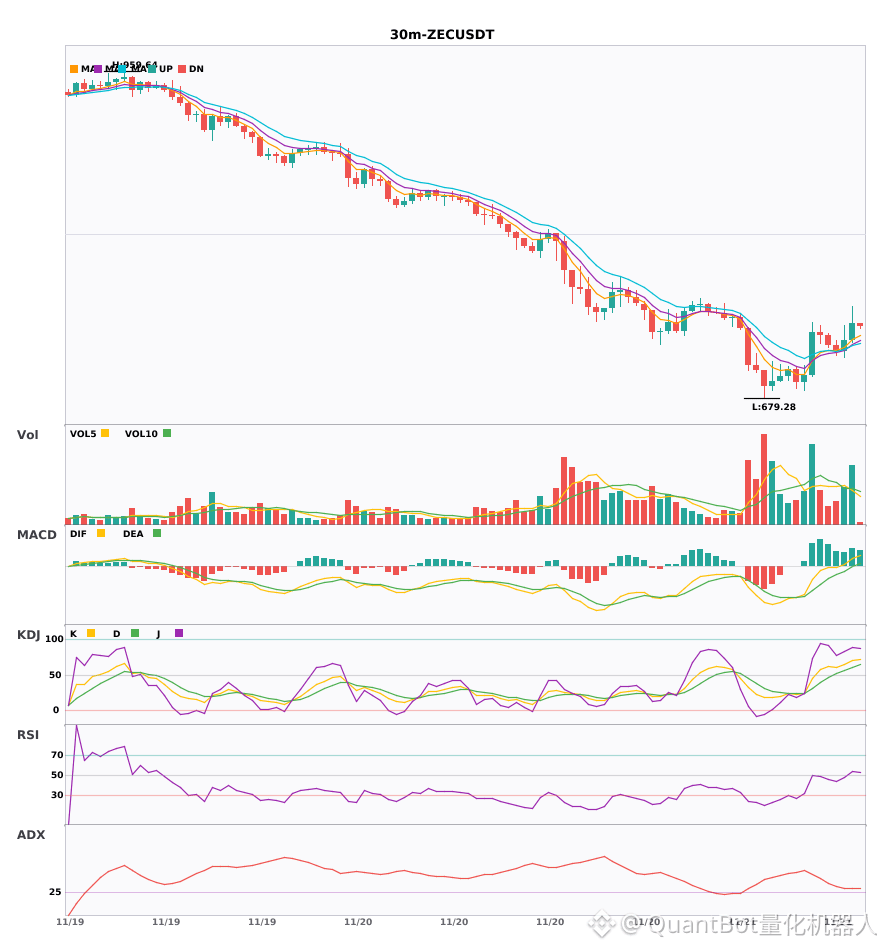
Technical analysis: ADX31 trend is clear; MACD bullish momentum strengthened; EMA5>8>13 bullish alignment; strong KDJ (K69.6/D60.5); volume 1.6x.
Price change: 1.9700%
📌 Market update: DCG-owned Zcash miner Fortitude received shareholder approval for its plan to list on Nasdaq, while ZEC is down 55% from its all-time high.
━━━━━━━━━━━━━━━━━━
#技术分析 #MEGA #APP #ZEC
📌 The above content is for reference only and does not constitute investment advice
$MEGA $APP $ZEC 30-minute technical indicators showing convergent upward momentum
📈 $MEGA | 30-minute bullish signal
━━━━━━━━━━━━━━━━━━
Technical analysis: ADX(26) confirms an upward trend; participation is recommended. MACD DIF crossed above zero, confirming a bullish signal. EMA5 golden-crossed EMA8, indicating a short-term bullish bias. Trading volume increased 2.0x.
Price change: 2.2200%
📈 $APP | 30-minute bullish signal
━━━━━━━━━━━━━━━━━━
Technical analysis: ADX(26) trend confirmed; participation is possible | MACD DIF crossed above zero, turning bullish | EMA5>EMA8>EMA13 bullish alignment | Strong KDJ, K(71.2)>D(56.8), bulls in control | Trading volume increased 2.7x
Price change: 0.2600%
📈 $ZEC | 30-minute bullish signal
━━━━━━━━━━━━━━━━━━
Technical analysis: ADX31 trend is clear; MACD bullish momentum strengthened; EMA5>8>13 bullish alignment; strong KDJ (K69.6/D60.5); volume 1.6x.
Price change: 1.9700%
📌 Market update: DCG-owned Zcash miner Fortitude received shareholder approval for its plan to list on Nasdaq, while ZEC is down 55% from its all-time high.
━━━━━━━━━━━━━━━━━━
#技术分析 #MEGA #APP #ZEC
📌 The above content is for reference only and does not constitute investment advice
📈 $MEGA | 30-minute bullish signal
━━━━━━━━━━━━━━━━━━
Technical analysis: ADX(26) confirms an upward trend; participation is recommended. MACD DIF crossed above zero, confirming a bullish signal. EMA5 golden-crossed EMA8, indicating a short-term bullish bias. Trading volume increased 2.0x.
Price change: 2.2200%
📈 $APP | 30-minute bullish signal
━━━━━━━━━━━━━━━━━━
Technical analysis: ADX(26) trend confirmed; participation is possible | MACD DIF crossed above zero, turning bullish | EMA5>EMA8>EMA13 bullish alignment | Strong KDJ, K(71.2)>D(56.8), bulls in control | Trading volume increased 2.7x
Price change: 0.2600%
📈 $ZEC | 30-minute bullish signal
━━━━━━━━━━━━━━━━━━
Technical analysis: ADX31 trend is clear; MACD bullish momentum strengthened; EMA5>8>13 bullish alignment; strong KDJ (K69.6/D60.5); volume 1.6x.
Price change: 1.9700%
📌 Market update: DCG-owned Zcash miner Fortitude received shareholder approval for its plan to list on Nasdaq, while ZEC is down 55% from its all-time high.
━━━━━━━━━━━━━━━━━━
#技术分析 #MEGA #APP #ZEC
📌 The above content is for reference only and does not constitute investment advice
4
·
--
$MEGA / $APP / $ZEC 30-minute bullish confluence 🔥
════════════════════
🔴 $MEGA 30-minute bullish signal
⚠️Technical analysis: ADX shows the trend is just getting started, so there may be an opportunity to enter; MACD golden cross has broken above the zero line, turning bullish; moving averages have just formed a bullish alignment; volume has doubled.
════════════════════
🔴 $APP 30-minute bullish signal
⚠️Technical analysis: The ADX trend is established and worth following; MACD golden cross has crossed above the zero line, turning bullish; moving averages have just formed a bullish alignment and are spreading upward; KDJ's K line has crossed above D and reached 71, but is not yet overbought; trading volume has increased 2.7 times.
════════════════════
🔴 $ZEC 30-minute bullish signal
⚠️Technical analysis: ADX at 31 indicates a clear trend; MACD golden cross with expanding volume and growing red histogram bars; moving averages are in a bullish alignment; KDJ golden cross has not entered the overbought zone; volume has increased 1.6 times.
📢Market update: Fortitude, a Zcash mining company under DCG, has received shareholder approval for its plan to list on Nasdaq. Meanwhile, ZEC is down 55% from its all-time high.
════════════════════
🔔 Follow to get firsthand market alerts 🔔
#技术分析 #MEGA #APP #ZEC
📌 When trading, pay attention to whether the candlestick pattern aligns
$MEGA / $APP / $ZEC 30-minute bullish confluence 🔥
════════════════════
🔴 $MEGA 30-minute bullish signal
⚠️Technical analysis: ADX shows the trend is just getting started, so there may be an opportunity to enter; MACD golden cross has broken above the zero line, turning bullish; moving averages have just formed a bullish alignment; volume has doubled.
════════════════════
🔴 $APP 30-minute bullish signal
⚠️Technical analysis: The ADX trend is established and worth following; MACD golden cross has crossed above the zero line, turning bullish; moving averages have just formed a bullish alignment and are spreading upward; KDJ's K line has crossed above D and reached 71, but is not yet overbought; trading volume has increased 2.7 times.
════════════════════
🔴 $ZEC 30-minute bullish signal
⚠️Technical analysis: ADX at 31 indicates a clear trend; MACD golden cross with expanding volume and growing red histogram bars; moving averages are in a bullish alignment; KDJ golden cross has not entered the overbought zone; volume has increased 1.6 times.
📢Market update: Fortitude, a Zcash mining company under DCG, has received shareholder approval for its plan to list on Nasdaq. Meanwhile, ZEC is down 55% from its all-time high.
════════════════════
🔔 Follow to get firsthand market alerts 🔔
#技术分析 #MEGA #APP #ZEC
📌 When trading, pay attention to whether the candlestick pattern aligns
════════════════════
🔴 $MEGA 30-minute bullish signal
⚠️Technical analysis: ADX shows the trend is just getting started, so there may be an opportunity to enter; MACD golden cross has broken above the zero line, turning bullish; moving averages have just formed a bullish alignment; volume has doubled.
════════════════════
🔴 $APP 30-minute bullish signal
⚠️Technical analysis: The ADX trend is established and worth following; MACD golden cross has crossed above the zero line, turning bullish; moving averages have just formed a bullish alignment and are spreading upward; KDJ's K line has crossed above D and reached 71, but is not yet overbought; trading volume has increased 2.7 times.
════════════════════
🔴 $ZEC 30-minute bullish signal
⚠️Technical analysis: ADX at 31 indicates a clear trend; MACD golden cross with expanding volume and growing red histogram bars; moving averages are in a bullish alignment; KDJ golden cross has not entered the overbought zone; volume has increased 1.6 times.
📢Market update: Fortitude, a Zcash mining company under DCG, has received shareholder approval for its plan to list on Nasdaq. Meanwhile, ZEC is down 55% from its all-time high.
════════════════════
🔔 Follow to get firsthand market alerts 🔔
#技术分析 #MEGA #APP #ZEC
📌 When trading, pay attention to whether the candlestick pattern aligns
12
·
--
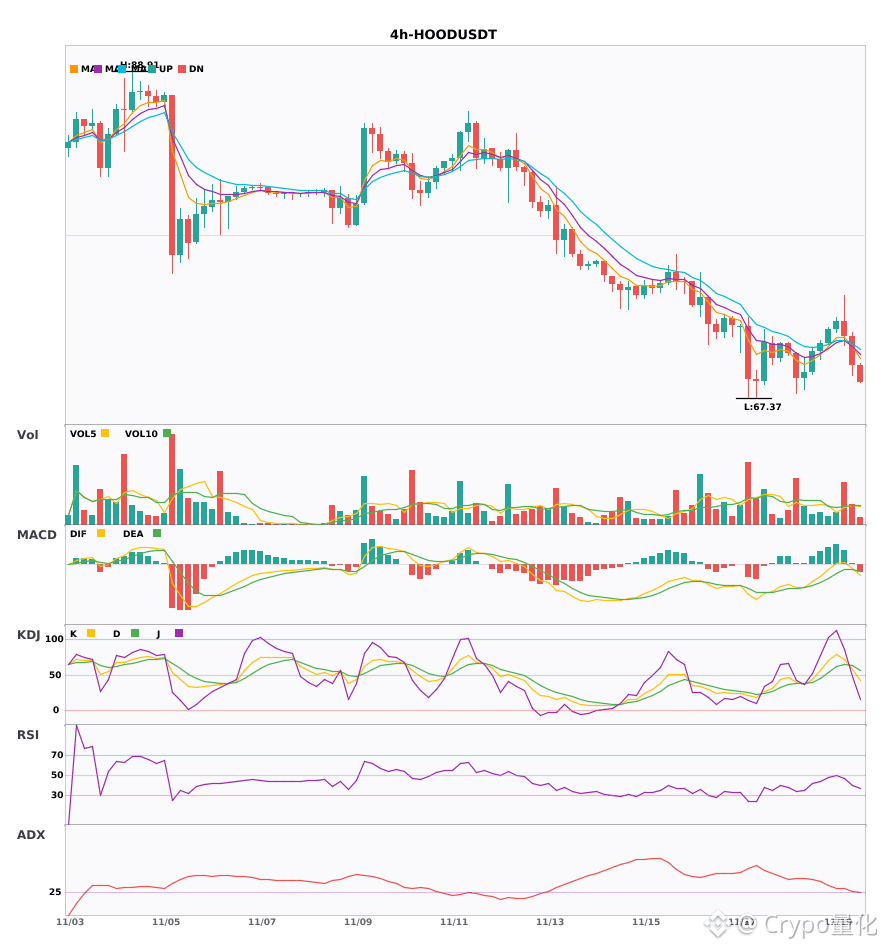
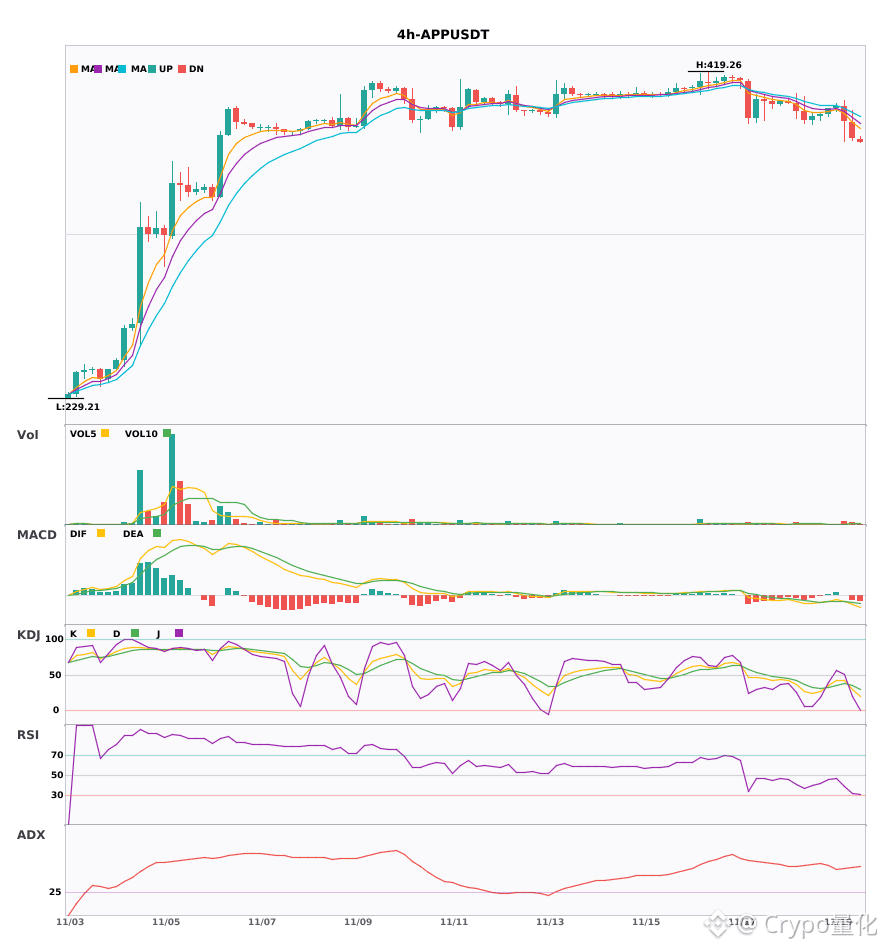
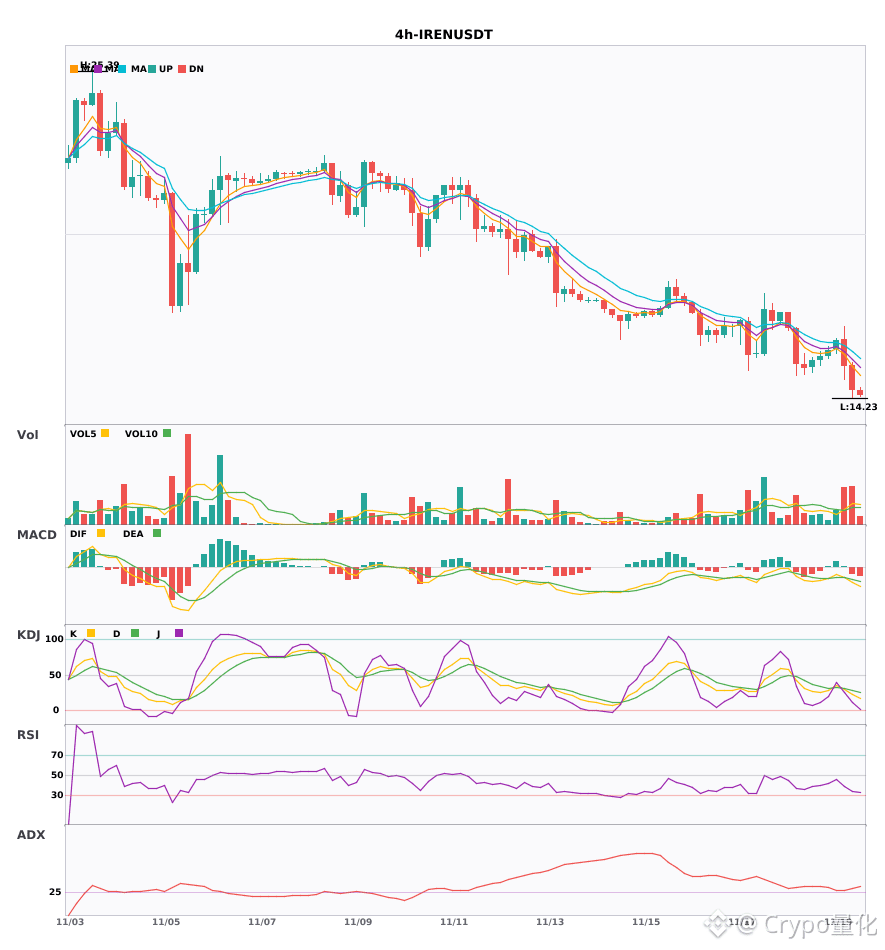
$HOOD/$APP/$IREN 4-hour bearish alignment, under short-term pressure 🔥
════════════════════
🟢 $HOOD 4-hour bearish signal
⚠️ Technicals: The ADX trend is taking shape, so there's an opportunity to participate. MACD has fallen below the zero line—the bears are here. EMA5 crossing below EMA8 signals a short-term bearish turn. KDJ has formed a death cross but hasn't reached the oversold zone. Volume is up 2.3x.
════════════════════
🟢 $APP 4-hour bearish signal
⚠️ Technicals: ADX has surged to 54, indicating a very strong trend, but beware of overheating! MACD's death cross below zero is accelerating the bearish momentum. Bearishly aligned moving averages are exerting pressure. KDJ is weak, with K below D. Trading volume has surged 3.7x.
════════════════════
🟢 $IREN 4-hour bearish signal
⚠️ Technicals: ADX indicates the trend is just getting started, so you can follow it. MACD has formed a death cross below the zero line on rising volume; bearish momentum is accelerating. EMA5, EMA8, and EMA13 are bearishly aligned and pointing down. In KDJ, K has crossed below D and is still near the oversold zone, giving bears the advantage. Volume is up 2.5x, and the decline is quite sharp.
════════════════════
🔔 Follow for first-hand market updates 🔔
#技术分析 #HOOD #APP #IREN
📌 When trading, pay attention to whether the candlestick pattern confirms the setup
$HOOD /$APP /$IREN 4-hour bearish alignment, under short-term pressure 🔥
════════════════════
🟢 $HOOD 4-hour bearish signal
⚠️ Technicals: The ADX trend is taking shape, so there's an opportunity to participate. MACD has fallen below the zero line—the bears are here. EMA5 crossing below EMA8 signals a short-term bearish turn. KDJ has formed a death cross but hasn't reached the oversold zone. Volume is up 2.3x.
════════════════════
🟢 $APP 4-hour bearish signal
⚠️ Technicals: ADX has surged to 54, indicating a very strong trend, but beware of overheating! MACD's death cross below zero is accelerating the bearish momentum. Bearishly aligned moving averages are exerting pressure. KDJ is weak, with K below D. Trading volume has surged 3.7x.
════════════════════
🟢 $IREN 4-hour bearish signal
⚠️ Technicals: ADX indicates the trend is just getting started, so you can follow it. MACD has formed a death cross below the zero line on rising volume; bearish momentum is accelerating. EMA5, EMA8, and EMA13 are bearishly aligned and pointing down. In KDJ, K has crossed below D and is still near the oversold zone, giving bears the advantage. Volume is up 2.5x, and the decline is quite sharp.
════════════════════
🔔 Follow for first-hand market updates 🔔
#技术分析 #HOOD #APP #IREN
📌 When trading, pay attention to whether the candlestick pattern confirms the setup
════════════════════
🟢 $HOOD 4-hour bearish signal
⚠️ Technicals: The ADX trend is taking shape, so there's an opportunity to participate. MACD has fallen below the zero line—the bears are here. EMA5 crossing below EMA8 signals a short-term bearish turn. KDJ has formed a death cross but hasn't reached the oversold zone. Volume is up 2.3x.
════════════════════
🟢 $APP 4-hour bearish signal
⚠️ Technicals: ADX has surged to 54, indicating a very strong trend, but beware of overheating! MACD's death cross below zero is accelerating the bearish momentum. Bearishly aligned moving averages are exerting pressure. KDJ is weak, with K below D. Trading volume has surged 3.7x.
════════════════════
🟢 $IREN 4-hour bearish signal
⚠️ Technicals: ADX indicates the trend is just getting started, so you can follow it. MACD has formed a death cross below the zero line on rising volume; bearish momentum is accelerating. EMA5, EMA8, and EMA13 are bearishly aligned and pointing down. In KDJ, K has crossed below D and is still near the oversold zone, giving bears the advantage. Volume is up 2.5x, and the decline is quite sharp.
════════════════════
🔔 Follow for first-hand market updates 🔔
#技术分析 #HOOD #APP #IREN
📌 When trading, pay attention to whether the candlestick pattern confirms the setup
8

·
--
When a trader jumps in out of FOMO, smart money is already heading for the exit: I built an app to change that 🚨⚙️
If you open an annual or monthly chart, anyone can point and say: it’s ranging, bullish, or bearish. It’s easy to confirm your opinion when you go on social media and see others repeating the same thing
The problem is, you never know when a price has bottomed or when the market structure has changed until it’s already happened
The market doesn’t give you a heads-up. By the time the crowd of retail traders joins the party out of euphoria or sells in a panic, the best part is already over. The discount started much earlier, and institutional buying happened quietly, without anyone suspecting a thing. That’s why trading isn’t a race to predict, but a matter of risk management
While retail traders open a chart, see whether it’s going up or down, and consider their search over, institutions classify the environment by cross-referencing real variables:
*Trend and volatility (the actual magnitude of price movements)
*Capital flows and sector rotation
*Correlation between assets and liquidity conditions
Today, information is public to everyone, but a massive gap in knowledge and tools still exists
To help close that gap, I developed QuantAlphaIA: an app with AI and statistical models that performs this structural classification for you
It gives you a clean technical summary showing which market regime we’re in and which of the app’s validated strategies is best suited to that environment
I built it for educational purposes so you can experience firsthand what it feels like to trade backed by hard data and mathematical validation, eliminating that feeling of emptiness when you press buy or sell with no one by your side. You should validate whether your idea makes sense before risking your capital, never after.
🔓 LIKE and comment Regime on this post to try it: I’ll release the public access key in the comments
Math doesn’t lie. It’s time to read
#trading #App
When a trader jumps in out of FOMO, smart money is already heading for the exit: I built an app to change that 🚨⚙️
If you open an annual or monthly chart, anyone can point and say: it’s ranging, bullish, or bearish. It’s easy to confirm your opinion when you go on social media and see others repeating the same thing
The problem is, you never know when a price has bottomed or when the market structure has changed until it’s already happened
The market doesn’t give you a heads-up. By the time the crowd of retail traders joins the party out of euphoria or sells in a panic, the best part is already over. The discount started much earlier, and institutional buying happened quietly, without anyone suspecting a thing. That’s why trading isn’t a race to predict, but a matter of risk management
While retail traders open a chart, see whether it’s going up or down, and consider their search over, institutions classify the environment by cross-referencing real variables:
*Trend and volatility (the actual magnitude of price movements)
*Capital flows and sector rotation
*Correlation between assets and liquidity conditions
Today, information is public to everyone, but a massive gap in knowledge and tools still exists
To help close that gap, I developed QuantAlphaIA: an app with AI and statistical models that performs this structural classification for you
It gives you a clean technical summary showing which market regime we’re in and which of the app’s validated strategies is best suited to that environment
I built it for educational purposes so you can experience firsthand what it feels like to trade backed by hard data and mathematical validation, eliminating that feeling of emptiness when you press buy or sell with no one by your side. You should validate whether your idea makes sense before risking your capital, never after.
🔓 LIKE and comment Regime on this post to try it: I’ll release the public access key in the comments
Math doesn’t lie. It’s time to read
#trading #App
If you open an annual or monthly chart, anyone can point and say: it’s ranging, bullish, or bearish. It’s easy to confirm your opinion when you go on social media and see others repeating the same thing
The problem is, you never know when a price has bottomed or when the market structure has changed until it’s already happened
The market doesn’t give you a heads-up. By the time the crowd of retail traders joins the party out of euphoria or sells in a panic, the best part is already over. The discount started much earlier, and institutional buying happened quietly, without anyone suspecting a thing. That’s why trading isn’t a race to predict, but a matter of risk management
While retail traders open a chart, see whether it’s going up or down, and consider their search over, institutions classify the environment by cross-referencing real variables:
*Trend and volatility (the actual magnitude of price movements)
*Capital flows and sector rotation
*Correlation between assets and liquidity conditions
Today, information is public to everyone, but a massive gap in knowledge and tools still exists
To help close that gap, I developed QuantAlphaIA: an app with AI and statistical models that performs this structural classification for you
It gives you a clean technical summary showing which market regime we’re in and which of the app’s validated strategies is best suited to that environment
I built it for educational purposes so you can experience firsthand what it feels like to trade backed by hard data and mathematical validation, eliminating that feeling of emptiness when you press buy or sell with no one by your side. You should validate whether your idea makes sense before risking your capital, never after.
🔓 LIKE and comment Regime on this post to try it: I’ll release the public access key in the comments
Math doesn’t lie. It’s time to read
#trading #App

1
265
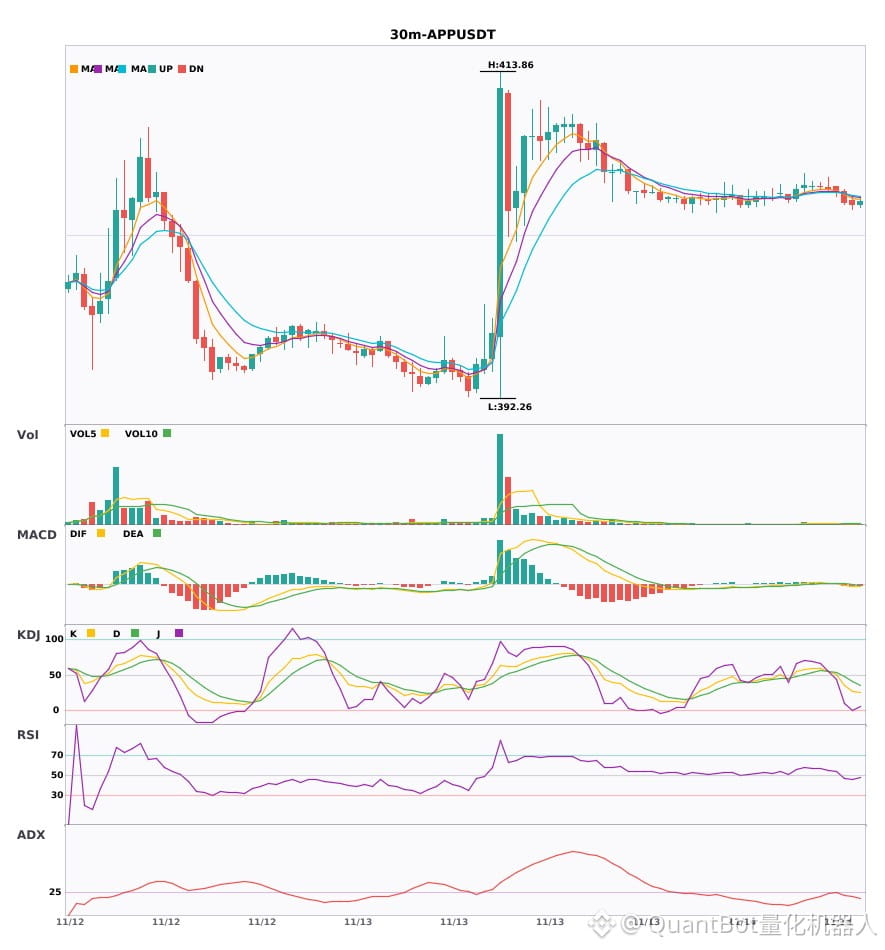
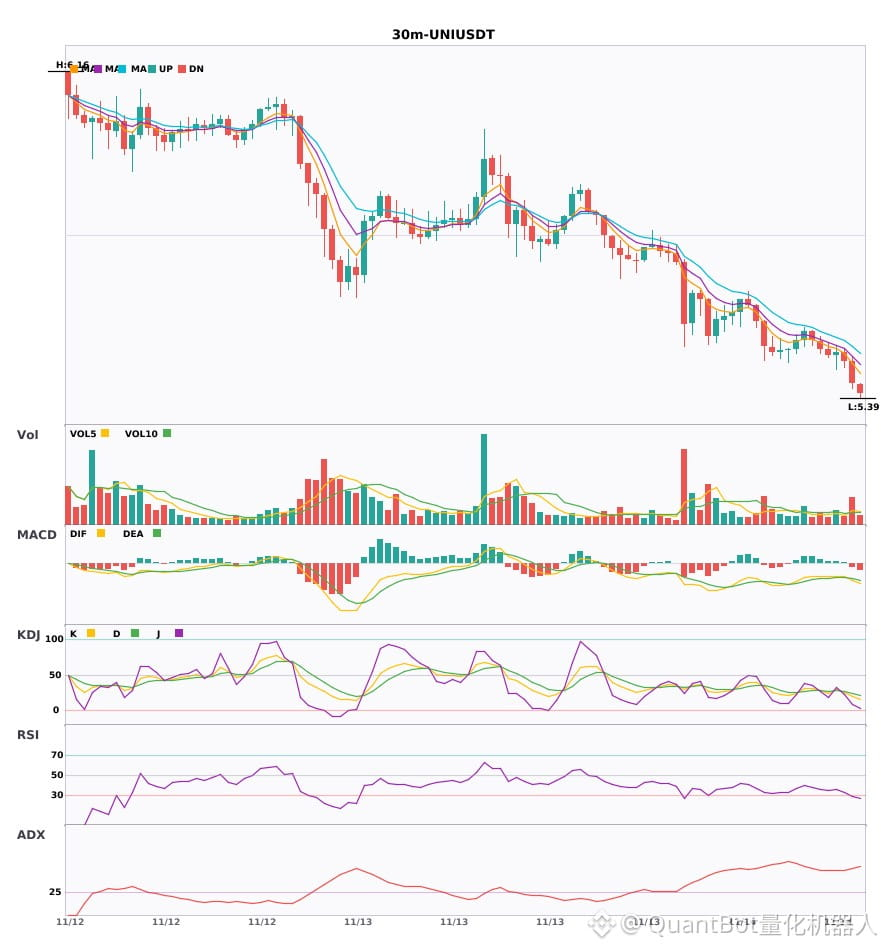
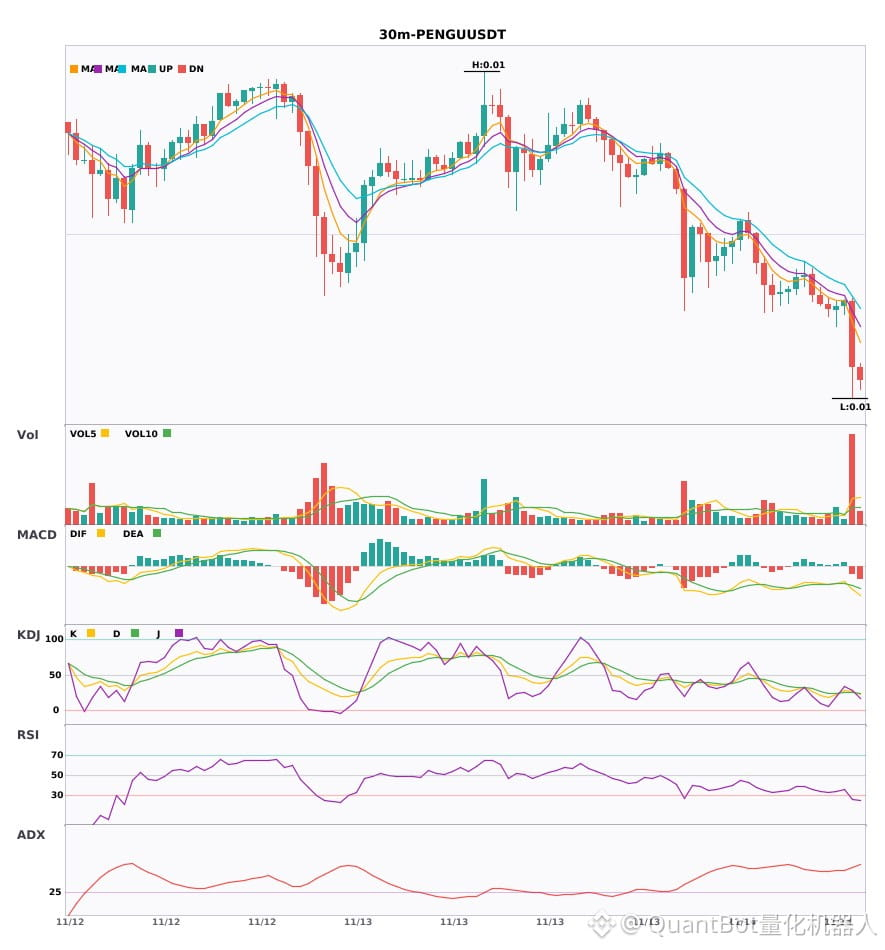
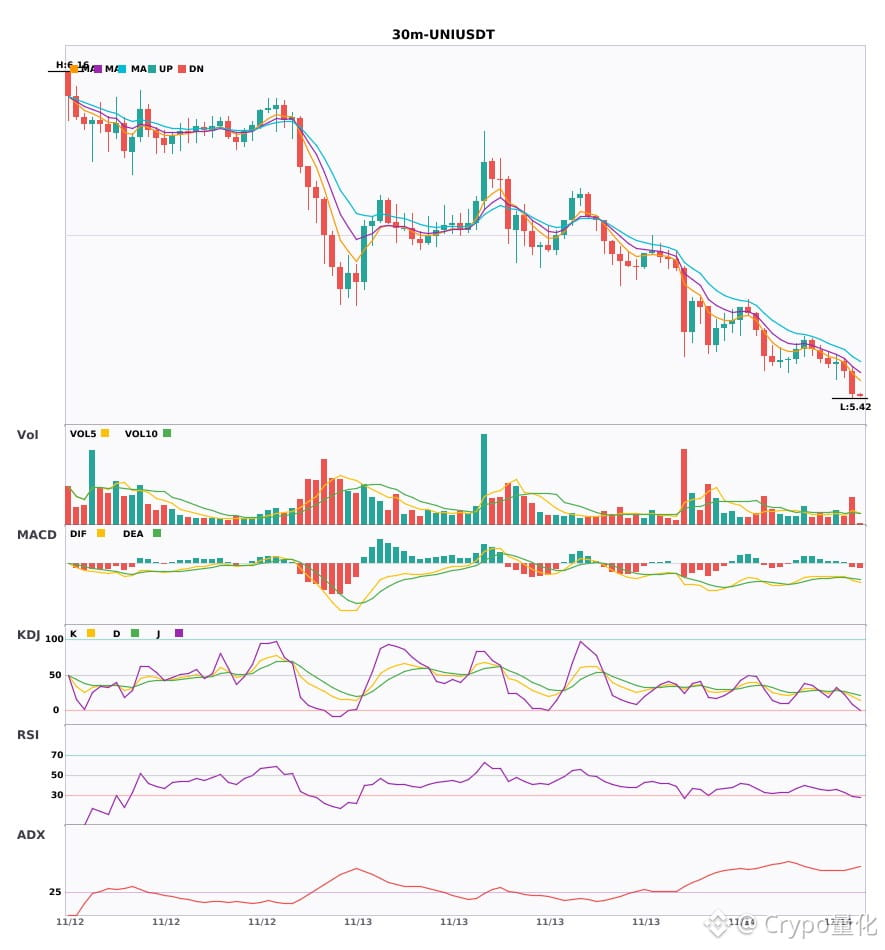
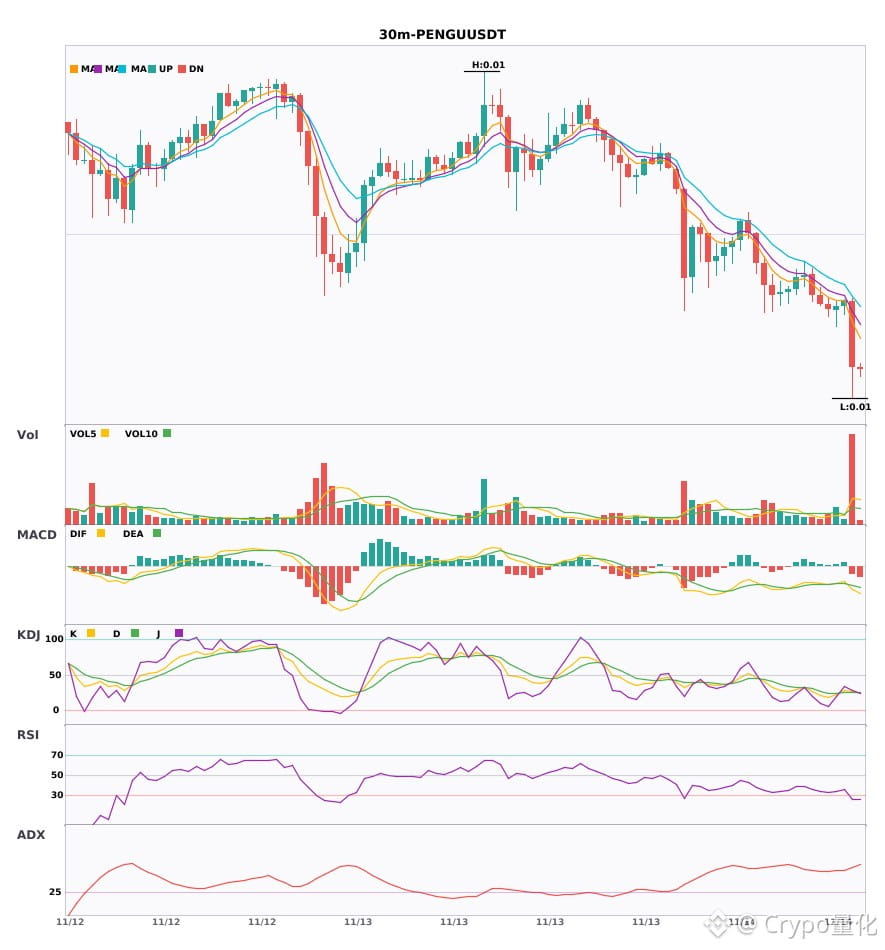
30-minute bearish signal triggered: $APP $UNI $PENGU
📉 $APP | 30-minute bearish signal
━━━━━━━━━━━━━━━━━━
Technical analysis: ADX(25) trend is developing; potential entry; MACD bearish cross below zero, bearish momentum accelerating; EMA5 crosses below EMA8, short-term trend turns bearish; KDJ weak (K35.3/D47.6), sellers in control; volume up 1.8x.
Price change: -0.1900%
📉 $UNI | 30-minute bearish signal
━━━━━━━━━━━━━━━━━━
Technical analysis: ADX(52) trend is extremely strong; watch for an overbought pullback; MACD bearish cross below zero, bearish momentum strengthening; EMA5/8/13 in bearish alignment; KDJ weak (K19.5/D24.6), sellers in control; volume up 2.2x.
Price change: -0.9500%
📉 $PENGU | 30-minute bearish signal
━━━━━━━━━━━━━━━━━━
Technical analysis: ADX(53) extremely strong trend; beware of an overbought pullback; MACD bearish cross below zero, bearish momentum strengthening; EMA5<8<13 in bearish alignment; KDJ weak (K26.4/D25.6); volume up 5.1x.
Price change: -2.0900%
━━━━━━━━━━━━━━━━━━
#技术分析 #APP #UNI #PENGU
📌 The above is for reference only and does not constitute investment advice
30-minute bearish signal triggered: $APP $UNI $PENGU
📉 $APP | 30-minute bearish signal
━━━━━━━━━━━━━━━━━━
Technical analysis: ADX(25) trend is developing; potential entry; MACD bearish cross below zero, bearish momentum accelerating; EMA5 crosses below EMA8, short-term trend turns bearish; KDJ weak (K35.3/D47.6), sellers in control; volume up 1.8x.
Price change: -0.1900%
📉 $UNI | 30-minute bearish signal
━━━━━━━━━━━━━━━━━━
Technical analysis: ADX(52) trend is extremely strong; watch for an overbought pullback; MACD bearish cross below zero, bearish momentum strengthening; EMA5/8/13 in bearish alignment; KDJ weak (K19.5/D24.6), sellers in control; volume up 2.2x.
Price change: -0.9500%
📉 $PENGU | 30-minute bearish signal
━━━━━━━━━━━━━━━━━━
Technical analysis: ADX(53) extremely strong trend; beware of an overbought pullback; MACD bearish cross below zero, bearish momentum strengthening; EMA5<8<13 in bearish alignment; KDJ weak (K26.4/D25.6); volume up 5.1x.
Price change: -2.0900%
━━━━━━━━━━━━━━━━━━
#技术分析 #APP #UNI #PENGU
📌 The above is for reference only and does not constitute investment advice
📉 $APP | 30-minute bearish signal
━━━━━━━━━━━━━━━━━━
Technical analysis: ADX(25) trend is developing; potential entry; MACD bearish cross below zero, bearish momentum accelerating; EMA5 crosses below EMA8, short-term trend turns bearish; KDJ weak (K35.3/D47.6), sellers in control; volume up 1.8x.
Price change: -0.1900%
📉 $UNI | 30-minute bearish signal
━━━━━━━━━━━━━━━━━━
Technical analysis: ADX(52) trend is extremely strong; watch for an overbought pullback; MACD bearish cross below zero, bearish momentum strengthening; EMA5/8/13 in bearish alignment; KDJ weak (K19.5/D24.6), sellers in control; volume up 2.2x.
Price change: -0.9500%
📉 $PENGU | 30-minute bearish signal
━━━━━━━━━━━━━━━━━━
Technical analysis: ADX(53) extremely strong trend; beware of an overbought pullback; MACD bearish cross below zero, bearish momentum strengthening; EMA5<8<13 in bearish alignment; KDJ weak (K26.4/D25.6); volume up 5.1x.
Price change: -2.0900%
━━━━━━━━━━━━━━━━━━
#技术分析 #APP #UNI #PENGU
📌 The above is for reference only and does not constitute investment advice
5
·
--
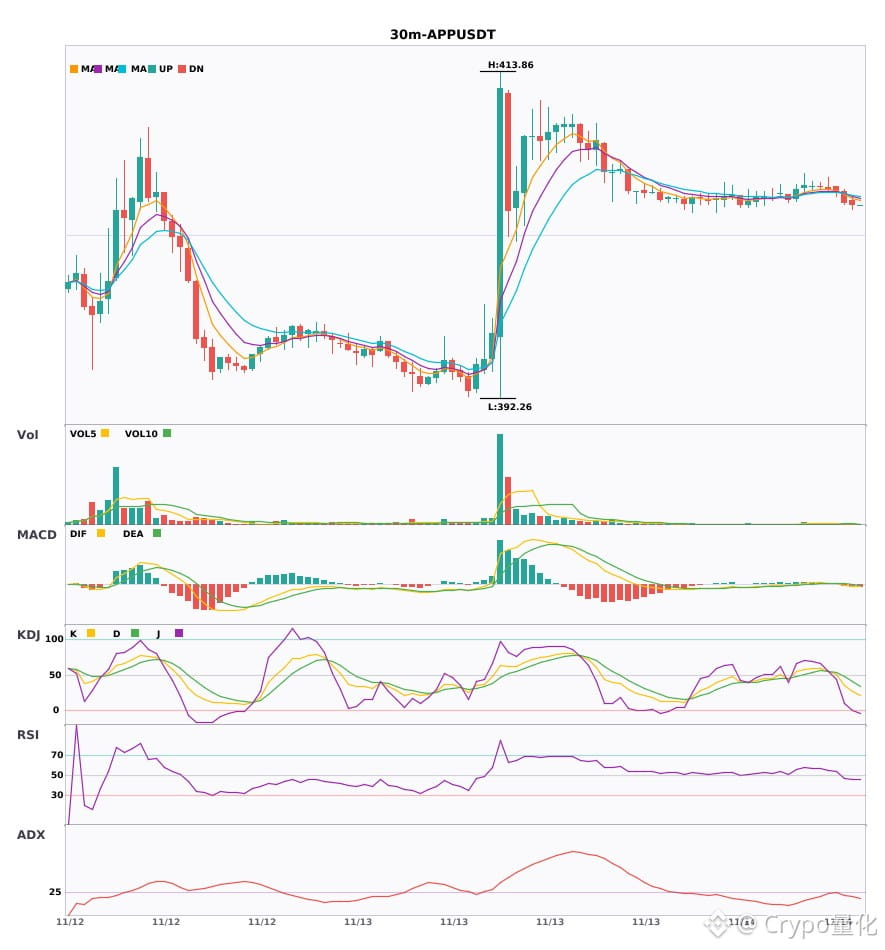
$APP $UNI $PENGU 30-minute moving averages are bearishly aligned, with a MACD death cross confirming the bearish turn 🔥
════════════════════
🟢 $APP 30-minute bearish signal
⚠️Technical analysis: ADX(25): trend has just formed; entry is possible | MACD death cross below zero, green bars expanding, bears accelerating | Moving averages have just turned bearish and are lining up downward | KDJ is weak, K is below D but not oversold (K35.3 D47.6) | Volume is up 1.8x
════════════════════
🟢 $UNI 30-minute bearish signal
⚠️Technical analysis: Strong ADX trend; watch for overheating. MACD death cross with expanding green bars, moving averages bearishly aligned and diverging downward, KDJ weak with K crossing below D, volume up 2.2x.
════════════════════
🟢 $PENGU 30-minute bearish signal
⚠️Technical analysis: ADX53 indicates a very strong trend; beware of overheating and a pullback. MACD death cross below zero; bearish momentum is accelerating. Moving averages are bearishly aligned and pointing downward. KDJ is weak, with K below D. Trading volume has surged 5.1x.
════════════════════
🔔 Follow for first-hand market movement alerts 🔔
#技术分析 #APP #UNI #PENGU
📌 When trading, pay attention to whether the candlestick pattern meets the criteria
$APP $UNI $PENGU 30-minute moving averages are bearishly aligned, with a MACD death cross confirming the bearish turn 🔥
════════════════════
🟢 $APP 30-minute bearish signal
⚠️Technical analysis: ADX(25): trend has just formed; entry is possible | MACD death cross below zero, green bars expanding, bears accelerating | Moving averages have just turned bearish and are lining up downward | KDJ is weak, K is below D but not oversold (K35.3 D47.6) | Volume is up 1.8x
════════════════════
🟢 $UNI 30-minute bearish signal
⚠️Technical analysis: Strong ADX trend; watch for overheating. MACD death cross with expanding green bars, moving averages bearishly aligned and diverging downward, KDJ weak with K crossing below D, volume up 2.2x.
════════════════════
🟢 $PENGU 30-minute bearish signal
⚠️Technical analysis: ADX53 indicates a very strong trend; beware of overheating and a pullback. MACD death cross below zero; bearish momentum is accelerating. Moving averages are bearishly aligned and pointing downward. KDJ is weak, with K below D. Trading volume has surged 5.1x.
════════════════════
🔔 Follow for first-hand market movement alerts 🔔
#技术分析 #APP #UNI #PENGU
📌 When trading, pay attention to whether the candlestick pattern meets the criteria
════════════════════
🟢 $APP 30-minute bearish signal
⚠️Technical analysis: ADX(25): trend has just formed; entry is possible | MACD death cross below zero, green bars expanding, bears accelerating | Moving averages have just turned bearish and are lining up downward | KDJ is weak, K is below D but not oversold (K35.3 D47.6) | Volume is up 1.8x
════════════════════
🟢 $UNI 30-minute bearish signal
⚠️Technical analysis: Strong ADX trend; watch for overheating. MACD death cross with expanding green bars, moving averages bearishly aligned and diverging downward, KDJ weak with K crossing below D, volume up 2.2x.
════════════════════
🟢 $PENGU 30-minute bearish signal
⚠️Technical analysis: ADX53 indicates a very strong trend; beware of overheating and a pullback. MACD death cross below zero; bearish momentum is accelerating. Moving averages are bearishly aligned and pointing downward. KDJ is weak, with K below D. Trading volume has surged 5.1x.
════════════════════
🔔 Follow for first-hand market movement alerts 🔔
#技术分析 #APP #UNI #PENGU
📌 When trading, pay attention to whether the candlestick pattern meets the criteria
18

·
--
$APP / Tokenized Stocks · Premium Monitoring
Token: APPon | Underlying: APP | Multiplier: 1
On-chain price: $405.23 (24h +2.34%)
Underlying U.S. stock: $405.23
Premium / Discount: +0.00% (vs. underlying fair value) (Underlying market is closed; comparison uses the latest close)
52-week range: $225.19 - $738.01
Number of holder addresses: 355
Underlying status: closed (Weekend or Holiday)
Why monitor the premium: Tokens can be traded 24/7, while underlying U.S. stocks are quoted only during U.S. market hours.
Premiums are most likely to widen when the market is closed—either due to on-chain buying pressure or growing expectations of redemptions / trading suspensions.
Unusual premium swings often reveal sentiment and arbitrage gaps before the price itself does.
Do you find premium monitoring more useful, or is just watching the price enough? 👇
(The above is for public-data education only, not investment advice. DYOR)
#APP
$APP / Tokenized Stocks · Premium Monitoring
Token: APPon | Underlying: APP | Multiplier: 1
On-chain price: $405.23 (24h +2.34%)
Underlying U.S. stock: $405.23
Premium / Discount: +0.00% (vs. underlying fair value) (Underlying market is closed; comparison uses the latest close)
52-week range: $225.19 - $738.01
Number of holder addresses: 355
Underlying status: closed (Weekend or Holiday)
Why monitor the premium: Tokens can be traded 24/7, while underlying U.S. stocks are quoted only during U.S. market hours.
Premiums are most likely to widen when the market is closed—either due to on-chain buying pressure or growing expectations of redemptions / trading suspensions.
Unusual premium swings often reveal sentiment and arbitrage gaps before the price itself does.
Do you find premium monitoring more useful, or is just watching the price enough? 👇
(The above is for public-data education only, not investment advice. DYOR)
#APP
Token: APPon | Underlying: APP | Multiplier: 1
On-chain price: $405.23 (24h +2.34%)
Underlying U.S. stock: $405.23
Premium / Discount: +0.00% (vs. underlying fair value) (Underlying market is closed; comparison uses the latest close)
52-week range: $225.19 - $738.01
Number of holder addresses: 355
Underlying status: closed (Weekend or Holiday)
Why monitor the premium: Tokens can be traded 24/7, while underlying U.S. stocks are quoted only during U.S. market hours.
Premiums are most likely to widen when the market is closed—either due to on-chain buying pressure or growing expectations of redemptions / trading suspensions.
Unusual premium swings often reveal sentiment and arbitrage gaps before the price itself does.
Do you find premium monitoring more useful, or is just watching the price enough? 👇
(The above is for public-data education only, not investment advice. DYOR)
#APP
3
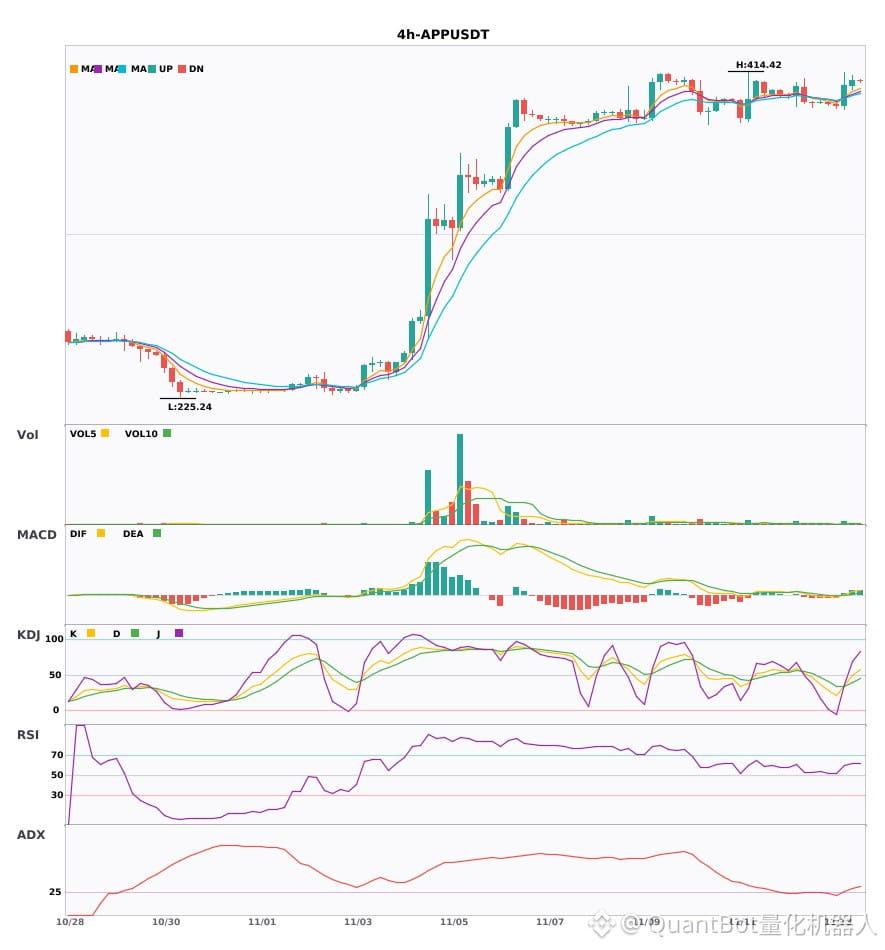
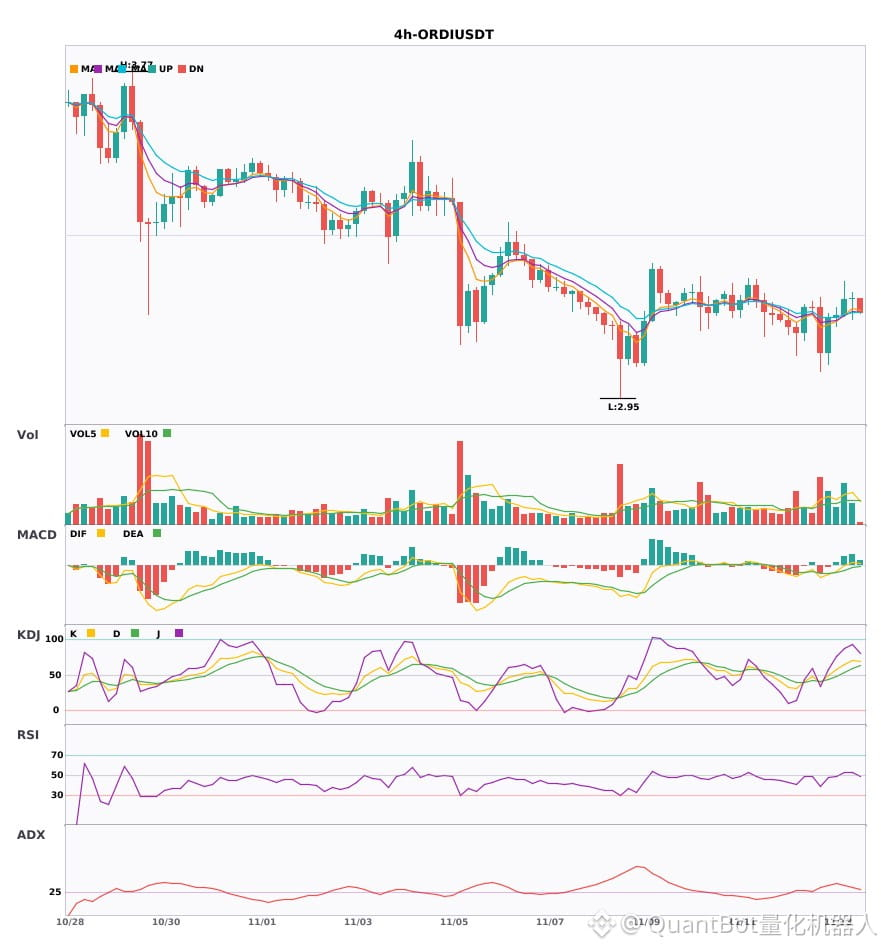
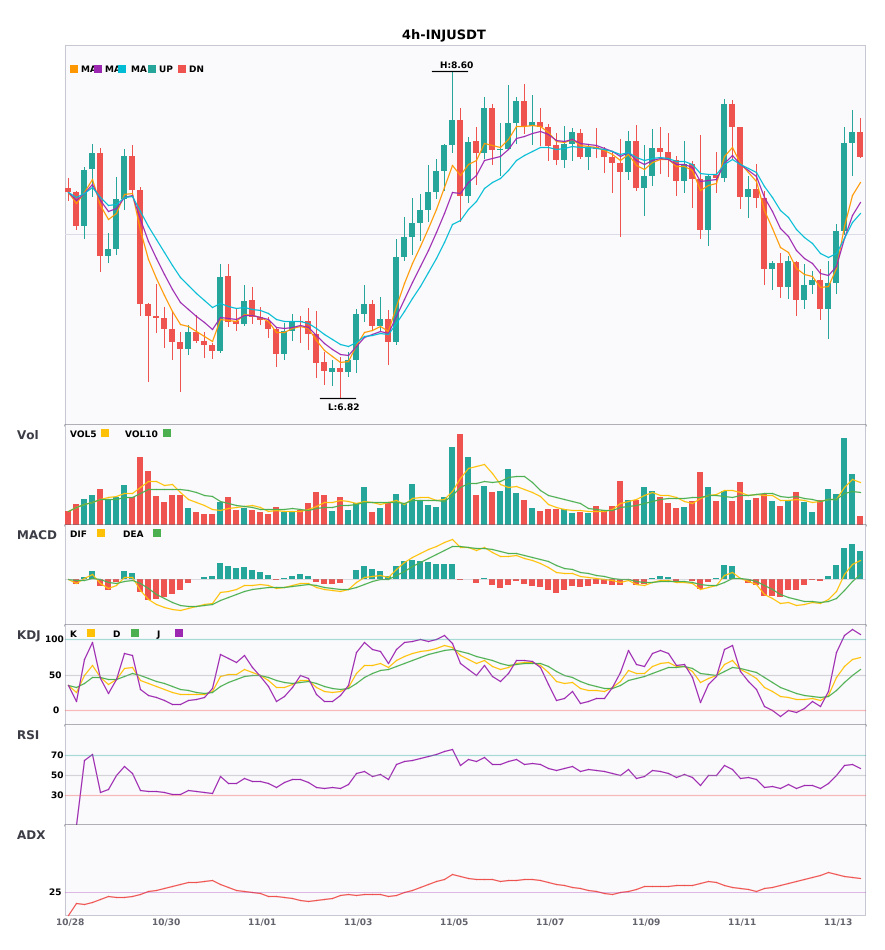
$APP/$ORDI/$INJ 4H Resonance Strengthens, Breakout Potential Assessment
📈 $APP | 4-hour Bullish Signal
━━━━━━━━━━━━━━━━━━
Technical analysis: ADX(25) confirms the trend; entry is possible. MACD golden cross above zero; bullish momentum is strengthening. EMA5 crosses above EMA8, turning bullish in the short term. KDJ golden cross (K35.0/D34.4), bullish outlook. Volume increased 3.2x.
Price change: 3.0200%
📈 $ORDI | 4-hour Bullish Signal
━━━━━━━━━━━━━━━━━━
Technical analysis: ADX(34) indicates a significant trend. MACD DIF crosses above zero; trend leans bullish. EMA5 golden cross over EMA8; bullish outlook in the short term. KDJ is trading at a high level, with bulls in control (K:65.3, D:54.1). Volume increased 1.7x.
Price change: 1.3000%
📈 $INJ | 4-hour Bullish Signal
━━━━━━━━━━━━━━━━━━
Technical analysis: ADX(44) indicates a clear trend|MACD bullish momentum strengthening|EMA5>EMA8>EMA13 bullish alignment|Volume increased 2.8x
Price change: 0.6900%
━━━━━━━━━━━━━━━━━━
#技术分析 #APP #ORDI #INJ
📌 The above content is for reference only and does not constitute investment advice
$APP /$ORDI /$INJ 4H Resonance Strengthens, Breakout Potential Assessment
📈 $APP | 4-hour Bullish Signal
━━━━━━━━━━━━━━━━━━
Technical analysis: ADX(25) confirms the trend; entry is possible. MACD golden cross above zero; bullish momentum is strengthening. EMA5 crosses above EMA8, turning bullish in the short term. KDJ golden cross (K35.0/D34.4), bullish outlook. Volume increased 3.2x.
Price change: 3.0200%
📈 $ORDI | 4-hour Bullish Signal
━━━━━━━━━━━━━━━━━━
Technical analysis: ADX(34) indicates a significant trend. MACD DIF crosses above zero; trend leans bullish. EMA5 golden cross over EMA8; bullish outlook in the short term. KDJ is trading at a high level, with bulls in control (K:65.3, D:54.1). Volume increased 1.7x.
Price change: 1.3000%
📈 $INJ | 4-hour Bullish Signal
━━━━━━━━━━━━━━━━━━
Technical analysis: ADX(44) indicates a clear trend|MACD bullish momentum strengthening|EMA5>EMA8>EMA13 bullish alignment|Volume increased 2.8x
Price change: 0.6900%
━━━━━━━━━━━━━━━━━━
#技术分析 #APP #ORDI #INJ
📌 The above content is for reference only and does not constitute investment advice
📈 $APP | 4-hour Bullish Signal
━━━━━━━━━━━━━━━━━━
Technical analysis: ADX(25) confirms the trend; entry is possible. MACD golden cross above zero; bullish momentum is strengthening. EMA5 crosses above EMA8, turning bullish in the short term. KDJ golden cross (K35.0/D34.4), bullish outlook. Volume increased 3.2x.
Price change: 3.0200%
📈 $ORDI | 4-hour Bullish Signal
━━━━━━━━━━━━━━━━━━
Technical analysis: ADX(34) indicates a significant trend. MACD DIF crosses above zero; trend leans bullish. EMA5 golden cross over EMA8; bullish outlook in the short term. KDJ is trading at a high level, with bulls in control (K:65.3, D:54.1). Volume increased 1.7x.
Price change: 1.3000%
📈 $INJ | 4-hour Bullish Signal
━━━━━━━━━━━━━━━━━━
Technical analysis: ADX(44) indicates a clear trend|MACD bullish momentum strengthening|EMA5>EMA8>EMA13 bullish alignment|Volume increased 2.8x
Price change: 0.6900%
━━━━━━━━━━━━━━━━━━
#技术分析 #APP #ORDI #INJ
📌 The above content is for reference only and does not constitute investment advice
10
·
--
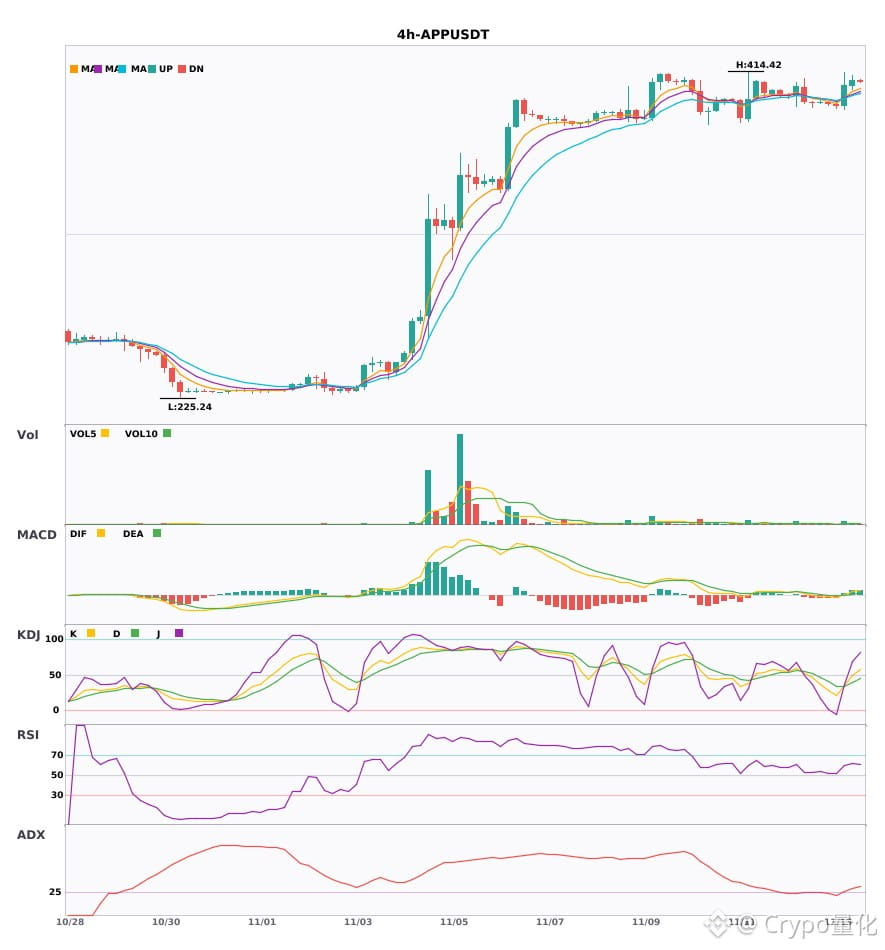
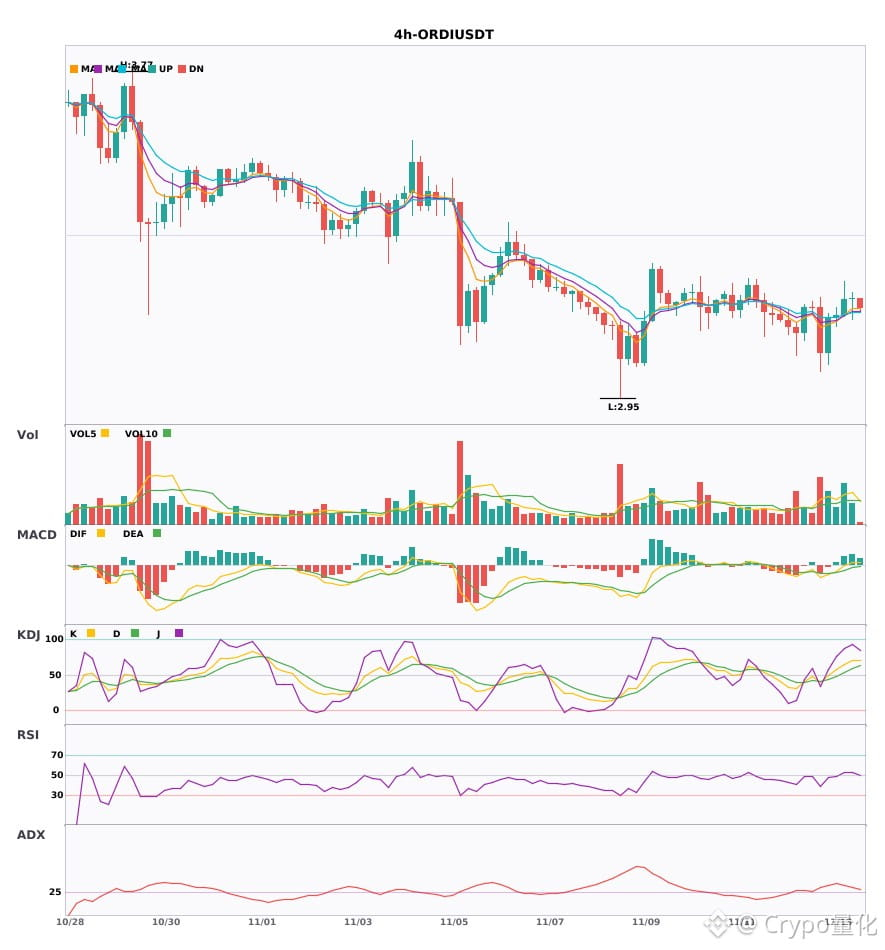
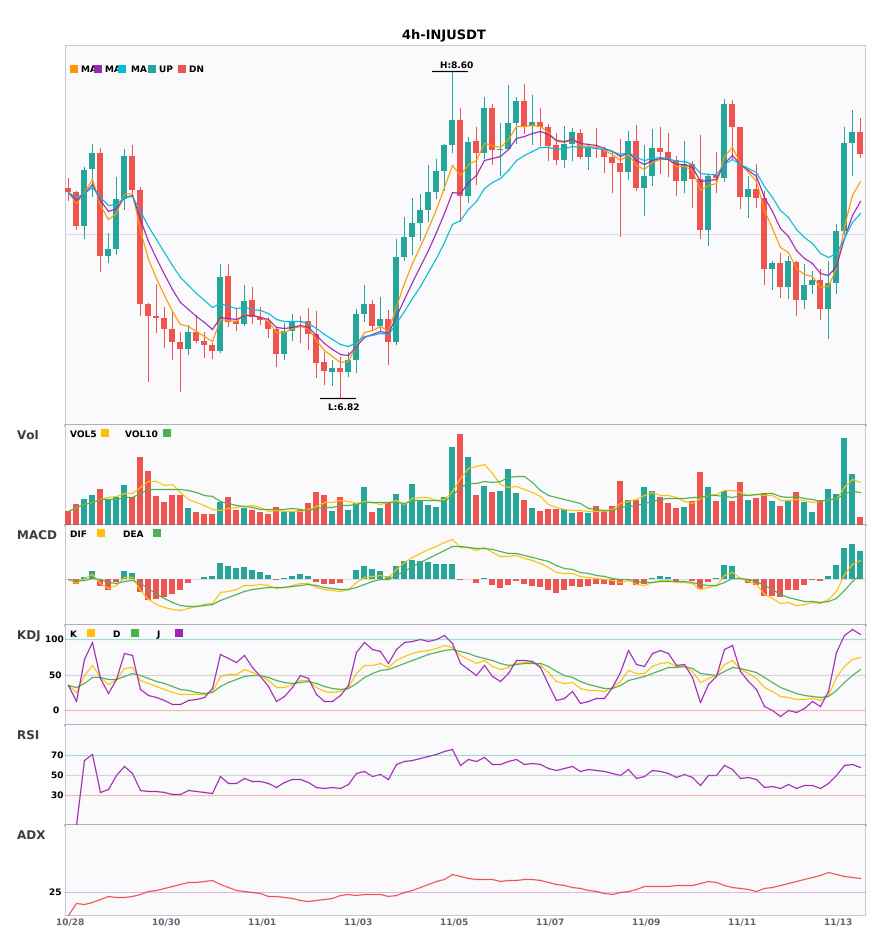
$APP $ORDI $INJ 4 hours: Golden cross gaining strength—which one has the greatest upside? 🔥
════════════════════
🔴 $APP 4 hours Bullish Signal
⚠️ Technicals: ADX indicates the trend has just started; MACD shows a golden cross with rising volume; moving averages are in bullish alignment; K has crossed above D without entering overbought territory; volume is up 3.2x. Consider going long.
════════════════════
🔴 $ORDI 4 hours Bullish Signal
⚠️ Technicals: ADX shows a clear trend; MACD shows a golden cross with rising volume; moving averages have just formed a bullish alignment; K has crossed above D without entering overbought territory; volume is up.
════════════════════
🔴 $INJ 4 hours Bullish Signal
⚠️ Technicals: ADX is rising, with a clear trend | MACD golden cross with rising volume and expanding red bars; strong bullish momentum | EMAs are in a bullish alignment and spreading upward | Volume has surged to 2.8x
════════════════════
🔔 Follow for first-hand market movements 🔔
#技术分析 #APP #ORDI #INJ
📌 When trading, pay attention to whether the candlestick pattern meets the criteria
$APP $ORDI $INJ 4 hours: Golden cross gaining strength—which one has the greatest upside? 🔥
════════════════════
🔴 $APP 4 hours Bullish Signal
⚠️ Technicals: ADX indicates the trend has just started; MACD shows a golden cross with rising volume; moving averages are in bullish alignment; K has crossed above D without entering overbought territory; volume is up 3.2x. Consider going long.
════════════════════
🔴 $ORDI 4 hours Bullish Signal
⚠️ Technicals: ADX shows a clear trend; MACD shows a golden cross with rising volume; moving averages have just formed a bullish alignment; K has crossed above D without entering overbought territory; volume is up.
════════════════════
🔴 $INJ 4 hours Bullish Signal
⚠️ Technicals: ADX is rising, with a clear trend | MACD golden cross with rising volume and expanding red bars; strong bullish momentum | EMAs are in a bullish alignment and spreading upward | Volume has surged to 2.8x
════════════════════
🔔 Follow for first-hand market movements 🔔
#技术分析 #APP #ORDI #INJ
📌 When trading, pay attention to whether the candlestick pattern meets the criteria
════════════════════
🔴 $APP 4 hours Bullish Signal
⚠️ Technicals: ADX indicates the trend has just started; MACD shows a golden cross with rising volume; moving averages are in bullish alignment; K has crossed above D without entering overbought territory; volume is up 3.2x. Consider going long.
════════════════════
🔴 $ORDI 4 hours Bullish Signal
⚠️ Technicals: ADX shows a clear trend; MACD shows a golden cross with rising volume; moving averages have just formed a bullish alignment; K has crossed above D without entering overbought territory; volume is up.
════════════════════
🔴 $INJ 4 hours Bullish Signal
⚠️ Technicals: ADX is rising, with a clear trend | MACD golden cross with rising volume and expanding red bars; strong bullish momentum | EMAs are in a bullish alignment and spreading upward | Volume has surged to 2.8x
════════════════════
🔔 Follow for first-hand market movements 🔔
#技术分析 #APP #ORDI #INJ
📌 When trading, pay attention to whether the candlestick pattern meets the criteria
10

·
--
$APP 4-hour golden cross with rising volume; the daily bullish alignment has just formed, with multiple timeframes confirming a bullish reversal 🔥
════════════════════
🔴 $APP 4-hour bullish signal
⚠️ Technical analysis: Daily + 4-hour multi-timeframe confirmation! After the 4-hour MACD golden cross, the red bars are expanding. The moving averages are in a bullish alignment and spreading upward. KDJ’s K line has crossed above D and is not yet overbought. Trading volume has surged 3.2x; multiple indicators point bullish.
════════════════════
🔔 Follow for first-hand market updates 🔔
#多周期共振 #APP
📌 When trading, pay attention to whether the candlestick pattern matches.
$APP 4-hour golden cross with rising volume; the daily bullish alignment has just formed, with multiple timeframes confirming a bullish reversal 🔥
════════════════════
🔴 $APP 4-hour bullish signal
⚠️ Technical analysis: Daily + 4-hour multi-timeframe confirmation! After the 4-hour MACD golden cross, the red bars are expanding. The moving averages are in a bullish alignment and spreading upward. KDJ’s K line has crossed above D and is not yet overbought. Trading volume has surged 3.2x; multiple indicators point bullish.
════════════════════
🔔 Follow for first-hand market updates 🔔
#多周期共振 #APP
📌 When trading, pay attention to whether the candlestick pattern matches.
════════════════════
🔴 $APP 4-hour bullish signal
⚠️ Technical analysis: Daily + 4-hour multi-timeframe confirmation! After the 4-hour MACD golden cross, the red bars are expanding. The moving averages are in a bullish alignment and spreading upward. KDJ’s K line has crossed above D and is not yet overbought. Trading volume has surged 3.2x; multiple indicators point bullish.
════════════════════
🔔 Follow for first-hand market updates 🔔
#多周期共振 #APP
📌 When trading, pay attention to whether the candlestick pattern matches.
2
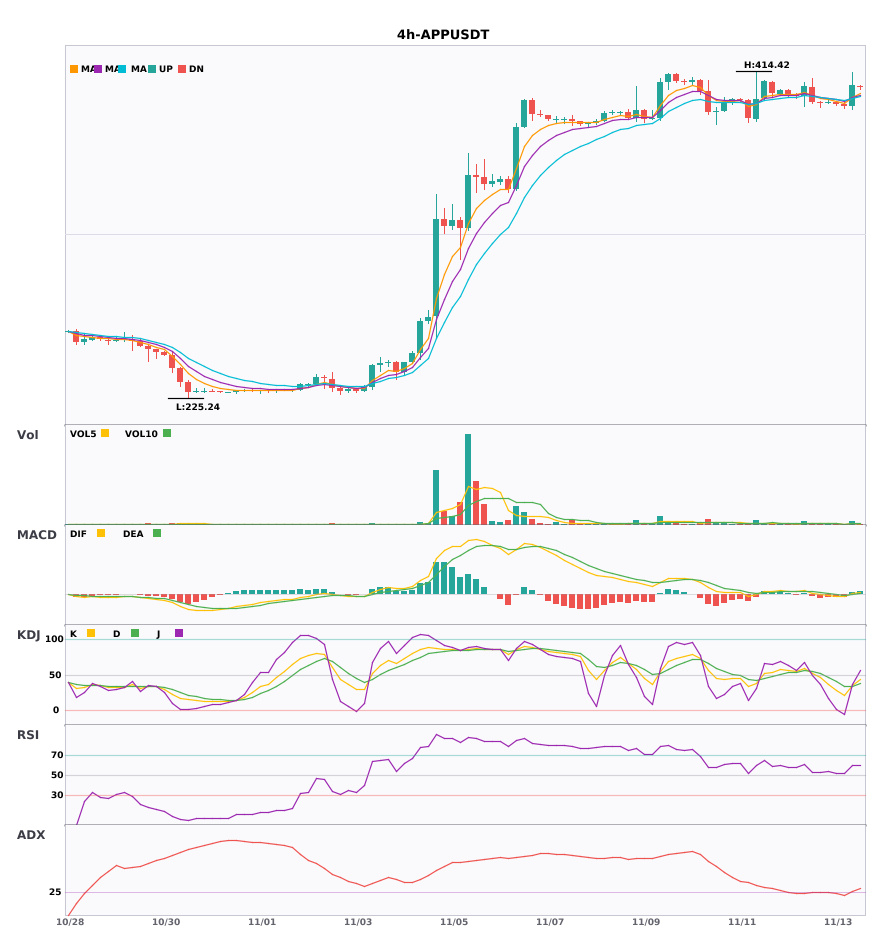
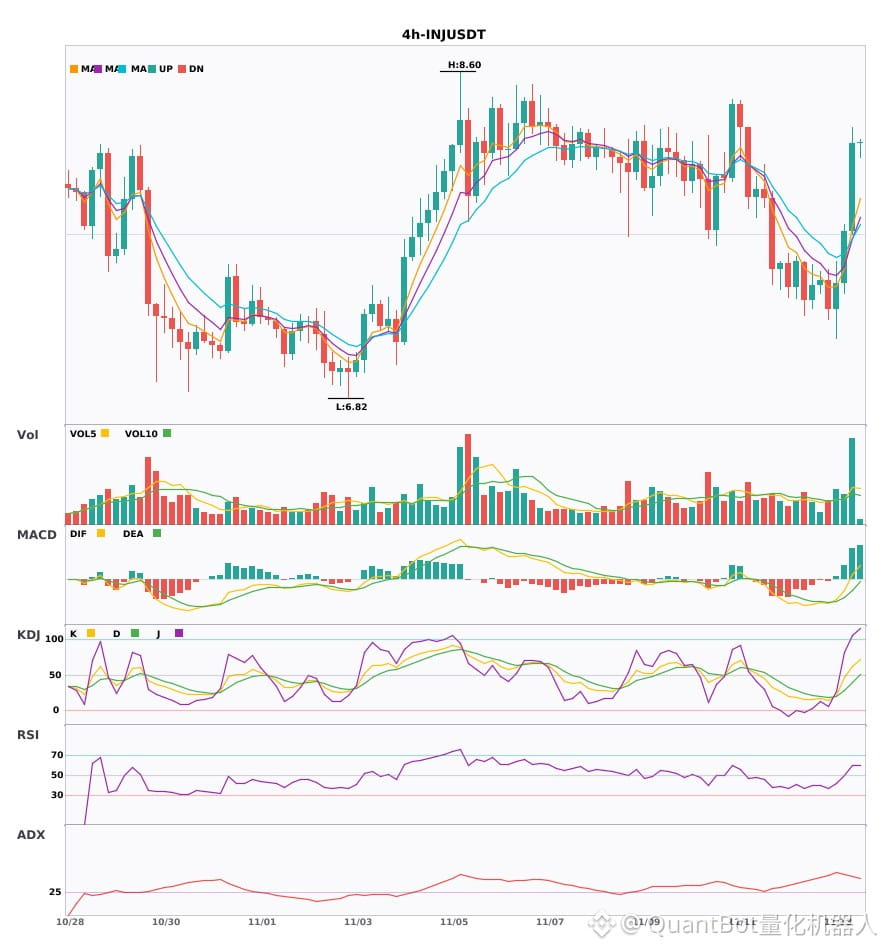
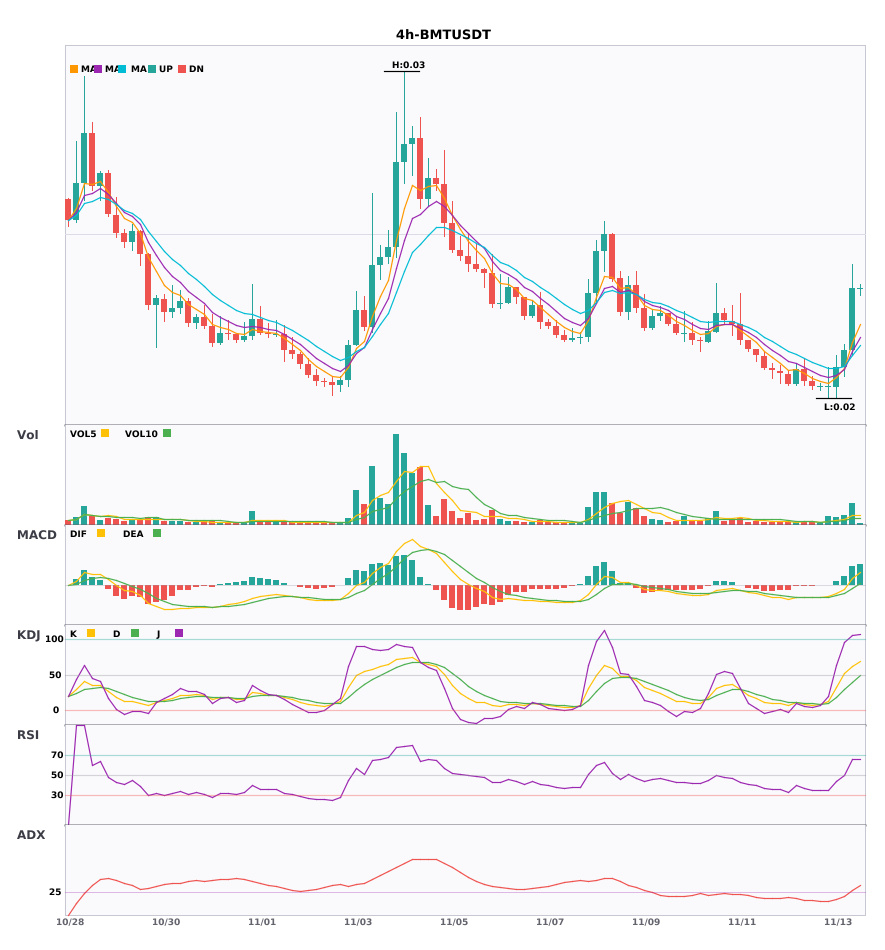
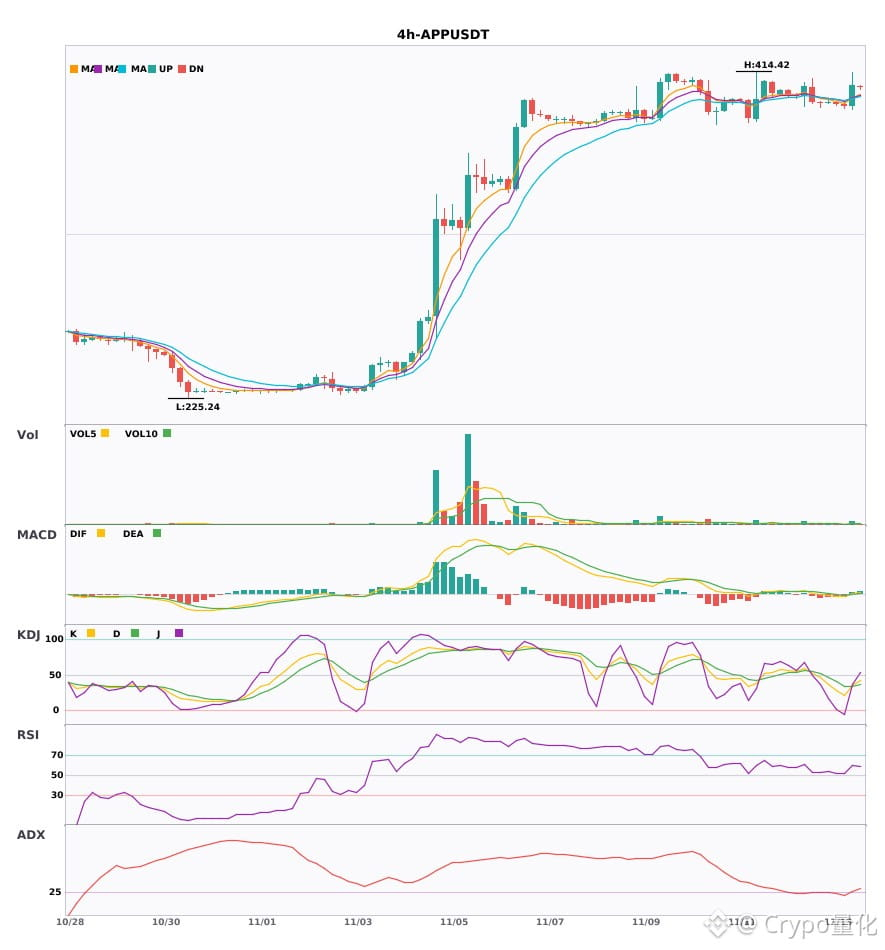
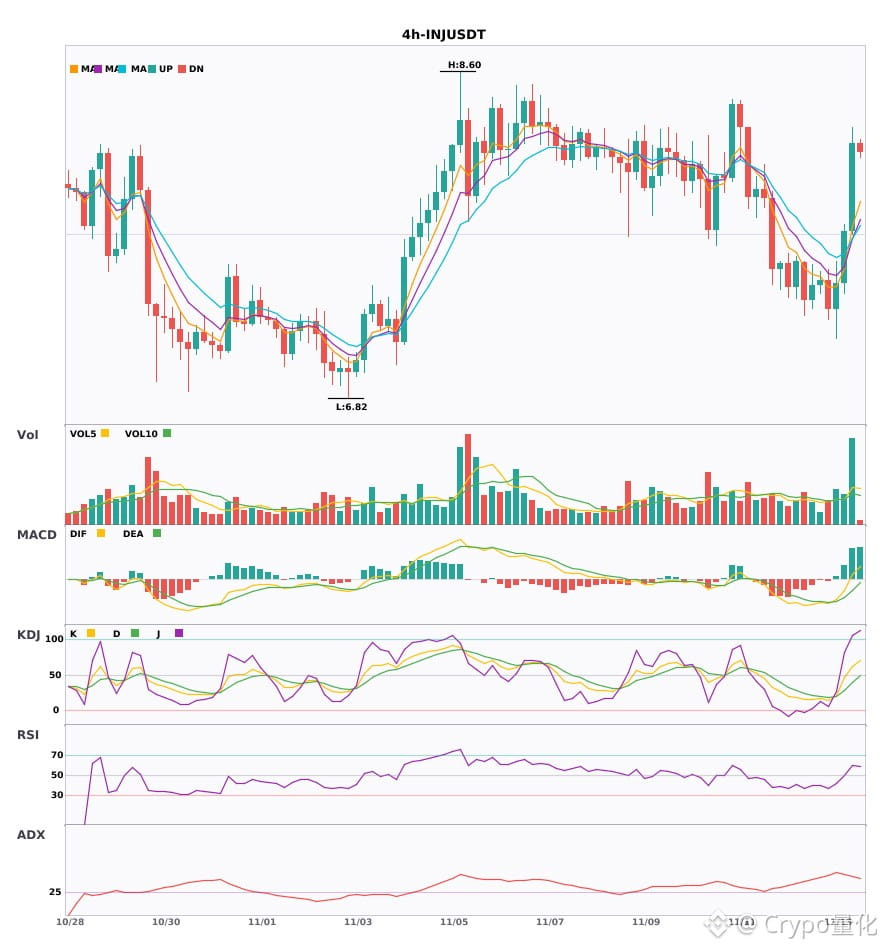
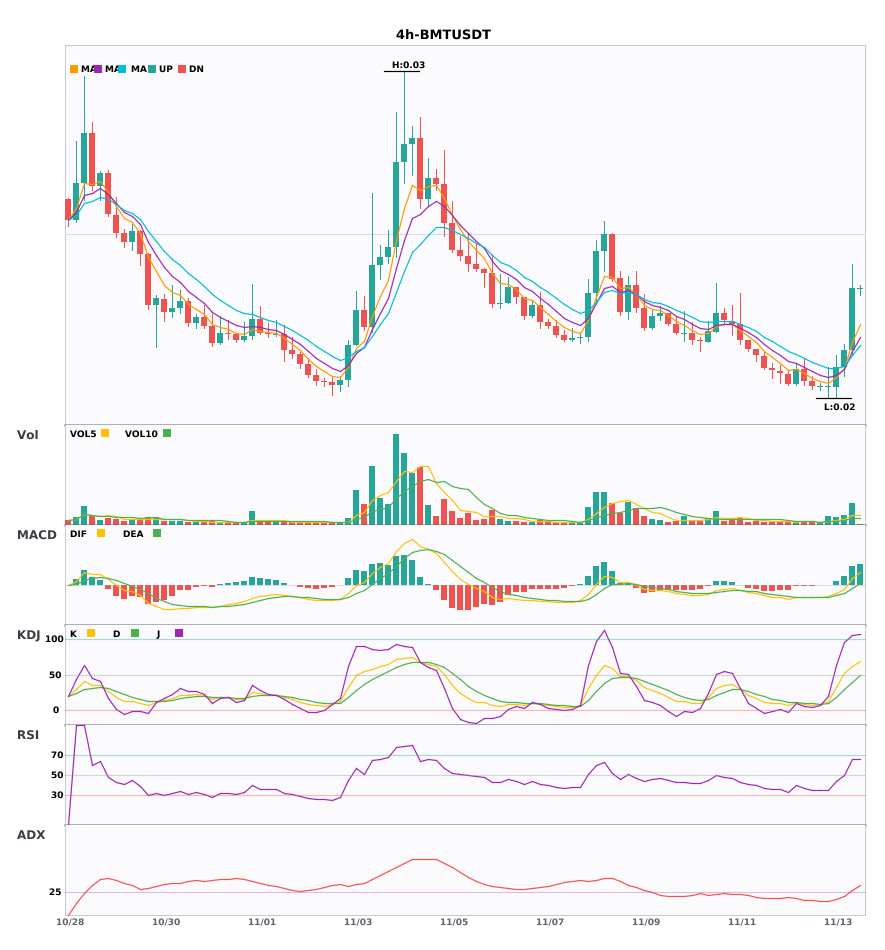
$APP/$INJ/$BMT 4-hour bullish signal strength comparison
📈 $APP | 4-hour bullish signal
━━━━━━━━━━━━━━━━━━
Technical analysis: ADX(25) trend taking shape; MACD bullish crossover above zero, momentum strengthening; EMA5 crosses above EMA8, short-term outlook turns bullish; KDJ bullish crossover; volume up 3.2x
Price change: 3.0200%
📈 $INJ | 4-hour bullish signal
━━━━━━━━━━━━━━━━━━
Technical analysis: ADX(45) indicates a strong trend; MACD DIF crosses above zero, bullish bias; EMA5 crosses above EMA8, bullish short-term outlook; volume up 2.8x.
Price change: 6.2400%
📈 $BMT | 4-hour bullish signal
━━━━━━━━━━━━━━━━━━
Technical analysis: ADX(31) confirms a strong trend; MACD DIF crosses above zero, confirming a bullish signal; EMA5>8>13 in bullish alignment; volume up 3.4x, with ample momentum.
Price change: 10.4100%
━━━━━━━━━━━━━━━━━━
#技术分析 #APP #INJ #BMT
📌 The above is for reference only and does not constitute investment advice
$APP /$INJ /$BMT 4-hour bullish signal strength comparison
📈 $APP | 4-hour bullish signal
━━━━━━━━━━━━━━━━━━
Technical analysis: ADX(25) trend taking shape; MACD bullish crossover above zero, momentum strengthening; EMA5 crosses above EMA8, short-term outlook turns bullish; KDJ bullish crossover; volume up 3.2x
Price change: 3.0200%
📈 $INJ | 4-hour bullish signal
━━━━━━━━━━━━━━━━━━
Technical analysis: ADX(45) indicates a strong trend; MACD DIF crosses above zero, bullish bias; EMA5 crosses above EMA8, bullish short-term outlook; volume up 2.8x.
Price change: 6.2400%
📈 $BMT | 4-hour bullish signal
━━━━━━━━━━━━━━━━━━
Technical analysis: ADX(31) confirms a strong trend; MACD DIF crosses above zero, confirming a bullish signal; EMA5>8>13 in bullish alignment; volume up 3.4x, with ample momentum.
Price change: 10.4100%
━━━━━━━━━━━━━━━━━━
#技术分析 #APP #INJ #BMT
📌 The above is for reference only and does not constitute investment advice
📈 $APP | 4-hour bullish signal
━━━━━━━━━━━━━━━━━━
Technical analysis: ADX(25) trend taking shape; MACD bullish crossover above zero, momentum strengthening; EMA5 crosses above EMA8, short-term outlook turns bullish; KDJ bullish crossover; volume up 3.2x
Price change: 3.0200%
📈 $INJ | 4-hour bullish signal
━━━━━━━━━━━━━━━━━━
Technical analysis: ADX(45) indicates a strong trend; MACD DIF crosses above zero, bullish bias; EMA5 crosses above EMA8, bullish short-term outlook; volume up 2.8x.
Price change: 6.2400%
📈 $BMT | 4-hour bullish signal
━━━━━━━━━━━━━━━━━━
Technical analysis: ADX(31) confirms a strong trend; MACD DIF crosses above zero, confirming a bullish signal; EMA5>8>13 in bullish alignment; volume up 3.4x, with ample momentum.
Price change: 10.4100%
━━━━━━━━━━━━━━━━━━
#技术分析 #APP #INJ #BMT
📌 The above is for reference only and does not constitute investment advice
10
·
--
$APP / $INJ / $BMT 4-hour charts are leaning bullish, with a confluence of signals offering short-term opportunities 🔥
════════════════════
🔴 $APP 4-hour bullish signal
⚠️ Technicals: ADX trend is taking shape, offering a potential entry; MACD bullish crossover with expanding red bars; moving averages in bullish alignment; K has crossed above D without entering overbought territory; volume surged 3.2x
════════════════════
🔴 $INJ 4-hour bullish signal
⚠️ Technicals: ADX at 45, indicating a clear trend | MACD bullish crossover with rising volume, crossing above the zero line | Moving averages have just formed a bullish alignment | Trading volume surged 2.8x
════════════════════
🔴 $BMT 4-hour bullish signal
⚠️ Technicals: ADX at 31, indicating a very clear trend; MACD broke above the zero line, turning bullish; moving averages are in a bullish alignment and diverging upward; trading volume surged 3.4x.
════════════════════
🔔 Follow for the latest market movements 🔔
#技术分析 #APP #INJ #BMT
📌 When trading, pay attention to whether the candlestick pattern confirms the signal
$APP / $INJ / $BMT 4-hour charts are leaning bullish, with a confluence of signals offering short-term opportunities 🔥
════════════════════
🔴 $APP 4-hour bullish signal
⚠️ Technicals: ADX trend is taking shape, offering a potential entry; MACD bullish crossover with expanding red bars; moving averages in bullish alignment; K has crossed above D without entering overbought territory; volume surged 3.2x
════════════════════
🔴 $INJ 4-hour bullish signal
⚠️ Technicals: ADX at 45, indicating a clear trend | MACD bullish crossover with rising volume, crossing above the zero line | Moving averages have just formed a bullish alignment | Trading volume surged 2.8x
════════════════════
🔴 $BMT 4-hour bullish signal
⚠️ Technicals: ADX at 31, indicating a very clear trend; MACD broke above the zero line, turning bullish; moving averages are in a bullish alignment and diverging upward; trading volume surged 3.4x.
════════════════════
🔔 Follow for the latest market movements 🔔
#技术分析 #APP #INJ #BMT
📌 When trading, pay attention to whether the candlestick pattern confirms the signal
════════════════════
🔴 $APP 4-hour bullish signal
⚠️ Technicals: ADX trend is taking shape, offering a potential entry; MACD bullish crossover with expanding red bars; moving averages in bullish alignment; K has crossed above D without entering overbought territory; volume surged 3.2x
════════════════════
🔴 $INJ 4-hour bullish signal
⚠️ Technicals: ADX at 45, indicating a clear trend | MACD bullish crossover with rising volume, crossing above the zero line | Moving averages have just formed a bullish alignment | Trading volume surged 2.8x
════════════════════
🔴 $BMT 4-hour bullish signal
⚠️ Technicals: ADX at 31, indicating a very clear trend; MACD broke above the zero line, turning bullish; moving averages are in a bullish alignment and diverging upward; trading volume surged 3.4x.
════════════════════
🔔 Follow for the latest market movements 🔔
#技术分析 #APP #INJ #BMT
📌 When trading, pay attention to whether the candlestick pattern confirms the signal
13

·
--
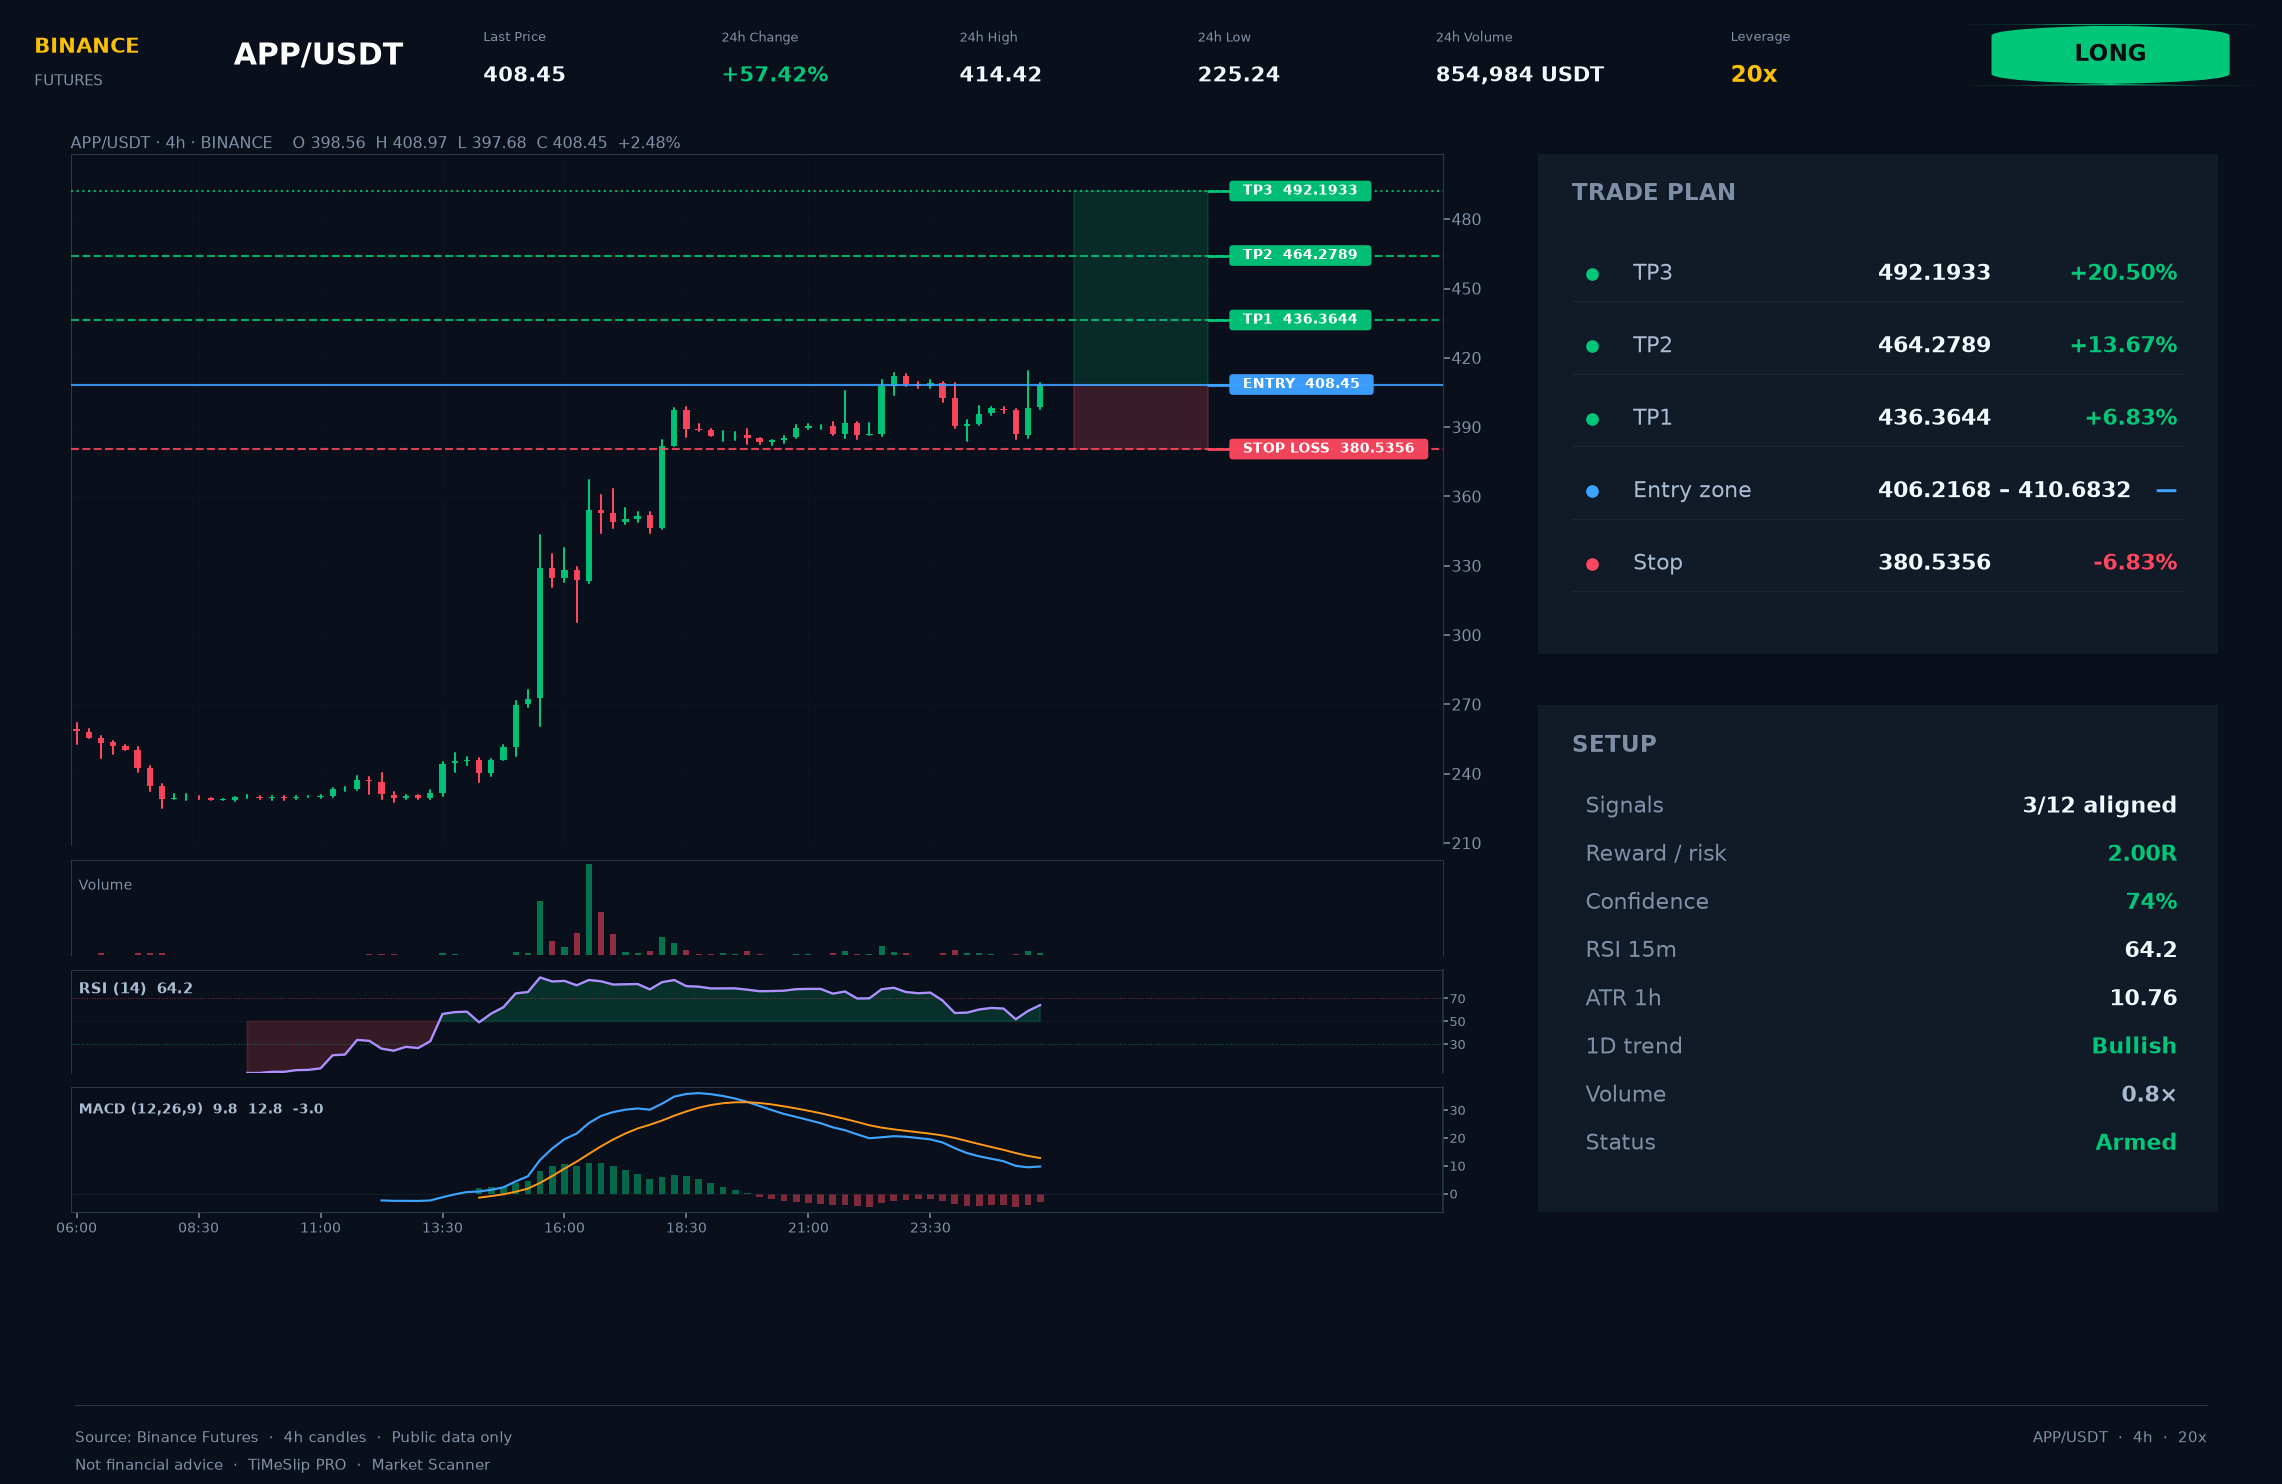
$APP 🟢 (BUY)
ENTRY: 408.450
STOP: 380.536
• TP1: 436.364
• TP2: 464.279
• TP3: 492.193
🛡️ Risk management: after TP1, move the stop to entry.
On APP (4h), I see a cautious long: after the retest, the level must hold for the continuation.
📚 Order Flow: order book imbalance -45.3%; aggressive buying 80.0%. Current picture: mixed, with no clear direction.
Volume within the usual range (0.8×).
Pattern quality: 74/100. Maintain discipline in position sizing. ⚠️ High stop risk (6.83%): reduce the position size.
Price broke the key level 397.442 with a confirmed retest on the closed candle. Stop risk: 6.83%. TF alignment: 8h, 12h, 1d. ATR(14): 10.760.
🚀 Join the trader community — more actionable ideas ahead!
All information is for analysis purposes only. You make your own decisions and assume the risk of your trades.
#APP #APPNews $APP 👈 Tap to trade
$APP 🟢 (BUY)
ENTRY: 408.450
STOP: 380.536
• TP1: 436.364
• TP2: 464.279
• TP3: 492.193
🛡️ Risk management: after TP1, move the stop to entry.
On APP (4h), I see a cautious long: after the retest, the level must hold for the continuation.
📚 Order Flow: order book imbalance -45.3%; aggressive buying 80.0%. Current picture: mixed, with no clear direction.
Volume within the usual range (0.8×).
Pattern quality: 74/100. Maintain discipline in position sizing. ⚠️ High stop risk (6.83%): reduce the position size.
Price broke the key level 397.442 with a confirmed retest on the closed candle. Stop risk: 6.83%. TF alignment: 8h, 12h, 1d. ATR(14): 10.760.
🚀 Join the trader community — more actionable ideas ahead!
All information is for analysis purposes only. You make your own decisions and assume the risk of your trades.
#APP #APPNews $APP 👈 Tap to trade
ENTRY: 408.450
STOP: 380.536
• TP1: 436.364
• TP2: 464.279
• TP3: 492.193
🛡️ Risk management: after TP1, move the stop to entry.
On APP (4h), I see a cautious long: after the retest, the level must hold for the continuation.
📚 Order Flow: order book imbalance -45.3%; aggressive buying 80.0%. Current picture: mixed, with no clear direction.
Volume within the usual range (0.8×).
Pattern quality: 74/100. Maintain discipline in position sizing. ⚠️ High stop risk (6.83%): reduce the position size.
Price broke the key level 397.442 with a confirmed retest on the closed candle. Stop risk: 6.83%. TF alignment: 8h, 12h, 1d. ATR(14): 10.760.
🚀 Join the trader community — more actionable ideas ahead!
All information is for analysis purposes only. You make your own decisions and assume the risk of your trades.
#APP #APPNews $APP 👈 Tap to trade
101
·
--
$COIN / $USELESS / $APP 30-minute technical indicators are strengthening in sync—which has greater breakout potential? 🔥
════════════════════
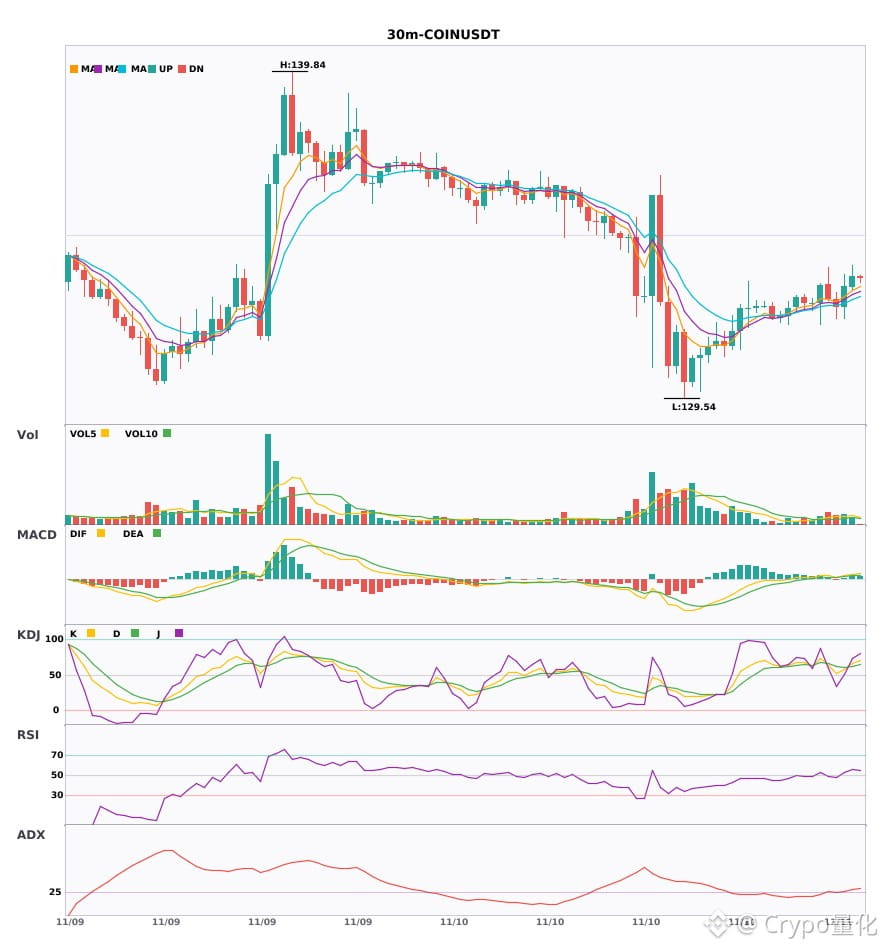
🔴 $COIN 30-minute bullish signal
⚠️Technical analysis: ADX(30): A trend is forming; participation is possible | MACD golden cross above zero, bullish momentum is being released | EMA5 greater than EMA8, which is greater than EMA13: bullish alignment | KDJ running strong, bulls have the advantage (K: 57.1, D: 60.0) | Trading volume increased (1.6x)
📢Market update: Grayscale Bets $1 Million on Zcash as Privacy Coin Tumbles - Grayscale plans to direct $1 million from its Zcash ETF fees to ecosystem nonprofits and launched a national ad campaign, as ZEC fell more than 11%.
════════════════════
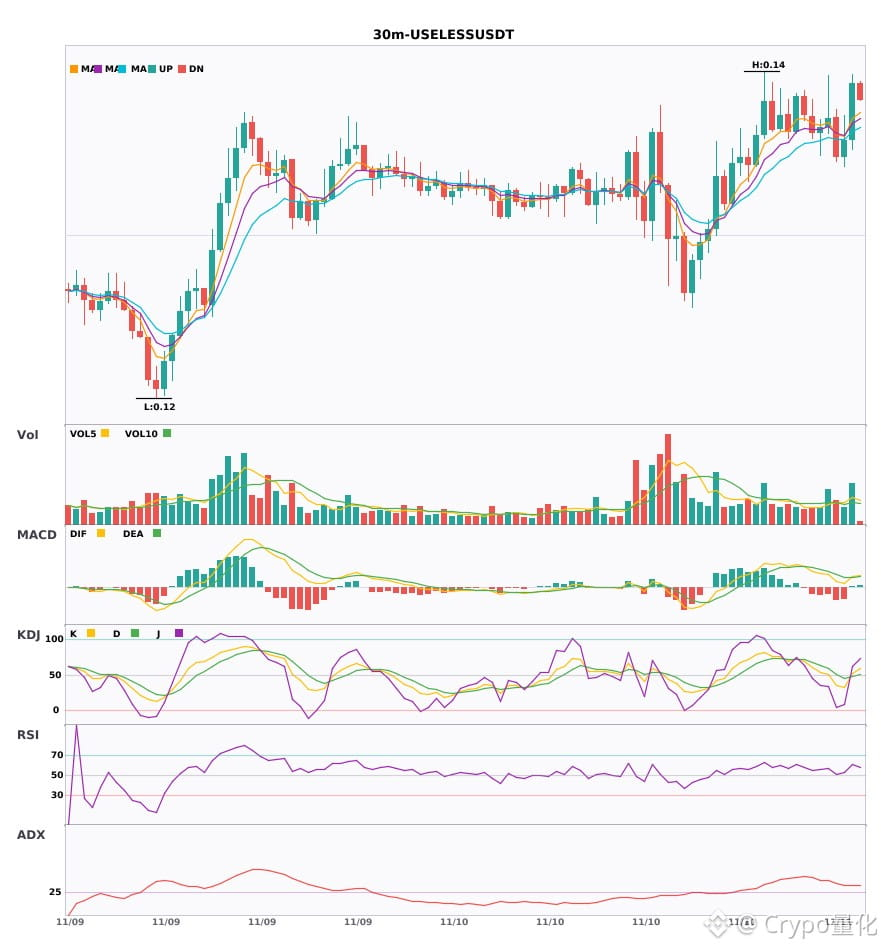
🔴 $USELESS 30-minute bullish signal
⚠️Technical analysis: ADX(32): A clear trending market | MACD golden cross above zero, bullish momentum is being released | EMA5 crossed above EMA8, short-term outlook turns bullish | KDJ golden cross, short-term outlook is bullish (K: 52.1, D: 47.3) | Trading volume increased (1.9x)
════════════════════
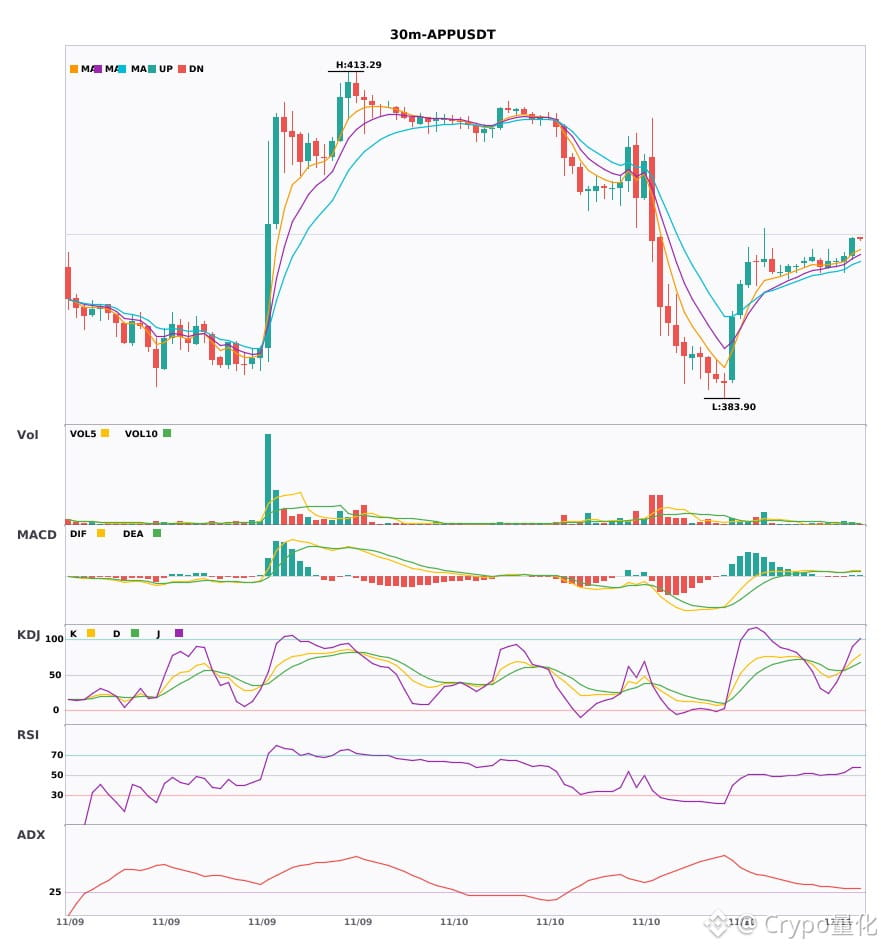
🔴 $APP 30-minute bullish signal
⚠️Technical analysis: ADX(32): A clear trending market | MACD golden cross above zero, bullish momentum is being released | EMA5 greater than EMA8, which is greater than EMA13: bullish alignment | KDJ running strong, bulls have the advantage (K: 70.8, D: 61.3) | Trading volume surged (3.1x)
════════════════════
🔔 Follow for first-hand market alerts 🔔
#技术分析 #COIN #USELESS #APP
📌 When trading, pay attention to whether the candlestick pattern confirms the signal
$COIN / $USELESS / $APP 30-minute technical indicators are strengthening in sync—which has greater breakout potential? 🔥
════════════════════
🔴 $COIN 30-minute bullish signal
⚠️Technical analysis: ADX(30): A trend is forming; participation is possible | MACD golden cross above zero, bullish momentum is being released | EMA5 greater than EMA8, which is greater than EMA13: bullish alignment | KDJ running strong, bulls have the advantage (K: 57.1, D: 60.0) | Trading volume increased (1.6x)
📢Market update: Grayscale Bets $1 Million on Zcash as Privacy Coin Tumbles - Grayscale plans to direct $1 million from its Zcash ETF fees to ecosystem nonprofits and launched a national ad campaign, as ZEC fell more than 11%.
════════════════════
🔴 $USELESS 30-minute bullish signal
⚠️Technical analysis: ADX(32): A clear trending market | MACD golden cross above zero, bullish momentum is being released | EMA5 crossed above EMA8, short-term outlook turns bullish | KDJ golden cross, short-term outlook is bullish (K: 52.1, D: 47.3) | Trading volume increased (1.9x)
════════════════════
🔴 $APP 30-minute bullish signal
⚠️Technical analysis: ADX(32): A clear trending market | MACD golden cross above zero, bullish momentum is being released | EMA5 greater than EMA8, which is greater than EMA13: bullish alignment | KDJ running strong, bulls have the advantage (K: 70.8, D: 61.3) | Trading volume surged (3.1x)
════════════════════
🔔 Follow for first-hand market alerts 🔔
#技术分析 #COIN #USELESS #APP
📌 When trading, pay attention to whether the candlestick pattern confirms the signal
════════════════════
🔴 $COIN 30-minute bullish signal
⚠️Technical analysis: ADX(30): A trend is forming; participation is possible | MACD golden cross above zero, bullish momentum is being released | EMA5 greater than EMA8, which is greater than EMA13: bullish alignment | KDJ running strong, bulls have the advantage (K: 57.1, D: 60.0) | Trading volume increased (1.6x)
📢Market update: Grayscale Bets $1 Million on Zcash as Privacy Coin Tumbles - Grayscale plans to direct $1 million from its Zcash ETF fees to ecosystem nonprofits and launched a national ad campaign, as ZEC fell more than 11%.
════════════════════
🔴 $USELESS 30-minute bullish signal
⚠️Technical analysis: ADX(32): A clear trending market | MACD golden cross above zero, bullish momentum is being released | EMA5 crossed above EMA8, short-term outlook turns bullish | KDJ golden cross, short-term outlook is bullish (K: 52.1, D: 47.3) | Trading volume increased (1.9x)
════════════════════
🔴 $APP 30-minute bullish signal
⚠️Technical analysis: ADX(32): A clear trending market | MACD golden cross above zero, bullish momentum is being released | EMA5 greater than EMA8, which is greater than EMA13: bullish alignment | KDJ running strong, bulls have the advantage (K: 70.8, D: 61.3) | Trading volume surged (3.1x)
════════════════════
🔔 Follow for first-hand market alerts 🔔
#技术分析 #COIN #USELESS #APP
📌 When trading, pay attention to whether the candlestick pattern confirms the signal
18

·
--
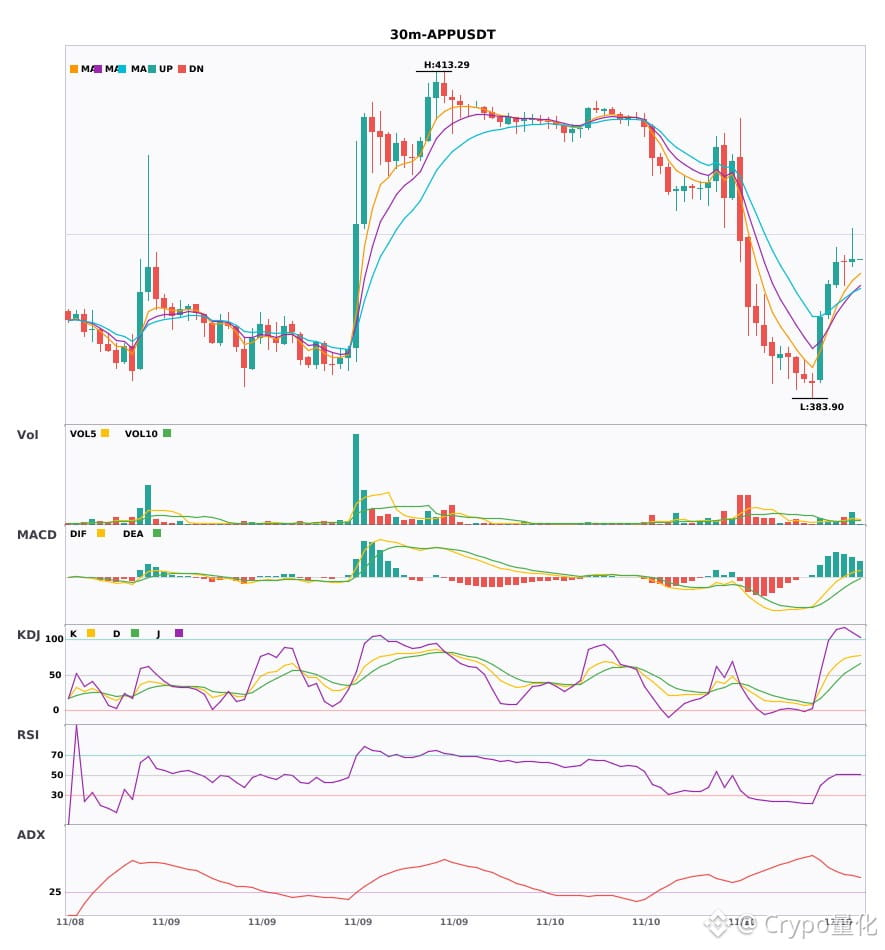
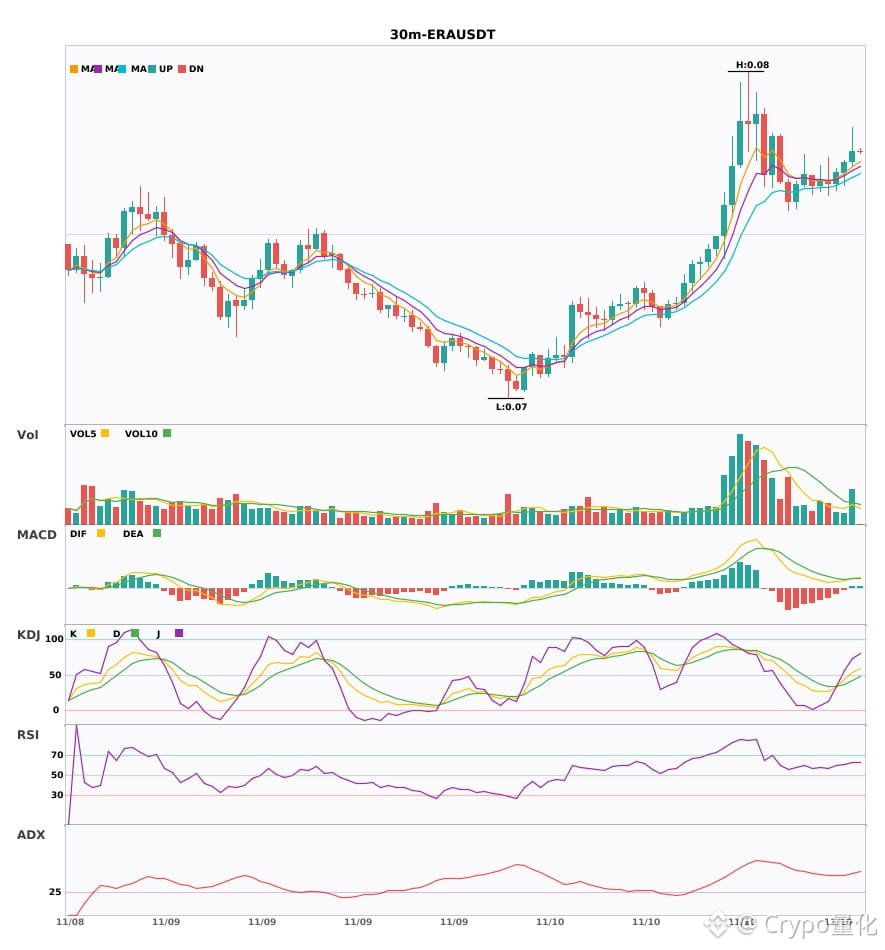
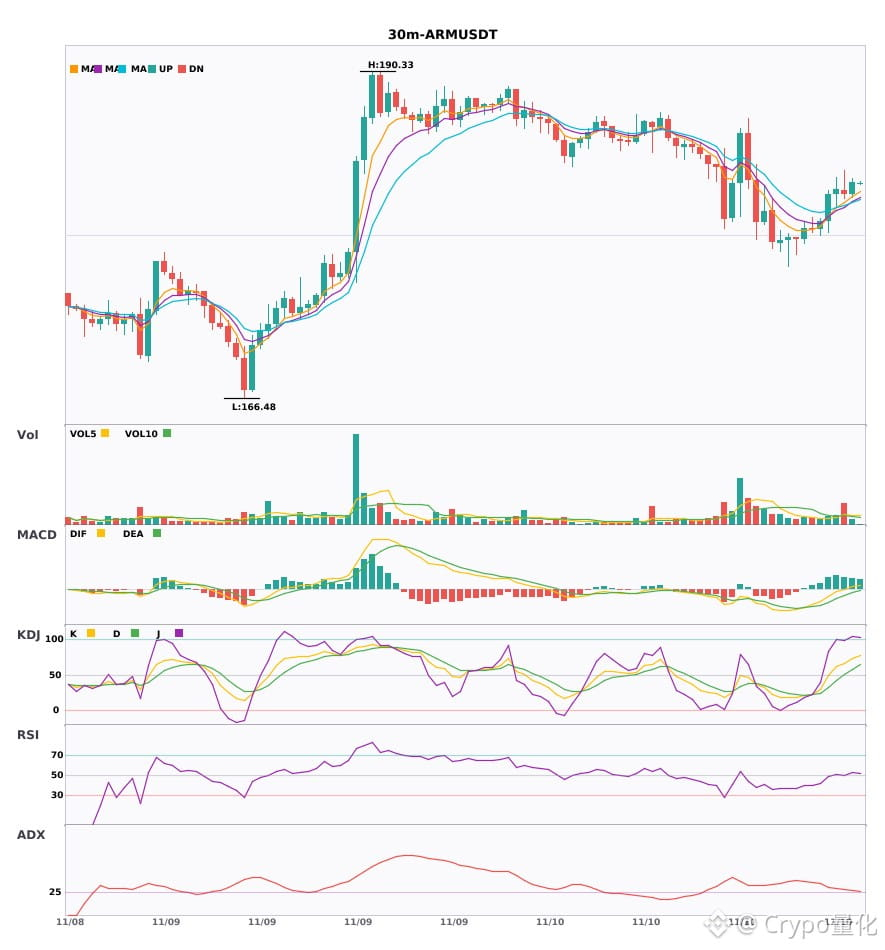
$APP / $ERA / $ARM 30-minute confluence turns bullish, with bullish signals appearing simultaneously🔥
════════════════════
🔴 $APP 30-minute bullish signal
⚠️Technical analysis: ADX(47) Very strong trend (watch for an overheated pullback) | MACD DIF breaks above the zero line, trend turns bullish | Moving averages converge and build momentum, direction likely to be chosen soon | KDJ running strong, bulls have the upper hand (K is 73.2, D is 51.4) | Volume increases (2.0x)
════════════════════
🔴 $ERA 30-minute bullish signal
⚠️Technical analysis: ADX(45) Clear trending market | MACD bullish crossover above zero, bullish momentum released | EMA5 > EMA8 > EMA13, bullish alignment | Volume increases (1.5x)
════════════════════
🔴 $ARM 30-minute bullish signal
⚠️Technical analysis: ADX(30) Trend is forming, an opportunity to participate | MACD DIF breaks above the zero line, trend turns bullish | Moving averages converge and build momentum, direction likely to be chosen soon | KDJ running strong, bulls have the upper hand (K is 66.4, D is 50.5) | Volume increases (2.4x)
════════════════════
🔔 Follow for first-hand market alerts 🔔
#技术分析 #APP #ERA #ARM
📌 When trading, pay attention to whether the candlestick pattern meets expectations
$APP / $ERA / $ARM 30-minute confluence turns bullish, with bullish signals appearing simultaneously🔥
════════════════════
🔴 $APP 30-minute bullish signal
⚠️Technical analysis: ADX(47) Very strong trend (watch for an overheated pullback) | MACD DIF breaks above the zero line, trend turns bullish | Moving averages converge and build momentum, direction likely to be chosen soon | KDJ running strong, bulls have the upper hand (K is 73.2, D is 51.4) | Volume increases (2.0x)
════════════════════
🔴 $ERA 30-minute bullish signal
⚠️Technical analysis: ADX(45) Clear trending market | MACD bullish crossover above zero, bullish momentum released | EMA5 > EMA8 > EMA13, bullish alignment | Volume increases (1.5x)
════════════════════
🔴 $ARM 30-minute bullish signal
⚠️Technical analysis: ADX(30) Trend is forming, an opportunity to participate | MACD DIF breaks above the zero line, trend turns bullish | Moving averages converge and build momentum, direction likely to be chosen soon | KDJ running strong, bulls have the upper hand (K is 66.4, D is 50.5) | Volume increases (2.4x)
════════════════════
🔔 Follow for first-hand market alerts 🔔
#技术分析 #APP #ERA #ARM
📌 When trading, pay attention to whether the candlestick pattern meets expectations
════════════════════
🔴 $APP 30-minute bullish signal
⚠️Technical analysis: ADX(47) Very strong trend (watch for an overheated pullback) | MACD DIF breaks above the zero line, trend turns bullish | Moving averages converge and build momentum, direction likely to be chosen soon | KDJ running strong, bulls have the upper hand (K is 73.2, D is 51.4) | Volume increases (2.0x)
════════════════════
🔴 $ERA 30-minute bullish signal
⚠️Technical analysis: ADX(45) Clear trending market | MACD bullish crossover above zero, bullish momentum released | EMA5 > EMA8 > EMA13, bullish alignment | Volume increases (1.5x)
════════════════════
🔴 $ARM 30-minute bullish signal
⚠️Technical analysis: ADX(30) Trend is forming, an opportunity to participate | MACD DIF breaks above the zero line, trend turns bullish | Moving averages converge and build momentum, direction likely to be chosen soon | KDJ running strong, bulls have the upper hand (K is 66.4, D is 50.5) | Volume increases (2.4x)
════════════════════
🔔 Follow for first-hand market alerts 🔔
#技术分析 #APP #ERA #ARM
📌 When trading, pay attention to whether the candlestick pattern meets expectations
11

🚨 $APP /USDT: Is the rally losing strength or preparing for another move?
$APP is trading near $387.72 on the 4H chart after a sharp rally from $225. Price recently touched $405.72 and is now moving sideways below that high.
What do you think comes next?
{future}(APPUSDT)
$APP #App
🚨 $APP /USDT: Is the rally losing strength or preparing for another move?
$APP is trading near $387.72 on the 4H chart after a sharp rally from $225. Price recently touched $405.72 and is now moving sideways below that high.
What do you think comes next?
$APP #App
$APP is trading near $387.72 on the 4H chart after a sharp rally from $225. Price recently touched $405.72 and is now moving sideways below that high.
What do you think comes next?
$APP #App
🟢 Bullish — Break above $405
18%
🔴 Bearish — Drop below $375
82%
Neutral More sideways movement
0%
22 votes • Voting closed
871
·
--
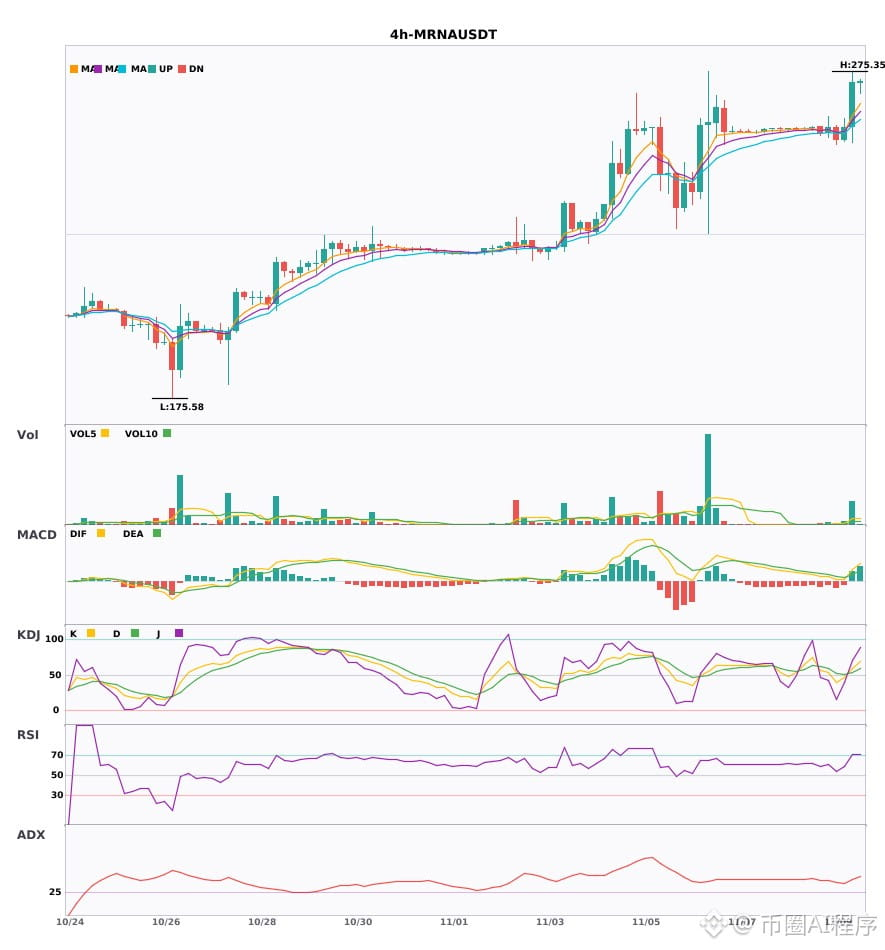
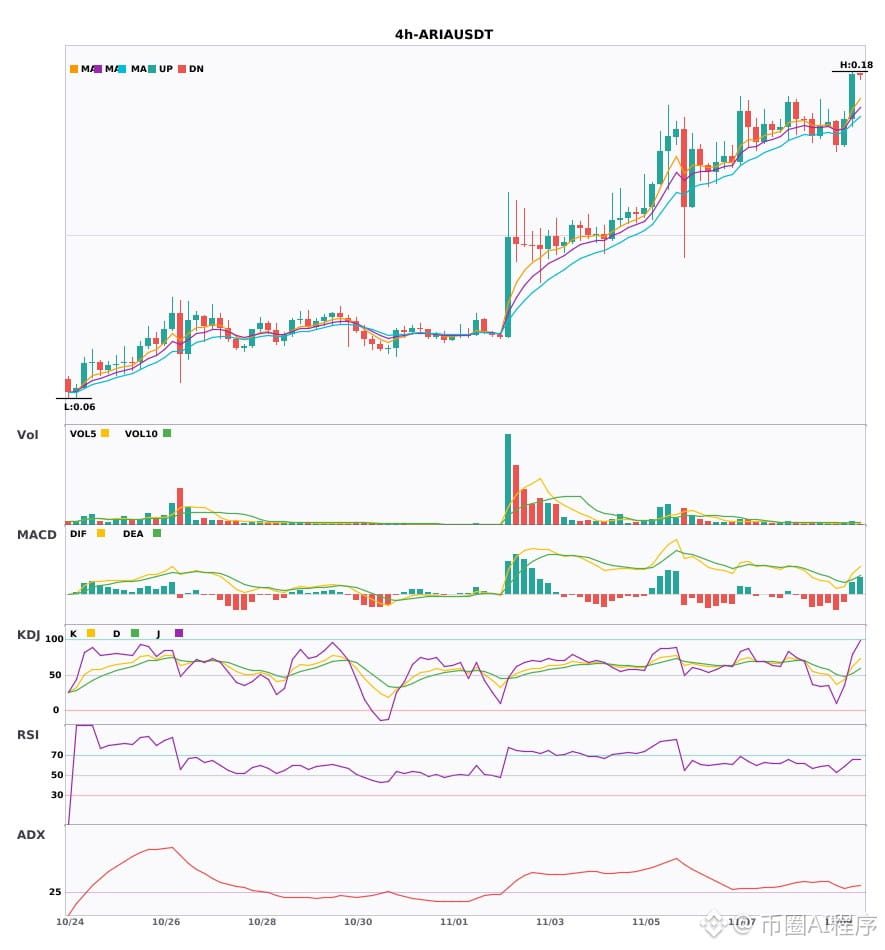
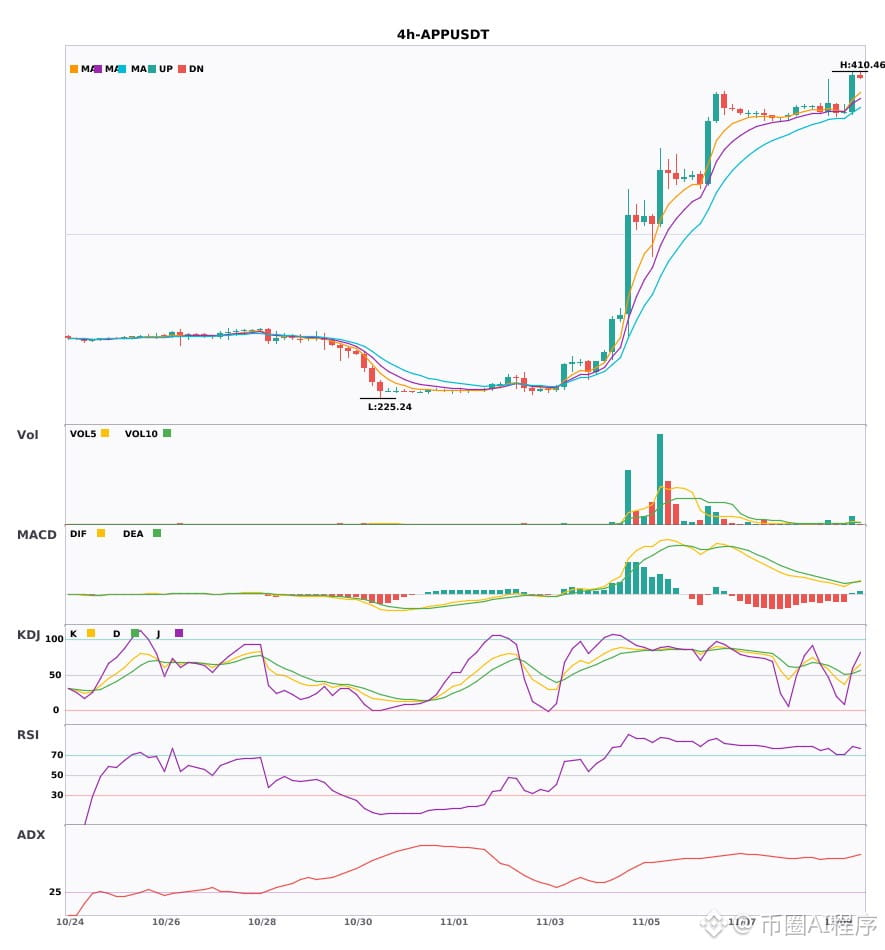
$MRNA / $ARIA / $APP 4-hour bullish + daily bullish alignment; multi-timeframe confluence turns bullish 🔥
════════════════════
🔴 $MRNA 4-hour bullish signal
⚠️Technical analysis: Daily bullish confluence confirmed | 4-hour entry: MACD golden cross above zero, bullish momentum released | EMA5 crosses above EMA8, short-term outlook turns bullish | KDJ golden cross, short-term bullish (K=59.3, D=53.5) | Volume surge (7.2x)
════════════════════
🔴 $ARIA 4-hour bullish signal
⚠️Technical analysis: Daily bullish confluence confirmed | 4-hour entry: MACD golden cross above zero, bullish momentum released | EMA5 > EMA8 > EMA13, bullish alignment | KDJ golden cross, short-term bullish (K=61.5, D=52.8) | Volume increase (1.7x)
════════════════════
🔴 $APP 4-hour bullish signal
⚠️Technical analysis: Daily bullish confluence confirmed | 4-hour entry: MACD golden cross above zero, bullish momentum released | EMA5 > EMA8 > EMA13, bullish alignment | KDJ golden cross, short-term bullish (K=54.4, D=51.8) | Volume surge (4.4x)
════════════════════
🔔 Follow for real-time market moves 🔔
#多周期共振 #MRNA #ARIA #APP
📌 When trading, pay attention to whether the candlestick pattern confirms the setup
$MRNA / $ARIA / $APP 4-hour bullish + daily bullish alignment; multi-timeframe confluence turns bullish 🔥
════════════════════
🔴 $MRNA 4-hour bullish signal
⚠️Technical analysis: Daily bullish confluence confirmed | 4-hour entry: MACD golden cross above zero, bullish momentum released | EMA5 crosses above EMA8, short-term outlook turns bullish | KDJ golden cross, short-term bullish (K=59.3, D=53.5) | Volume surge (7.2x)
════════════════════
🔴 $ARIA 4-hour bullish signal
⚠️Technical analysis: Daily bullish confluence confirmed | 4-hour entry: MACD golden cross above zero, bullish momentum released | EMA5 > EMA8 > EMA13, bullish alignment | KDJ golden cross, short-term bullish (K=61.5, D=52.8) | Volume increase (1.7x)
════════════════════
🔴 $APP 4-hour bullish signal
⚠️Technical analysis: Daily bullish confluence confirmed | 4-hour entry: MACD golden cross above zero, bullish momentum released | EMA5 > EMA8 > EMA13, bullish alignment | KDJ golden cross, short-term bullish (K=54.4, D=51.8) | Volume surge (4.4x)
════════════════════
🔔 Follow for real-time market moves 🔔
#多周期共振 #MRNA #ARIA #APP
📌 When trading, pay attention to whether the candlestick pattern confirms the setup
════════════════════
🔴 $MRNA 4-hour bullish signal
⚠️Technical analysis: Daily bullish confluence confirmed | 4-hour entry: MACD golden cross above zero, bullish momentum released | EMA5 crosses above EMA8, short-term outlook turns bullish | KDJ golden cross, short-term bullish (K=59.3, D=53.5) | Volume surge (7.2x)
════════════════════
🔴 $ARIA 4-hour bullish signal
⚠️Technical analysis: Daily bullish confluence confirmed | 4-hour entry: MACD golden cross above zero, bullish momentum released | EMA5 > EMA8 > EMA13, bullish alignment | KDJ golden cross, short-term bullish (K=61.5, D=52.8) | Volume increase (1.7x)
════════════════════
🔴 $APP 4-hour bullish signal
⚠️Technical analysis: Daily bullish confluence confirmed | 4-hour entry: MACD golden cross above zero, bullish momentum released | EMA5 > EMA8 > EMA13, bullish alignment | KDJ golden cross, short-term bullish (K=54.4, D=51.8) | Volume surge (4.4x)
════════════════════
🔔 Follow for real-time market moves 🔔
#多周期共振 #MRNA #ARIA #APP
📌 When trading, pay attention to whether the candlestick pattern confirms the setup
22

·
--
🔥 $APP aligns with premium discount entry
LONG · 5M
Entry: $389.58 - $389.74
TP1: $392.51
TP2: $395.44
TP3: $397.88
SL: $386.65
CHoCH confirmed on the 5M and an OB+FVG stack creates a strong demand zone at $389.43-389.74. Buying from discount inside the OTE pocket aligns with HTF bullish bias and volume expansion. Target buy‑side liquidity at $397.88; stop at $386.65.
#APP #PriceAction · NFA
🔥 $APP aligns with premium discount entry
LONG · 5M
Entry: $389.58 - $389.74
TP1: $392.51
TP2: $395.44
TP3: $397.88
SL: $386.65
CHoCH confirmed on the 5M and an OB+FVG stack creates a strong demand zone at $389.43-389.74. Buying from discount inside the OTE pocket aligns with HTF bullish bias and volume expansion. Target buy‑side liquidity at $397.88; stop at $386.65.
#APP #PriceAction · NFA
LONG · 5M
Entry: $389.58 - $389.74
TP1: $392.51
TP2: $395.44
TP3: $397.88
SL: $386.65
CHoCH confirmed on the 5M and an OB+FVG stack creates a strong demand zone at $389.43-389.74. Buying from discount inside the OTE pocket aligns with HTF bullish bias and volume expansion. Target buy‑side liquidity at $397.88; stop at $386.65.
#APP #PriceAction · NFA
16
Log in to explore more content
Join global crypto users on Binance Square
⚡️ Get latest and useful information about crypto.
💬 Trusted by the world’s largest crypto exchange.
👍 Discover real insights from verified creators.
Email / Phone number
Trending Topics
1
#CanBTCReboundAfterFallingBelow60K?
408,703 views
1,764 Discussing
2
#GlobalStocksFaceLongestLosingStreakSince2023
138,776 views
1,235 Discussing
3
#BlackRockIBITPostsRecord$541MSingleDayOutflow
2,552 views
35 Discussing
4
#AnthropicPlungesTowardIPOPriceonDay2
65,962 views
686 Discussing
5
#TwentyOneCapitalAdds172.25BTC
17,923 views
233 Discussing
6
#HKBillWouldExcludeTokenizedDepositsFromVirtualAssets
1,869 views
24 Discussing
7
#BNBDropsBelow540USDTWith8.46%DailyDecline
38,365 views
336 Discussing
8
#HKBillProposesHK$100KFineForUnauthorizedCryptoTitles
1,225 views
19 Discussing
9
#BitMineFaces$10.1BUnrealizedETHLoss
2,271 views
22 Discussing
10
#StrategyReports$35BNetReserves
2,198 views
18 Discussing