
#analsis
analsis
440,386 views
385 Discussing
Hot
Latest

·
--
Bullish
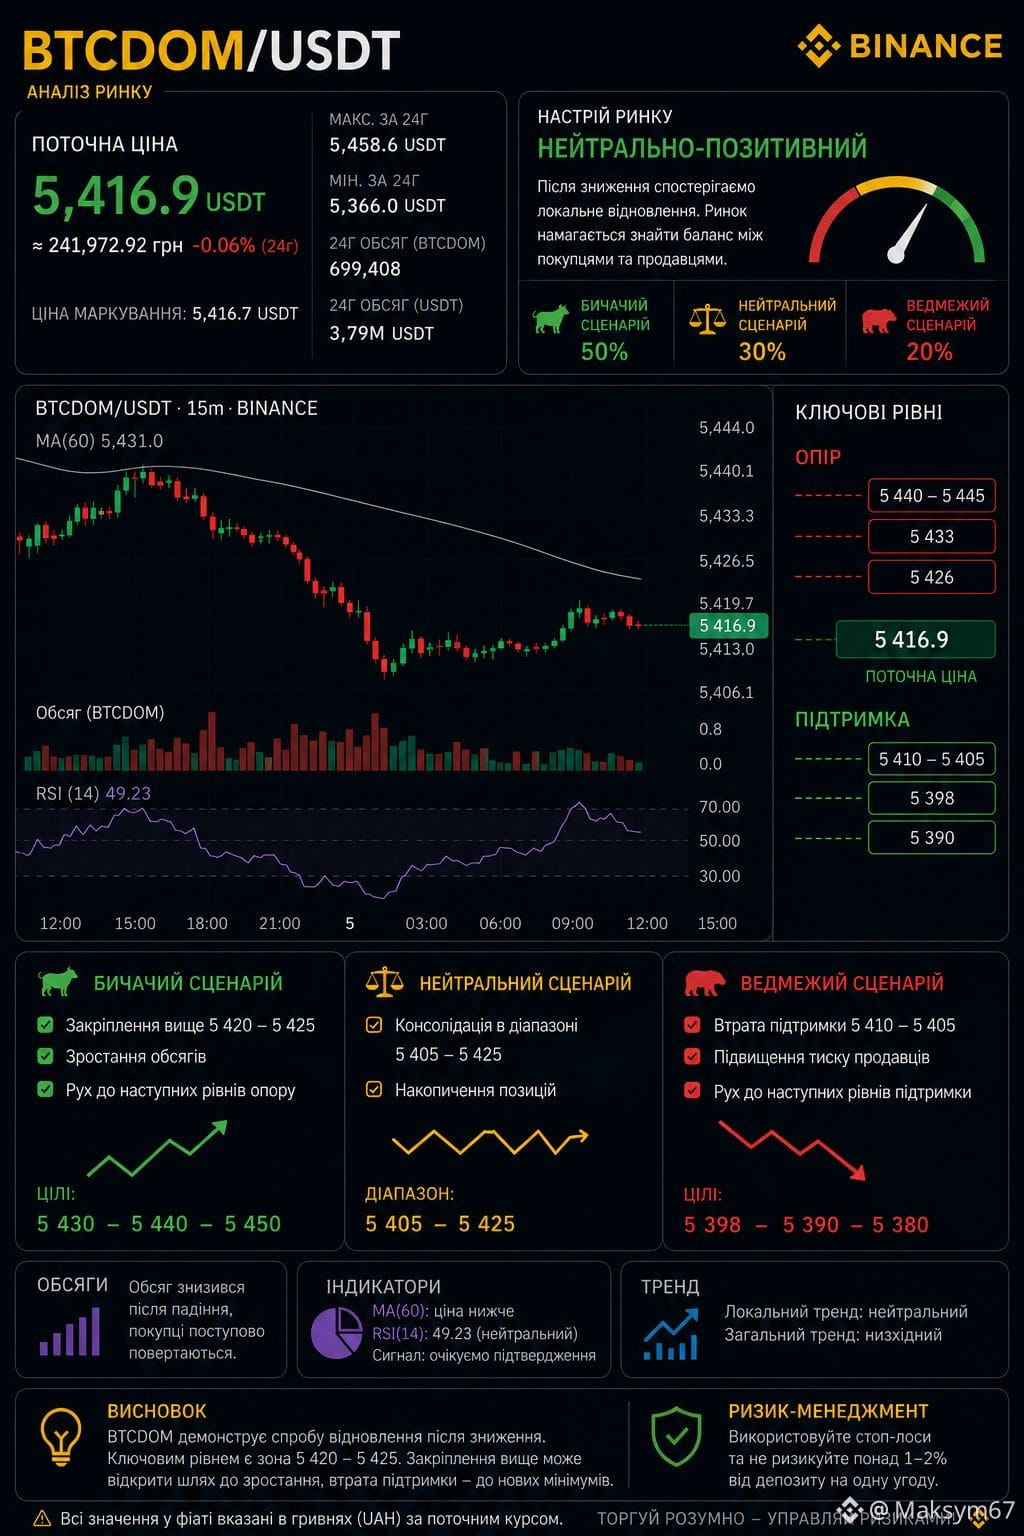
📊 $BTCDOM / USDT — short market analysis
🟡 Current situation: BTCDOM shows a local recovery after the decline, but it is still below the key moving average. This suggests buyers are trying to take the initiative, but there is not yet full confirmation of a reversal.
📈 Bullish scenario: if the price holds above 5420–5425, you can expect the move to continue toward 5430–5440. The appearance of additional volume may speed up the rise.
📉 Bearish scenario: if support 5410–5405 is lost, a retest of the local lows is possible. At the moment, the market looks like an accumulation phase before the next impulse.
🔥 Market sentiment: neutral-to-positive. It’s recommended to closely watch volumes and the price reaction near the key levels.
📌 This is not financial advice. Always do your own research and consider the risks. #Analsis
{future}(BTCDOMUSDT)
📊 $BTCDOM / USDT — short market analysis
🟡 Current situation: BTCDOM shows a local recovery after the decline, but it is still below the key moving average. This suggests buyers are trying to take the initiative, but there is not yet full confirmation of a reversal.
📈 Bullish scenario: if the price holds above 5420–5425, you can expect the move to continue toward 5430–5440. The appearance of additional volume may speed up the rise.
📉 Bearish scenario: if support 5410–5405 is lost, a retest of the local lows is possible. At the moment, the market looks like an accumulation phase before the next impulse.
🔥 Market sentiment: neutral-to-positive. It’s recommended to closely watch volumes and the price reaction near the key levels.
📌 This is not financial advice. Always do your own research and consider the risks. #Analsis
🟡 Current situation: BTCDOM shows a local recovery after the decline, but it is still below the key moving average. This suggests buyers are trying to take the initiative, but there is not yet full confirmation of a reversal.
📈 Bullish scenario: if the price holds above 5420–5425, you can expect the move to continue toward 5430–5440. The appearance of additional volume may speed up the rise.
📉 Bearish scenario: if support 5410–5405 is lost, a retest of the local lows is possible. At the moment, the market looks like an accumulation phase before the next impulse.
🔥 Market sentiment: neutral-to-positive. It’s recommended to closely watch volumes and the price reaction near the key levels.
📌 This is not financial advice. Always do your own research and consider the risks. #Analsis
1
142

·
--
Bearish
💹Market Snapshot📉
Ethereum ($ETH) is consolidating between $1,850 and $1,938, pressing directly against major resistance at the 100-day EMA ($1,937). A clean break opens the doors for a run toward $2,000+.
Key Resistance: $1,937 – $1,960
Immediate Support: $1,850
Major Support: $1,500
💡 Top Trading Strategies
1. Breakout Play (Momentum)
Entry: 4-hour candles close above $1,945 on high volume.
Target: $2,020 – $2,100
Stop Loss: $1,910
2. Pullback Strategy (Buy the Dip)
Entry: Rejection at resistance and a clean retest near $1,800 – $1,850.
Target: $1,930
Stop Loss: $1,770
3. Spot DCA (Low Risk)
Accumulate gradually between $1,800 and $1,880 to hedge short-term volatility while targeting medium-term upside
.
⚠️ Risk Warning: Practice strict risk management and keep stop-losses tight.
💬 Are you longing the breakout or waiting for a dip? Drop your thoughts below! 👇
#ETH #tradingtechnique #Analsis
💹Market Snapshot📉
Ethereum ($ETH) is consolidating between $1,850 and $1,938, pressing directly against major resistance at the 100-day EMA ($1,937). A clean break opens the doors for a run toward $2,000+.
Key Resistance: $1,937 – $1,960
Immediate Support: $1,850
Major Support: $1,500
💡 Top Trading Strategies
1. Breakout Play (Momentum)
Entry: 4-hour candles close above $1,945 on high volume.
Target: $2,020 – $2,100
Stop Loss: $1,910
2. Pullback Strategy (Buy the Dip)
Entry: Rejection at resistance and a clean retest near $1,800 – $1,850.
Target: $1,930
Stop Loss: $1,770
3. Spot DCA (Low Risk)
Accumulate gradually between $1,800 and $1,880 to hedge short-term volatility while targeting medium-term upside
.
⚠️ Risk Warning: Practice strict risk management and keep stop-losses tight.
💬 Are you longing the breakout or waiting for a dip? Drop your thoughts below! 👇
#ETH #tradingtechnique #Analsis
Ethereum ($ETH) is consolidating between $1,850 and $1,938, pressing directly against major resistance at the 100-day EMA ($1,937). A clean break opens the doors for a run toward $2,000+.
Key Resistance: $1,937 – $1,960
Immediate Support: $1,850
Major Support: $1,500
💡 Top Trading Strategies
1. Breakout Play (Momentum)
Entry: 4-hour candles close above $1,945 on high volume.
Target: $2,020 – $2,100
Stop Loss: $1,910
2. Pullback Strategy (Buy the Dip)
Entry: Rejection at resistance and a clean retest near $1,800 – $1,850.
Target: $1,930
Stop Loss: $1,770
3. Spot DCA (Low Risk)
Accumulate gradually between $1,800 and $1,880 to hedge short-term volatility while targeting medium-term upside
.
⚠️ Risk Warning: Practice strict risk management and keep stop-losses tight.
💬 Are you longing the breakout or waiting for a dip? Drop your thoughts below! 👇
#ETH #tradingtechnique #Analsis
140

·
--
$XRP trade setup by 1h chart
Buy Target 1: 1.2076 (Near Bollinger lower band, potential bounce from oversold RSI)Buy Target 2: 1.1899 (Strong support at 99-period EMA)Sell Target 1: 1.2245 (Resistance at 7-period EMA)Sell Target 2: 1.2598 (Resistance at Bollinger upper band)
#xrp #Analsis #TradingSignals
{spot}(XRPUSDT)
$XRP trade setup by 1h chart
Buy Target 1: 1.2076 (Near Bollinger lower band, potential bounce from oversold RSI)Buy Target 2: 1.1899 (Strong support at 99-period EMA)Sell Target 1: 1.2245 (Resistance at 7-period EMA)Sell Target 2: 1.2598 (Resistance at Bollinger upper band)
#xrp #Analsis #TradingSignals
Buy Target 1: 1.2076 (Near Bollinger lower band, potential bounce from oversold RSI)Buy Target 2: 1.1899 (Strong support at 99-period EMA)Sell Target 1: 1.2245 (Resistance at 7-period EMA)Sell Target 2: 1.2598 (Resistance at Bollinger upper band)
#xrp #Analsis #TradingSignals
114

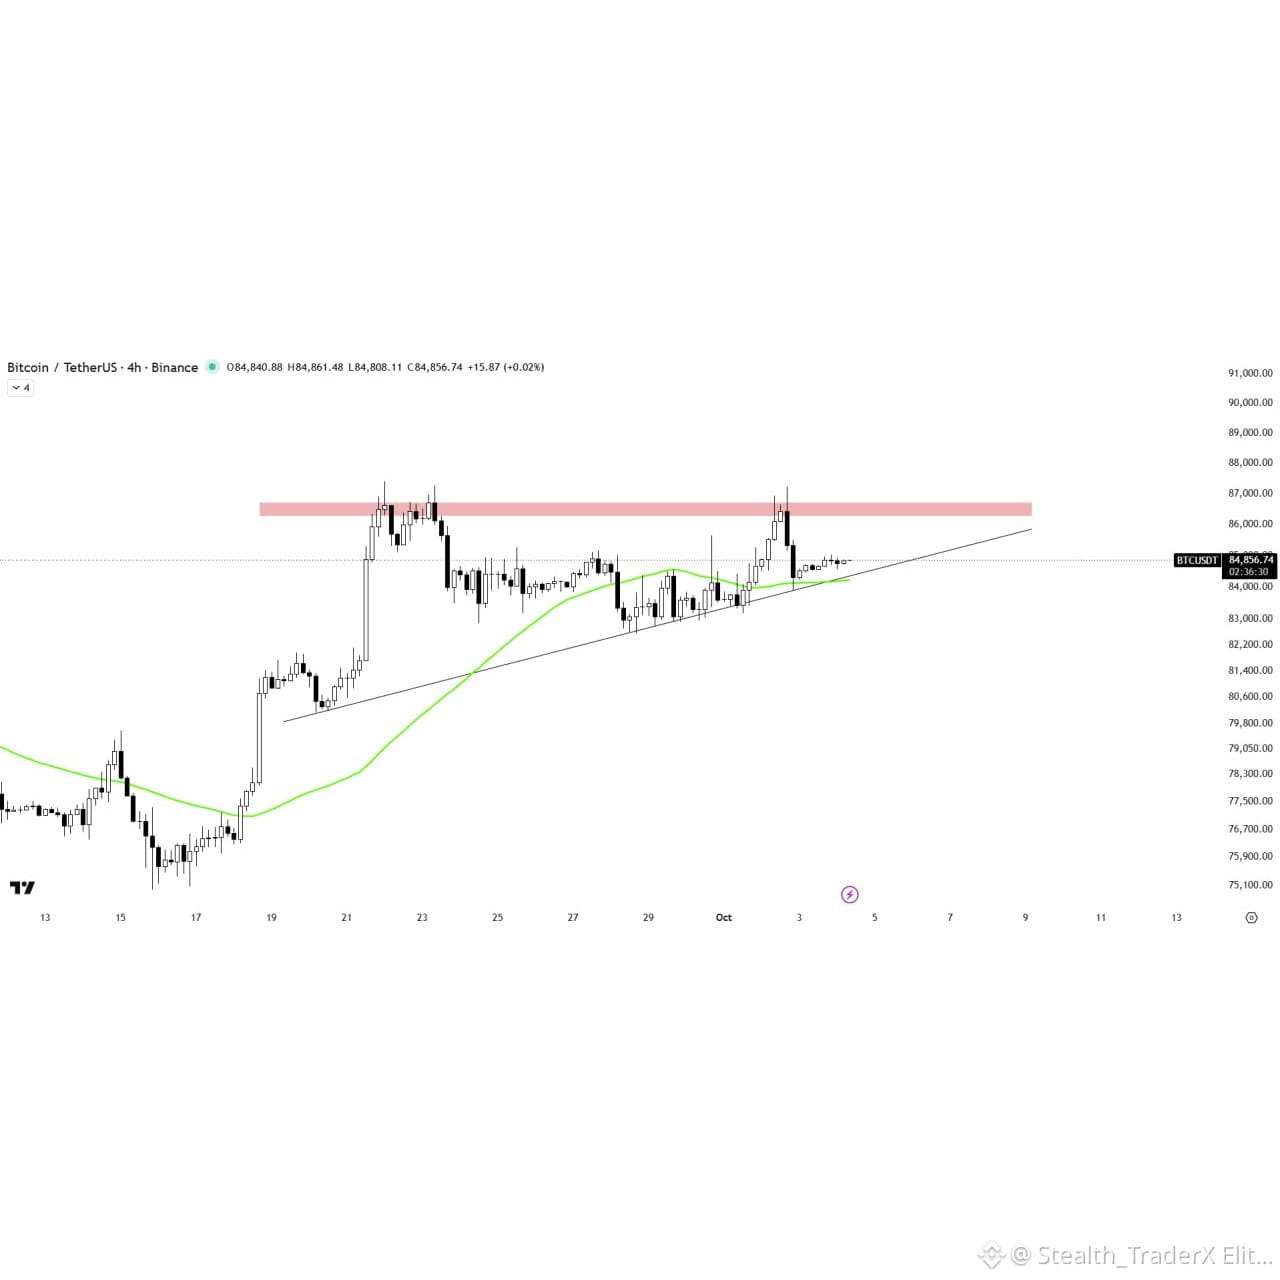
$BTC /USDT ANALYSIS
{future}(BTCUSDT)
Bitcoin is trading above the support trendline of the ascending triangle pattern, maintaining its current bullish structure.
The 50MA is acting as a key support level below the current price action, providing additional downside protection.
We need to wait for a solid breakout or breakdown to confirm the next directional move.
#Analsis #TradingSignals
$BTC /USDT ANALYSIS
Bitcoin is trading above the support trendline of the ascending triangle pattern, maintaining its current bullish structure.
The 50MA is acting as a key support level below the current price action, providing additional downside protection.
We need to wait for a solid breakout or breakdown to confirm the next directional move.
#Analsis #TradingSignals
Bitcoin is trading above the support trendline of the ascending triangle pattern, maintaining its current bullish structure.
The 50MA is acting as a key support level below the current price action, providing additional downside protection.
We need to wait for a solid breakout or breakdown to confirm the next directional move.
#Analsis #TradingSignals
1
115

·
--
Bullish
$SYN
Spot SYN Insights 2026-07-13 UTC
TLDR
1. SYN rallied 7.3% in 24h driven by institutional interest and cross-chain narratives, despite looming distribution risks.
Key Drivers
1. - **Institutional Interest (High)**: Renewed DeFi cross-chain focus and prominent investor backing of the Hypercall platform drove a 7.3% price rally.
- **Active Buying (High)**: A strong 1.2 buy-sell ratio with low retail crowding fueled upward momentum, supported by a 1.45M USDT volume spike.
- **Exchange Monitoring (Medium)**: Addition to a major exchange's monitoring list spurred volatility and concentrated trading activity.
Risk Assessment
1. - **Whale Distribution (High)**: Recent large outflows and a negative contract premium (-0.157%) suggest upward movement relies heavily on sustained spot buying.
- **Technical Exhaustion (Medium)**: RSI peaked at 81.6 before cooling to 61, indicating potential overbought conditions.
- **Sentiment Divergence (Low)**: Divided community outlook warns of a potential rebound trap if key support levels fail.
Install Binance app to catch the latest SYN insights at
#USDT #SYN/USDT #BinanceSquareTalks #Analsis
$SYN
Spot SYN Insights 2026-07-13 UTC
TLDR
1. SYN rallied 7.3% in 24h driven by institutional interest and cross-chain narratives, despite looming distribution risks.
Key Drivers
1. - **Institutional Interest (High)**: Renewed DeFi cross-chain focus and prominent investor backing of the Hypercall platform drove a 7.3% price rally.
- **Active Buying (High)**: A strong 1.2 buy-sell ratio with low retail crowding fueled upward momentum, supported by a 1.45M USDT volume spike.
- **Exchange Monitoring (Medium)**: Addition to a major exchange's monitoring list spurred volatility and concentrated trading activity.
Risk Assessment
1. - **Whale Distribution (High)**: Recent large outflows and a negative contract premium (-0.157%) suggest upward movement relies heavily on sustained spot buying.
- **Technical Exhaustion (Medium)**: RSI peaked at 81.6 before cooling to 61, indicating potential overbought conditions.
- **Sentiment Divergence (Low)**: Divided community outlook warns of a potential rebound trap if key support levels fail.
Install Binance app to catch the latest SYN insights at
#USDT #SYN/USDT #BinanceSquareTalks #Analsis
Spot SYN Insights 2026-07-13 UTC
TLDR
1. SYN rallied 7.3% in 24h driven by institutional interest and cross-chain narratives, despite looming distribution risks.
Key Drivers
1. - **Institutional Interest (High)**: Renewed DeFi cross-chain focus and prominent investor backing of the Hypercall platform drove a 7.3% price rally.
- **Active Buying (High)**: A strong 1.2 buy-sell ratio with low retail crowding fueled upward momentum, supported by a 1.45M USDT volume spike.
- **Exchange Monitoring (Medium)**: Addition to a major exchange's monitoring list spurred volatility and concentrated trading activity.
Risk Assessment
1. - **Whale Distribution (High)**: Recent large outflows and a negative contract premium (-0.157%) suggest upward movement relies heavily on sustained spot buying.
- **Technical Exhaustion (Medium)**: RSI peaked at 81.6 before cooling to 61, indicating potential overbought conditions.
- **Sentiment Divergence (Low)**: Divided community outlook warns of a potential rebound trap if key support levels fail.
Install Binance app to catch the latest SYN insights at
#USDT #SYN/USDT #BinanceSquareTalks #Analsis

1
193

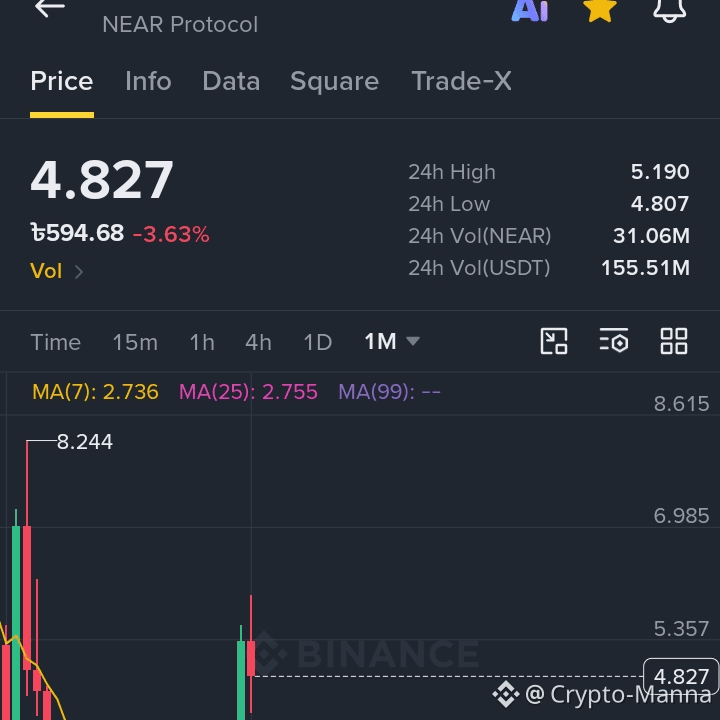
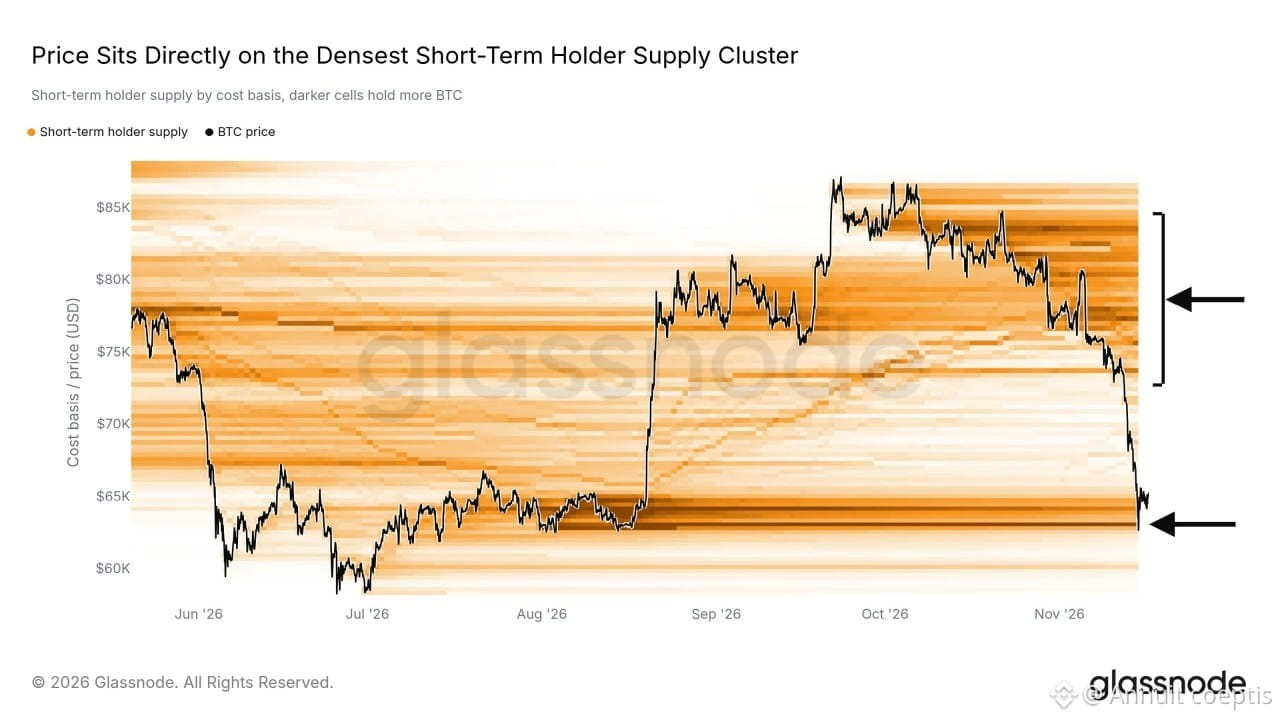
$NEAR Next 5 USDT UP or -3 USDT Down ? tell me your market analysis 🤷♂️🔥
#NEARToken #Analsis #Market_Update
$NEAR Next 5 USDT UP or -3 USDT Down ? tell me your market analysis 🤷♂️🔥
#NEARToken #Analsis #Market_Update
#NEARToken #Analsis #Market_Update
130


·
--
Bullish
$ASTER already showed it can move fast.
Since then it's been building a quiet base, and
the last few hours look better
It's at 0.5684 on the 1h now. My entry is
0.5240, so I'm not chasing up here. I'd rather it
dips back toward that area first and bounces.
The target is 0.6995 The stop is 0.4801, and yes, that's a wide stop, so keep your size small A
Pullback to 0.5240 and it holds, I like it. Under
0.4801, I'm out.
#asterix #Altcoins! #Analsis #TradingCommunity
$ASTER already showed it can move fast.
Since then it's been building a quiet base, and
the last few hours look better
It's at 0.5684 on the 1h now. My entry is
0.5240, so I'm not chasing up here. I'd rather it
dips back toward that area first and bounces.
The target is 0.6995 The stop is 0.4801, and yes, that's a wide stop, so keep your size small A
Pullback to 0.5240 and it holds, I like it. Under
0.4801, I'm out.
#asterix #Altcoins! #Analsis #TradingCommunity
Since then it's been building a quiet base, and
the last few hours look better
It's at 0.5684 on the 1h now. My entry is
0.5240, so I'm not chasing up here. I'd rather it
dips back toward that area first and bounces.
The target is 0.6995 The stop is 0.4801, and yes, that's a wide stop, so keep your size small A
Pullback to 0.5240 and it holds, I like it. Under
0.4801, I'm out.
#asterix #Altcoins! #Analsis #TradingCommunity
1
273

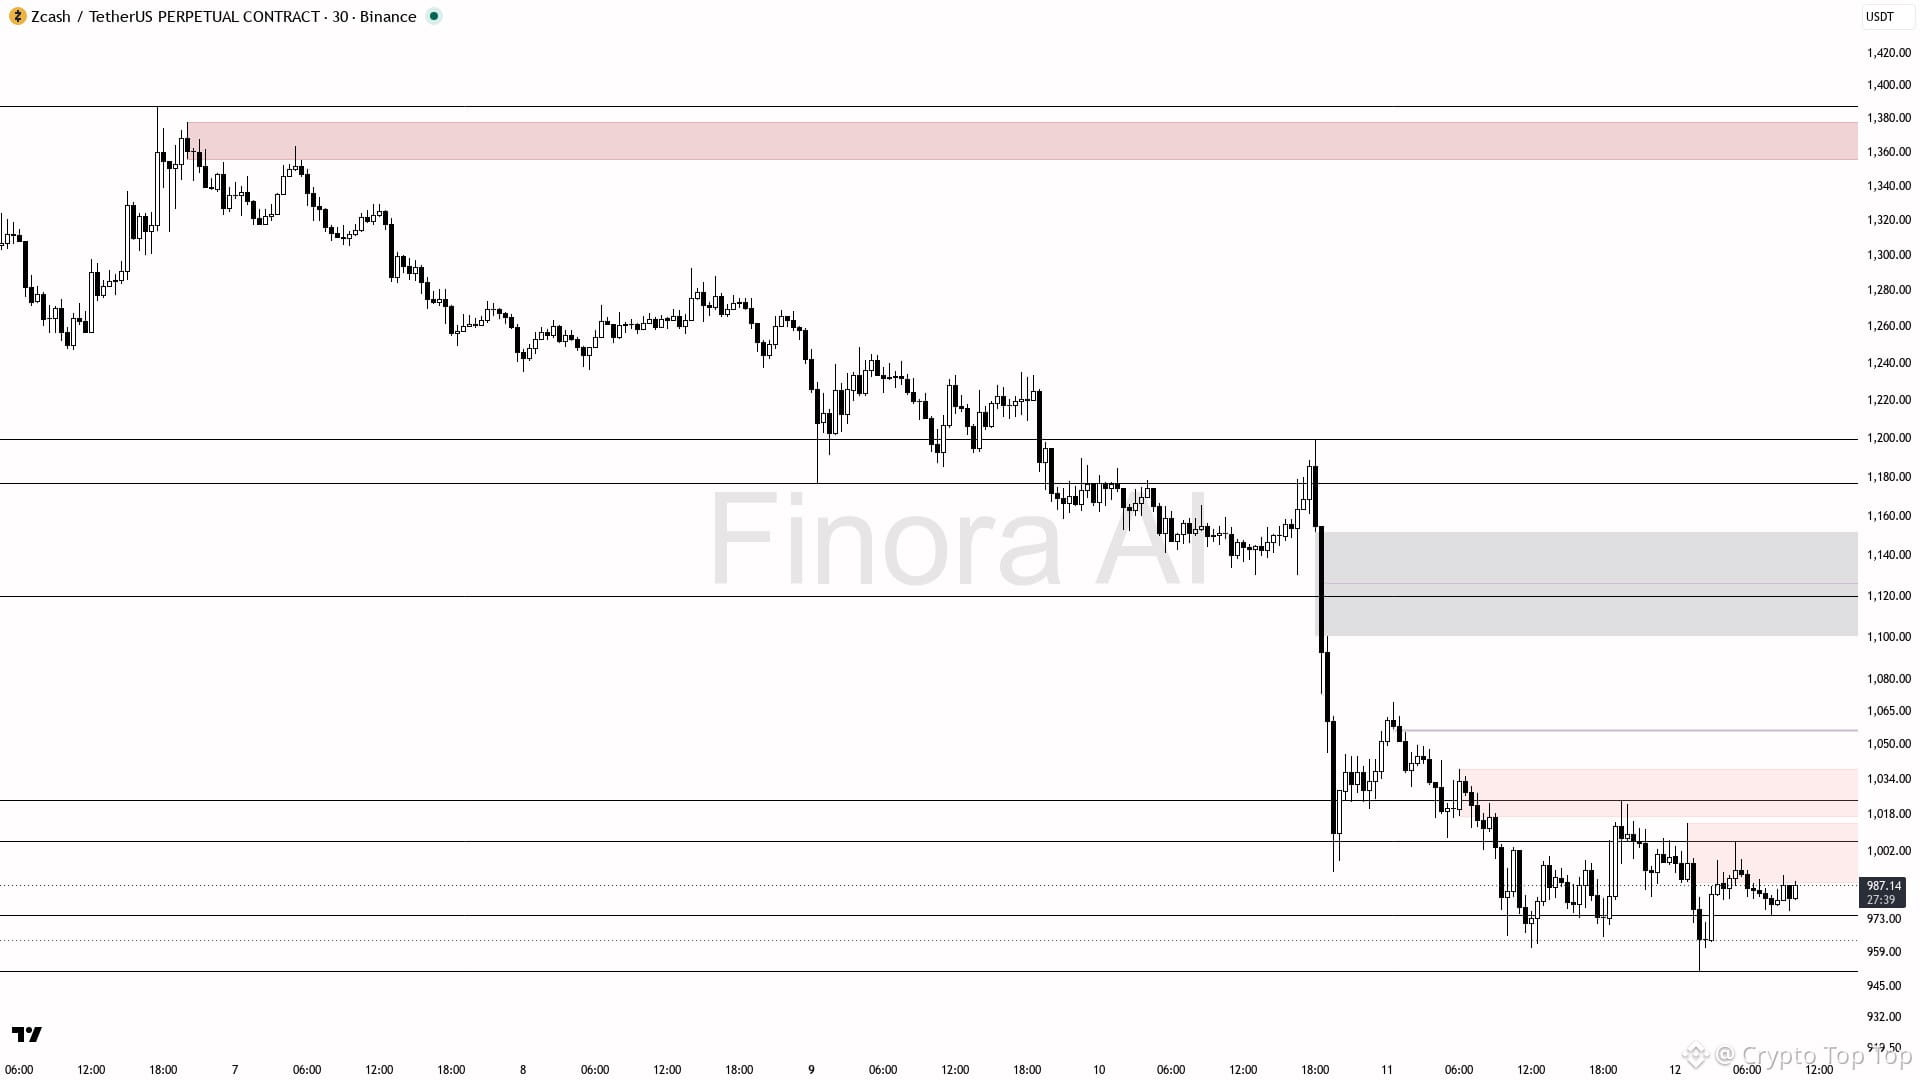
hey! checking out $ZEC #ZECUSDTAnalysis on the 30m for you 🧐
- my bias is bearish here, as the 30m and daily trends are both bearish and price is still trading well below the key 1024-1006 resistance band
- expecting price to first revisit the 968-953 support zone, with a likely sweep of the 951 liquidity low — look for a reaction there for short-term scalps, but overall pressure remains down
- if 951 breaks cleanly, next targets are 940 and possibly lower; weak volume and bearish BTC structure back up the downside expectation
- for shorts, ideal entry is a rejection from the 1002-1024 supply zone, confirmed by a bearish engulfing or lower-timeframe structure shift; target 968, then 953, and partials near 951 — protection should be placed above 1006 (trend flip)
- if you want to try a counter-trend scalp long, only consider it after a clear sweep and reclaim of 951 with strong bullish reaction (pin bar or engulfing), targeting 968 and 1002 — but this is aggressive, as structure is not on your side
- invalidation for any bearish bias is a 30m close above 1006.46, which would flip structure bullish and open up 1024, then 1085 as targets#Analsis
{spot}(ZECUSDT)
not investment advice, educational report only
hey! checking out $ZEC #ZECUSDTAnalysis on the 30m for you 🧐
- my bias is bearish here, as the 30m and daily trends are both bearish and price is still trading well below the key 1024-1006 resistance band
- expecting price to first revisit the 968-953 support zone, with a likely sweep of the 951 liquidity low — look for a reaction there for short-term scalps, but overall pressure remains down
- if 951 breaks cleanly, next targets are 940 and possibly lower; weak volume and bearish BTC structure back up the downside expectation
- for shorts, ideal entry is a rejection from the 1002-1024 supply zone, confirmed by a bearish engulfing or lower-timeframe structure shift; target 968, then 953, and partials near 951 — protection should be placed above 1006 (trend flip)
- if you want to try a counter-trend scalp long, only consider it after a clear sweep and reclaim of 951 with strong bullish reaction (pin bar or engulfing), targeting 968 and 1002 — but this is aggressive, as structure is not on your side
- invalidation for any bearish bias is a 30m close above 1006.46, which would flip structure bullish and open up 1024, then 1085 as targets#Analsis
not investment advice, educational report only
- my bias is bearish here, as the 30m and daily trends are both bearish and price is still trading well below the key 1024-1006 resistance band
- expecting price to first revisit the 968-953 support zone, with a likely sweep of the 951 liquidity low — look for a reaction there for short-term scalps, but overall pressure remains down
- if 951 breaks cleanly, next targets are 940 and possibly lower; weak volume and bearish BTC structure back up the downside expectation
- for shorts, ideal entry is a rejection from the 1002-1024 supply zone, confirmed by a bearish engulfing or lower-timeframe structure shift; target 968, then 953, and partials near 951 — protection should be placed above 1006 (trend flip)
- if you want to try a counter-trend scalp long, only consider it after a clear sweep and reclaim of 951 with strong bullish reaction (pin bar or engulfing), targeting 968 and 1002 — but this is aggressive, as structure is not on your side
- invalidation for any bearish bias is a 30m close above 1006.46, which would flip structure bullish and open up 1024, then 1085 as targets#Analsis
not investment advice, educational report only
1
152

·
--
Bullish
Today we need invest in $PEPE .
what is your opinion.
{spot}(PEPEUSDT)
#AnthropicRejectsIPODelayValuationinQuestion #Analsis
Today we need invest in $PEPE .
what is your opinion.
#AnthropicRejectsIPODelayValuationinQuestion #Analsis
what is your opinion.
#AnthropicRejectsIPODelayValuationinQuestion #Analsis
30
AI can analyze charts.
AI can track news.
AI can even execute trades.
$BTC #Analsis
{spot}(BTCUSDT)
But can it actually understand market sentiment?
Because sometimes the market makes absolutely no sense.
Would you trust an AI to manage your crypto portfolio?
Or are you still trusting your own instincts?
AI can analyze charts.
AI can track news.
AI can even execute trades.
$BTC #Analsis
But can it actually understand market sentiment?
Because sometimes the market makes absolutely no sense.
Would you trust an AI to manage your crypto portfolio?
Or are you still trusting your own instincts?
AI can track news.
AI can even execute trades.
$BTC #Analsis
But can it actually understand market sentiment?
Because sometimes the market makes absolutely no sense.
Would you trust an AI to manage your crypto portfolio?
Or are you still trusting your own instincts?

13

#BTCUSDT
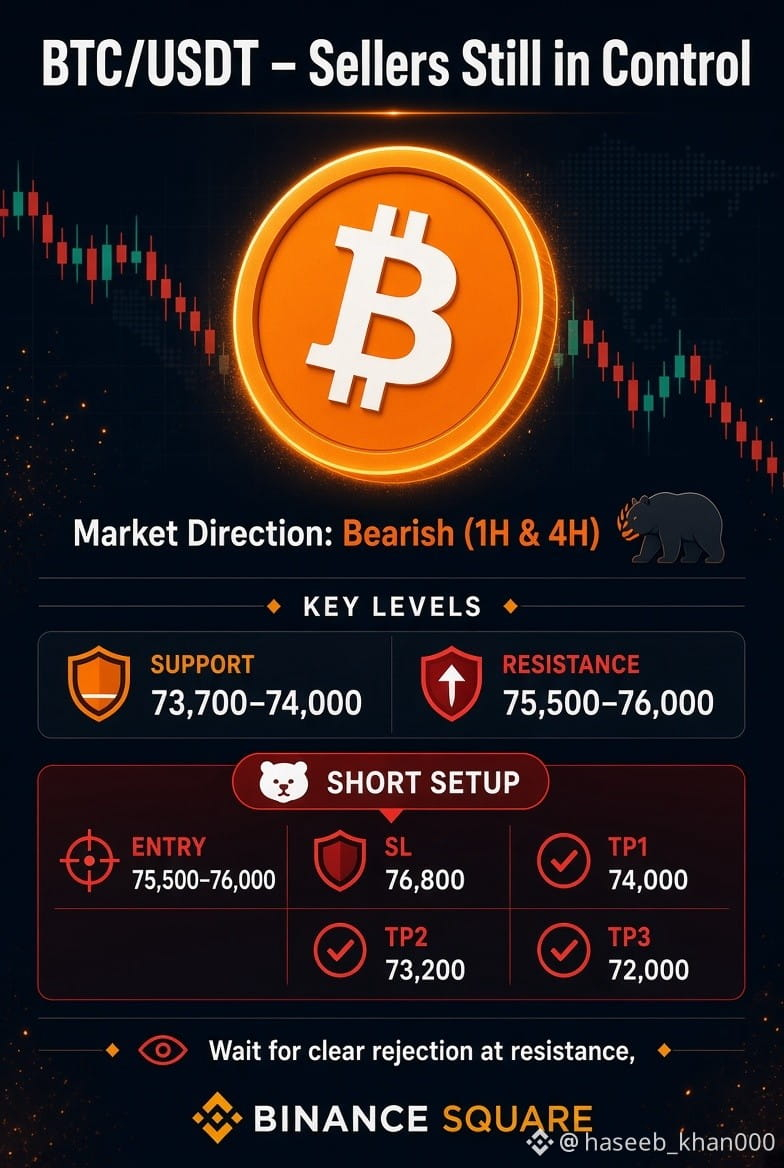
BTC/USDT Technical Analysis
Current Trend: BEARISH (short-term)
1H & 4H Direction:
Both timeframes are currently pointing lower. Price is trading below short-term EMAs, MACD remains negative on higher timeframes, and sellers maintain control. 4H shows stronger bearish pressure.
Key Levels:
Support: 73,700 – 74,000
Resistance: 75,500 – 76,000
RSI: Daily and 4H RSI are in the mid-30s (weak/bearish momentum zone). Not deeply oversold yet.
Stronger Side: Sellers currently have the upper hand on the 1H–4H structure.
Conditional Trading Setup
Direction: SHORT
Entry Zone: 75,500 – 76,000
(Look for rejection near this resistance cluster)
Stop Loss: 76,800
Take Profit Levels:
TP1: 74,000
TP2: 73,200
TP3: 72,000
Confirmation Required:
Clear rejection candle (wick rejection or bearish engulfing) on 1H or 4H at the 75,500–76,000 zone
Price fails to close above 76,000
Preferable if 4H RSI stays below 45
Risk-to-Reward: Approximately 1:1.8 to 1:2.4 (depending on exact entry)
Important Notes:
This is a conditional setup only. Do not enter if Bitcoin breaks and holds above 76,000–76,200 with strong volume. If price consolidates sideways without clear rejection, the better decision is to WAIT.
#BTC #Binance #BinanceSquare #Analsis
{future}(BTCUSDT)
#BTCUSDT
BTC/USDT Technical Analysis
Current Trend: BEARISH (short-term)
1H & 4H Direction:
Both timeframes are currently pointing lower. Price is trading below short-term EMAs, MACD remains negative on higher timeframes, and sellers maintain control. 4H shows stronger bearish pressure.
Key Levels:
Support: 73,700 – 74,000
Resistance: 75,500 – 76,000
RSI: Daily and 4H RSI are in the mid-30s (weak/bearish momentum zone). Not deeply oversold yet.
Stronger Side: Sellers currently have the upper hand on the 1H–4H structure.
Conditional Trading Setup
Direction: SHORT
Entry Zone: 75,500 – 76,000
(Look for rejection near this resistance cluster)
Stop Loss: 76,800
Take Profit Levels:
TP1: 74,000
TP2: 73,200
TP3: 72,000
Confirmation Required:
Clear rejection candle (wick rejection or bearish engulfing) on 1H or 4H at the 75,500–76,000 zone
Price fails to close above 76,000
Preferable if 4H RSI stays below 45
Risk-to-Reward: Approximately 1:1.8 to 1:2.4 (depending on exact entry)
Important Notes:
This is a conditional setup only. Do not enter if Bitcoin breaks and holds above 76,000–76,200 with strong volume. If price consolidates sideways without clear rejection, the better decision is to WAIT.
#BTC #Binance #BinanceSquare #Analsis
BTC/USDT Technical Analysis
Current Trend: BEARISH (short-term)
1H & 4H Direction:
Both timeframes are currently pointing lower. Price is trading below short-term EMAs, MACD remains negative on higher timeframes, and sellers maintain control. 4H shows stronger bearish pressure.
Key Levels:
Support: 73,700 – 74,000
Resistance: 75,500 – 76,000
RSI: Daily and 4H RSI are in the mid-30s (weak/bearish momentum zone). Not deeply oversold yet.
Stronger Side: Sellers currently have the upper hand on the 1H–4H structure.
Conditional Trading Setup
Direction: SHORT
Entry Zone: 75,500 – 76,000
(Look for rejection near this resistance cluster)
Stop Loss: 76,800
Take Profit Levels:
TP1: 74,000
TP2: 73,200
TP3: 72,000
Confirmation Required:
Clear rejection candle (wick rejection or bearish engulfing) on 1H or 4H at the 75,500–76,000 zone
Price fails to close above 76,000
Preferable if 4H RSI stays below 45
Risk-to-Reward: Approximately 1:1.8 to 1:2.4 (depending on exact entry)
Important Notes:
This is a conditional setup only. Do not enter if Bitcoin breaks and holds above 76,000–76,200 with strong volume. If price consolidates sideways without clear rejection, the better decision is to WAIT.
#BTC #Binance #BinanceSquare #Analsis
47

·
--
Bullish
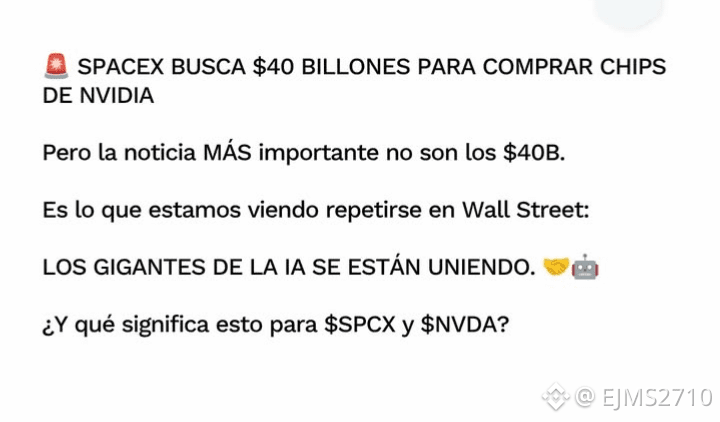
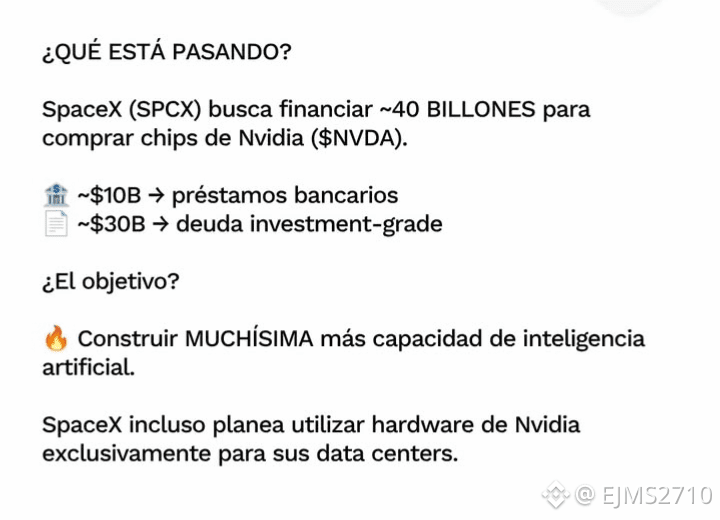
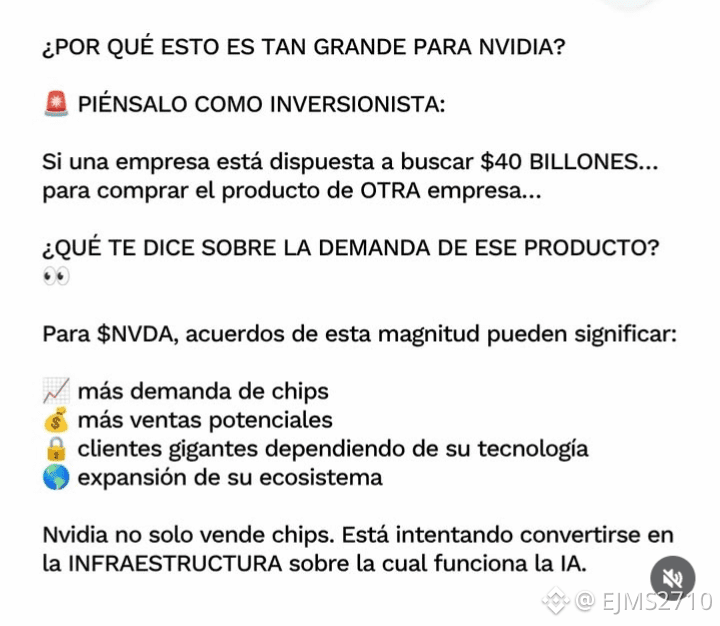
#Analsis Highly interesting information—read it 👀👀👀👀🚀🎁🙏👀🎁🚀🙏👀🎁🚀🙏👀🎁🚀🙏👀🎁🚀🙏👀 $NVDAB 🎁🚀👀🎁🚀🎁👀🚀🎁👀🎁🚀🎁$SPCXB $TSLAB Save in these stocks, everyone 🚀🎁🚀🙏🎁🚀🙏🎁🚀🙏🎁🙏🚀🙏🎁🙏🚀🙏
#Analsis Highly interesting information—read it 👀👀👀👀🚀🎁🙏👀🎁🚀🙏👀🎁🚀🙏👀🎁🚀🙏👀🎁🚀🙏👀 $NVDAB 🎁🚀👀🎁🚀🎁👀🚀🎁👀🎁🚀🎁$SPCXB $TSLAB Save in these stocks, everyone 🚀🎁🚀🙏🎁🚀🙏🎁🚀🙏🎁🙏🚀🙏🎁🙏🚀🙏

1
155
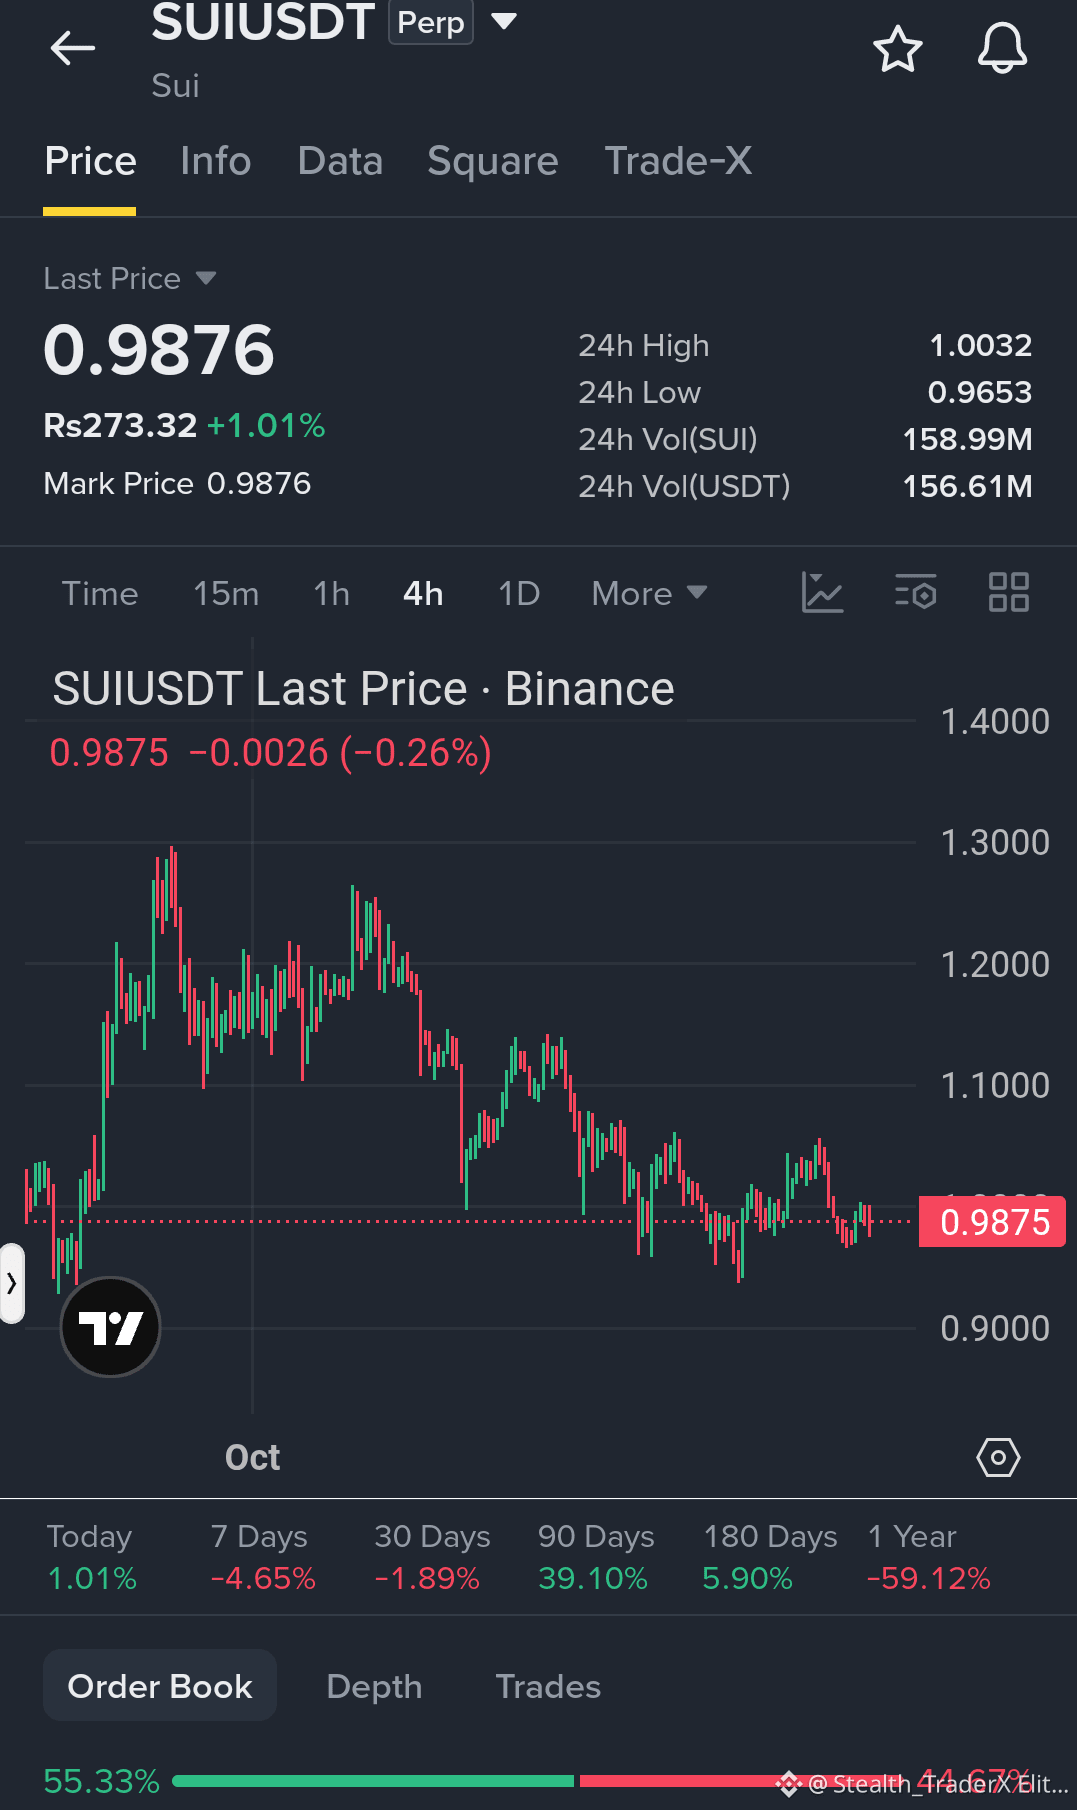
🏞️ Trading pair: $SUI USDT
🕯️ Chart analysis:
The SUI price is attempting to hold above the imbalance zone. If the price succeeds in doing so, a new uptrend will begin.
📍 Entry:
A long position can be opened in the imbalance zone between the $0.9590 and $0.9890 levels.
✔️ Main Target:
Liquidity is present at the previous high of $1.1410.
#sui/usdt #Analsis
{spot}(SUIUSDT)
🏞️ Trading pair: $SUI USDT
🕯️ Chart analysis:
The SUI price is attempting to hold above the imbalance zone. If the price succeeds in doing so, a new uptrend will begin.
📍 Entry:
A long position can be opened in the imbalance zone between the $0.9590 and $0.9890 levels.
✔️ Main Target:
Liquidity is present at the previous high of $1.1410.
#sui/usdt #Analsis
🕯️ Chart analysis:
The SUI price is attempting to hold above the imbalance zone. If the price succeeds in doing so, a new uptrend will begin.
📍 Entry:
A long position can be opened in the imbalance zone between the $0.9590 and $0.9890 levels.
✔️ Main Target:
Liquidity is present at the previous high of $1.1410.
#sui/usdt #Analsis
144

$BTC just reminded everyone who’s in charge 😅
After flirting with $78K, Bitcoin got smacked back into the $76K zone. Price looks tired short-term—every bounce getting sold, no real follow-through. Classic chop before a bigger move… question is which way 👀
The real trigger? Flows flipped. After 9 straight days of inflows, spot ETFs saw ~$263M in outflows. Fidelity Investments’s FBTC led with $150M out, followed by Grayscale Investments’s GBTC and ARK Invest’s ARKB. Not panic—but definitely a momentum check.
Sentiment felt it too. Fear & Greed dipped back into Fear right after teasing Neutral. That’s the market saying: “yeah… not convinced yet.”
But zoom out. April still screams accumulation. Institutions + ETFs absorbed WAY more $BTC than miners produced. Supply: ~11.8K BTC. Demand? Way higher. That imbalance doesn’t just disappear overnight.
My take? Short-term noise, long-term pressure building. If flows stabilize, $BTC probably takes another shot at highs. If not—expect more chop to shake out weak hands.
Same game, different day. Stay sharp.
#BTC
#Analsis
#followers
$BTC just reminded everyone who’s in charge 😅
After flirting with $78K, Bitcoin got smacked back into the $76K zone. Price looks tired short-term—every bounce getting sold, no real follow-through. Classic chop before a bigger move… question is which way 👀
The real trigger? Flows flipped. After 9 straight days of inflows, spot ETFs saw ~$263M in outflows. Fidelity Investments’s FBTC led with $150M out, followed by Grayscale Investments’s GBTC and ARK Invest’s ARKB. Not panic—but definitely a momentum check.
Sentiment felt it too. Fear & Greed dipped back into Fear right after teasing Neutral. That’s the market saying: “yeah… not convinced yet.”
But zoom out. April still screams accumulation. Institutions + ETFs absorbed WAY more $BTC than miners produced. Supply: ~11.8K BTC. Demand? Way higher. That imbalance doesn’t just disappear overnight.
My take? Short-term noise, long-term pressure building. If flows stabilize, $BTC probably takes another shot at highs. If not—expect more chop to shake out weak hands.
Same game, different day. Stay sharp.
#BTC
#Analsis
#followers
After flirting with $78K, Bitcoin got smacked back into the $76K zone. Price looks tired short-term—every bounce getting sold, no real follow-through. Classic chop before a bigger move… question is which way 👀
The real trigger? Flows flipped. After 9 straight days of inflows, spot ETFs saw ~$263M in outflows. Fidelity Investments’s FBTC led with $150M out, followed by Grayscale Investments’s GBTC and ARK Invest’s ARKB. Not panic—but definitely a momentum check.
Sentiment felt it too. Fear & Greed dipped back into Fear right after teasing Neutral. That’s the market saying: “yeah… not convinced yet.”
But zoom out. April still screams accumulation. Institutions + ETFs absorbed WAY more $BTC than miners produced. Supply: ~11.8K BTC. Demand? Way higher. That imbalance doesn’t just disappear overnight.
My take? Short-term noise, long-term pressure building. If flows stabilize, $BTC probably takes another shot at highs. If not—expect more chop to shake out weak hands.
Same game, different day. Stay sharp.
#BTC
#Analsis
#followers
1
495

·
--
Bullish
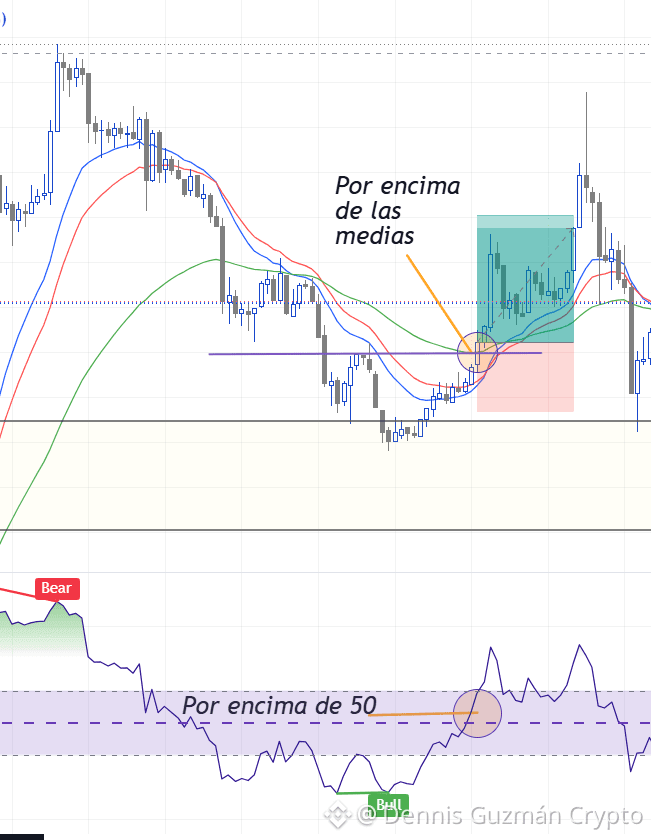
$ETH High-probability setup based on the confluence of moving averages and a relative strength oscillator, structuring a trade with a risk/reward ratio of 1:2.
{future}(ETHUSDT)
Crossover and Positioning of Moving Averages: The price has managed to break and consolidate above the set of moving averages. This movement, marked on the candlestick chart, confirms a transition from previous bearish pressure to bullish momentum, where the moving averages start to act as dynamic support. Momentum Confirmation on the Oscillator: At the bottom, the relative strength indicator supports the price movement by crossing and holding above the key level of 50. This behavior validates the exit from the weakness zone (Bear) and the entry into bullish control territory (Bull).
{spot}(ETHUSDT)
The trade executes after the confirmation of both factors, projecting a technical target equivalent to double the assumed risk: $ETH
Invalidation Point (Stop Loss): Strategically positioned below the recent structural low and the moving averages to protect capital against a potential false breakout. Exit Objective (Take Profit): Projected towards the upper resistance zone, systematically reaching the established 1:2 ratio in the trading plan.
#ETH #Analsis
$ETH High-probability setup based on the confluence of moving averages and a relative strength oscillator, structuring a trade with a risk/reward ratio of 1:2.
Crossover and Positioning of Moving Averages: The price has managed to break and consolidate above the set of moving averages. This movement, marked on the candlestick chart, confirms a transition from previous bearish pressure to bullish momentum, where the moving averages start to act as dynamic support. Momentum Confirmation on the Oscillator: At the bottom, the relative strength indicator supports the price movement by crossing and holding above the key level of 50. This behavior validates the exit from the weakness zone (Bear) and the entry into bullish control territory (Bull).
The trade executes after the confirmation of both factors, projecting a technical target equivalent to double the assumed risk: $ETH
Invalidation Point (Stop Loss): Strategically positioned below the recent structural low and the moving averages to protect capital against a potential false breakout. Exit Objective (Take Profit): Projected towards the upper resistance zone, systematically reaching the established 1:2 ratio in the trading plan.
#ETH #Analsis
Crossover and Positioning of Moving Averages: The price has managed to break and consolidate above the set of moving averages. This movement, marked on the candlestick chart, confirms a transition from previous bearish pressure to bullish momentum, where the moving averages start to act as dynamic support. Momentum Confirmation on the Oscillator: At the bottom, the relative strength indicator supports the price movement by crossing and holding above the key level of 50. This behavior validates the exit from the weakness zone (Bear) and the entry into bullish control territory (Bull).
The trade executes after the confirmation of both factors, projecting a technical target equivalent to double the assumed risk: $ETH
Invalidation Point (Stop Loss): Strategically positioned below the recent structural low and the moving averages to protect capital against a potential false breakout. Exit Objective (Take Profit): Projected towards the upper resistance zone, systematically reaching the established 1:2 ratio in the trading plan.
#ETH #Analsis
Dennis Guzmán Crypto
·
--
Bullish$ETH shows a strong bullish momentum that positions us in favor of the immediate trend. However, jumping in at the current price is high risk.
My Execution Plan:
I will wait for a healthy pullback (discount) towards the key confluence zone before looking for short-term positions:
RSI: Waiting for a return and test of the 50% level. (ALERT)
Support/Resistance: Re-test of the broken resistance level (now macro support).
Imbalance: Mitigation of the visible imbalance left by institutional strength.
Patience pays! $ETH What do you think about this buying zone?
#Ethereum #ETHUSD #Trading #AnalisisTecnico
My Execution Plan:
I will wait for a healthy pullback (discount) towards the key confluence zone before looking for short-term positions:
RSI: Waiting for a return and test of the 50% level. (ALERT)
Support/Resistance: Re-test of the broken resistance level (now macro support).
Imbalance: Mitigation of the visible imbalance left by institutional strength.
Patience pays! $ETH What do you think about this buying zone?
#Ethereum #ETHUSD #Trading #AnalisisTecnico
1
598

·
--
Bullish
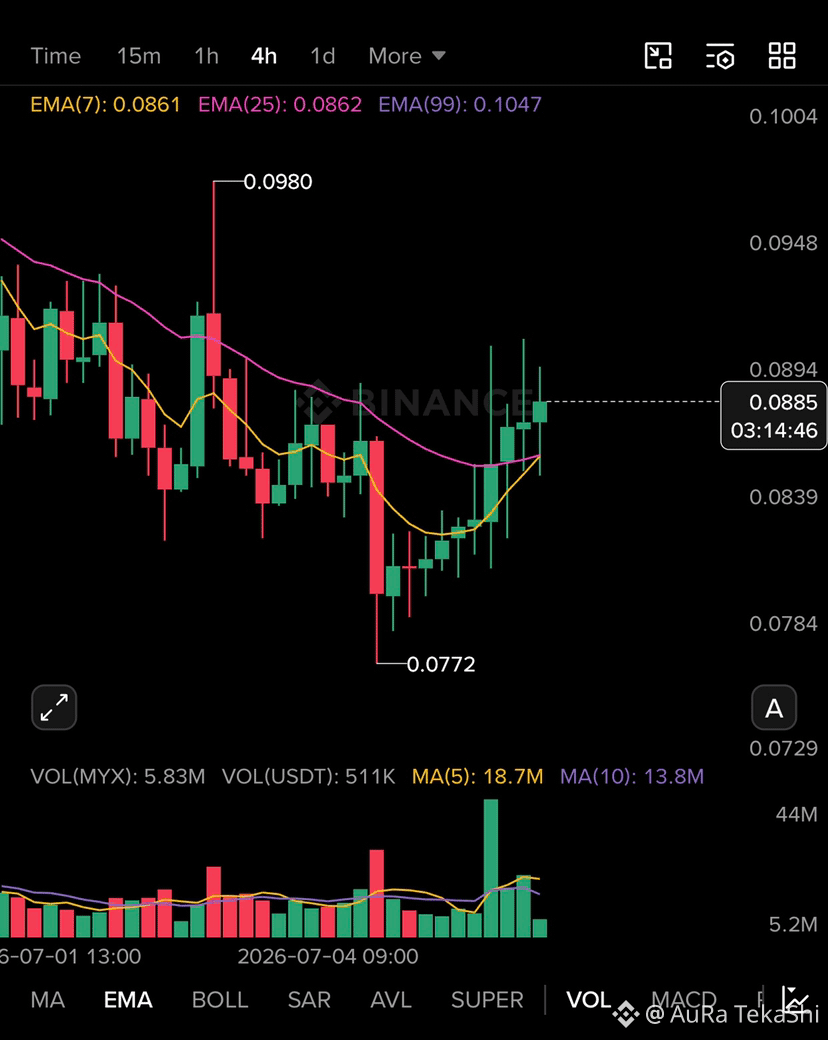
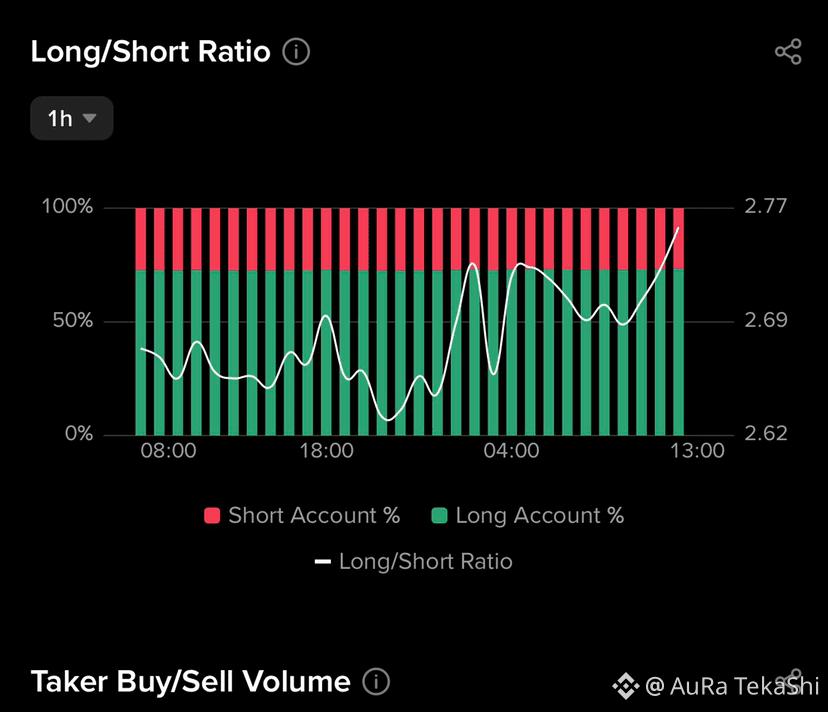
$MYX It shows a promising positive shift; the price has successfully returned above the moving averages, which indicates the end of the correction phase and the beginning of an attempt to regain the upward trend.
🟢 Buying roadmap:$MYX
🟡 Entry zone: Stability above 0.0885.
☑️ Targets: 0.0900 as a first target, then 0.0948, reaching the range high at 0.0980.
🔻 Protection point: A four-hour candle closing below 0.0839; breaking this level means sellers regain control.
☑️ Strategic outlook:$MYX
☑️ The price is currently in a “rebuilding confidence” phase. We are seeing an attempt to break the mid-level resistance, and the bullish momentum appears supported by the positioning of the moving averages, which have started to curve upward. Buying in these areas depends on the continuation of momentum and not returning below the moving average lines.
☑️ Do you think the current liquidity is sufficient to break the 0.0894 resistance in the next candle, or should we wait for longer stability above the entry level?
#trading #crypto #Binance #signalsfutures #Analsis
{future}(MYXUSDT)
$MYX It shows a promising positive shift; the price has successfully returned above the moving averages, which indicates the end of the correction phase and the beginning of an attempt to regain the upward trend.
🟢 Buying roadmap:$MYX
🟡 Entry zone: Stability above 0.0885.
☑️ Targets: 0.0900 as a first target, then 0.0948, reaching the range high at 0.0980.
🔻 Protection point: A four-hour candle closing below 0.0839; breaking this level means sellers regain control.
☑️ Strategic outlook:$MYX
☑️ The price is currently in a “rebuilding confidence” phase. We are seeing an attempt to break the mid-level resistance, and the bullish momentum appears supported by the positioning of the moving averages, which have started to curve upward. Buying in these areas depends on the continuation of momentum and not returning below the moving average lines.
☑️ Do you think the current liquidity is sufficient to break the 0.0894 resistance in the next candle, or should we wait for longer stability above the entry level?
#trading #crypto #Binance #signalsfutures #Analsis
🟢 Buying roadmap:$MYX
🟡 Entry zone: Stability above 0.0885.
☑️ Targets: 0.0900 as a first target, then 0.0948, reaching the range high at 0.0980.
🔻 Protection point: A four-hour candle closing below 0.0839; breaking this level means sellers regain control.
☑️ Strategic outlook:$MYX
☑️ The price is currently in a “rebuilding confidence” phase. We are seeing an attempt to break the mid-level resistance, and the bullish momentum appears supported by the positioning of the moving averages, which have started to curve upward. Buying in these areas depends on the continuation of momentum and not returning below the moving average lines.
☑️ Do you think the current liquidity is sufficient to break the 0.0894 resistance in the next candle, or should we wait for longer stability above the entry level?
#trading #crypto #Binance #signalsfutures #Analsis
198

·
--
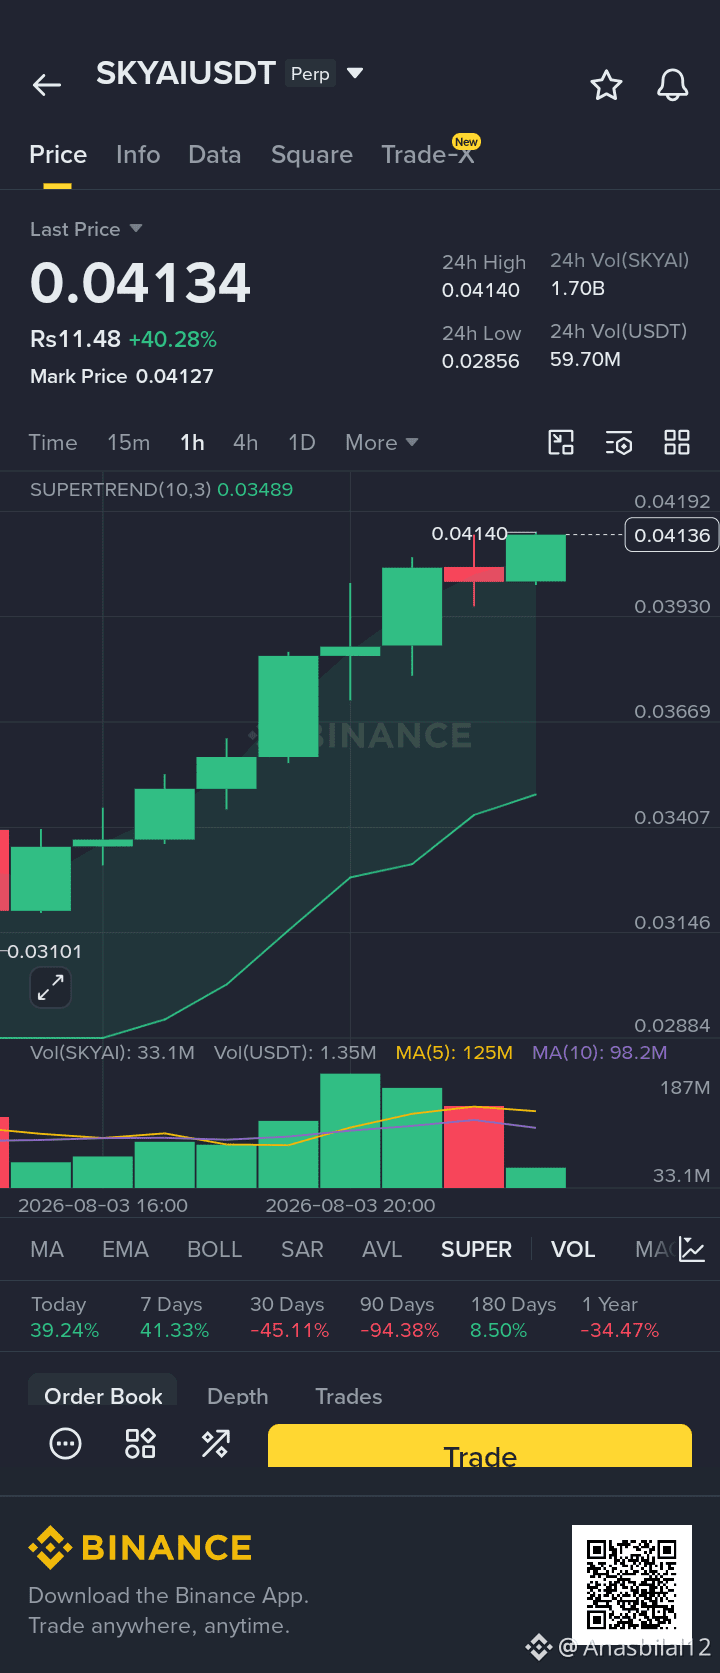
SKYAIUSDT LONG
leverig 20x to 50x
ENTRY 0.04100 to 0.03900
TARGET 0.04200
0.04500
0.04800
0.05100
0.05500
0.05900
0.06100
0.06300
0.06800
0.07000
0.07200
0.07500
#Analsis $SKYAI
{future}(SKYAIUSDT)
SKYAIUSDT LONG
leverig 20x to 50x
ENTRY 0.04100 to 0.03900
TARGET 0.04200
0.04500
0.04800
0.05100
0.05500
0.05900
0.06100
0.06300
0.06800
0.07000
0.07200
0.07500
#Analsis $SKYAI
leverig 20x to 50x
ENTRY 0.04100 to 0.03900
TARGET 0.04200
0.04500
0.04800
0.05100
0.05500
0.05900
0.06100
0.06300
0.06800
0.07000
0.07200
0.07500
#Analsis $SKYAI
88
Log in to explore more content
Join global crypto users on Binance Square
⚡️ Get latest and useful information about crypto.
💬 Trusted by the world’s largest crypto exchange.
👍 Discover real insights from verified creators.
Email / Phone number
Trending Topics
1
#BTCReboundsAbove$60KAmidWhaleDipBuying
81,456 views
366 Discussing
2
#SolanaSets2027RoadmapToDoubleComputeCapacity
66,241 views
1,071 Discussing
3
#CaliforniaNvidiaProbeExaminesPotentialCriminalViolations
17,858 views
147 Discussing
4
#BlackRockLaunchesHKDollarDigitalLiquidityFund
54,757 views
806 Discussing
5
#NvidiaLoses$2.7TrillionInMonthAndAHalf
79,559 views
319 Discussing
6
#GlobalStocksFaceLongestLosingStreakSince2023
580,802 views
3,533 Discussing
7
#BlackRockIBITPostsRecord$541MSingleDayOutflow
97,715 views
186 Discussing
8
#AnthropicPlungesTowardIPOPriceonDay2
322,964 views
2,372 Discussing
9
#TwentyOneCapitalAdds172.25BTC
173,239 views
1,681 Discussing
10
#HKBillWouldExcludeTokenizedDepositsFromVirtualAssets
18,747 views
108 Discussing