
#analysecrypto
analysecrypto
363,712 views
1,003 Discussing
Hot
Latest
·
--
$AGT USDT just completed a parabolic move from about 0.023 to a high of 0.0868, roughly a 3.7x run in a couple of days, and it is now in a pullback. Price is 0.06566, down almost 12 percent on the day, with the last two 4h candles red and a long upper wick near the top showing heavy rejection.
Momentum is cooling. RSI(6) has dropped to about 57 and RSI(14) to about 66, both turning down from overbought. MACD is still positive but the histogram bars are shrinking, which signals fading bullish strength. Volume peaked on the breakout candles and has dropped off sharply since, so buyers are losing interest.
Key levels: support sits around 0.0619 (the 24h low area), then 0.0479 where the big green candle's midpoint is. Resistance is 0.075 and then the 0.0868 high.
Bias is short term bearish or consolidating. A bounce is likely to be sold unless price reclaims 0.075 with volume. A break below 0.0619 could open a deeper retrace toward 0.048. Chasing longs here is risky after such a vertical move, and funding and volatility on a perp this extended can liquidate positions fast, so keep leverage low and stops tight.
This is not financial advice.
#AnalyseCrypto
$AGT USDT just completed a parabolic move from about 0.023 to a high of 0.0868, roughly a 3.7x run in a couple of days, and it is now in a pullback. Price is 0.06566, down almost 12 percent on the day, with the last two 4h candles red and a long upper wick near the top showing heavy rejection.
Momentum is cooling. RSI(6) has dropped to about 57 and RSI(14) to about 66, both turning down from overbought. MACD is still positive but the histogram bars are shrinking, which signals fading bullish strength. Volume peaked on the breakout candles and has dropped off sharply since, so buyers are losing interest.
Key levels: support sits around 0.0619 (the 24h low area), then 0.0479 where the big green candle's midpoint is. Resistance is 0.075 and then the 0.0868 high.
Bias is short term bearish or consolidating. A bounce is likely to be sold unless price reclaims 0.075 with volume. A break below 0.0619 could open a deeper retrace toward 0.048. Chasing longs here is risky after such a vertical move, and funding and volatility on a perp this extended can liquidate positions fast, so keep leverage low and stops tight.
This is not financial advice.
#AnalyseCrypto
Momentum is cooling. RSI(6) has dropped to about 57 and RSI(14) to about 66, both turning down from overbought. MACD is still positive but the histogram bars are shrinking, which signals fading bullish strength. Volume peaked on the breakout candles and has dropped off sharply since, so buyers are losing interest.
Key levels: support sits around 0.0619 (the 24h low area), then 0.0479 where the big green candle's midpoint is. Resistance is 0.075 and then the 0.0868 high.
Bias is short term bearish or consolidating. A bounce is likely to be sold unless price reclaims 0.075 with volume. A break below 0.0619 could open a deeper retrace toward 0.048. Chasing longs here is risky after such a vertical move, and funding and volatility on a perp this extended can liquidate positions fast, so keep leverage low and stops tight.
This is not financial advice.
#AnalyseCrypto
7
705

·
--
Technical Perspective & Analysis (Market Structure Focus)
Never faith-trade (trade based on prayer alone). Always read market structure through a combination of trends and volume.
When indicators like MA(7) and MA(25) start to cross, that’s not a signal to FOMO—it’s an alarm to start reassessing the risk-to-reward ratio. If the ratio doesn’t make sense, it’s better to skip than to force a position.
The market is open every day. Protecting your capital is far more important than rushing to get in.
#AnalyseCrypto #BinanceSquareTalks
$BTC
Technical Perspective & Analysis (Market Structure Focus)
Never faith-trade (trade based on prayer alone). Always read market structure through a combination of trends and volume.
When indicators like MA(7) and MA(25) start to cross, that’s not a signal to FOMO—it’s an alarm to start reassessing the risk-to-reward ratio. If the ratio doesn’t make sense, it’s better to skip than to force a position.
The market is open every day. Protecting your capital is far more important than rushing to get in.
#AnalyseCrypto #BinanceSquareTalks
$BTC
Never faith-trade (trade based on prayer alone). Always read market structure through a combination of trends and volume.
When indicators like MA(7) and MA(25) start to cross, that’s not a signal to FOMO—it’s an alarm to start reassessing the risk-to-reward ratio. If the ratio doesn’t make sense, it’s better to skip than to force a position.
The market is open every day. Protecting your capital is far more important than rushing to get in.
#AnalyseCrypto #BinanceSquareTalks
$BTC
469
29
469

·
--
Genius Trader Daily Technical Breakdown
The Rejection & Retest: Price peaked near 87,395.67 USDT before forming a multi-day corrective pullback. The aggressive wick down cleanly swept liquidity below prior consolidation levels, shaking out weak leveraged longs.
Cost Basis Alignment: Your average cost line (76,436.06 USDT) is currently acting as a local equilibrium pivot. Price is hovering tightly around this zone, indicating a localized tug-of-war between accumulation and distribution.
Overhead Supply & Limit Orders: Notice the active limit sell marker mapped around 85,000.00 USDT. This highlights heavy psychological and order-book resistance overhead where major supply is sitting.
Moving Averages & Momentum: Daily indicators show short-term cooling (7-day change at -5.80%, 30-day at -11.10%), yet the broader structural trend (90-day at +17.66%) remains intact, pointing to a macro higher-low formation rather than a complete trend reversal.
Actionable Game Plan 💰💰💰
Protect the Pivot: As long as daily closes hold above the 75,000–75,200 USDT support floor, the macro structure remains constructive for a eventual retest of the mid-80k range.
Targeting the Range Highs: If momentum shifts back in favor of the bulls, look for a steady climb back toward the 82,300 USDT resistance before attacking the 85,000 USDT limit zone.
Risk Management: Since you are sitting almost dead-even with your cost basis, let the market demonstrate acceptance above 77,500 USDT before considering any aggressive scaling or adding to positions. Keep a mental or hard stop-loss structured below the recent daily wicks to protect capital against any unexpected macro shocks.
#TradingSignals #btctrending #AnalyseCrypto
Genius Trader Daily Technical Breakdown
The Rejection & Retest: Price peaked near 87,395.67 USDT before forming a multi-day corrective pullback. The aggressive wick down cleanly swept liquidity below prior consolidation levels, shaking out weak leveraged longs.
Cost Basis Alignment: Your average cost line (76,436.06 USDT) is currently acting as a local equilibrium pivot. Price is hovering tightly around this zone, indicating a localized tug-of-war between accumulation and distribution.
Overhead Supply & Limit Orders: Notice the active limit sell marker mapped around 85,000.00 USDT. This highlights heavy psychological and order-book resistance overhead where major supply is sitting.
Moving Averages & Momentum: Daily indicators show short-term cooling (7-day change at -5.80%, 30-day at -11.10%), yet the broader structural trend (90-day at +17.66%) remains intact, pointing to a macro higher-low formation rather than a complete trend reversal.
Actionable Game Plan 💰💰💰
Protect the Pivot: As long as daily closes hold above the 75,000–75,200 USDT support floor, the macro structure remains constructive for a eventual retest of the mid-80k range.
Targeting the Range Highs: If momentum shifts back in favor of the bulls, look for a steady climb back toward the 82,300 USDT resistance before attacking the 85,000 USDT limit zone.
Risk Management: Since you are sitting almost dead-even with your cost basis, let the market demonstrate acceptance above 77,500 USDT before considering any aggressive scaling or adding to positions. Keep a mental or hard stop-loss structured below the recent daily wicks to protect capital against any unexpected macro shocks.
#TradingSignals #btctrending #AnalyseCrypto
The Rejection & Retest: Price peaked near 87,395.67 USDT before forming a multi-day corrective pullback. The aggressive wick down cleanly swept liquidity below prior consolidation levels, shaking out weak leveraged longs.
Cost Basis Alignment: Your average cost line (76,436.06 USDT) is currently acting as a local equilibrium pivot. Price is hovering tightly around this zone, indicating a localized tug-of-war between accumulation and distribution.
Overhead Supply & Limit Orders: Notice the active limit sell marker mapped around 85,000.00 USDT. This highlights heavy psychological and order-book resistance overhead where major supply is sitting.
Moving Averages & Momentum: Daily indicators show short-term cooling (7-day change at -5.80%, 30-day at -11.10%), yet the broader structural trend (90-day at +17.66%) remains intact, pointing to a macro higher-low formation rather than a complete trend reversal.
Actionable Game Plan 💰💰💰
Protect the Pivot: As long as daily closes hold above the 75,000–75,200 USDT support floor, the macro structure remains constructive for a eventual retest of the mid-80k range.
Targeting the Range Highs: If momentum shifts back in favor of the bulls, look for a steady climb back toward the 82,300 USDT resistance before attacking the 85,000 USDT limit zone.
Risk Management: Since you are sitting almost dead-even with your cost basis, let the market demonstrate acceptance above 77,500 USDT before considering any aggressive scaling or adding to positions. Keep a mental or hard stop-loss structured below the recent daily wicks to protect capital against any unexpected macro shocks.
#TradingSignals #btctrending #AnalyseCrypto
92
·
--
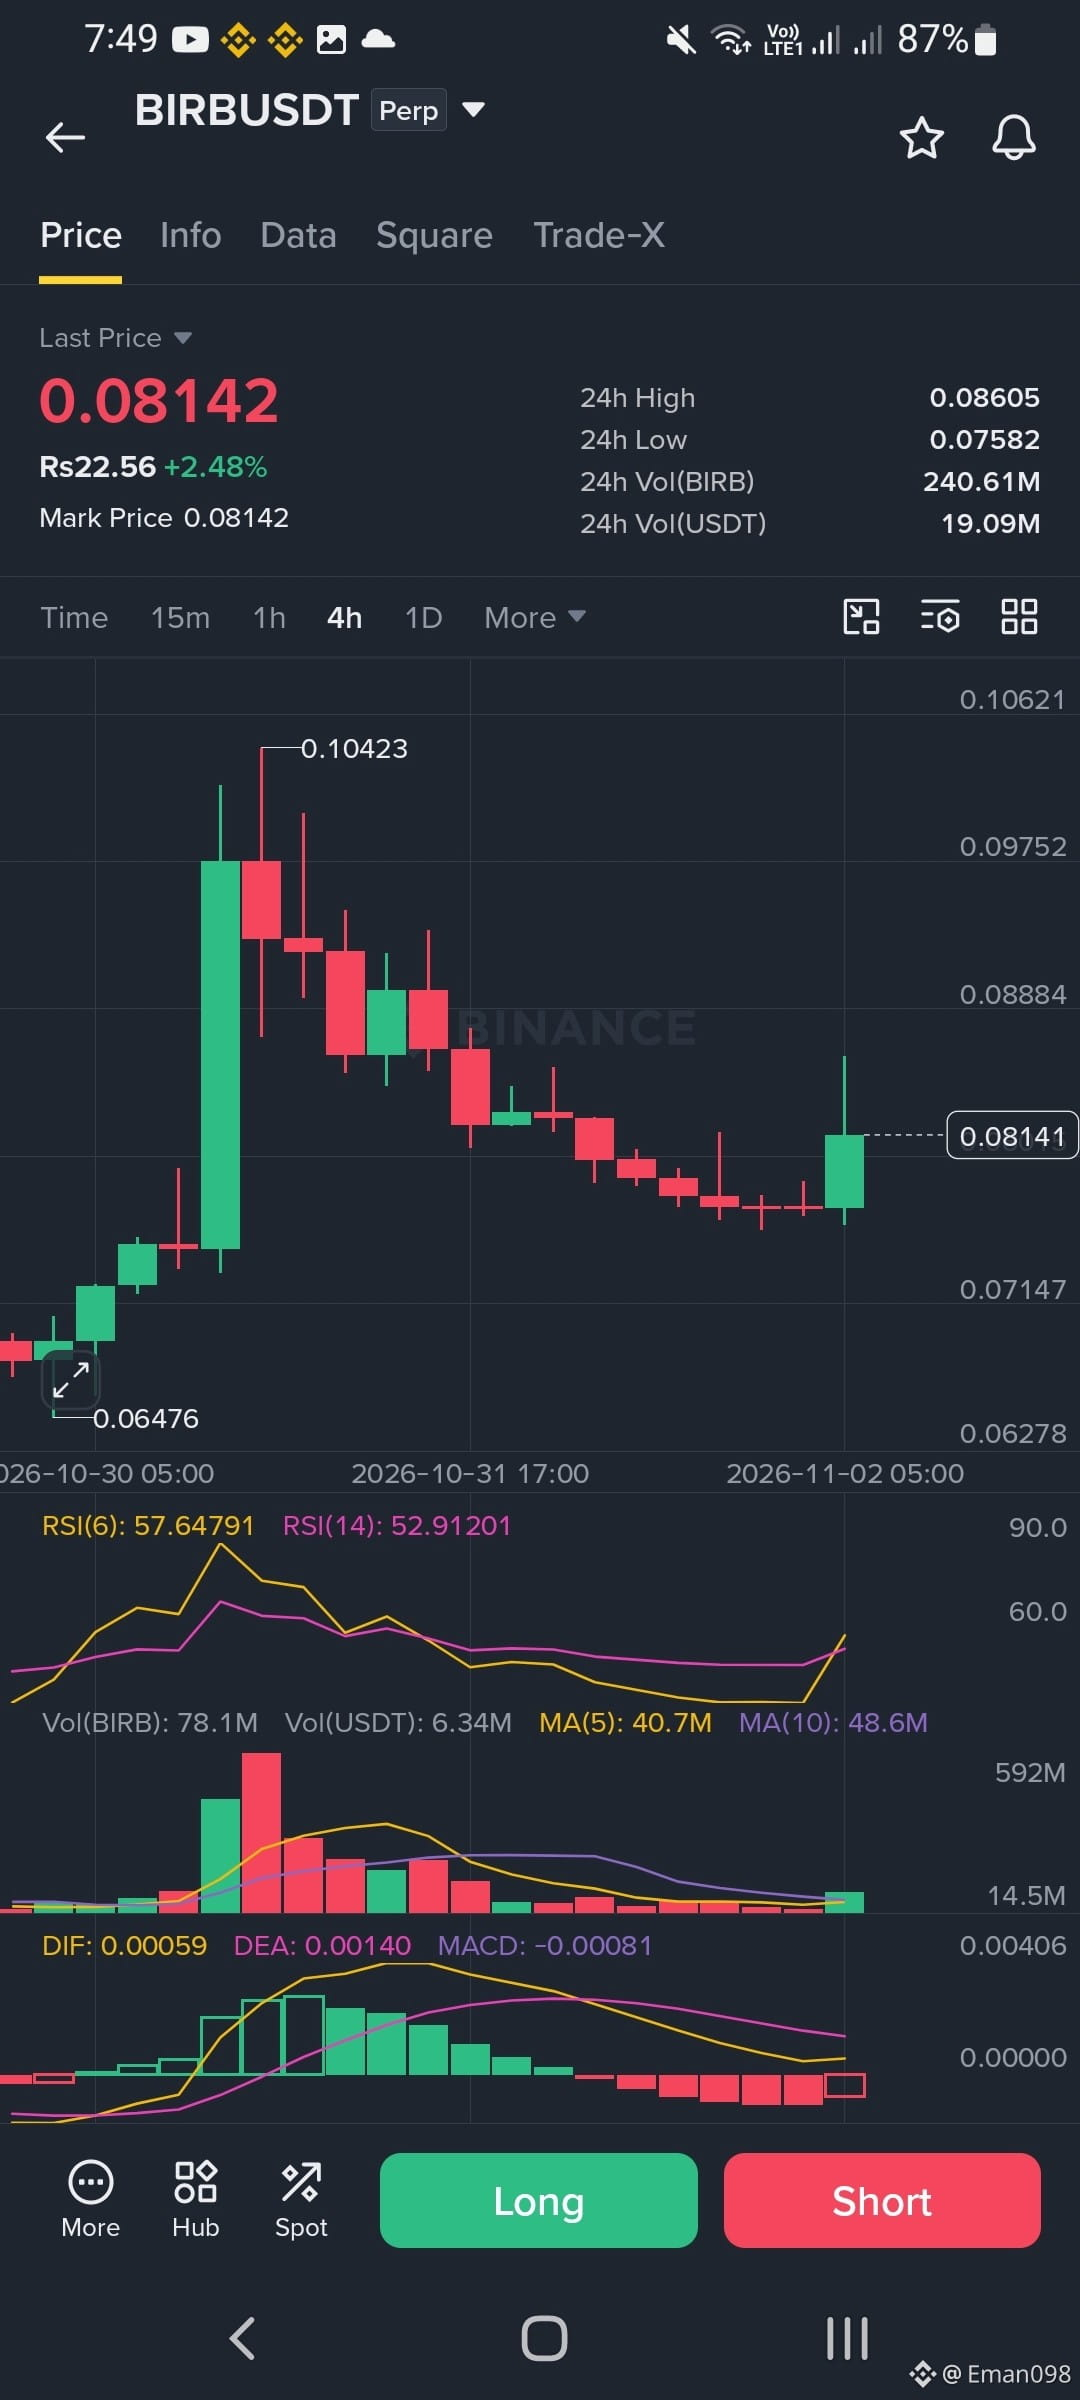
$BIRB
{future}(BIRBUSDT)
is finally waking up. It sits at 0.08142 after a nice green 4h candle. RSI is near 57 so momentum is turning up. MACD is still a bit weak though. Best support is 0.07582 and then 0.07147 below it. First resistance is 0.08605 and the bigger one is 0.08884. I would wait for a close above 0.08605 before buying. The big dump from 0.10423 was ugly so be patient. Fake pumps happen often so use a stop loss.
#BinanceUpdatesProofofReservesAddresses #AnalyseCrypto
$BIRB
is finally waking up. It sits at 0.08142 after a nice green 4h candle. RSI is near 57 so momentum is turning up. MACD is still a bit weak though. Best support is 0.07582 and then 0.07147 below it. First resistance is 0.08605 and the bigger one is 0.08884. I would wait for a close above 0.08605 before buying. The big dump from 0.10423 was ugly so be patient. Fake pumps happen often so use a stop loss.
#BinanceUpdatesProofofReservesAddresses #AnalyseCrypto
is finally waking up. It sits at 0.08142 after a nice green 4h candle. RSI is near 57 so momentum is turning up. MACD is still a bit weak though. Best support is 0.07582 and then 0.07147 below it. First resistance is 0.08605 and the bigger one is 0.08884. I would wait for a close above 0.08605 before buying. The big dump from 0.10423 was ugly so be patient. Fake pumps happen often so use a stop loss.
#BinanceUpdatesProofofReservesAddresses #AnalyseCrypto
6
639
·
--
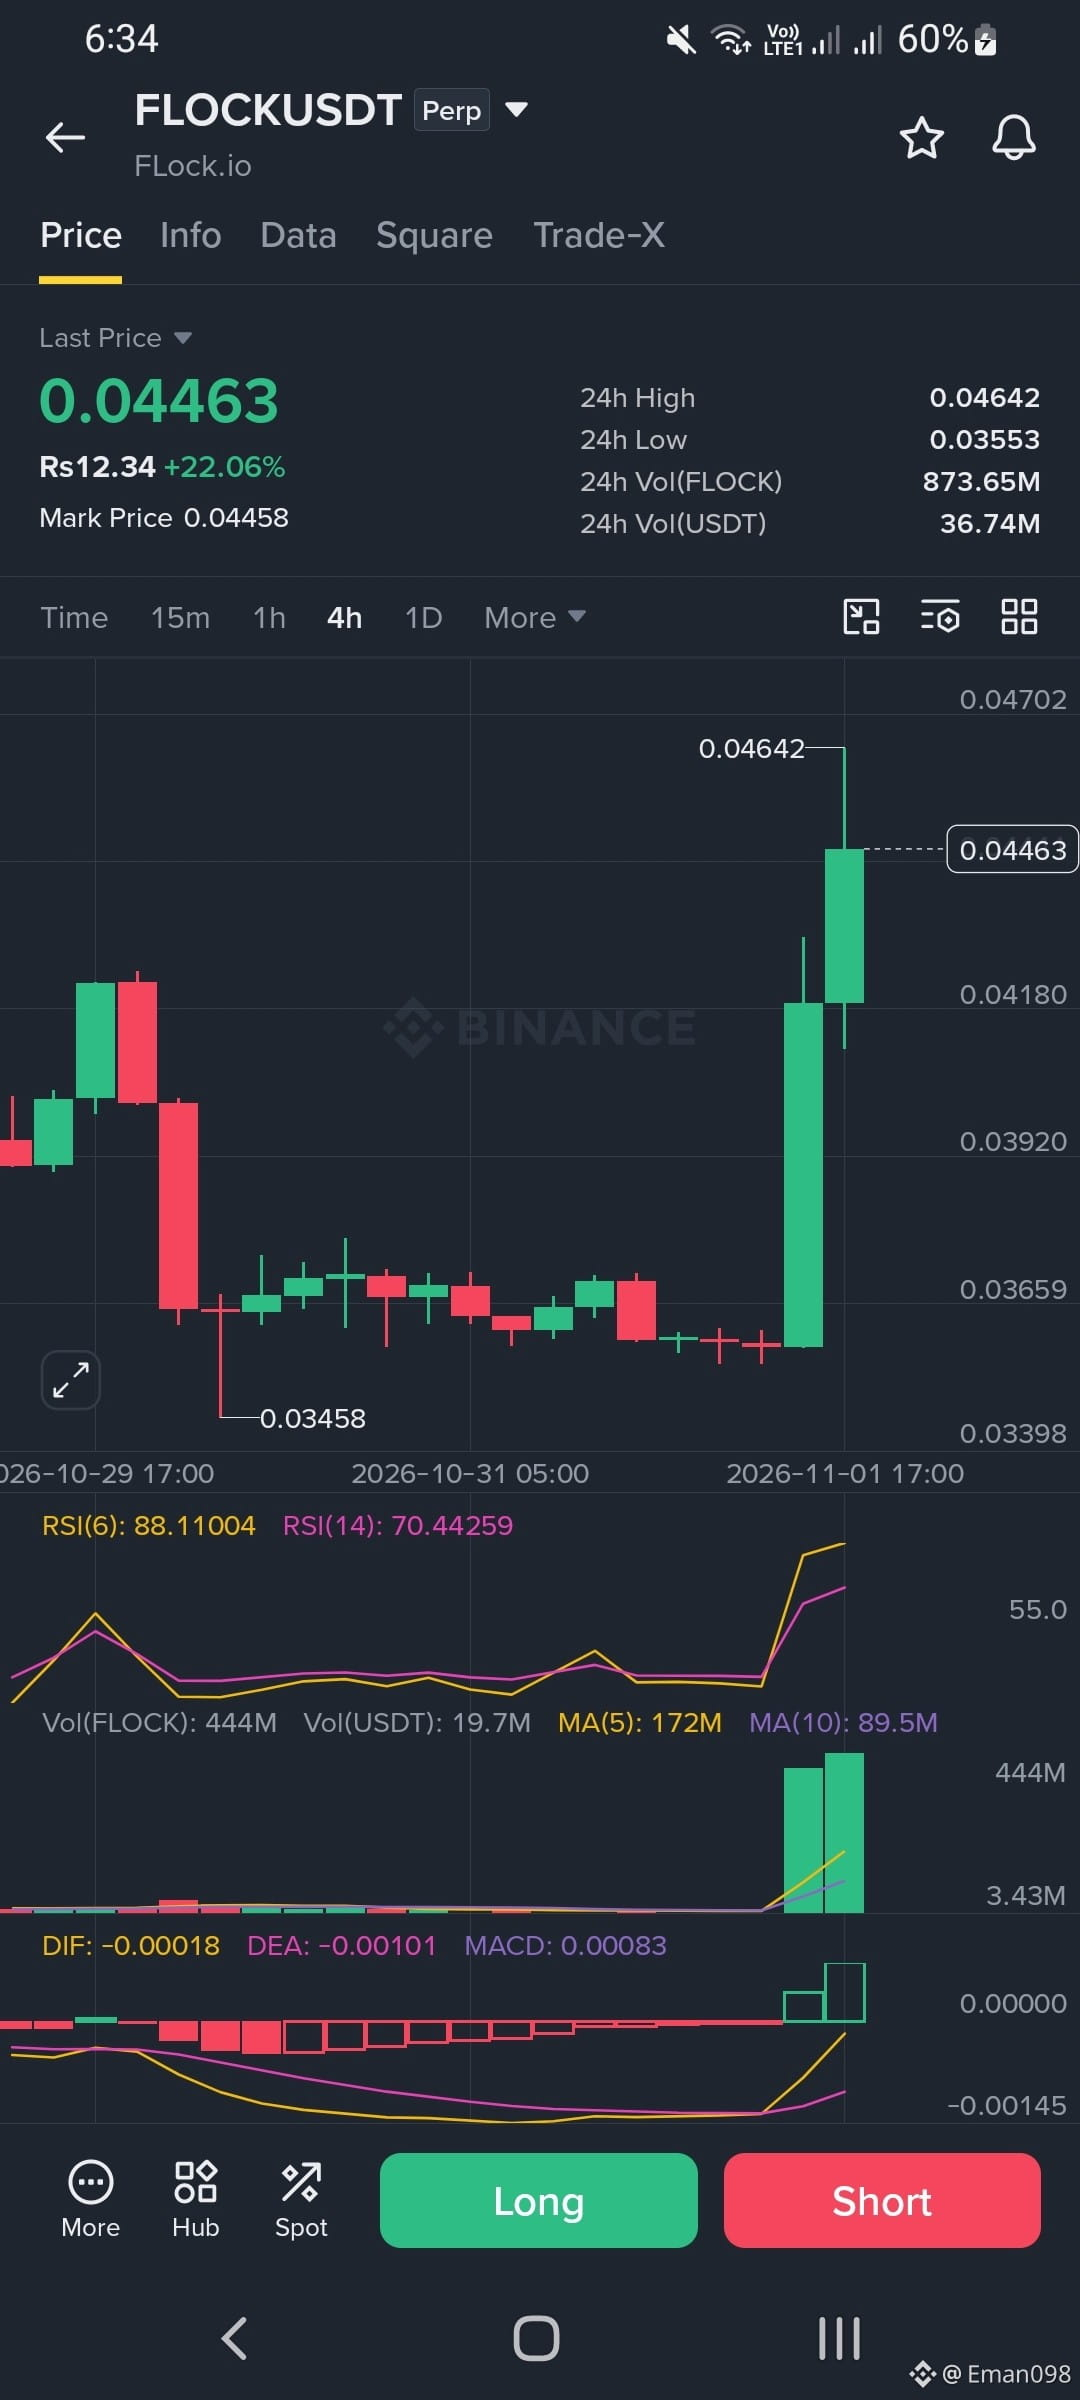
$FLOCK just ripped about 22 percent on the 4h chart and honestly it looks hot. Price sits at 0.04463 after a huge green candle with big volume behind it. RSI is 88 on the fast line so it is stretched. Best support is 0.04180 and then 0.03920 if it dumps. Resistance is 0.04642 which is the recent high and a clean break opens 0.04702. I would not chase here. Wait for a small pullback toward 0.04180 and watch how it reacts. Pumps like this can reverse fast so use a tight stop.
$FLOCK
#AnalyseCrypto
$FLOCK just ripped about 22 percent on the 4h chart and honestly it looks hot. Price sits at 0.04463 after a huge green candle with big volume behind it. RSI is 88 on the fast line so it is stretched. Best support is 0.04180 and then 0.03920 if it dumps. Resistance is 0.04642 which is the recent high and a clean break opens 0.04702. I would not chase here. Wait for a small pullback toward 0.04180 and watch how it reacts. Pumps like this can reverse fast so use a tight stop.
$FLOCK
#AnalyseCrypto
$FLOCK
#AnalyseCrypto
5
493
·
--
$JCT USDT Analysis (4H)
{future}(JCTUSDT)
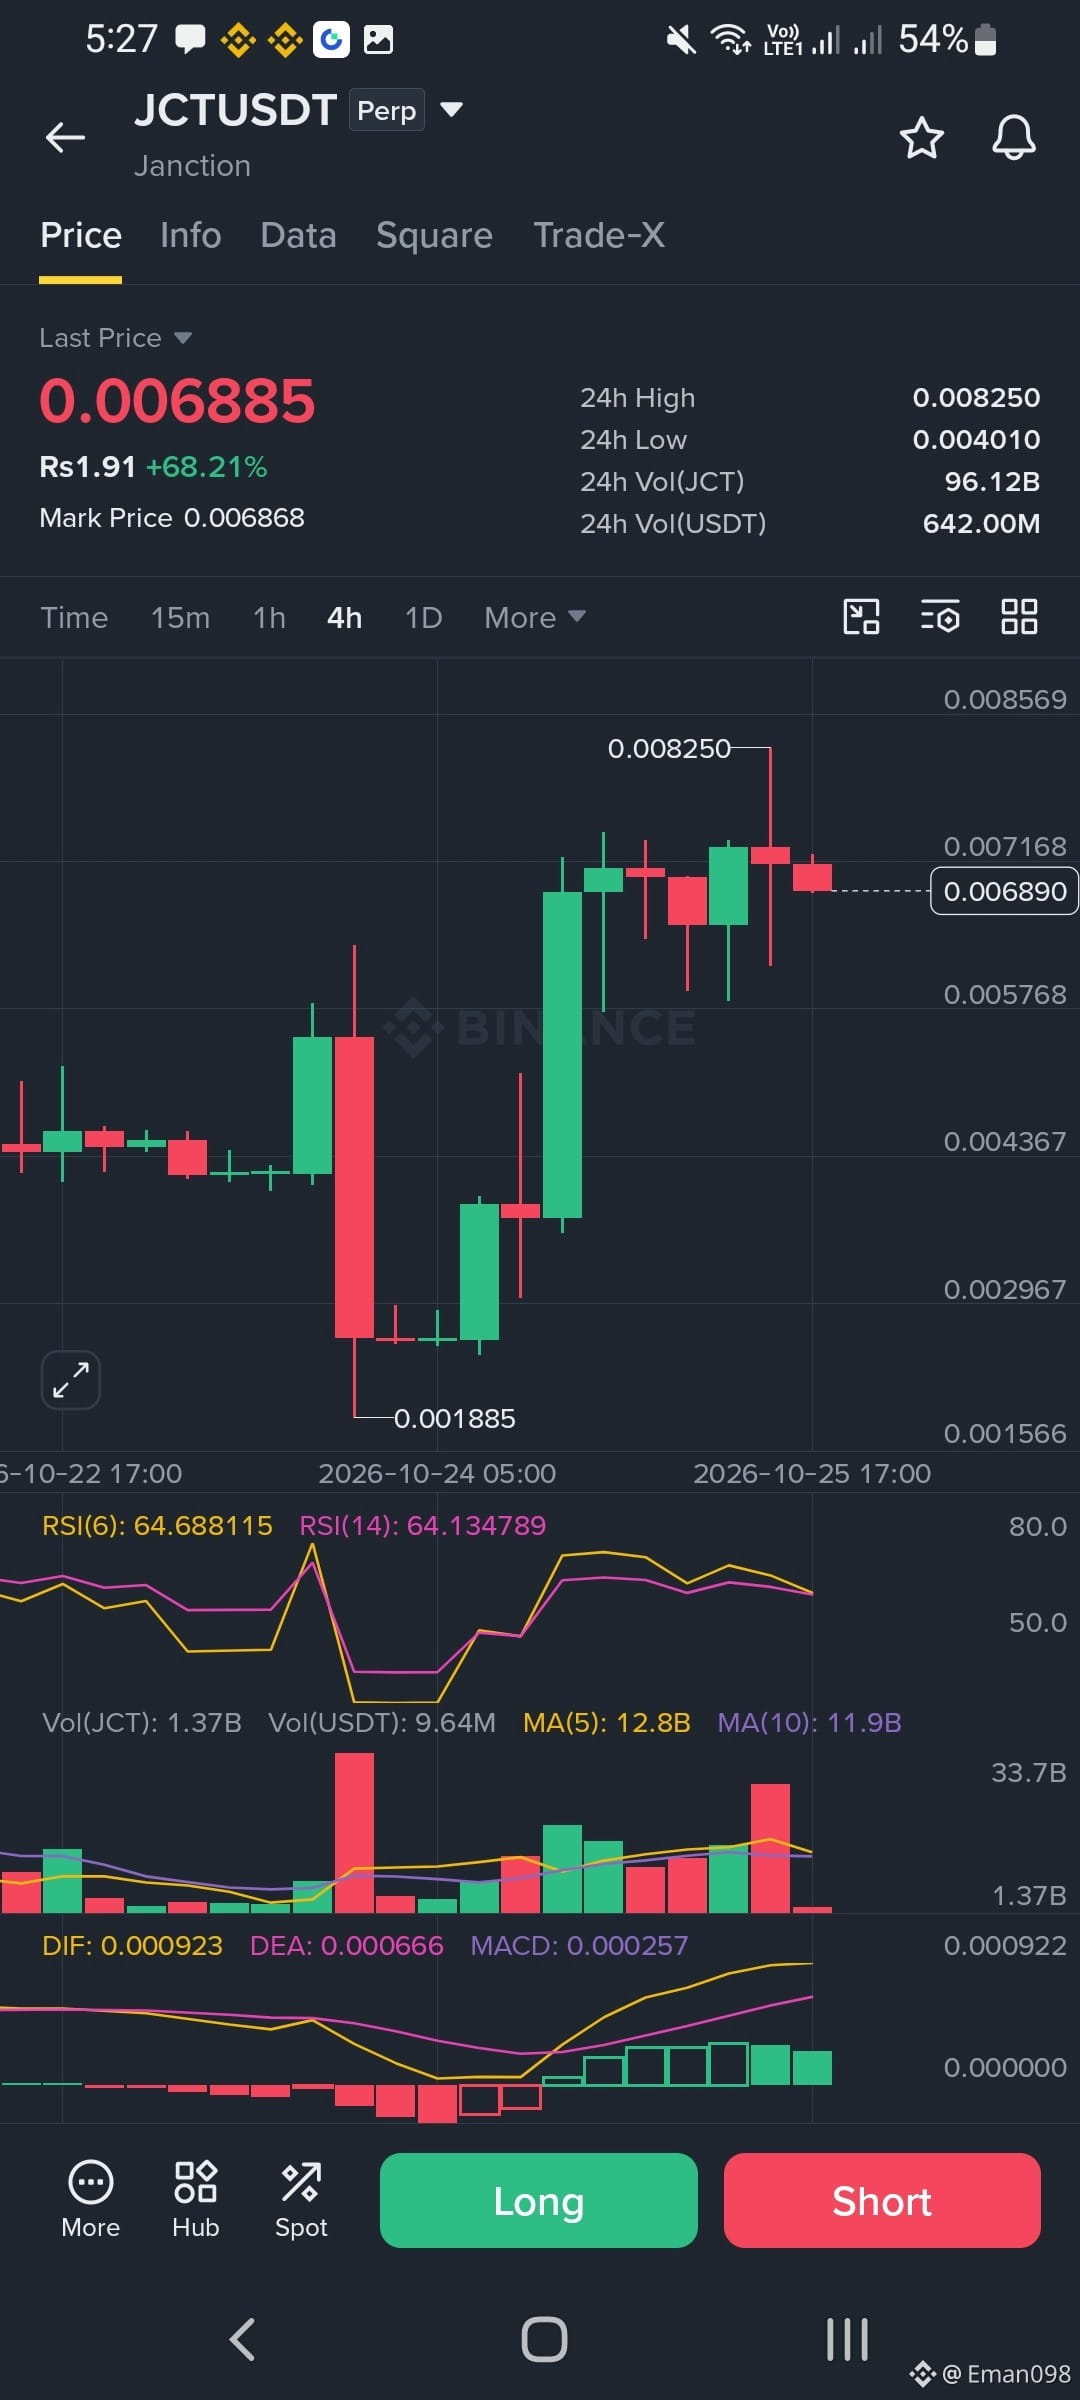
JCT is up about 68% on the day, climbing from a low near 0.0040 to a high of 0.00825. That peak candle left a long upper wick, so sellers clearly defended the top. Price has since slipped to 0.00689 with two red candles in a row, which shows momentum cooling. RSI sits around 64 so it is not overheated, and MACD is still positive with green bars. The latest volume spike came on a red candle though, which worries me a little. I would watch 0.0072 as resistance. Holding 0.0062 keeps the trend healthy, while a drop below it invites a deeper pullback.
Not financial advice. DYOR.
#jct #EarningsSeason #AnalyseCrypto
$JCT USDT Analysis (4H)
JCT is up about 68% on the day, climbing from a low near 0.0040 to a high of 0.00825. That peak candle left a long upper wick, so sellers clearly defended the top. Price has since slipped to 0.00689 with two red candles in a row, which shows momentum cooling. RSI sits around 64 so it is not overheated, and MACD is still positive with green bars. The latest volume spike came on a red candle though, which worries me a little. I would watch 0.0072 as resistance. Holding 0.0062 keeps the trend healthy, while a drop below it invites a deeper pullback.
Not financial advice. DYOR.
#jct #EarningsSeason #AnalyseCrypto
JCT is up about 68% on the day, climbing from a low near 0.0040 to a high of 0.00825. That peak candle left a long upper wick, so sellers clearly defended the top. Price has since slipped to 0.00689 with two red candles in a row, which shows momentum cooling. RSI sits around 64 so it is not overheated, and MACD is still positive with green bars. The latest volume spike came on a red candle though, which worries me a little. I would watch 0.0072 as resistance. Holding 0.0062 keeps the trend healthy, while a drop below it invites a deeper pullback.
Not financial advice. DYOR.
#jct #EarningsSeason #AnalyseCrypto
8
430

·
--
Article
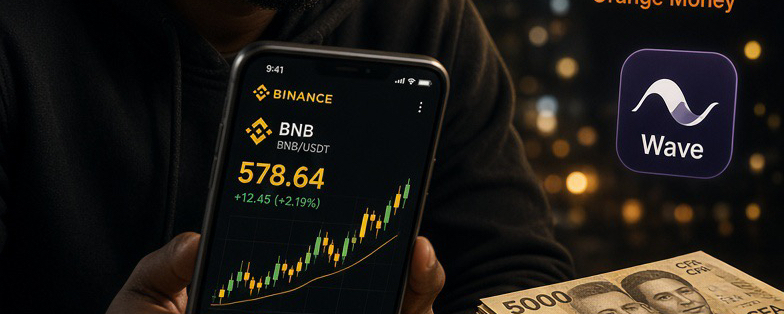
bullish trendHow I analyzed the crypto market with just 5,000 FCFA and why I chose BNB
Many people think you need a lot of money to get started in crypto.
I only had 5,000 FCFA.
But the amount isn’t what matters most.
It’s the training and discipline.
Here’s exactly what I did.
1. Market analysis (last 4 weeks)
The market is currently in a consolidation phase.
Bitcoin is hovering around $80,000–$82,000, Ethereum is weaker, and many altcoins are struggling.
bullish trend
How I analyzed the crypto market with just 5,000 FCFA and why I chose BNB
Many people think you need a lot of money to get started in crypto.
I only had 5,000 FCFA.
But the amount isn’t what matters most.
It’s the training and discipline.
Here’s exactly what I did.
1. Market analysis (last 4 weeks)
The market is currently in a consolidation phase.
Bitcoin is hovering around $80,000–$82,000, Ethereum is weaker, and many altcoins are struggling.
Many people think you need a lot of money to get started in crypto.
I only had 5,000 FCFA.
But the amount isn’t what matters most.
It’s the training and discipline.
Here’s exactly what I did.
1. Market analysis (last 4 weeks)
The market is currently in a consolidation phase.
Bitcoin is hovering around $80,000–$82,000, Ethereum is weaker, and many altcoins are struggling.
71
·
--
$SNXX
{future}(SNXXUSDT)
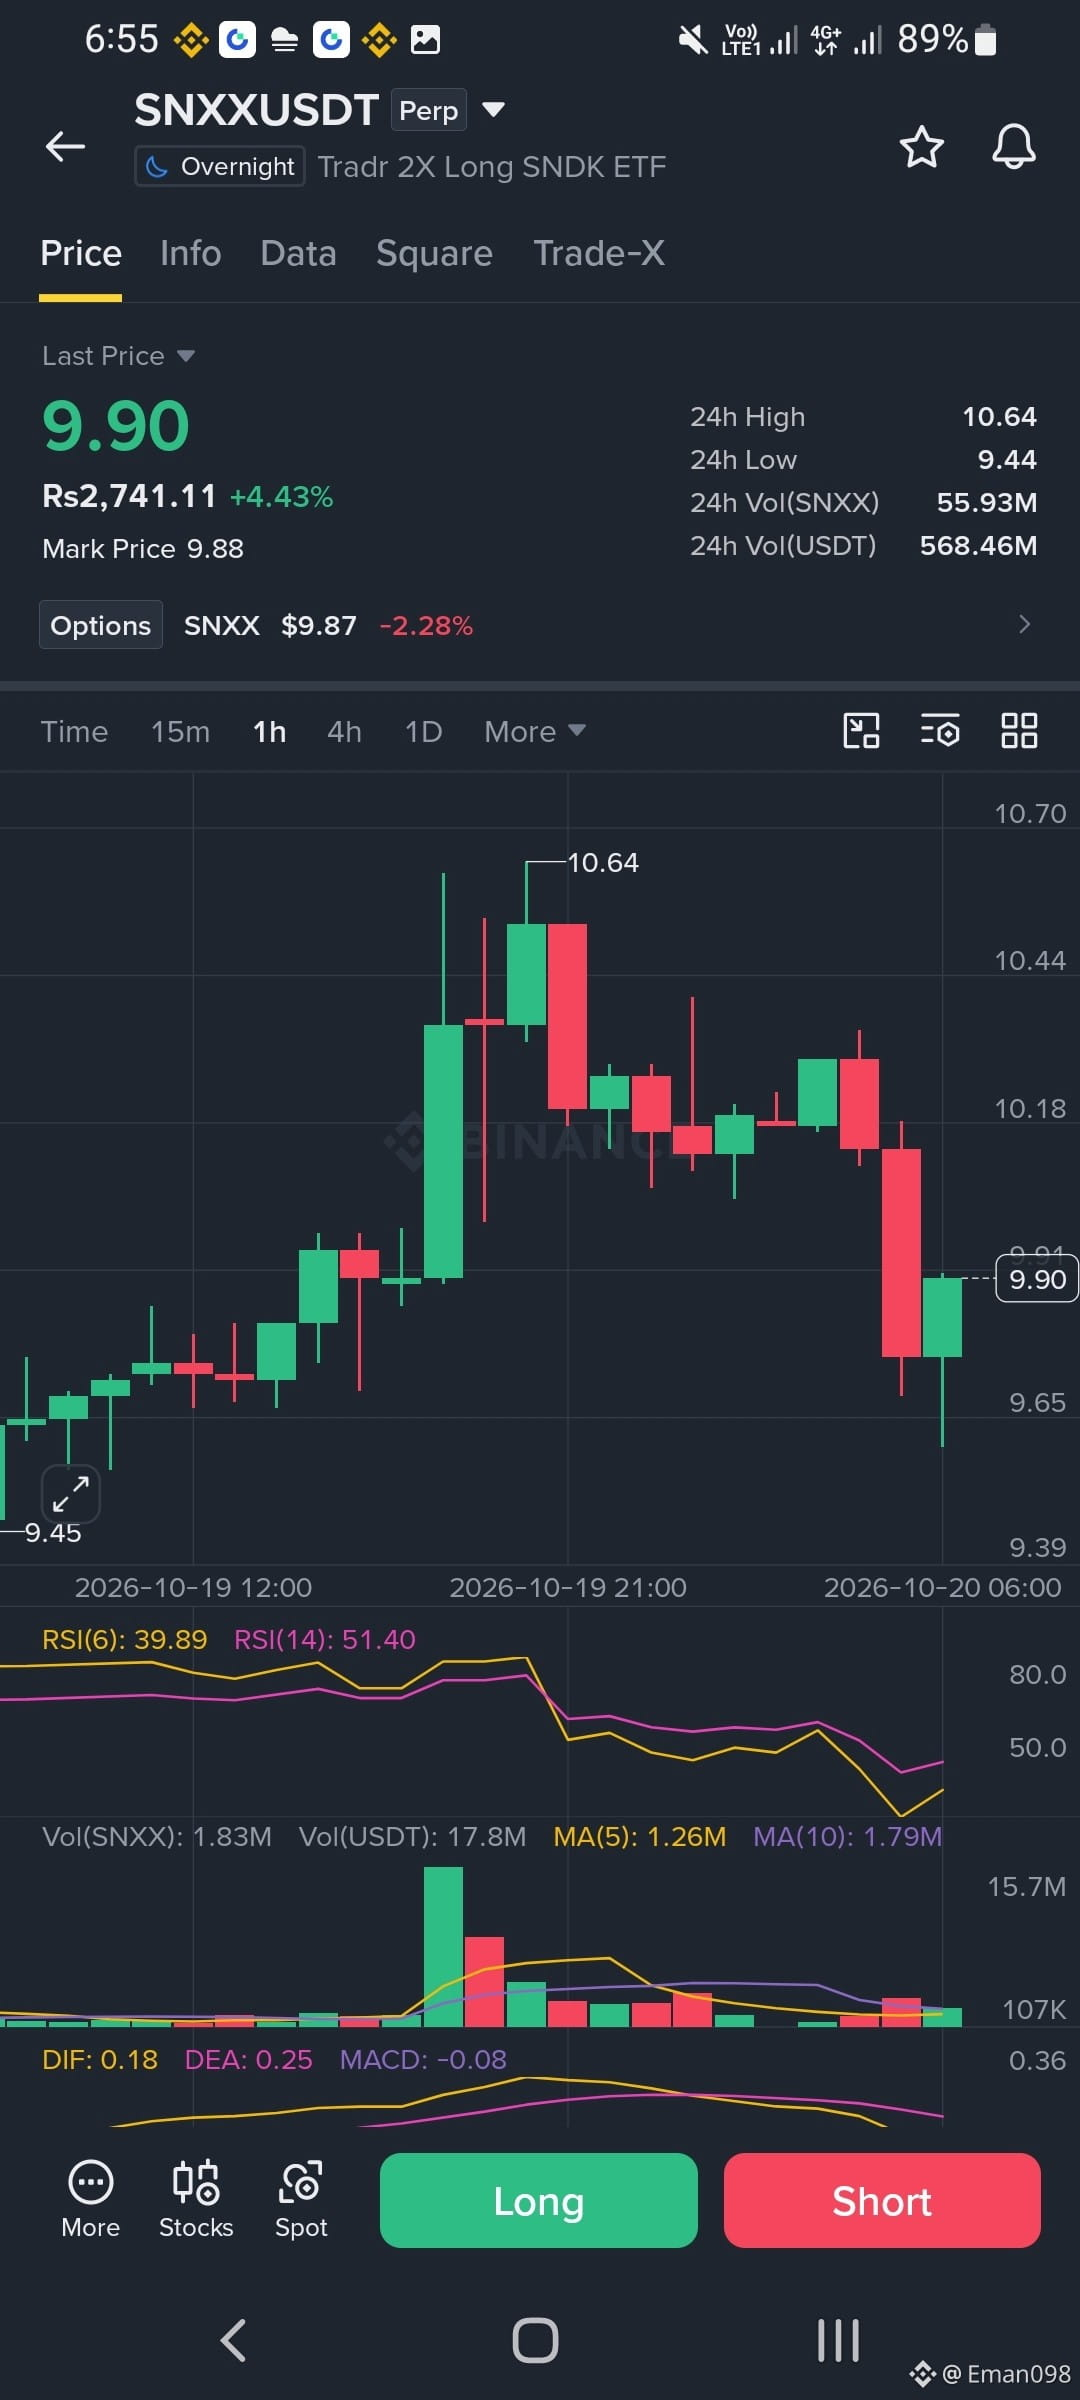
is hovering near 9.88 after a sharp bounce from the 8.43 low. Price is still sitting under the 25 MA near 10.11 and the Supertrend at 10.00 so buyers have not fully won yet. A clean rejection there could pull it back toward 9.29. A close above 10.64 would flip my view. Wait for confirmation and manage risk. Not financial advice.
#AnalyseCrypto
$SNXX
is hovering near 9.88 after a sharp bounce from the 8.43 low. Price is still sitting under the 25 MA near 10.11 and the Supertrend at 10.00 so buyers have not fully won yet. A clean rejection there could pull it back toward 9.29. A close above 10.64 would flip my view. Wait for confirmation and manage risk. Not financial advice.
#AnalyseCrypto
is hovering near 9.88 after a sharp bounce from the 8.43 low. Price is still sitting under the 25 MA near 10.11 and the Supertrend at 10.00 so buyers have not fully won yet. A clean rejection there could pull it back toward 9.29. A close above 10.64 would flip my view. Wait for confirmation and manage risk. Not financial advice.
#AnalyseCrypto
4
457

Stop scrolling 👇🏻👇🏻👇🏻
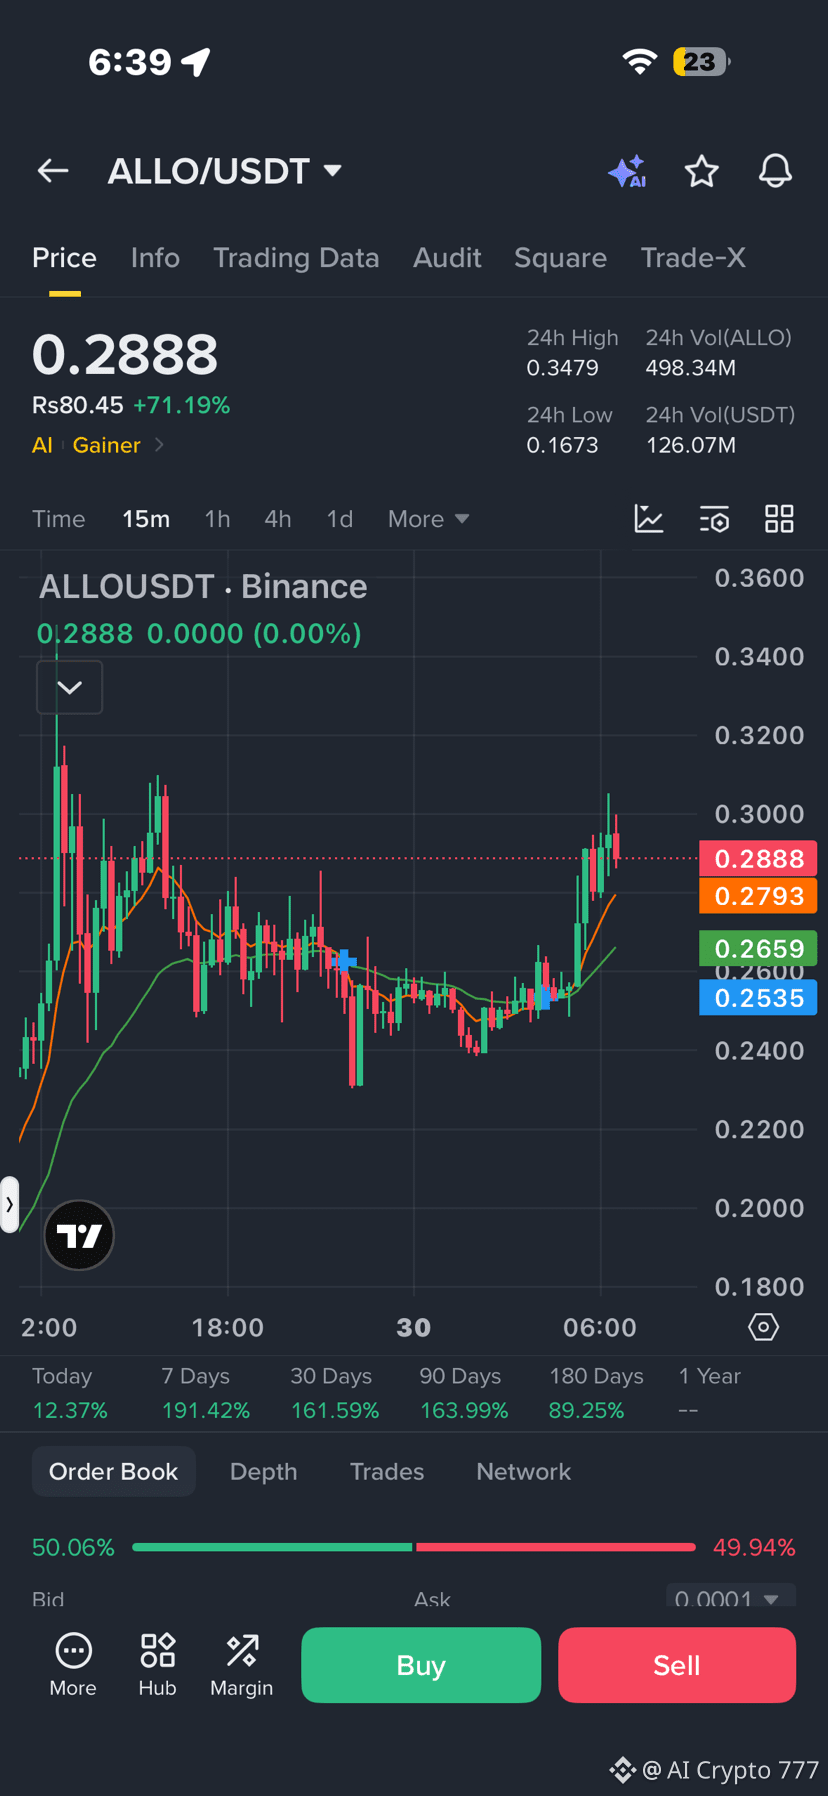
$ALLO is up +155% in 24h… and the chart is starting to look less like “random hype” and more like structured aggression.
From ~$0.089 to ~$0.24 highs — that’s not a slow grind, that’s a full market reset in a single session. What stands out isn’t just the move, it’s how it moved.
No single vertical candle and instant dump. Instead: clean stair-steps, higher lows, controlled pullbacks… and then an acceleration phase where price broke into fresh highs like liquidity was getting absorbed on every dip.
Volume confirms the story:
$3B+ ALLO traded in 24h, with massive USDT flow backing the move. This isn’t a ghost pump — participation is real.
Current price still hovering near highs after a triple-digit run, which puts the market in an uncomfortable zone.
Now the shift:
After +150% in a day, momentum is no longer free — it becomes contested. Early buyers protect profits, late buyers chase momentum, and volatility starts to expand in both directions.
Key zone:
Holding above $0.22–$0.23 keeps the structure bullish.
Lose it, and this turns from “trend expansion” into “liquidity grab.”
Right now, bulls still control the structure…
But this is exactly the kind of chart where control quietly rotates before most people notice. 👀📉
Trade $ALLO here 👇🏻👇🏻👇🏻
#trading #crypto #binance #AnalyseCrypto
Stop scrolling 👇🏻👇🏻👇🏻
$ALLO is up +155% in 24h… and the chart is starting to look less like “random hype” and more like structured aggression.
From ~$0.089 to ~$0.24 highs — that’s not a slow grind, that’s a full market reset in a single session. What stands out isn’t just the move, it’s how it moved.
No single vertical candle and instant dump. Instead: clean stair-steps, higher lows, controlled pullbacks… and then an acceleration phase where price broke into fresh highs like liquidity was getting absorbed on every dip.
Volume confirms the story:
$3B+ ALLO traded in 24h, with massive USDT flow backing the move. This isn’t a ghost pump — participation is real.
Current price still hovering near highs after a triple-digit run, which puts the market in an uncomfortable zone.
Now the shift:
After +150% in a day, momentum is no longer free — it becomes contested. Early buyers protect profits, late buyers chase momentum, and volatility starts to expand in both directions.
Key zone:
Holding above $0.22–$0.23 keeps the structure bullish.
Lose it, and this turns from “trend expansion” into “liquidity grab.”
Right now, bulls still control the structure…
But this is exactly the kind of chart where control quietly rotates before most people notice. 👀📉
Trade $ALLO here 👇🏻👇🏻👇🏻
#trading #crypto #binance #AnalyseCrypto
$ALLO is up +155% in 24h… and the chart is starting to look less like “random hype” and more like structured aggression.
From ~$0.089 to ~$0.24 highs — that’s not a slow grind, that’s a full market reset in a single session. What stands out isn’t just the move, it’s how it moved.
No single vertical candle and instant dump. Instead: clean stair-steps, higher lows, controlled pullbacks… and then an acceleration phase where price broke into fresh highs like liquidity was getting absorbed on every dip.
Volume confirms the story:
$3B+ ALLO traded in 24h, with massive USDT flow backing the move. This isn’t a ghost pump — participation is real.
Current price still hovering near highs after a triple-digit run, which puts the market in an uncomfortable zone.
Now the shift:
After +150% in a day, momentum is no longer free — it becomes contested. Early buyers protect profits, late buyers chase momentum, and volatility starts to expand in both directions.
Key zone:
Holding above $0.22–$0.23 keeps the structure bullish.
Lose it, and this turns from “trend expansion” into “liquidity grab.”
Right now, bulls still control the structure…
But this is exactly the kind of chart where control quietly rotates before most people notice. 👀📉
Trade $ALLO here 👇🏻👇🏻👇🏻
#trading #crypto #binance #AnalyseCrypto
10
1
841

·
--
Bearish
DONT miss this akt coin for big profit ✅
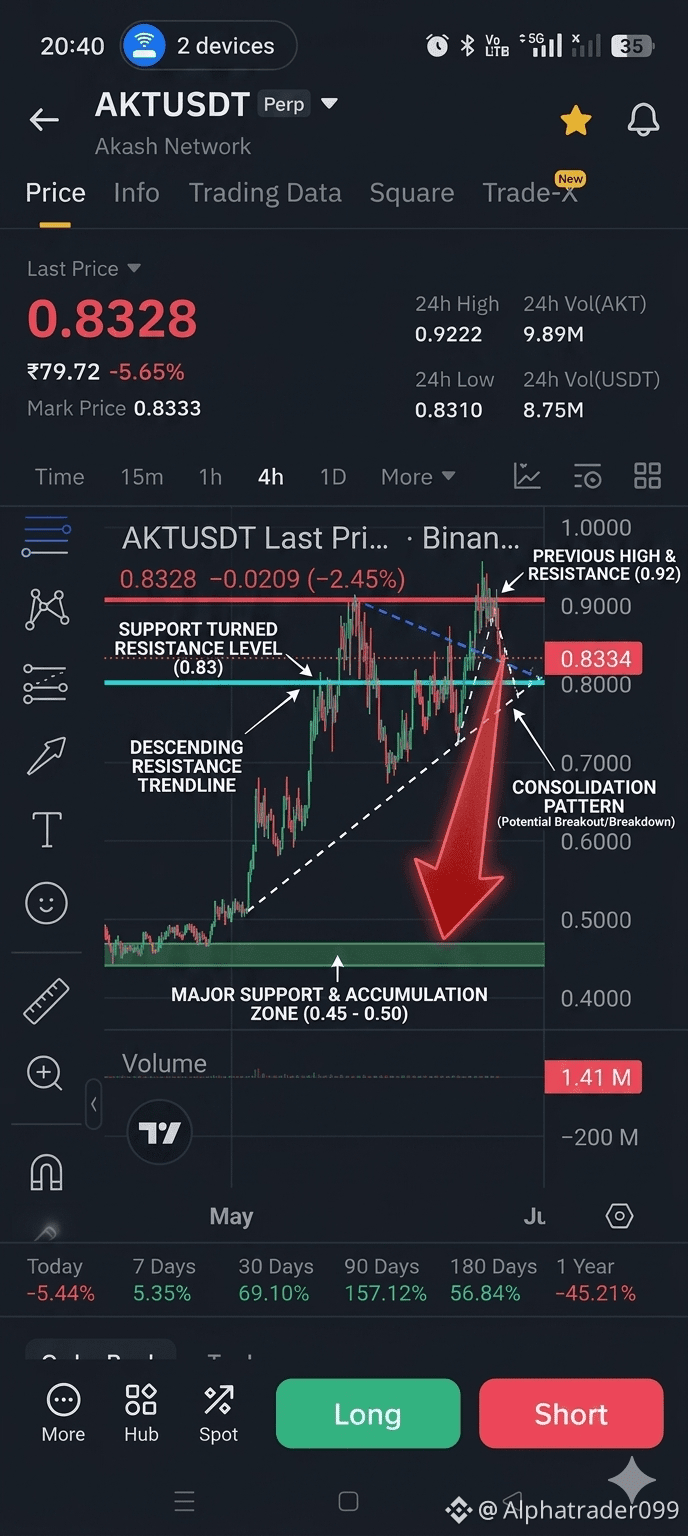
🚨 AKT/USDT 4H Outlook: Crucial Level to Watch! 📉Down Trend 📈
$AKT has rejected from the $0.92 previous high/resistance zone and is currently testing a key consolidation pattern on the 4-Hour timeframe.
• Immediate Support: Watching the $0.83 level closely (Support turned Resistance). If it fails to hold, we might see further downside towards the major macro accumulation zone ($0.45 - $0.50).
$AKT
#Binance #trading #AnalyseCrypto
DONT miss this akt coin for big profit ✅
🚨 AKT/USDT 4H Outlook: Crucial Level to Watch! 📉Down Trend 📈
$AKT has rejected from the $0.92 previous high/resistance zone and is currently testing a key consolidation pattern on the 4-Hour timeframe.
• Immediate Support: Watching the $0.83 level closely (Support turned Resistance). If it fails to hold, we might see further downside towards the major macro accumulation zone ($0.45 - $0.50).
$AKT
#Binance #trading #AnalyseCrypto
🚨 AKT/USDT 4H Outlook: Crucial Level to Watch! 📉Down Trend 📈
$AKT has rejected from the $0.92 previous high/resistance zone and is currently testing a key consolidation pattern on the 4-Hour timeframe.
• Immediate Support: Watching the $0.83 level closely (Support turned Resistance). If it fails to hold, we might see further downside towards the major macro accumulation zone ($0.45 - $0.50).
$AKT
#Binance #trading #AnalyseCrypto
2
73

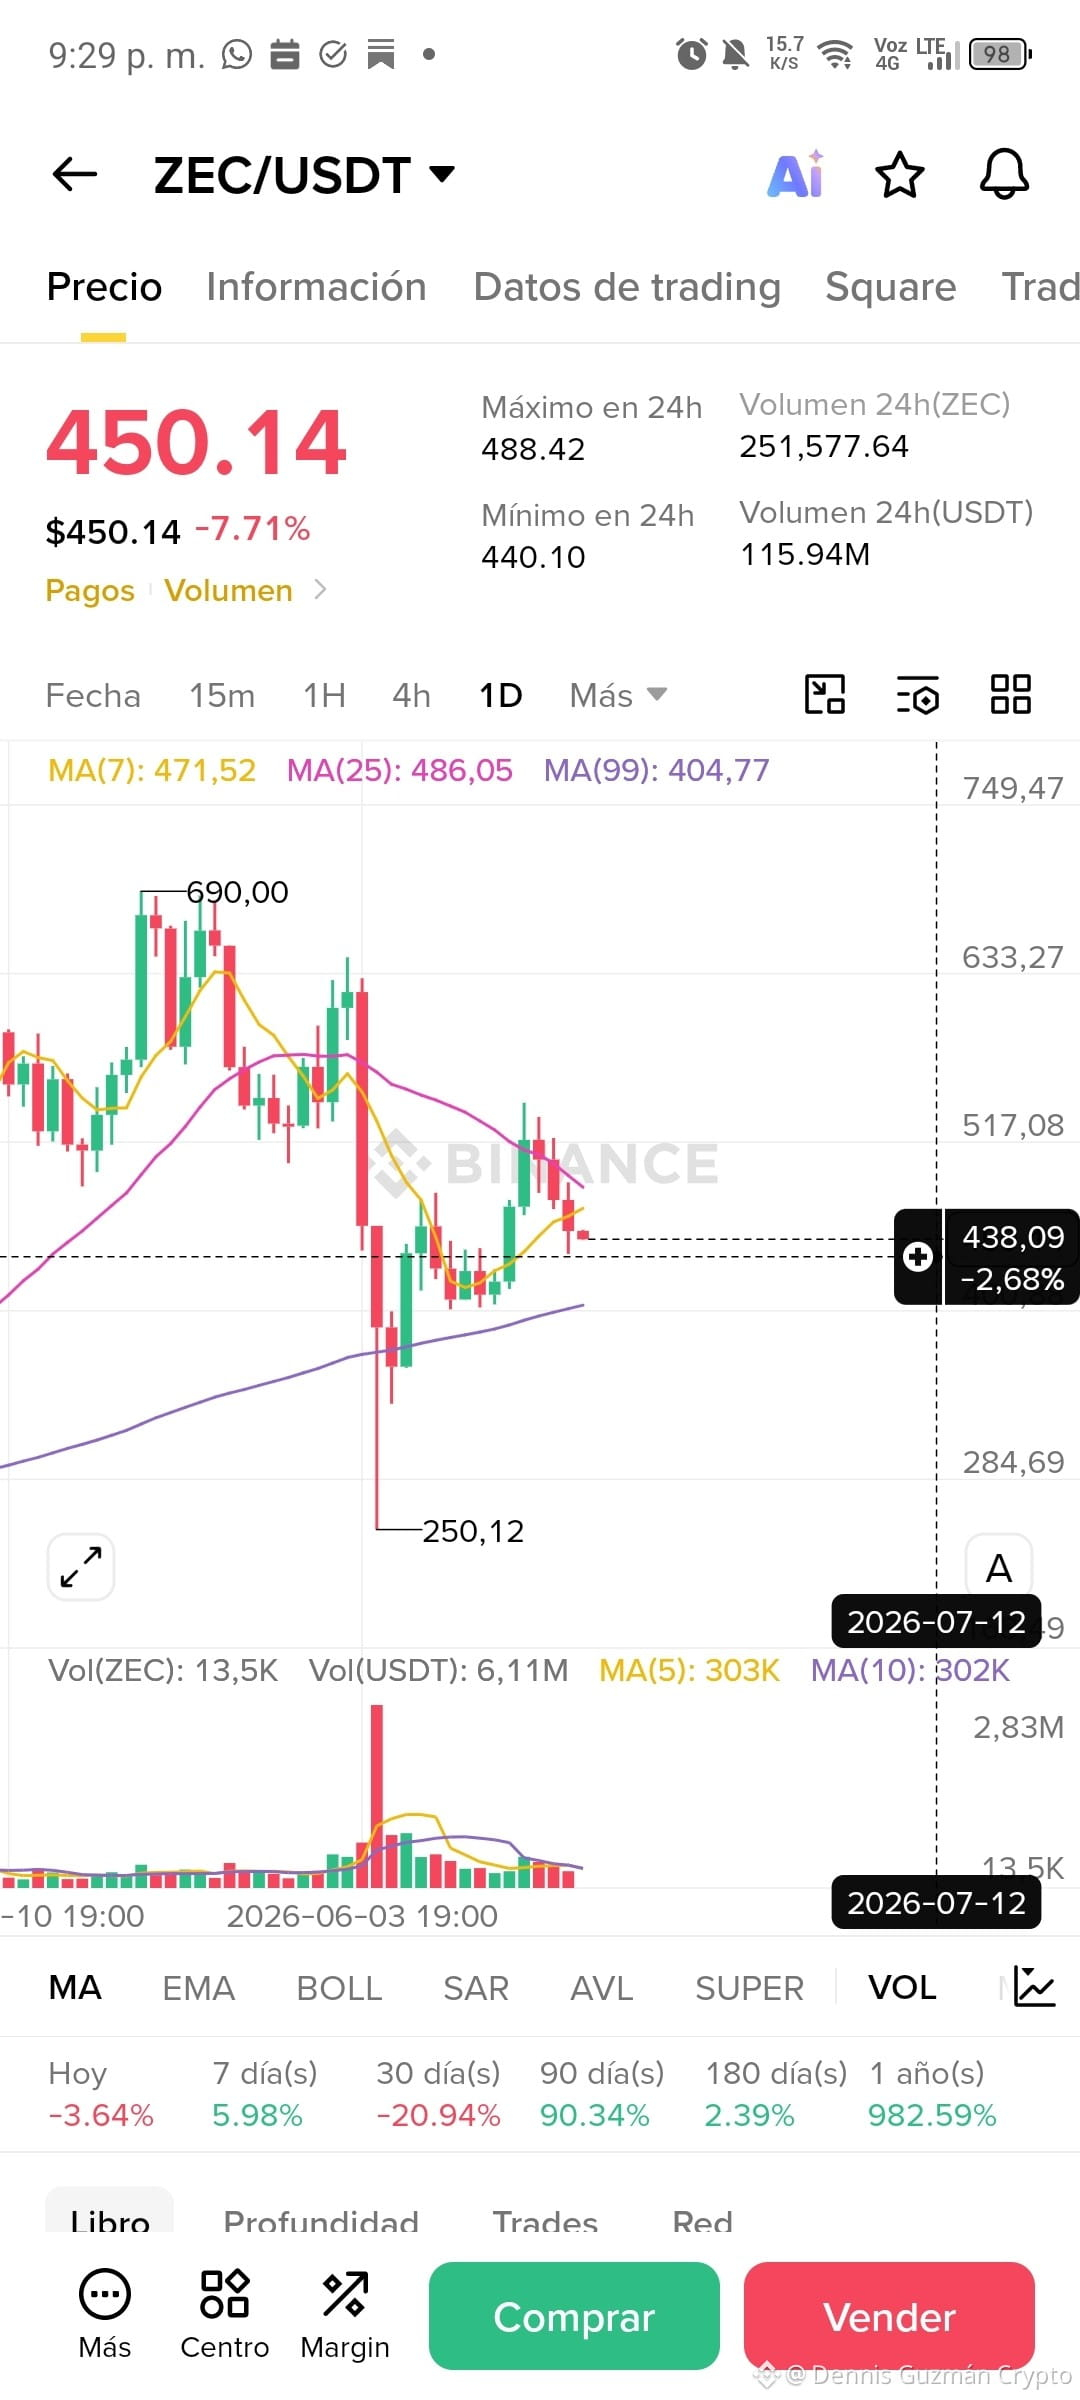
$ZEC experienced one of the wildest moves in the group, and the story is still unfolding.
From the peak of 690.00, the price plummeted to 250.12, a drop of over 63% in no time. From there, it bounced back strongly and is now trading at 450.14, recovering a good chunk of the lost ground.
{future}(ZECUSDT)
The 99 MA is still climbing (404.77) and the price is above it, suggesting that the bottom structure isn't as damaged as it seems at first glance. However, today the price is down -7.71% and is losing the MA7 (471.52) and MA25 (486.05).
If the price holds above 404.77, the bounce remains intact. If it loses that level, the 250.12 zone comes back into play.
🎯 486.05
🎯 517.08
💣 633.27 if the momentum supports it
(+confirmations )
Stop below 404.77. Invalidated: daily close below that level with force.
Movements of this magnitude don't give warnings when they reverse. Always tight management.
I'm still on screen.
$ZEC #ZECUSDT #AnalyseCrypto
$ZEC experienced one of the wildest moves in the group, and the story is still unfolding.
From the peak of 690.00, the price plummeted to 250.12, a drop of over 63% in no time. From there, it bounced back strongly and is now trading at 450.14, recovering a good chunk of the lost ground.
The 99 MA is still climbing (404.77) and the price is above it, suggesting that the bottom structure isn't as damaged as it seems at first glance. However, today the price is down -7.71% and is losing the MA7 (471.52) and MA25 (486.05).
If the price holds above 404.77, the bounce remains intact. If it loses that level, the 250.12 zone comes back into play.
🎯 486.05
🎯 517.08
💣 633.27 if the momentum supports it
(+confirmations )
Stop below 404.77. Invalidated: daily close below that level with force.
Movements of this magnitude don't give warnings when they reverse. Always tight management.
I'm still on screen.
$ZEC #ZECUSDT #AnalyseCrypto
From the peak of 690.00, the price plummeted to 250.12, a drop of over 63% in no time. From there, it bounced back strongly and is now trading at 450.14, recovering a good chunk of the lost ground.
The 99 MA is still climbing (404.77) and the price is above it, suggesting that the bottom structure isn't as damaged as it seems at first glance. However, today the price is down -7.71% and is losing the MA7 (471.52) and MA25 (486.05).
If the price holds above 404.77, the bounce remains intact. If it loses that level, the 250.12 zone comes back into play.
🎯 486.05
🎯 517.08
💣 633.27 if the momentum supports it
(+confirmations )
Stop below 404.77. Invalidated: daily close below that level with force.
Movements of this magnitude don't give warnings when they reverse. Always tight management.
I'm still on screen.
$ZEC #ZECUSDT #AnalyseCrypto
2
82

·
--
📈 The market is calm… but for how long?
Currently, the market appears to be in a consolidation phase. Prices are moving without a clear direction, as if the market is still looking for the next move.
⚠️ The 3rd and 4th week of the month could be particularly interesting to watch. An increase in volatility could occur, but the direction remains uncertain.
🎯 For investors and traders, the most important thing is therefore not to rush. Let’s monitor volumes, key levels, and above all the price reaction before making a decision.
The market can be calm today… and very volatile tomorrow.
#AnalyseCrypto
$BTC , $ETH , $PAXG
{spot}(BTCUSDT)
{spot}(ETHUSDT)
{spot}(PAXGUSDT)
📈 The market is calm… but for how long?
Currently, the market appears to be in a consolidation phase. Prices are moving without a clear direction, as if the market is still looking for the next move.
⚠️ The 3rd and 4th week of the month could be particularly interesting to watch. An increase in volatility could occur, but the direction remains uncertain.
🎯 For investors and traders, the most important thing is therefore not to rush. Let’s monitor volumes, key levels, and above all the price reaction before making a decision.
The market can be calm today… and very volatile tomorrow.
#AnalyseCrypto
$BTC , $ETH , $PAXG
Currently, the market appears to be in a consolidation phase. Prices are moving without a clear direction, as if the market is still looking for the next move.
⚠️ The 3rd and 4th week of the month could be particularly interesting to watch. An increase in volatility could occur, but the direction remains uncertain.
🎯 For investors and traders, the most important thing is therefore not to rush. Let’s monitor volumes, key levels, and above all the price reaction before making a decision.
The market can be calm today… and very volatile tomorrow.
#AnalyseCrypto
$BTC , $ETH , $PAXG
1
108

PAXG/USDT Analysis — Daily and Weekly View
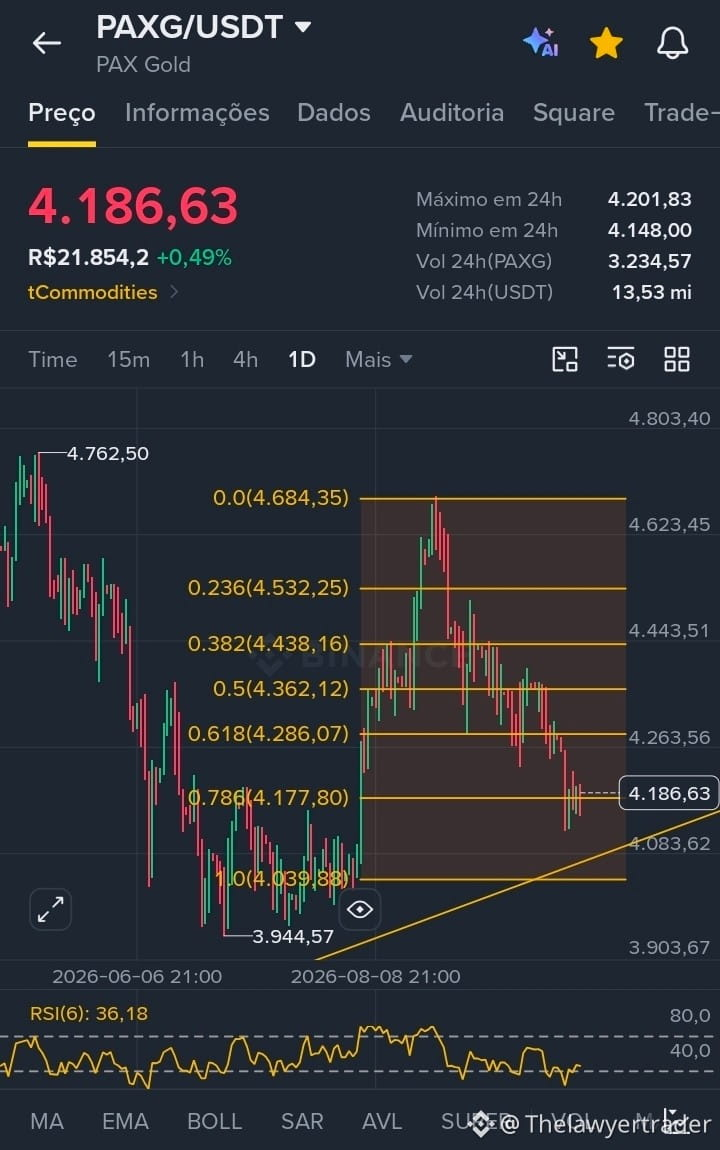
PAXG/USDT trades at 4,186.63, in a technical transition phase. On the daily chart, the asset formed a structure of lower highs and lower lows after reaching the peak at 4,684.35, and the break of the 0.618 level (4,286.07) confirmed recent selling pressure.
Price finds immediate support at the 0.786 level (4,177.80) of the Fibonacci retracement, with the low at 4,039.88 just below it as the strongest defense zone. The RSI(6) at 36.18 indicates selling strength nearing exhaustion, close to the oversold region, which suggests limited room for immediate further declines, although there is still no clear bullish reversal signal.
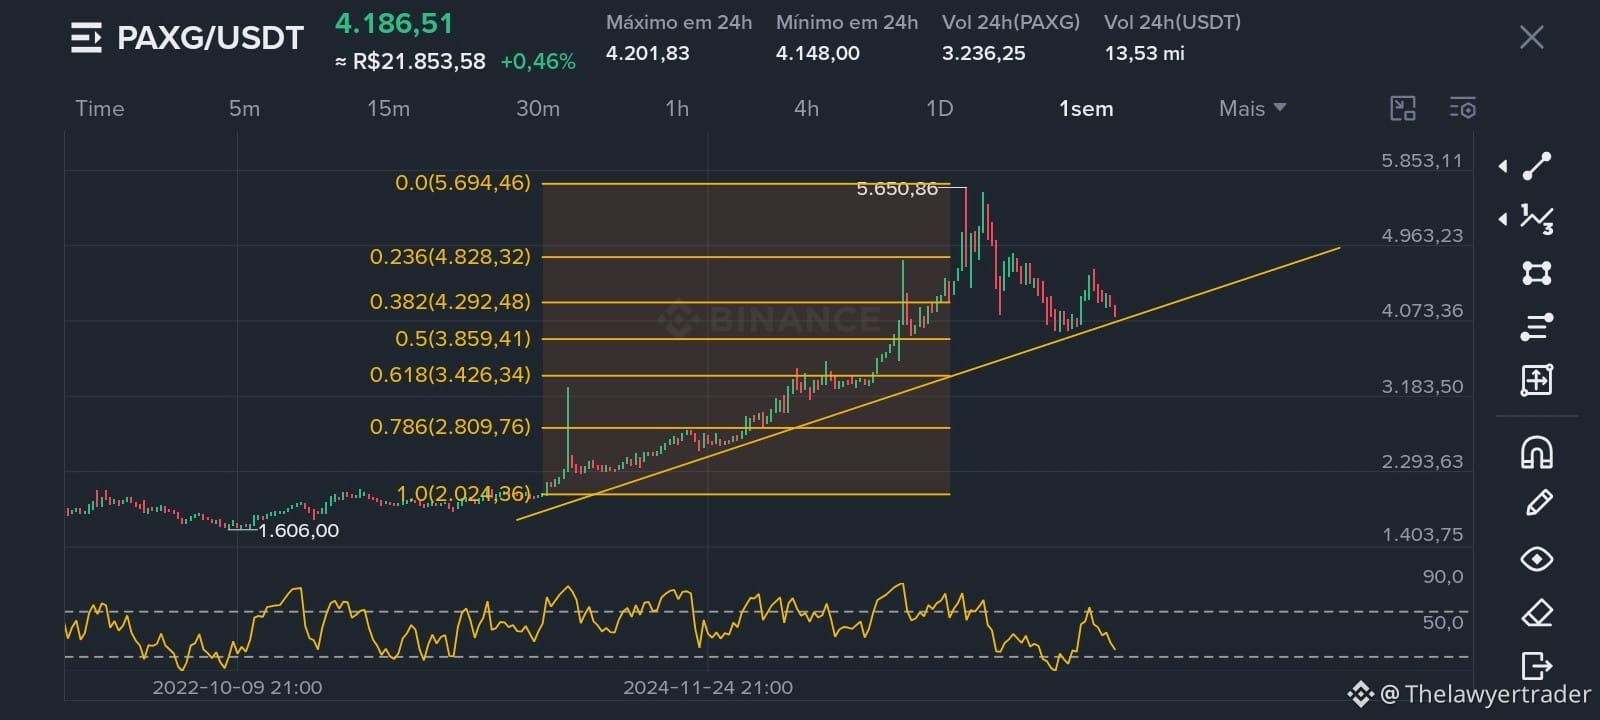
In the weekly context, the asset remains within a long-term bullish structure, supported by an upward trendline that acts as support, and the oscillator stays near the midline without extremes of overbought or oversold. This indicates that the current daily correction is occurring within an overall still constructive scenario.
Visible pattern and probability: the daily setup suggests a possible consolidation/recovery from support at 4,177.80, with a moderate probability of a short-term bullish reaction if price holds this level. Confirmation would come with a return above 4,286.07; the scenario would be invalidated with a close below 4,039.88.
Technical analysis based on the available 1D and weekly charts.
This is not investment advice. Do your own research (DYOR) before deciding.
#PAXG #AnalyseCrypto $SOL
PAXG/USDT Analysis — Daily and Weekly View
PAXG/USDT trades at 4,186.63, in a technical transition phase. On the daily chart, the asset formed a structure of lower highs and lower lows after reaching the peak at 4,684.35, and the break of the 0.618 level (4,286.07) confirmed recent selling pressure.
Price finds immediate support at the 0.786 level (4,177.80) of the Fibonacci retracement, with the low at 4,039.88 just below it as the strongest defense zone. The RSI(6) at 36.18 indicates selling strength nearing exhaustion, close to the oversold region, which suggests limited room for immediate further declines, although there is still no clear bullish reversal signal.
In the weekly context, the asset remains within a long-term bullish structure, supported by an upward trendline that acts as support, and the oscillator stays near the midline without extremes of overbought or oversold. This indicates that the current daily correction is occurring within an overall still constructive scenario.
Visible pattern and probability: the daily setup suggests a possible consolidation/recovery from support at 4,177.80, with a moderate probability of a short-term bullish reaction if price holds this level. Confirmation would come with a return above 4,286.07; the scenario would be invalidated with a close below 4,039.88.
Technical analysis based on the available 1D and weekly charts.
This is not investment advice. Do your own research (DYOR) before deciding.
#PAXG #AnalyseCrypto $SOL
PAXG/USDT trades at 4,186.63, in a technical transition phase. On the daily chart, the asset formed a structure of lower highs and lower lows after reaching the peak at 4,684.35, and the break of the 0.618 level (4,286.07) confirmed recent selling pressure.
Price finds immediate support at the 0.786 level (4,177.80) of the Fibonacci retracement, with the low at 4,039.88 just below it as the strongest defense zone. The RSI(6) at 36.18 indicates selling strength nearing exhaustion, close to the oversold region, which suggests limited room for immediate further declines, although there is still no clear bullish reversal signal.
In the weekly context, the asset remains within a long-term bullish structure, supported by an upward trendline that acts as support, and the oscillator stays near the midline without extremes of overbought or oversold. This indicates that the current daily correction is occurring within an overall still constructive scenario.
Visible pattern and probability: the daily setup suggests a possible consolidation/recovery from support at 4,177.80, with a moderate probability of a short-term bullish reaction if price holds this level. Confirmation would come with a return above 4,286.07; the scenario would be invalidated with a close below 4,039.88.
Technical analysis based on the available 1D and weekly charts.
This is not investment advice. Do your own research (DYOR) before deciding.
#PAXG #AnalyseCrypto $SOL
129

·
--
Bearish
📊 BNB/USDT — ICT + Fundamentals Analysis | Oct 6, 2026
💰 Current price: ~781 $ | 24h: -0.5% | 6 months: +29.6% | ATH: -44%
🔍 ICT ANALYSIS
• 4H: Bearish CHoCH after the intraday rejection at 809.99 $ (false break above 800 $ = liquidity grab).
• Bearish OB: 795 – 808 $ — price firmly rejected, falling back below the $796 pivot.
• Upper Bollinger band at 800.97 $ = technical ceiling; lower band at ~753 $ = mean-reversion target.
• Buy-side liquidity: below $760, then a dense pool at $750 – $753.
• Overcrowded derivatives longs ("crowded long") = fuel for a leverage flush before the breakout.
• RSI ~60: bullish momentum, but exhausted at resistance.
🏛️ FUNDAMENTAL ANALYSIS
• 37th quarterly burn expected in mid-October (date not announced) — a catalyst, but probably not tomorrow.
• Growth in tokenized stocks on Binance = increasing BNB utility (medium term).
• Weak spot/ETF demand despite bullish derivatives = divergence = rally not confirmed.
• BNB is correlated with BTC but has its own dynamics: the rejection at 800 $ is primarily technical.
• Tomorrow: no specific BNB catalyst → follows overall risk sentiment (FOMC).
🎯 TOMORROW'S SCENARIO: BEARISH (invalidation: 4H close above $800)
Flush of overcrowded longs toward $760, then a test of the lower band at $750 – $753.
ICT buy zone: 745 – 755 $ (buyer OB + mitigation, ahead of the burn).
If the burn is announced unexpectedly → scenario invalidated, break above 800 $ → $826.
⚠️ Disclaimer: Analysis for educational purposes only, not investment advice. BNB is exposed to regulatory risk and volatility — never invest without risk management. DYOR.
#BNB #BinanceCoin #Burn #ICT #BinanceSquare #AnalyseCrypto
{spot}(BNBUSDT)
📊 BNB/USDT — ICT + Fundamentals Analysis | Oct 6, 2026
💰 Current price: ~781 $ | 24h: -0.5% | 6 months: +29.6% | ATH: -44%
🔍 ICT ANALYSIS
• 4H: Bearish CHoCH after the intraday rejection at 809.99 $ (false break above 800 $ = liquidity grab).
• Bearish OB: 795 – 808 $ — price firmly rejected, falling back below the $796 pivot.
• Upper Bollinger band at 800.97 $ = technical ceiling; lower band at ~753 $ = mean-reversion target.
• Buy-side liquidity: below $760, then a dense pool at $750 – $753.
• Overcrowded derivatives longs ("crowded long") = fuel for a leverage flush before the breakout.
• RSI ~60: bullish momentum, but exhausted at resistance.
🏛️ FUNDAMENTAL ANALYSIS
• 37th quarterly burn expected in mid-October (date not announced) — a catalyst, but probably not tomorrow.
• Growth in tokenized stocks on Binance = increasing BNB utility (medium term).
• Weak spot/ETF demand despite bullish derivatives = divergence = rally not confirmed.
• BNB is correlated with BTC but has its own dynamics: the rejection at 800 $ is primarily technical.
• Tomorrow: no specific BNB catalyst → follows overall risk sentiment (FOMC).
🎯 TOMORROW'S SCENARIO: BEARISH (invalidation: 4H close above $800)
Flush of overcrowded longs toward $760, then a test of the lower band at $750 – $753.
ICT buy zone: 745 – 755 $ (buyer OB + mitigation, ahead of the burn).
If the burn is announced unexpectedly → scenario invalidated, break above 800 $ → $826.
⚠️ Disclaimer: Analysis for educational purposes only, not investment advice. BNB is exposed to regulatory risk and volatility — never invest without risk management. DYOR.
#BNB #BinanceCoin #Burn #ICT #BinanceSquare #AnalyseCrypto
💰 Current price: ~781 $ | 24h: -0.5% | 6 months: +29.6% | ATH: -44%
🔍 ICT ANALYSIS
• 4H: Bearish CHoCH after the intraday rejection at 809.99 $ (false break above 800 $ = liquidity grab).
• Bearish OB: 795 – 808 $ — price firmly rejected, falling back below the $796 pivot.
• Upper Bollinger band at 800.97 $ = technical ceiling; lower band at ~753 $ = mean-reversion target.
• Buy-side liquidity: below $760, then a dense pool at $750 – $753.
• Overcrowded derivatives longs ("crowded long") = fuel for a leverage flush before the breakout.
• RSI ~60: bullish momentum, but exhausted at resistance.
🏛️ FUNDAMENTAL ANALYSIS
• 37th quarterly burn expected in mid-October (date not announced) — a catalyst, but probably not tomorrow.
• Growth in tokenized stocks on Binance = increasing BNB utility (medium term).
• Weak spot/ETF demand despite bullish derivatives = divergence = rally not confirmed.
• BNB is correlated with BTC but has its own dynamics: the rejection at 800 $ is primarily technical.
• Tomorrow: no specific BNB catalyst → follows overall risk sentiment (FOMC).
🎯 TOMORROW'S SCENARIO: BEARISH (invalidation: 4H close above $800)
Flush of overcrowded longs toward $760, then a test of the lower band at $750 – $753.
ICT buy zone: 745 – 755 $ (buyer OB + mitigation, ahead of the burn).
If the burn is announced unexpectedly → scenario invalidated, break above 800 $ → $826.
⚠️ Disclaimer: Analysis for educational purposes only, not investment advice. BNB is exposed to regulatory risk and volatility — never invest without risk management. DYOR.
#BNB #BinanceCoin #Burn #ICT #BinanceSquare #AnalyseCrypto

86
🚨 Stop Scrolling Guys Trade Now From Here 👇🏻👇🏻👇🏻
BLOOD IN THE MARKET… OPPORTUNITY OR PANIC? 🔻
The red candles are scaring weak hands, but experienced traders know that volatility creates opportunities.
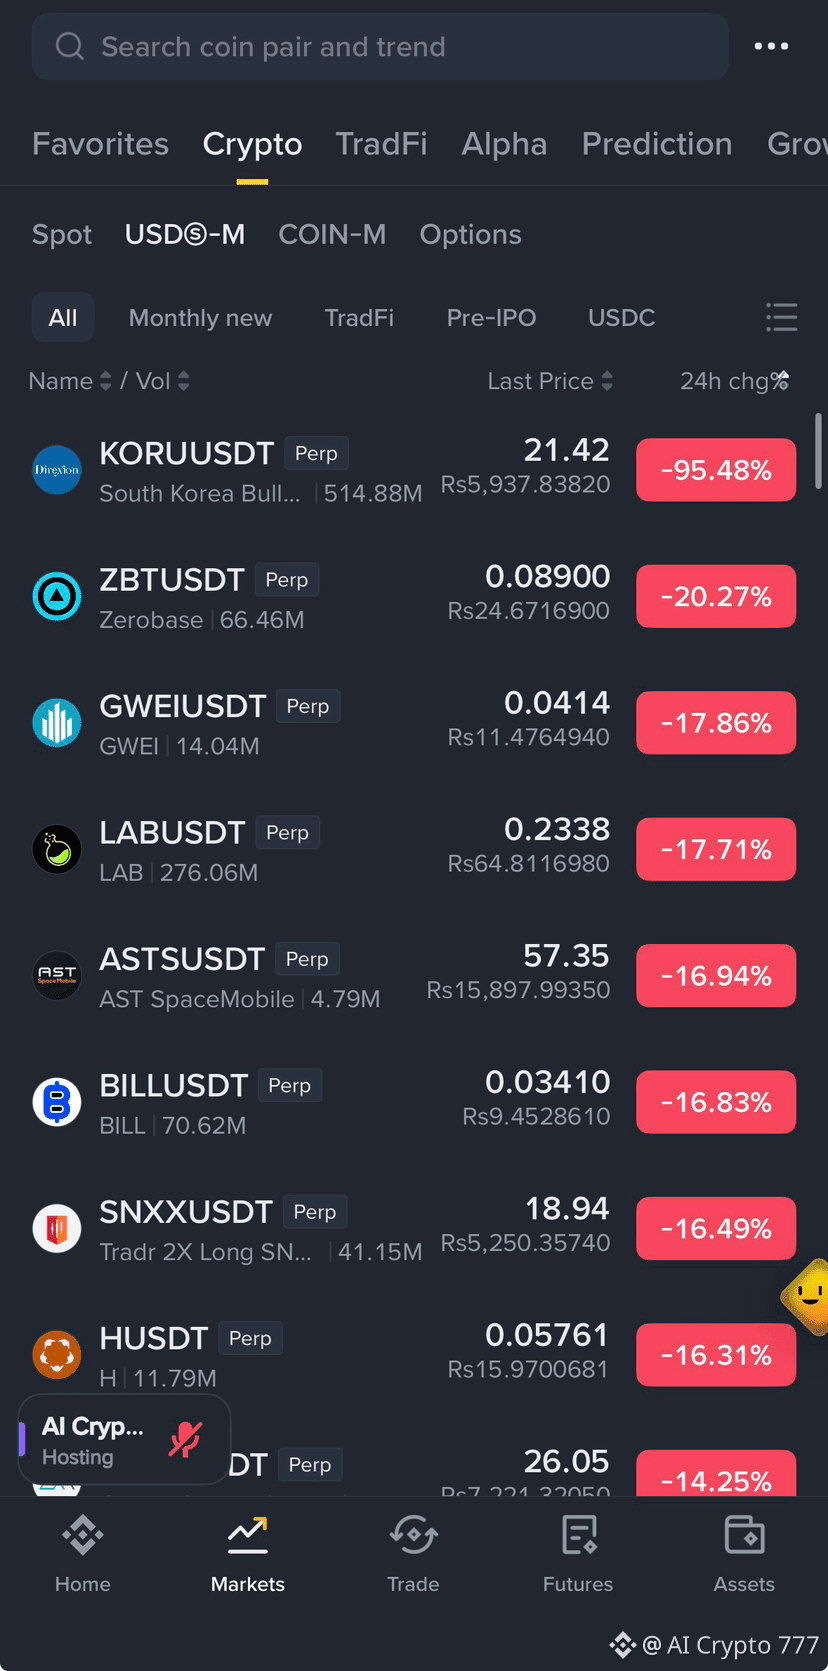
📉 Biggest losers right now:
🔻 $KORU -95.48% 😱
🔻 $ZBT -20.27%
🔻 $GWEI -17.86%
🔻 LAB -17.71%
🔻 AST -16.94%
🔻 BILL -16.83%
🔻 SNXX -16.49%
⚠️ Don’t blindly catch falling knives. Wait for confirmation, key support, and volume before entering any trade.
💰 Remember: Today’s biggest losers can become tomorrow’s biggest movers—but only with the right setup.
👇 Which coin are you watching for a rebound: GWEI, LAB, or BILL?
🔥 Follow for more high-probability trade setups and real-time market updates.
Trade smart. Protect your capital. Never go all-in. 📊🚀
{future}(GWEIUSDT)
{future}(ZBTUSDT)
{future}(KORUUSDT)
#Write2Earn #trading #crypto #binance #AnalyseCrypto
🚨 Stop Scrolling Guys Trade Now From Here 👇🏻👇🏻👇🏻
BLOOD IN THE MARKET… OPPORTUNITY OR PANIC? 🔻
The red candles are scaring weak hands, but experienced traders know that volatility creates opportunities.
📉 Biggest losers right now:
🔻 $KORU -95.48% 😱
🔻 $ZBT -20.27%
🔻 $GWEI -17.86%
🔻 LAB -17.71%
🔻 AST -16.94%
🔻 BILL -16.83%
🔻 SNXX -16.49%
⚠️ Don’t blindly catch falling knives. Wait for confirmation, key support, and volume before entering any trade.
💰 Remember: Today’s biggest losers can become tomorrow’s biggest movers—but only with the right setup.
👇 Which coin are you watching for a rebound: GWEI, LAB, or BILL?
🔥 Follow for more high-probability trade setups and real-time market updates.
Trade smart. Protect your capital. Never go all-in. 📊🚀
#Write2Earn #trading #crypto #binance #AnalyseCrypto
BLOOD IN THE MARKET… OPPORTUNITY OR PANIC? 🔻
The red candles are scaring weak hands, but experienced traders know that volatility creates opportunities.
📉 Biggest losers right now:
🔻 $KORU -95.48% 😱
🔻 $ZBT -20.27%
🔻 $GWEI -17.86%
🔻 LAB -17.71%
🔻 AST -16.94%
🔻 BILL -16.83%
🔻 SNXX -16.49%
⚠️ Don’t blindly catch falling knives. Wait for confirmation, key support, and volume before entering any trade.
💰 Remember: Today’s biggest losers can become tomorrow’s biggest movers—but only with the right setup.
👇 Which coin are you watching for a rebound: GWEI, LAB, or BILL?
🔥 Follow for more high-probability trade setups and real-time market updates.
Trade smart. Protect your capital. Never go all-in. 📊🚀
#Write2Earn #trading #crypto #binance #AnalyseCrypto
6
1
518
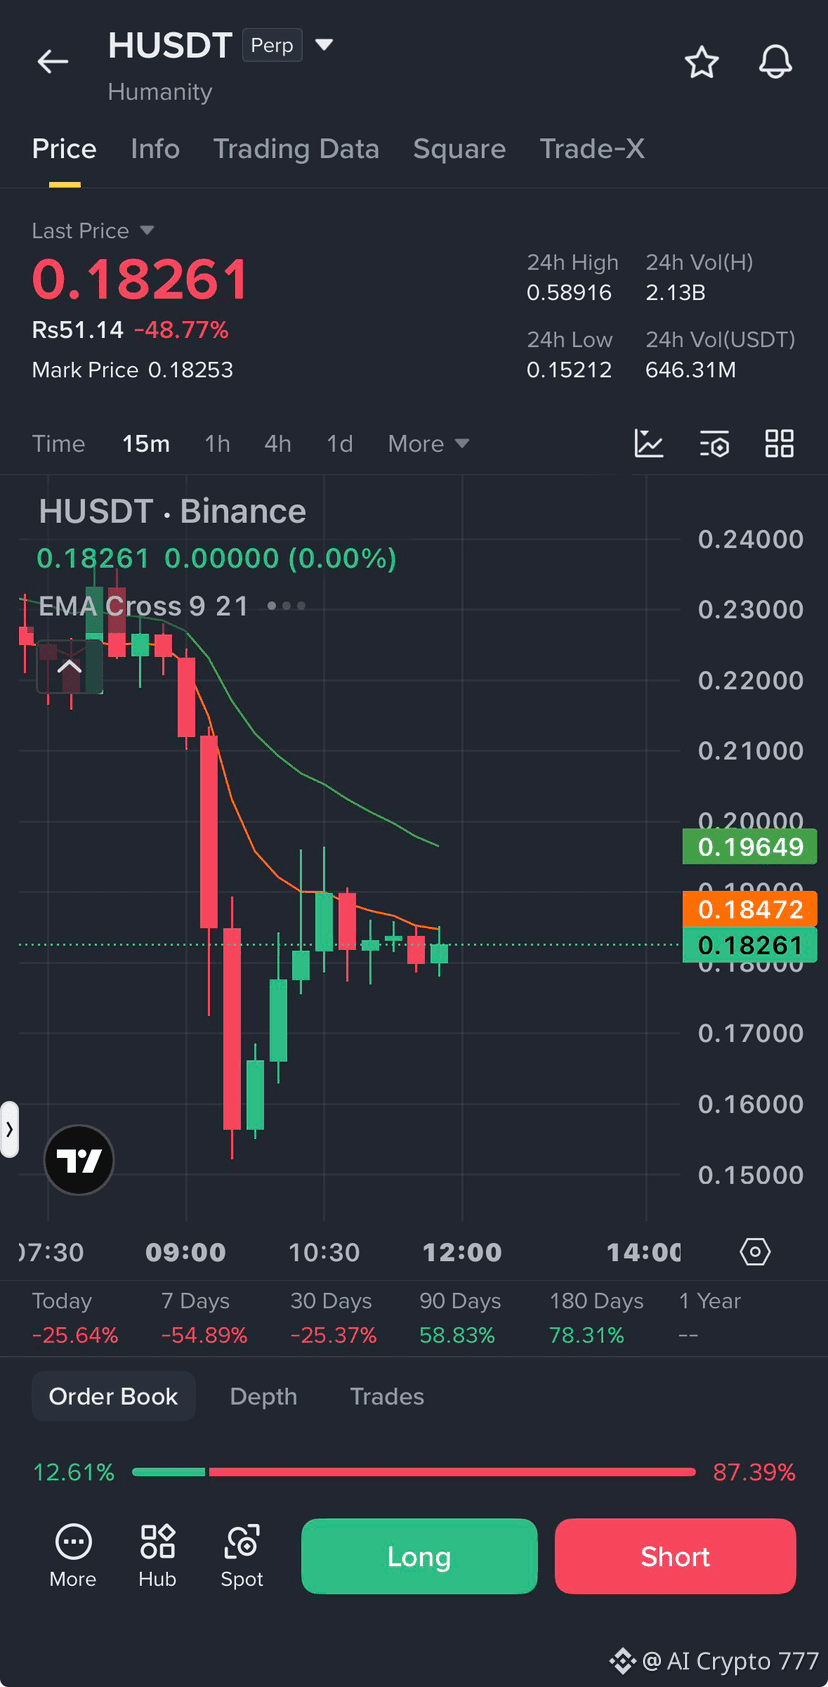
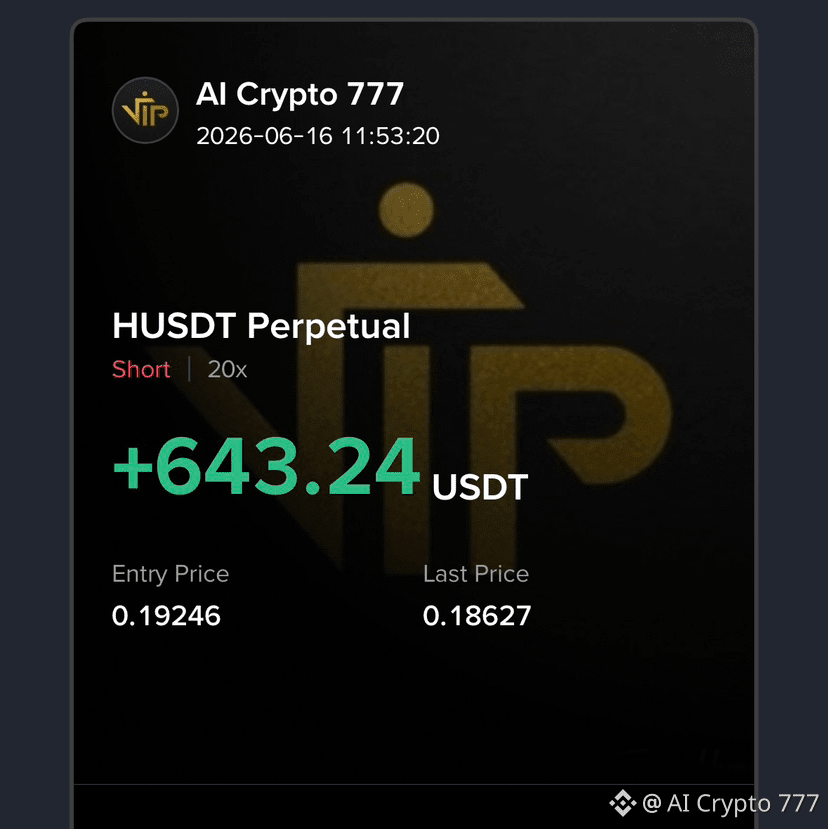
$H This big red candle just smashed down, a -50% chop, it's brutal. 📉
Watching this candlestick drop from 0.86 all the way to 0.18, I can only say one thing: never try to catch a falling knife.
Many folks see a 50% drop and think it's a bargain, wanting to catch the bottom, but in the face of a trend, what you call 'bottom' might just be halfway down the mountain.
This kind of movement shows clear signs of smart money exiting. For the current market, I have only one piece of advice: hold your horses and watch the show. Better to miss out on a bounce than to become someone else's liquidity while they unload. Protecting your principal is more important than anything else. 🛑
Trade $H here 👇🏻👇🏻👇🏻
{future}(HUSDT)
#crypto #trading #TradingSignals #TradingCommunity #AnalyseCrypto
$H This big red candle just smashed down, a -50% chop, it's brutal. 📉
Watching this candlestick drop from 0.86 all the way to 0.18, I can only say one thing: never try to catch a falling knife. Many folks see a 50% drop and think it's a bargain, wanting to catch the bottom, but in the face of a trend, what you call 'bottom' might just be halfway down the mountain.
This kind of movement shows clear signs of smart money exiting. For the current market, I have only one piece of advice: hold your horses and watch the show. Better to miss out on a bounce than to become someone else's liquidity while they unload. Protecting your principal is more important than anything else. 🛑
Trade $H here 👇🏻👇🏻👇🏻
#crypto #trading #TradingSignals #TradingCommunity #AnalyseCrypto
Watching this candlestick drop from 0.86 all the way to 0.18, I can only say one thing: never try to catch a falling knife. Many folks see a 50% drop and think it's a bargain, wanting to catch the bottom, but in the face of a trend, what you call 'bottom' might just be halfway down the mountain.
This kind of movement shows clear signs of smart money exiting. For the current market, I have only one piece of advice: hold your horses and watch the show. Better to miss out on a bounce than to become someone else's liquidity while they unload. Protecting your principal is more important than anything else. 🛑
Trade $H here 👇🏻👇🏻👇🏻
#crypto #trading #TradingSignals #TradingCommunity #AnalyseCrypto
1
297

🚨 BITCOIN : Are we attacking 83K tonight?
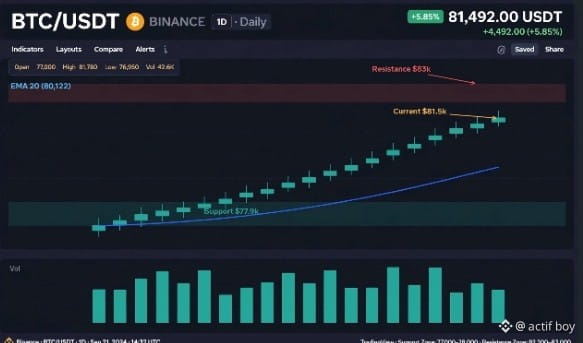
BTC is at 81,492$ (+5.85%) after bouncing back from 77K. We’re in full recovery.
My simple analysis for tonight:
✅ *Bullish signal* : We’re back ABOVE the 20 EMA ($80.122). The RSI is at 62; it just crossed upward. Buyers are back.
🔴 *Resistance to watch* : 82,200$ - 83,000$
This is the zone where 1.07M BTC were bought before. Many will want to sell at breakeven. If we break 83K with volume, the door is open to 86K-88K.
🟢 *Support* : 77,900$ - 78,000$
As long as we stay above, the structure remains bullish.
*My plan:*
I’m not buying here anymore. I’ll wait either for a retest of 78K to strengthen, or for a daily close above 83K to target what’s next.
And you? Do you think we break 83K this week, or do we reject it?
#AnalyseCrypto
"83K this week? Yes / No / We’re going to dump"
🚨 BITCOIN : Are we attacking 83K tonight?
BTC is at 81,492$ (+5.85%) after bouncing back from 77K. We’re in full recovery.
My simple analysis for tonight:
✅ *Bullish signal* : We’re back ABOVE the 20 EMA ($80.122). The RSI is at 62; it just crossed upward. Buyers are back.
🔴 *Resistance to watch* : 82,200$ - 83,000$
This is the zone where 1.07M BTC were bought before. Many will want to sell at breakeven. If we break 83K with volume, the door is open to 86K-88K.
🟢 *Support* : 77,900$ - 78,000$
As long as we stay above, the structure remains bullish.
*My plan:*
I’m not buying here anymore. I’ll wait either for a retest of 78K to strengthen, or for a daily close above 83K to target what’s next.
And you? Do you think we break 83K this week, or do we reject it?
#AnalyseCrypto
"83K this week? Yes / No / We’re going to dump"
BTC is at 81,492$ (+5.85%) after bouncing back from 77K. We’re in full recovery.
My simple analysis for tonight:
✅ *Bullish signal* : We’re back ABOVE the 20 EMA ($80.122). The RSI is at 62; it just crossed upward. Buyers are back.
🔴 *Resistance to watch* : 82,200$ - 83,000$
This is the zone where 1.07M BTC were bought before. Many will want to sell at breakeven. If we break 83K with volume, the door is open to 86K-88K.
🟢 *Support* : 77,900$ - 78,000$
As long as we stay above, the structure remains bullish.
*My plan:*
I’m not buying here anymore. I’ll wait either for a retest of 78K to strengthen, or for a daily close above 83K to target what’s next.
And you? Do you think we break 83K this week, or do we reject it?
#AnalyseCrypto
"83K this week? Yes / No / We’re going to dump"
2
126
·
--
Bullish
📊 SOL — Analysis of 02/10/2026 | TOMORROW SCENARIO (Sat.) : BULLISH (test of $125)
Current price : ~121,5 $ (+2,5 % 24h, peak at $123,7)
🔬 FUNDAMENTAL ANALYSIS
• SOL is the leader among big altcoins in gains today (+2,5 to +3,8 %) after breaking the $120,91 resistance.
• SOL ETF : record of 188 M$ d in inflows over one week → structural support.
• Deployment of Alpenglow and increased network activity (fees +50 %) → growing adoption.
• Key resistance at 125 $ (end-of-September peak, “supply wall” at $125,22) : a close above would open the way toward $128–130.
• RSI ~68 : close to overbought but not extreme yet.
📐 ICT ANALYSIS
• Confirmed bullish Break of Structure (BOS) : 4H close above 121 $ (previous double top).
• Bullish Order Block at 118–120,5 $ = smart money buy zone to mitigate.
• Bullish Fair Value Gap (FVG) opened around 119–120 $ = dynamic support.
• Sell-side liquidity above the $123,7 peak, then 125 $ → target for tomorrow.
🎯 TOMORROW SCENARIO (single) : BULLISH
• Entry : buy the dip toward 119–120,5 $ (mitigation OB + FVG).
• Targets : 124 $ → 125 $ (test of the resistance wall).
• Invalidation : 4H close below 118 $ → back to range, exit.
• Stop below $117,5 ; risk ≤ 1 %.
⚠️ DISCLAIMER : Educational analysis only, not financial advice. SOL is highly volatile ; the weekend can amplify moves. Never risk more than you can afford to lose. DYOR.
#SOL #Solana #BinanceSquare #ICT #AnalyseCrypto
📊 SOL — Analysis of 02/10/2026 | TOMORROW SCENARIO (Sat.) : BULLISH (test of $125)
Current price : ~121,5 $ (+2,5 % 24h, peak at $123,7)
🔬 FUNDAMENTAL ANALYSIS
• SOL is the leader among big altcoins in gains today (+2,5 to +3,8 %) after breaking the $120,91 resistance.
• SOL ETF : record of 188 M$ d in inflows over one week → structural support.
• Deployment of Alpenglow and increased network activity (fees +50 %) → growing adoption.
• Key resistance at 125 $ (end-of-September peak, “supply wall” at $125,22) : a close above would open the way toward $128–130.
• RSI ~68 : close to overbought but not extreme yet.
📐 ICT ANALYSIS
• Confirmed bullish Break of Structure (BOS) : 4H close above 121 $ (previous double top).
• Bullish Order Block at 118–120,5 $ = smart money buy zone to mitigate.
• Bullish Fair Value Gap (FVG) opened around 119–120 $ = dynamic support.
• Sell-side liquidity above the $123,7 peak, then 125 $ → target for tomorrow.
🎯 TOMORROW SCENARIO (single) : BULLISH
• Entry : buy the dip toward 119–120,5 $ (mitigation OB + FVG).
• Targets : 124 $ → 125 $ (test of the resistance wall).
• Invalidation : 4H close below 118 $ → back to range, exit.
• Stop below $117,5 ; risk ≤ 1 %.
⚠️ DISCLAIMER : Educational analysis only, not financial advice. SOL is highly volatile ; the weekend can amplify moves. Never risk more than you can afford to lose. DYOR.
#SOL #Solana #BinanceSquare #ICT #AnalyseCrypto
Current price : ~121,5 $ (+2,5 % 24h, peak at $123,7)
🔬 FUNDAMENTAL ANALYSIS
• SOL is the leader among big altcoins in gains today (+2,5 to +3,8 %) after breaking the $120,91 resistance.
• SOL ETF : record of 188 M$ d in inflows over one week → structural support.
• Deployment of Alpenglow and increased network activity (fees +50 %) → growing adoption.
• Key resistance at 125 $ (end-of-September peak, “supply wall” at $125,22) : a close above would open the way toward $128–130.
• RSI ~68 : close to overbought but not extreme yet.
📐 ICT ANALYSIS
• Confirmed bullish Break of Structure (BOS) : 4H close above 121 $ (previous double top).
• Bullish Order Block at 118–120,5 $ = smart money buy zone to mitigate.
• Bullish Fair Value Gap (FVG) opened around 119–120 $ = dynamic support.
• Sell-side liquidity above the $123,7 peak, then 125 $ → target for tomorrow.
🎯 TOMORROW SCENARIO (single) : BULLISH
• Entry : buy the dip toward 119–120,5 $ (mitigation OB + FVG).
• Targets : 124 $ → 125 $ (test of the resistance wall).
• Invalidation : 4H close below 118 $ → back to range, exit.
• Stop below $117,5 ; risk ≤ 1 %.
⚠️ DISCLAIMER : Educational analysis only, not financial advice. SOL is highly volatile ; the weekend can amplify moves. Never risk more than you can afford to lose. DYOR.
#SOL #Solana #BinanceSquare #ICT #AnalyseCrypto
98

·
--
Bullish
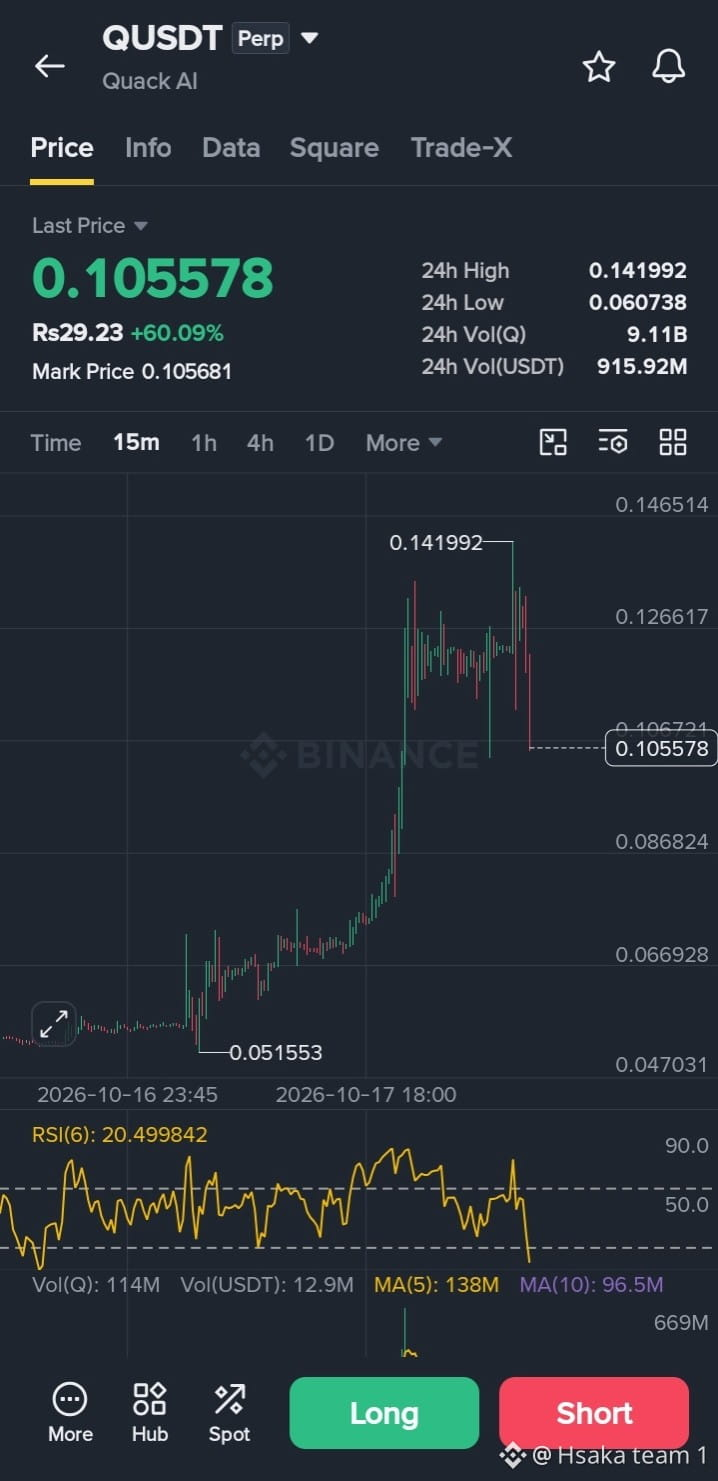
When small-cap perpetual contracts ignite simultaneously, smart money isn’t taking wild guesses—they are hunting specific liquidity pools.
Here is what the latest futures price action and market structure are revealing across today’s top gainers:
1. $QUICK +4.80%
Price Action & Volume: Skyrocketed to $0.1073. The explosive breakout is backed by a massive surge in buying volume, easily clearing overhead dynamic resistance levels.
Market Dynamics: A steep surge in open interest alongside positive funding rates suggests aggressive long position building. However, price is approaching historical liquidity walls, raising the risk of short-term profit-taking.
2. $AVA ($AVAUSDT) | +32.04%
Price Action & Support: Pushed up to $0.3882 after consolidating near its key lower demand block.
Market Dynamics: Steadily building higher highs with healthy spot and derivatives volume. This reflects sustained whale accumulation rather than a pure short squeeze. Holding above $0.35 will be crucial to sustain this bullish structure.
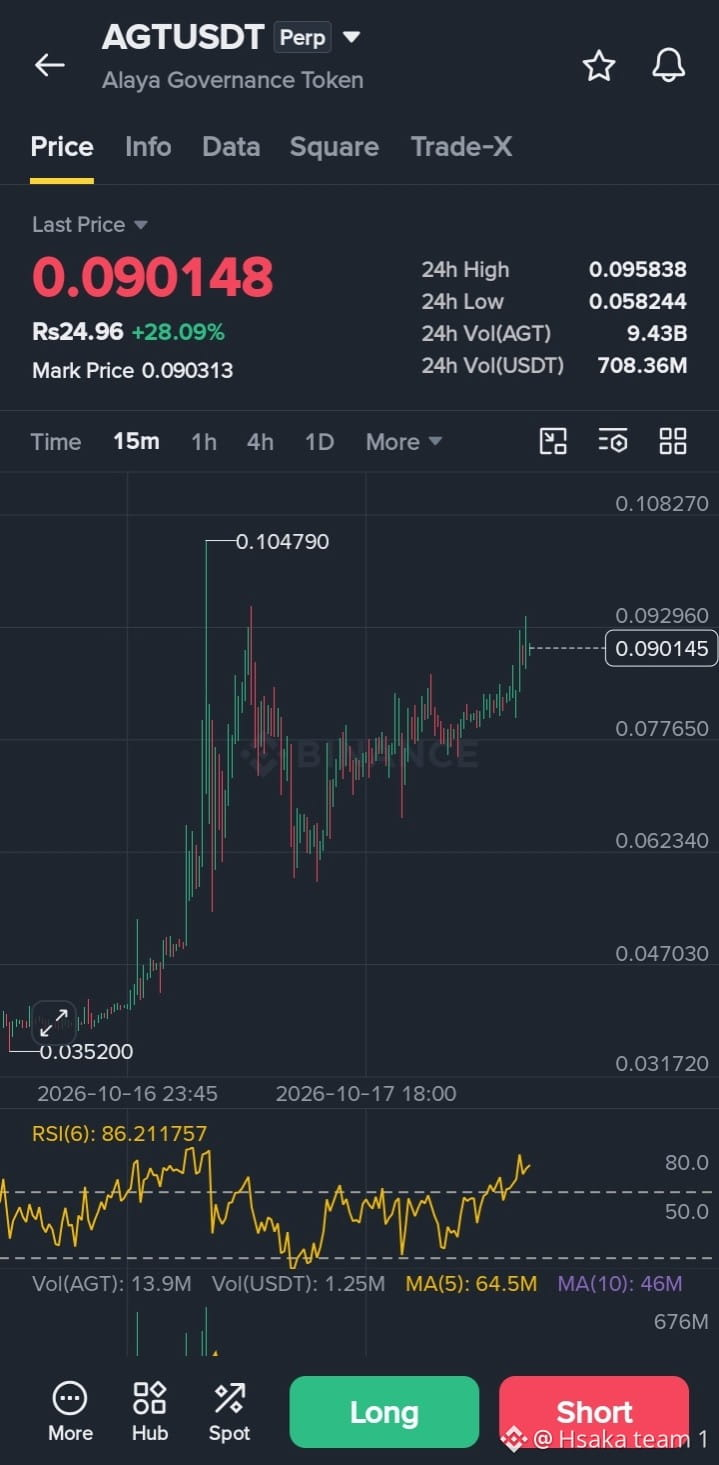
3. $AGT Governance Token ($AGTUSDT) | +28.56%
Price Action & Resistance: Currently trading around $0.0904 after breaking out of a long-term accumulation zone.
Market Dynamics: Strong open interest expansion signals high volatility ahead. While momentum remains sharply bullish, trader fatigue and overbought technical indicators suggest patience near key resistance zones.
My Take 💡
While these massive single-day pumps create intense fear of missing out (FOMO), chasing derivative pairs up +60% without a confirmation setup is high risk. Focus on waiting for liquidity sweeps or pullbacks toward proven support before executing entries. Smart risk management always protects against unexpected leverage flushes.
Are you taking profits on these breakout movers today, or holding out for further upside expansion?
#SenBlumenthalProbesCantorFitzgeraldTetherTies
#binqncesquare
#AnalyseCrypto
{future}(AGTUSDT)
When small-cap perpetual contracts ignite simultaneously, smart money isn’t taking wild guesses—they are hunting specific liquidity pools.
Here is what the latest futures price action and market structure are revealing across today’s top gainers:
1. $QUICK +4.80%
Price Action & Volume: Skyrocketed to $0.1073. The explosive breakout is backed by a massive surge in buying volume, easily clearing overhead dynamic resistance levels.
Market Dynamics: A steep surge in open interest alongside positive funding rates suggests aggressive long position building. However, price is approaching historical liquidity walls, raising the risk of short-term profit-taking.
2. $AVA ($AVAUSDT) | +32.04%
Price Action & Support: Pushed up to $0.3882 after consolidating near its key lower demand block.
Market Dynamics: Steadily building higher highs with healthy spot and derivatives volume. This reflects sustained whale accumulation rather than a pure short squeeze. Holding above $0.35 will be crucial to sustain this bullish structure.
3. $AGT Governance Token ($AGTUSDT) | +28.56%
Price Action & Resistance: Currently trading around $0.0904 after breaking out of a long-term accumulation zone.
Market Dynamics: Strong open interest expansion signals high volatility ahead. While momentum remains sharply bullish, trader fatigue and overbought technical indicators suggest patience near key resistance zones.
My Take 💡
While these massive single-day pumps create intense fear of missing out (FOMO), chasing derivative pairs up +60% without a confirmation setup is high risk. Focus on waiting for liquidity sweeps or pullbacks toward proven support before executing entries. Smart risk management always protects against unexpected leverage flushes.
Are you taking profits on these breakout movers today, or holding out for further upside expansion?
#SenBlumenthalProbesCantorFitzgeraldTetherTies
#binqncesquare
#AnalyseCrypto
Here is what the latest futures price action and market structure are revealing across today’s top gainers:
1. $QUICK +4.80%
Price Action & Volume: Skyrocketed to $0.1073. The explosive breakout is backed by a massive surge in buying volume, easily clearing overhead dynamic resistance levels.
Market Dynamics: A steep surge in open interest alongside positive funding rates suggests aggressive long position building. However, price is approaching historical liquidity walls, raising the risk of short-term profit-taking.
2. $AVA ($AVAUSDT) | +32.04%
Price Action & Support: Pushed up to $0.3882 after consolidating near its key lower demand block.
Market Dynamics: Steadily building higher highs with healthy spot and derivatives volume. This reflects sustained whale accumulation rather than a pure short squeeze. Holding above $0.35 will be crucial to sustain this bullish structure.
3. $AGT Governance Token ($AGTUSDT) | +28.56%
Price Action & Resistance: Currently trading around $0.0904 after breaking out of a long-term accumulation zone.
Market Dynamics: Strong open interest expansion signals high volatility ahead. While momentum remains sharply bullish, trader fatigue and overbought technical indicators suggest patience near key resistance zones.
My Take 💡
While these massive single-day pumps create intense fear of missing out (FOMO), chasing derivative pairs up +60% without a confirmation setup is high risk. Focus on waiting for liquidity sweeps or pullbacks toward proven support before executing entries. Smart risk management always protects against unexpected leverage flushes.
Are you taking profits on these breakout movers today, or holding out for further upside expansion?
#SenBlumenthalProbesCantorFitzgeraldTetherTies
#binqncesquare
#AnalyseCrypto
1
1
469
📊 BNB — Analysis of 02/10/2026 | TOMORROW SCENARIO (Sat.) : BULLISH
Current price : ~777 $ (+0,8 % 24h, high at 784 $)
🔬 FUNDAMENTAL ANALYSIS
• Next expected quarterly burn on October 15, 2026 (~1,65 M BNB, i.e. ~1,3 B$) → in 13 days: buy-side anticipation typically starts 7 to 10 days before the event.
• Supply reduced to 133,17 M BNB after the 36th burn (July) ; final target 100 M → ~33 M BNB still to be destroyed = structural deflation.
• BEP-95 : real burn of part of gas fees on each block.
• Low 24h volume (~1,3 B$) = volatility compression (coiled spring) before a breakout from the range.
📐 ICT ANALYSIS
• Range 740–784 $ ; price above the two EMAs (short ~758 $, long ~718 $) → bullish structure within the range.
• Bullish Order Block at 765–772 $ = smart money buy zone.
• Sell-side liquidity above the 784 $ high, then 800 $ (psychological) = sweep target.
• Bullish Break of Structure (BOS) confirmed by a 4H close above 784 $.
🎯 TOMORROW SCENARIO (unique) : BULLISH
• Entry : buy the dip toward 770–773 $ (mitigation of the bullish OB).
• Targets : 785 $ → 800 $ (sweep of liquidity above 784 $).
• Invalidation : 4H close below 760 $ → test of 740 $, we exit.
• Stop below 758 $, risk ≤ 1%.
⚠️ DISCLAIMER : Educational analysis, not financial advice. BNB is correlated with the overall market ; a BTC reversal this weekend would weigh on BNB. Only risk what you can afford to lose. DYOR.
#BNB #BNBChain #BinanceSquare #ICT #Burn #AnalyseCrypto
📊 BNB — Analysis of 02/10/2026 | TOMORROW SCENARIO (Sat.) : BULLISH
Current price : ~777 $ (+0,8 % 24h, high at 784 $)
🔬 FUNDAMENTAL ANALYSIS
• Next expected quarterly burn on October 15, 2026 (~1,65 M BNB, i.e. ~1,3 B$) → in 13 days: buy-side anticipation typically starts 7 to 10 days before the event.
• Supply reduced to 133,17 M BNB after the 36th burn (July) ; final target 100 M → ~33 M BNB still to be destroyed = structural deflation.
• BEP-95 : real burn of part of gas fees on each block.
• Low 24h volume (~1,3 B$) = volatility compression (coiled spring) before a breakout from the range.
📐 ICT ANALYSIS
• Range 740–784 $ ; price above the two EMAs (short ~758 $, long ~718 $) → bullish structure within the range.
• Bullish Order Block at 765–772 $ = smart money buy zone.
• Sell-side liquidity above the 784 $ high, then 800 $ (psychological) = sweep target.
• Bullish Break of Structure (BOS) confirmed by a 4H close above 784 $.
🎯 TOMORROW SCENARIO (unique) : BULLISH
• Entry : buy the dip toward 770–773 $ (mitigation of the bullish OB).
• Targets : 785 $ → 800 $ (sweep of liquidity above 784 $).
• Invalidation : 4H close below 760 $ → test of 740 $, we exit.
• Stop below 758 $, risk ≤ 1%.
⚠️ DISCLAIMER : Educational analysis, not financial advice. BNB is correlated with the overall market ; a BTC reversal this weekend would weigh on BNB. Only risk what you can afford to lose. DYOR.
#BNB #BNBChain #BinanceSquare #ICT #Burn #AnalyseCrypto
Current price : ~777 $ (+0,8 % 24h, high at 784 $)
🔬 FUNDAMENTAL ANALYSIS
• Next expected quarterly burn on October 15, 2026 (~1,65 M BNB, i.e. ~1,3 B$) → in 13 days: buy-side anticipation typically starts 7 to 10 days before the event.
• Supply reduced to 133,17 M BNB after the 36th burn (July) ; final target 100 M → ~33 M BNB still to be destroyed = structural deflation.
• BEP-95 : real burn of part of gas fees on each block.
• Low 24h volume (~1,3 B$) = volatility compression (coiled spring) before a breakout from the range.
📐 ICT ANALYSIS
• Range 740–784 $ ; price above the two EMAs (short ~758 $, long ~718 $) → bullish structure within the range.
• Bullish Order Block at 765–772 $ = smart money buy zone.
• Sell-side liquidity above the 784 $ high, then 800 $ (psychological) = sweep target.
• Bullish Break of Structure (BOS) confirmed by a 4H close above 784 $.
🎯 TOMORROW SCENARIO (unique) : BULLISH
• Entry : buy the dip toward 770–773 $ (mitigation of the bullish OB).
• Targets : 785 $ → 800 $ (sweep of liquidity above 784 $).
• Invalidation : 4H close below 760 $ → test of 740 $, we exit.
• Stop below 758 $, risk ≤ 1%.
⚠️ DISCLAIMER : Educational analysis, not financial advice. BNB is correlated with the overall market ; a BTC reversal this weekend would weigh on BNB. Only risk what you can afford to lose. DYOR.
#BNB #BNBChain #BinanceSquare #ICT #Burn #AnalyseCrypto
Acheter
0%
attendre
100%
1 votes • Voting closed
1
140
Log in to explore more content
Join global crypto users on Binance Square
⚡️ Get latest and useful information about crypto.
💬 Trusted by the world’s largest crypto exchange.
👍 Discover real insights from verified creators.
Email / Phone number
Trending Topics
1
#XRPDropsToTwoYearLowNear87Cents
1,129 views
60 Discussing
2
#BitcoinFallsBelow$57KToTwoYearLow
567 views
14 Discussing
3
#NvidiaLoses$2.7TrillionInMonthAndAHalf
531 views
27 Discussing
4
#CanBTCReboundAfterFallingBelow60K?
507,124 views
2,209 Discussing
5
#GlobalStocksFaceLongestLosingStreakSince2023
175,494 views
1,538 Discussing
6
#BlackRockIBITPostsRecord$541MSingleDayOutflow
9,610 views
50 Discussing
7
#AnthropicPlungesTowardIPOPriceonDay2
85,238 views
883 Discussing
8
#TwentyOneCapitalAdds172.25BTC
35,201 views
405 Discussing
9
#HKBillWouldExcludeTokenizedDepositsFromVirtualAssets
3,128 views
41 Discussing
10
#BNBDropsBelow540USDTWith8.46%DailyDecline
49,602 views
448 Discussing