
#beb
beb
10,897 views
421 Discussing
Hot
Latest

·
--
📉 BEB short-term outlook bearish, 154.5 support under pressure
At 19:25 Beijing time on November 20, Binance spot BEBUSDT was quoted at 156.68 USDT, down 13.79% in 24 hours, with a range of 156.68–186.69 and trading volume of approximately 1.74 million USDT. Spot snapshot (https://chainregistry.net/coins/beb)
Bloom Energy (NYSE: BE) closed previously at $168.11 and briefly fell to $154.87 premarket. BMO upgraded its rating but lowered its price target to $230. Selling pressure on AI stocks continued after the U.S. market opened. Stock quote (https://www.mexc.com/stocks/be) Rating (https://247wallst.com/investing/2026/11/19/bloom-energy-is-down-25-in-a-month-as-bmo-upgrades-to-outperform-trims-target-to-230-whats-next-for-be-stock/) U.S. morning trading (https://apnews.com/article/c4c3f4878b12989347f8a930ed813dad)
The outlook for the next 4–24 hours is bearish, with a preference for another test of lower levels after a rebound encounters resistance. Token support is at 154.5 USDT; a break below that level could bring the 150 round-number mark into view, while resistance lies at 162–164. The bearish outlook is invalidated if the underlying stock stabilizes and BEB moves above 164 on increased volume. With the underlying stock market closed over the weekend, watch for the price spread between the two to widen. Spot range (https://www.cexscan.com/coin-summary?symbol=BEB)
#BEB #BE #美股 #AI基建 #RWA
📉 BEB short-term outlook bearish, 154.5 support under pressure
At 19:25 Beijing time on November 20, Binance spot BEBUSDT was quoted at 156.68 USDT, down 13.79% in 24 hours, with a range of 156.68–186.69 and trading volume of approximately 1.74 million USDT. Spot snapshot (https://chainregistry.net/coins/beb)
Bloom Energy (NYSE: BE) closed previously at $168.11 and briefly fell to $154.87 premarket. BMO upgraded its rating but lowered its price target to $230. Selling pressure on AI stocks continued after the U.S. market opened. Stock quote (https://www.mexc.com/stocks/be) Rating (https://247wallst.com/investing/2026/11/19/bloom-energy-is-down-25-in-a-month-as-bmo-upgrades-to-outperform-trims-target-to-230-whats-next-for-be-stock/) U.S. morning trading (https://apnews.com/article/c4c3f4878b12989347f8a930ed813dad)
The outlook for the next 4–24 hours is bearish, with a preference for another test of lower levels after a rebound encounters resistance. Token support is at 154.5 USDT; a break below that level could bring the 150 round-number mark into view, while resistance lies at 162–164. The bearish outlook is invalidated if the underlying stock stabilizes and BEB moves above 164 on increased volume. With the underlying stock market closed over the weekend, watch for the price spread between the two to widen. Spot range (https://www.cexscan.com/coin-summary?symbol=BEB)
#BEB #BE #美股 #AI基建 #RWA
At 19:25 Beijing time on November 20, Binance spot BEBUSDT was quoted at 156.68 USDT, down 13.79% in 24 hours, with a range of 156.68–186.69 and trading volume of approximately 1.74 million USDT. Spot snapshot (https://chainregistry.net/coins/beb)
Bloom Energy (NYSE: BE) closed previously at $168.11 and briefly fell to $154.87 premarket. BMO upgraded its rating but lowered its price target to $230. Selling pressure on AI stocks continued after the U.S. market opened. Stock quote (https://www.mexc.com/stocks/be) Rating (https://247wallst.com/investing/2026/11/19/bloom-energy-is-down-25-in-a-month-as-bmo-upgrades-to-outperform-trims-target-to-230-whats-next-for-be-stock/) U.S. morning trading (https://apnews.com/article/c4c3f4878b12989347f8a930ed813dad)
The outlook for the next 4–24 hours is bearish, with a preference for another test of lower levels after a rebound encounters resistance. Token support is at 154.5 USDT; a break below that level could bring the 150 round-number mark into view, while resistance lies at 162–164. The bearish outlook is invalidated if the underlying stock stabilizes and BEB moves above 164 on increased volume. With the underlying stock market closed over the weekend, watch for the price spread between the two to widen. Spot range (https://www.cexscan.com/coin-summary?symbol=BEB)
#BEB #BE #美股 #AI基建 #RWA
3
·
--
⚡ BEB: Stand aside in the short term; watch for a breakout after the rate decision
BEB/USDT is a Binance spot token for Bloom Energy (NYSE: BE). As of December 9, we were unable to verify the token’s trading activity over the past 24 hours or the underlying stock’s quotes over the same period. There is not enough evidence to determine a direction for the next 4–24 hours. Binance listing announcement (https://www.binance.com/en-AU/support/announcement/detail/fd3c0f17a7504eb5be1cb1911c6da0cd)
The Fed’s rate decision is scheduled for 3:00 a.m. Beijing time on December 10. After the decision, if the underlying stock strengthens and BEB breaks above its own 24-hour high on increased volume, with the 1-hour close holding above the breakout level, the short-term outlook turns bullish. If the stock weakens in tandem and BEB breaks below its own 24-hour low on increased volume, the outlook turns bearish. If the two diverge, watch for the token’s premium or discount to widen. Federal Reserve calendar (https://www.federalreserve.gov/newsevents/2026-december.htm)
#BEB #BloomEnergy #美股 #RWA
⚡ BEB: Stand aside in the short term; watch for a breakout after the rate decision
BEB/USDT is a Binance spot token for Bloom Energy (NYSE: BE). As of December 9, we were unable to verify the token’s trading activity over the past 24 hours or the underlying stock’s quotes over the same period. There is not enough evidence to determine a direction for the next 4–24 hours. Binance listing announcement (https://www.binance.com/en-AU/support/announcement/detail/fd3c0f17a7504eb5be1cb1911c6da0cd)
The Fed’s rate decision is scheduled for 3:00 a.m. Beijing time on December 10. After the decision, if the underlying stock strengthens and BEB breaks above its own 24-hour high on increased volume, with the 1-hour close holding above the breakout level, the short-term outlook turns bullish. If the stock weakens in tandem and BEB breaks below its own 24-hour low on increased volume, the outlook turns bearish. If the two diverge, watch for the token’s premium or discount to widen. Federal Reserve calendar (https://www.federalreserve.gov/newsevents/2026-december.htm)
#BEB #BloomEnergy #美股 #RWA
BEB/USDT is a Binance spot token for Bloom Energy (NYSE: BE). As of December 9, we were unable to verify the token’s trading activity over the past 24 hours or the underlying stock’s quotes over the same period. There is not enough evidence to determine a direction for the next 4–24 hours. Binance listing announcement (https://www.binance.com/en-AU/support/announcement/detail/fd3c0f17a7504eb5be1cb1911c6da0cd)
The Fed’s rate decision is scheduled for 3:00 a.m. Beijing time on December 10. After the decision, if the underlying stock strengthens and BEB breaks above its own 24-hour high on increased volume, with the 1-hour close holding above the breakout level, the short-term outlook turns bullish. If the stock weakens in tandem and BEB breaks below its own 24-hour low on increased volume, the outlook turns bearish. If the two diverge, watch for the token’s premium or discount to widen. Federal Reserve calendar (https://www.federalreserve.gov/newsevents/2026-december.htm)
#BEB #BloomEnergy #美股 #RWA
2

·
--
$BEB -0.49% | $0G -0.51% | $FTM -0.77%
#BEB slipped to $185.81, down 0.49% on $1.9 M of volume.
#0G traded at $0.1550, a 0.51% dip with $1.5 M changing hands, while its claim of being the largest deAIOS and L1 ecosystem remains a focal point for developers.
#FTM fell to $0.6994, down 0.77% on $1.3 M volume.
The trio’s synchronized declines suggest short‑term selling pressure, but the modest volumes mean any reversal could happen quickly.
#Write2Earn #Binance
$BEB -0.49% | $0G -0.51% | $FTM -0.77%
#BEB slipped to $185.81, down 0.49% on $1.9 M of volume.
#0G traded at $0.1550, a 0.51% dip with $1.5 M changing hands, while its claim of being the largest deAIOS and L1 ecosystem remains a focal point for developers.
#FTM fell to $0.6994, down 0.77% on $1.3 M volume.
The trio’s synchronized declines suggest short‑term selling pressure, but the modest volumes mean any reversal could happen quickly.
#Write2Earn #Binance
#BEB slipped to $185.81, down 0.49% on $1.9 M of volume.
#0G traded at $0.1550, a 0.51% dip with $1.5 M changing hands, while its claim of being the largest deAIOS and L1 ecosystem remains a focal point for developers.
#FTM fell to $0.6994, down 0.77% on $1.3 M volume.
The trio’s synchronized declines suggest short‑term selling pressure, but the modest volumes mean any reversal could happen quickly.
#Write2Earn #Binance
3


$BEB: Comparing Low and High Unit Price Behaviors
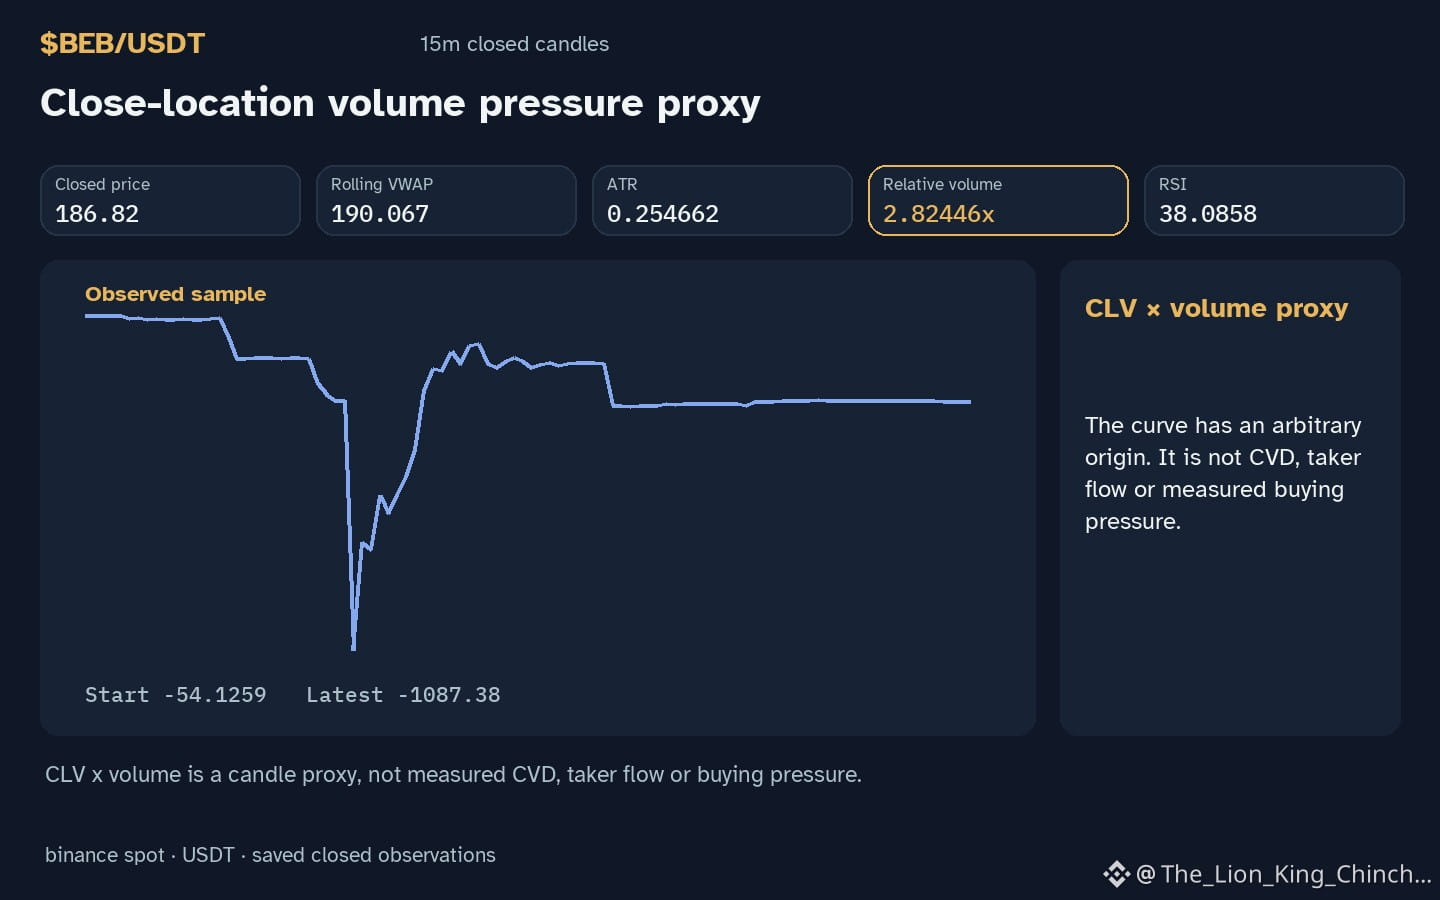
$BEB: Does a shared hourly direction for different assets suggest a similar risk profile? The $BEB hourly candle closed lower while relative volume stayed 2.82x baseline.
### Unit Size Logic
A hypothetical mechanism suggests that assets with vastly different unit prices might attract different participation styles. If one asset costs fifty thousand dollars and another costs one dollar, a identical daily change -6.45436% requires different capital commitments per unit. However, price levels alone do not dictate volatility. We look at relative volume to see if the current activity deviates from the asset's own historical norm. For $BEB, being inside the recorded range during a down move suggests a local pause rather than a trend shift.
### Comparative Bounds
Comparing $BEB to peers like BTC and XUSD reveals the limits of shared movement. Both BTC and XUSD show a down hourly direction with volume not above baseline. While $BEB also moved down, its volume was above baseline. This divergence shows that similar price directions can mask different levels of relative activity. A shared direction is not a measured correlation or a sign of capital rotation.
### Reassessing the View
One could interpret the high relative volume as a sign of high interest, yet without breaking support 186.67, the move remains localized. If a future closed candle moves above resistance 187.59 on lower relative volume, it would weaken the idea that high participation is necessary to reverse the current hourly direction. Checking these levels helps distinguish a brief fluctuation from a structural change.
Probabilistic market research, not a recommendation or guaranteed return.
The comparison to keep in mind: $BTC has hourly direction down and volume not above its baseline; $XUSD has hourly direction down and volume not above its baseline. This alone does not establish correlation.
#BEB #BTC #XUSD #CryptoWatchlist #CryptoLearning
$BEB : Comparing Low and High Unit Price Behaviors
$BEB : Does a shared hourly direction for different assets suggest a similar risk profile? The $BEB hourly candle closed lower while relative volume stayed 2.82x baseline.
### Unit Size Logic
A hypothetical mechanism suggests that assets with vastly different unit prices might attract different participation styles. If one asset costs fifty thousand dollars and another costs one dollar, a identical daily change -6.45436% requires different capital commitments per unit. However, price levels alone do not dictate volatility. We look at relative volume to see if the current activity deviates from the asset's own historical norm. For $BEB , being inside the recorded range during a down move suggests a local pause rather than a trend shift.
### Comparative Bounds
Comparing $BEB to peers like BTC and XUSD reveals the limits of shared movement. Both BTC and XUSD show a down hourly direction with volume not above baseline. While $BEB also moved down, its volume was above baseline. This divergence shows that similar price directions can mask different levels of relative activity. A shared direction is not a measured correlation or a sign of capital rotation.
### Reassessing the View
One could interpret the high relative volume as a sign of high interest, yet without breaking support 186.67, the move remains localized. If a future closed candle moves above resistance 187.59 on lower relative volume, it would weaken the idea that high participation is necessary to reverse the current hourly direction. Checking these levels helps distinguish a brief fluctuation from a structural change.
Probabilistic market research, not a recommendation or guaranteed return.
The comparison to keep in mind: $BTC has hourly direction down and volume not above its baseline; $XUSD has hourly direction down and volume not above its baseline. This alone does not establish correlation.
#BEB #BTC #XUSD #CryptoWatchlist #CryptoLearning
$BEB : Does a shared hourly direction for different assets suggest a similar risk profile? The $BEB hourly candle closed lower while relative volume stayed 2.82x baseline.
### Unit Size Logic
A hypothetical mechanism suggests that assets with vastly different unit prices might attract different participation styles. If one asset costs fifty thousand dollars and another costs one dollar, a identical daily change -6.45436% requires different capital commitments per unit. However, price levels alone do not dictate volatility. We look at relative volume to see if the current activity deviates from the asset's own historical norm. For $BEB , being inside the recorded range during a down move suggests a local pause rather than a trend shift.
### Comparative Bounds
Comparing $BEB to peers like BTC and XUSD reveals the limits of shared movement. Both BTC and XUSD show a down hourly direction with volume not above baseline. While $BEB also moved down, its volume was above baseline. This divergence shows that similar price directions can mask different levels of relative activity. A shared direction is not a measured correlation or a sign of capital rotation.
### Reassessing the View
One could interpret the high relative volume as a sign of high interest, yet without breaking support 186.67, the move remains localized. If a future closed candle moves above resistance 187.59 on lower relative volume, it would weaken the idea that high participation is necessary to reverse the current hourly direction. Checking these levels helps distinguish a brief fluctuation from a structural change.
Probabilistic market research, not a recommendation or guaranteed return.
The comparison to keep in mind: $BTC has hourly direction down and volume not above its baseline; $XUSD has hourly direction down and volume not above its baseline. This alone does not establish correlation.
#BEB #BTC #XUSD #CryptoWatchlist #CryptoLearning
31
$BEB: Understanding Exhaustion Volume and Steady Fuel
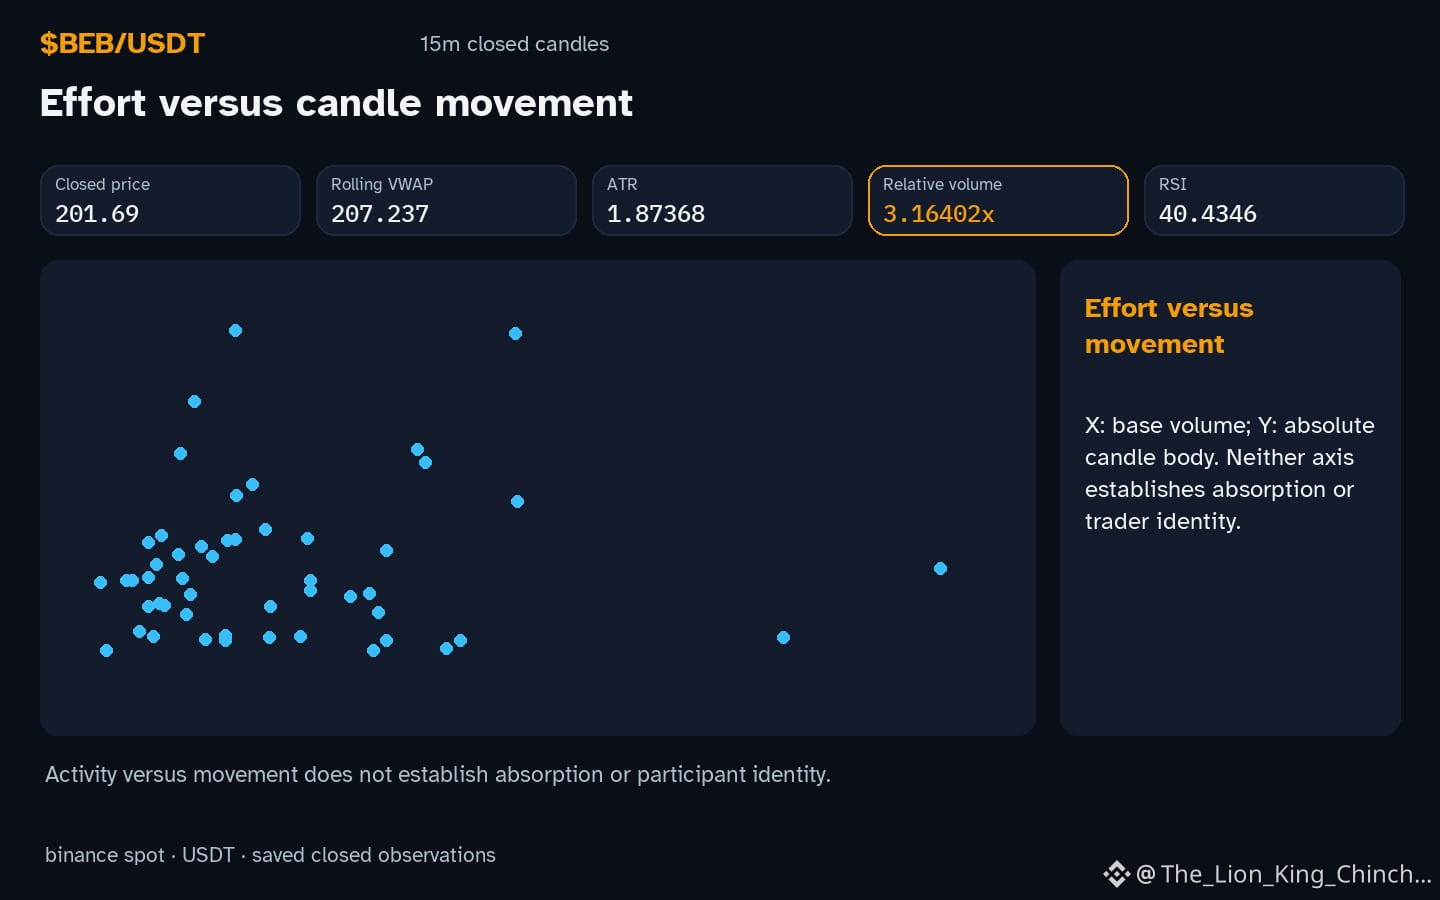
Why does $BEB show a down direction while volume sits above baseline? The observation invites a question about whether the recent surge in trades reflects exhausted momentum or simply a steady inflow of interest.
## The question
When volume spikes relative to its normal level, some analysts label it as exhaustion, assuming that buyers or sellers have run out of steam. Others argue that high volume can be a steady fuel, indicating ongoing participation without a decisive turn. The key is to separate the raw metric – 3.16x baseline – from any implied narrative.
## Evidence and an alternative
In the recorded hour, price moved down and volume rose above baseline. One way to view this is through a water pipe analogy: a sudden surge of water pressure may either burst the pipe (exhaustion) or simply fill a larger tank (steady fuel). The same flow of trades does not automatically reveal the pipe's condition. A counterexample would be a scenario where volume remains high but price holds flat, suggesting continuous liquidity rather than a climax.
## A practical self‑check
To reassess, watch the next closed hourly candle. If price continues down while 3.16x baseline stays elevated, the exhaustion hypothesis gains weight. Conversely, if price stabilises or reverses while volume stays high, the steady‑fuel view becomes more plausible. This simple condition respects the limits of the observation and avoids attributing motives to market participants.
Probabilistic market research, not a recommendation or guaranteed return.
A useful cross-check: $ETH has hourly direction down and volume above its baseline; $NIGHT has hourly direction up and volume above its baseline. This alone does not establish correlation.
#BEB #ETH #NIGHT #CryptoEducation #CryptoLearning
$BEB : Understanding Exhaustion Volume and Steady Fuel
Why does $BEB show a down direction while volume sits above baseline? The observation invites a question about whether the recent surge in trades reflects exhausted momentum or simply a steady inflow of interest.
## The question
When volume spikes relative to its normal level, some analysts label it as exhaustion, assuming that buyers or sellers have run out of steam. Others argue that high volume can be a steady fuel, indicating ongoing participation without a decisive turn. The key is to separate the raw metric – 3.16x baseline – from any implied narrative.
## Evidence and an alternative
In the recorded hour, price moved down and volume rose above baseline. One way to view this is through a water pipe analogy: a sudden surge of water pressure may either burst the pipe (exhaustion) or simply fill a larger tank (steady fuel). The same flow of trades does not automatically reveal the pipe's condition. A counterexample would be a scenario where volume remains high but price holds flat, suggesting continuous liquidity rather than a climax.
## A practical self‑check
To reassess, watch the next closed hourly candle. If price continues down while 3.16x baseline stays elevated, the exhaustion hypothesis gains weight. Conversely, if price stabilises or reverses while volume stays high, the steady‑fuel view becomes more plausible. This simple condition respects the limits of the observation and avoids attributing motives to market participants.
Probabilistic market research, not a recommendation or guaranteed return.
A useful cross-check: $ETH has hourly direction down and volume above its baseline; $NIGHT has hourly direction up and volume above its baseline. This alone does not establish correlation.
#BEB #ETH #NIGHT #CryptoEducation #CryptoLearning
Why does $BEB show a down direction while volume sits above baseline? The observation invites a question about whether the recent surge in trades reflects exhausted momentum or simply a steady inflow of interest.
## The question
When volume spikes relative to its normal level, some analysts label it as exhaustion, assuming that buyers or sellers have run out of steam. Others argue that high volume can be a steady fuel, indicating ongoing participation without a decisive turn. The key is to separate the raw metric – 3.16x baseline – from any implied narrative.
## Evidence and an alternative
In the recorded hour, price moved down and volume rose above baseline. One way to view this is through a water pipe analogy: a sudden surge of water pressure may either burst the pipe (exhaustion) or simply fill a larger tank (steady fuel). The same flow of trades does not automatically reveal the pipe's condition. A counterexample would be a scenario where volume remains high but price holds flat, suggesting continuous liquidity rather than a climax.
## A practical self‑check
To reassess, watch the next closed hourly candle. If price continues down while 3.16x baseline stays elevated, the exhaustion hypothesis gains weight. Conversely, if price stabilises or reverses while volume stays high, the steady‑fuel view becomes more plausible. This simple condition respects the limits of the observation and avoids attributing motives to market participants.
Probabilistic market research, not a recommendation or guaranteed return.
A useful cross-check: $ETH has hourly direction down and volume above its baseline; $NIGHT has hourly direction up and volume above its baseline. This alone does not establish correlation.
#BEB #ETH #NIGHT #CryptoEducation #CryptoLearning
11

·
--
$BEB +2.49% | $AVGOB +2.21% | $AVAX +1.65%
#BEB nudged up to $202.90, gaining +2.49% on $3.1 M of volume.
#AVGOB rose to $349.38, up +2.21% with $3.0 M changing hands.
#AVAX climbed to $8.63, a +1.65% move backed by $19.5 M volume. Avalanche’s high‑throughput smart‑contract platform continues to draw interest.
📈 If the volume surge holds, these modest gains could extend into the next session.
#Write2Earn #Binance
$BEB +2.49% | $AVGOB +2.21% | $AVAX +1.65%
#BEB nudged up to $202.90, gaining +2.49% on $3.1 M of volume.
#AVGOB rose to $349.38, up +2.21% with $3.0 M changing hands.
#AVAX climbed to $8.63, a +1.65% move backed by $19.5 M volume. Avalanche’s high‑throughput smart‑contract platform continues to draw interest.
📈 If the volume surge holds, these modest gains could extend into the next session.
#Write2Earn #Binance
#BEB nudged up to $202.90, gaining +2.49% on $3.1 M of volume.
#AVGOB rose to $349.38, up +2.21% with $3.0 M changing hands.
#AVAX climbed to $8.63, a +1.65% move backed by $19.5 M volume. Avalanche’s high‑throughput smart‑contract platform continues to draw interest.
📈 If the volume surge holds, these modest gains could extend into the next session.
#Write2Earn #Binance
8

·
--
Bullish
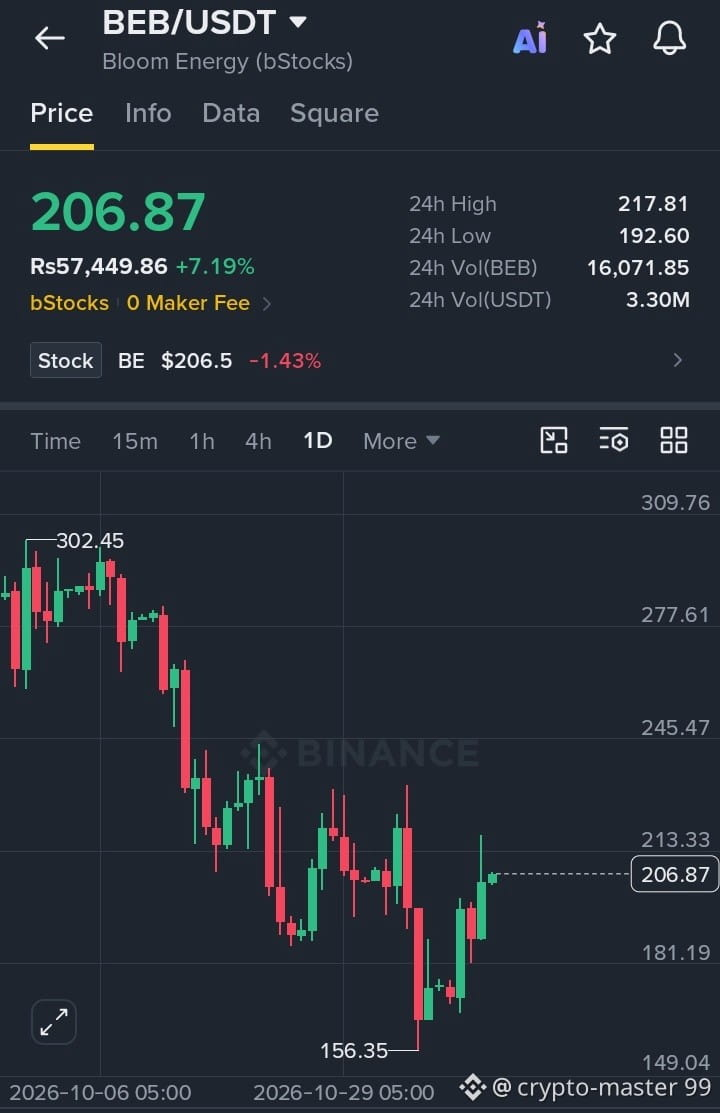
$BEB – Bullish Recovery Signals Potential Upside Continuation Toward Resistance
Trade Setup: Long
Entry Range: $203.00 – $206.87
Tp1: $215.00
Tp2: $235.00
Tp3: $260.00
SL: $191.50
#BEB has bounced strongly off the 156.35 demand zone and is forming a higher low structure on the daily timeframe, indicating that buyers are stepping back in to drive momentum toward upper resistance levels. The recent bullish candles show increasing buying pressure, making this a favorable setup for a continuation move.
Trade Here On $BEB
{spot}(BEBUSDT)
$AGPUB
{spot}(AGPUBUSDT)
$BEB – Bullish Recovery Signals Potential Upside Continuation Toward Resistance
Trade Setup: Long
Entry Range: $203.00 – $206.87
Tp1: $215.00
Tp2: $235.00
Tp3: $260.00
SL: $191.50
#BEB has bounced strongly off the 156.35 demand zone and is forming a higher low structure on the daily timeframe, indicating that buyers are stepping back in to drive momentum toward upper resistance levels. The recent bullish candles show increasing buying pressure, making this a favorable setup for a continuation move.
Trade Here On $BEB
$AGPUB
Trade Setup: Long
Entry Range: $203.00 – $206.87
Tp1: $215.00
Tp2: $235.00
Tp3: $260.00
SL: $191.50
#BEB has bounced strongly off the 156.35 demand zone and is forming a higher low structure on the daily timeframe, indicating that buyers are stepping back in to drive momentum toward upper resistance levels. The recent bullish candles show increasing buying pressure, making this a favorable setup for a continuation move.
Trade Here On $BEB
$AGPUB
1
4

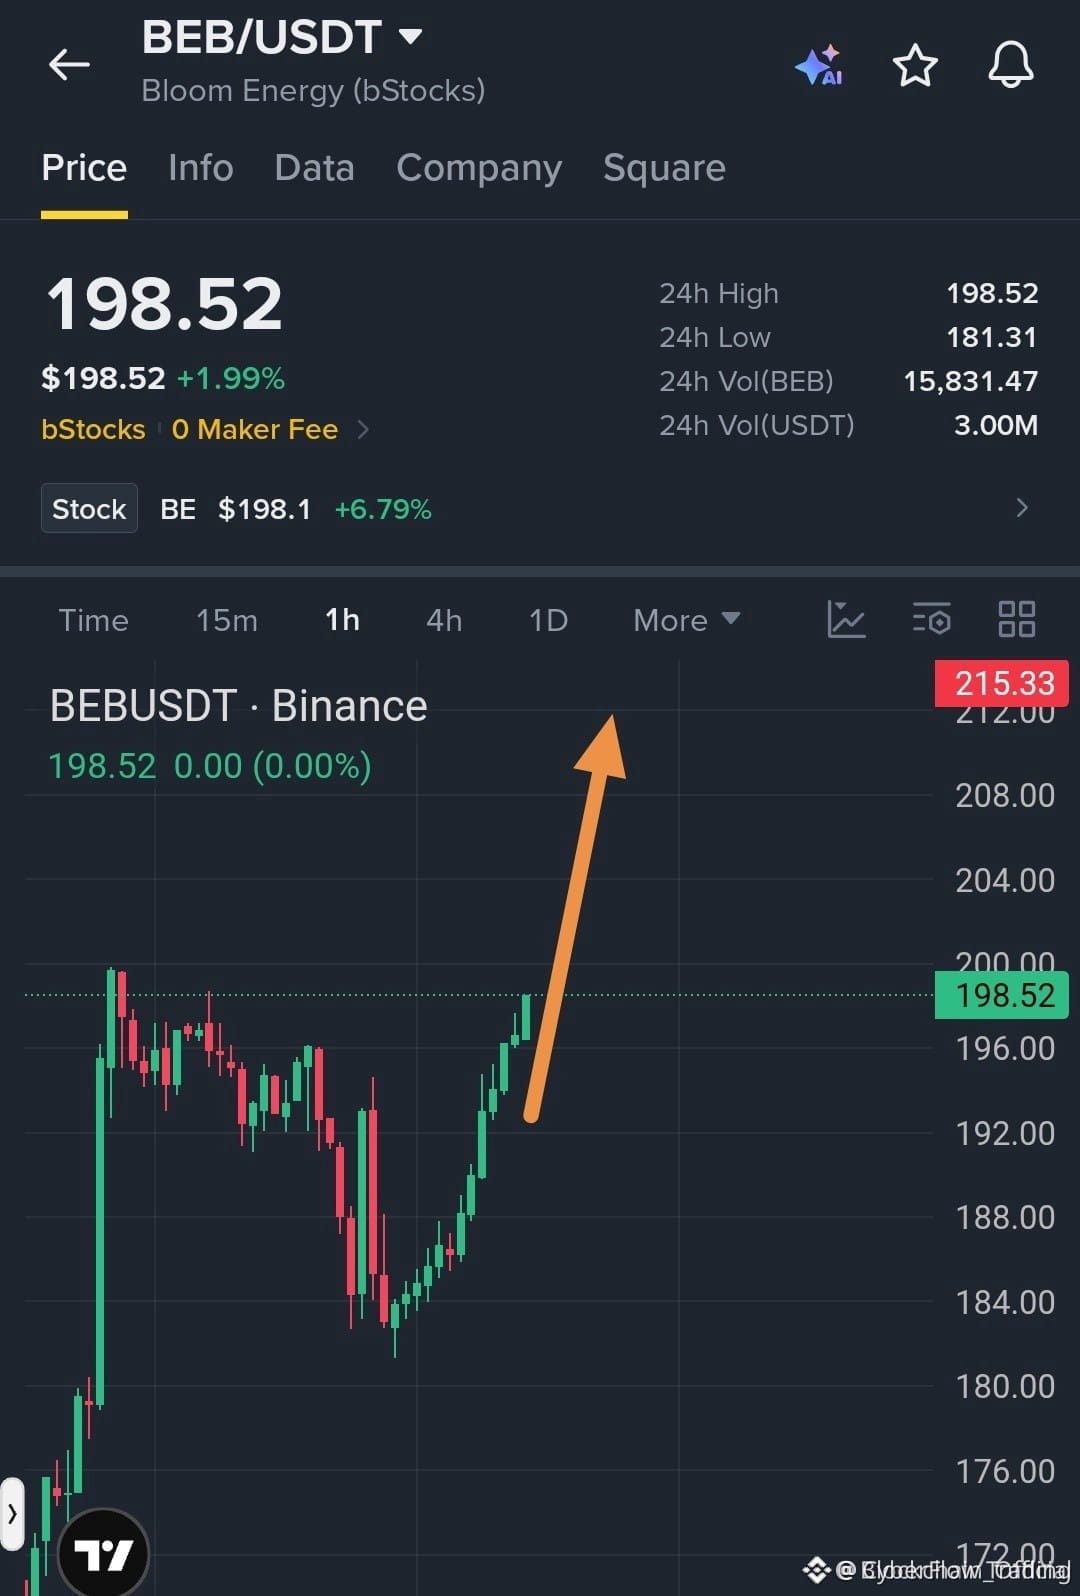
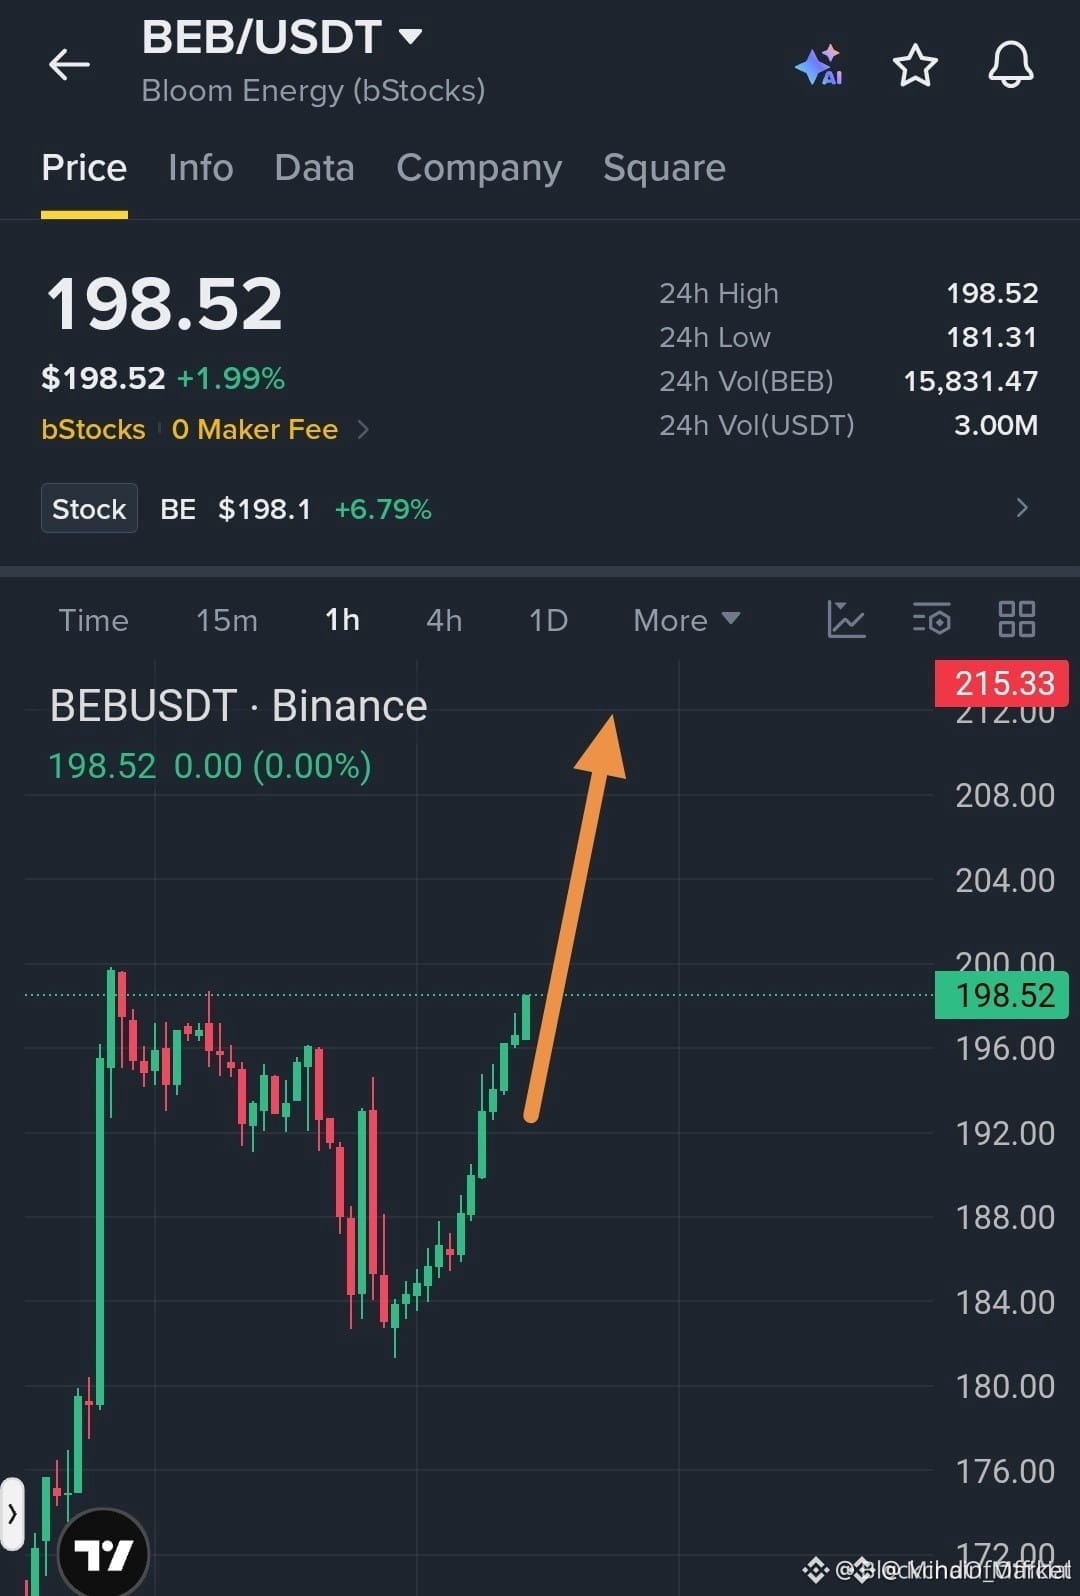
🚨 $BEB REBOUNDS HARD FROM SUPPORT WITH EYES LOCKED ON THE $215 RESISTANCE! 💥
Entry: $197.00 – $199.00 ⚡
Target: $215.00 🚀
Stop Loss: $192.00 ⚠️
Bulls just stepped in with serious authority, defending the $183 to $184 demand floor and printing consecutive green candles that left sellers scrambling. 🌊 This aggressive price action shows momentum is shifting firmly back into the buyer's court.
A clean, sustained break and hold above the psychological $200 mark opens the door for a rapid acceleration toward higher liquidity pockets. 📊 Are you accumulating here or waiting for a retest of the entry zone? 👇
⚠️ Not financial advice. Always manage your risk. 🛡️
🏷️ #BEB #LongSetup #Breakout #Crypto
🔥 💎
🚨 $BEB REBOUNDS HARD FROM SUPPORT WITH EYES LOCKED ON THE $215 RESISTANCE! 💥
Entry: $197.00 – $199.00 ⚡
Target: $215.00 🚀
Stop Loss: $192.00 ⚠️
Bulls just stepped in with serious authority, defending the $183 to $184 demand floor and printing consecutive green candles that left sellers scrambling. 🌊 This aggressive price action shows momentum is shifting firmly back into the buyer's court.
A clean, sustained break and hold above the psychological $200 mark opens the door for a rapid acceleration toward higher liquidity pockets. 📊 Are you accumulating here or waiting for a retest of the entry zone? 👇
⚠️ Not financial advice. Always manage your risk. 🛡️
🏷️ #BEB #LongSetup #Breakout #Crypto
🔥 💎
Entry: $197.00 – $199.00 ⚡
Target: $215.00 🚀
Stop Loss: $192.00 ⚠️
Bulls just stepped in with serious authority, defending the $183 to $184 demand floor and printing consecutive green candles that left sellers scrambling. 🌊 This aggressive price action shows momentum is shifting firmly back into the buyer's court.
A clean, sustained break and hold above the psychological $200 mark opens the door for a rapid acceleration toward higher liquidity pockets. 📊 Are you accumulating here or waiting for a retest of the entry zone? 👇
⚠️ Not financial advice. Always manage your risk. 🛡️
🏷️ #BEB #LongSetup #Breakout #Crypto
🔥 💎

·
--
🦈 $BEB SWEEPS THE 183 LIQUIDITY POOL AND PREPARES FOR A 215 RESISTANCE TEST! ⚡
Entry: 197.00 – 199.00 ⚡
Target: 215.00 🚀
Stop Loss: 192.00 ⚠️
Institutional order flow on $BEB is printing a clean structural recovery following that deep sweep into the 183 demand cluster. Consecutive bullish impulse candles confirm that smart money is actively absorbing supply while positioning for a push through the psychological 200 threshold. 📊
With structural inefficiency filling rapidly on the lower timeframes, momentum favors expansion toward higher liquidity pools. 💡 Are you scaling into this range reclaim early or waiting for confirmation above resistance? 👇
⚠️ Not financial advice. Always manage your risk. 🛡️
🏷️ #BEB #SmartMoney #Breakout #Crypto
🔥 💎
🦈 $BEB SWEEPS THE 183 LIQUIDITY POOL AND PREPARES FOR A 215 RESISTANCE TEST! ⚡
Entry: 197.00 – 199.00 ⚡
Target: 215.00 🚀
Stop Loss: 192.00 ⚠️
Institutional order flow on $BEB is printing a clean structural recovery following that deep sweep into the 183 demand cluster. Consecutive bullish impulse candles confirm that smart money is actively absorbing supply while positioning for a push through the psychological 200 threshold. 📊
With structural inefficiency filling rapidly on the lower timeframes, momentum favors expansion toward higher liquidity pools. 💡 Are you scaling into this range reclaim early or waiting for confirmation above resistance? 👇
⚠️ Not financial advice. Always manage your risk. 🛡️
🏷️ #BEB #SmartMoney #Breakout #Crypto
🔥 💎
Entry: 197.00 – 199.00 ⚡
Target: 215.00 🚀
Stop Loss: 192.00 ⚠️
Institutional order flow on $BEB is printing a clean structural recovery following that deep sweep into the 183 demand cluster. Consecutive bullish impulse candles confirm that smart money is actively absorbing supply while positioning for a push through the psychological 200 threshold. 📊
With structural inefficiency filling rapidly on the lower timeframes, momentum favors expansion toward higher liquidity pools. 💡 Are you scaling into this range reclaim early or waiting for confirmation above resistance? 👇
⚠️ Not financial advice. Always manage your risk. 🛡️
🏷️ #BEB #SmartMoney #Breakout #Crypto
🔥 💎
1

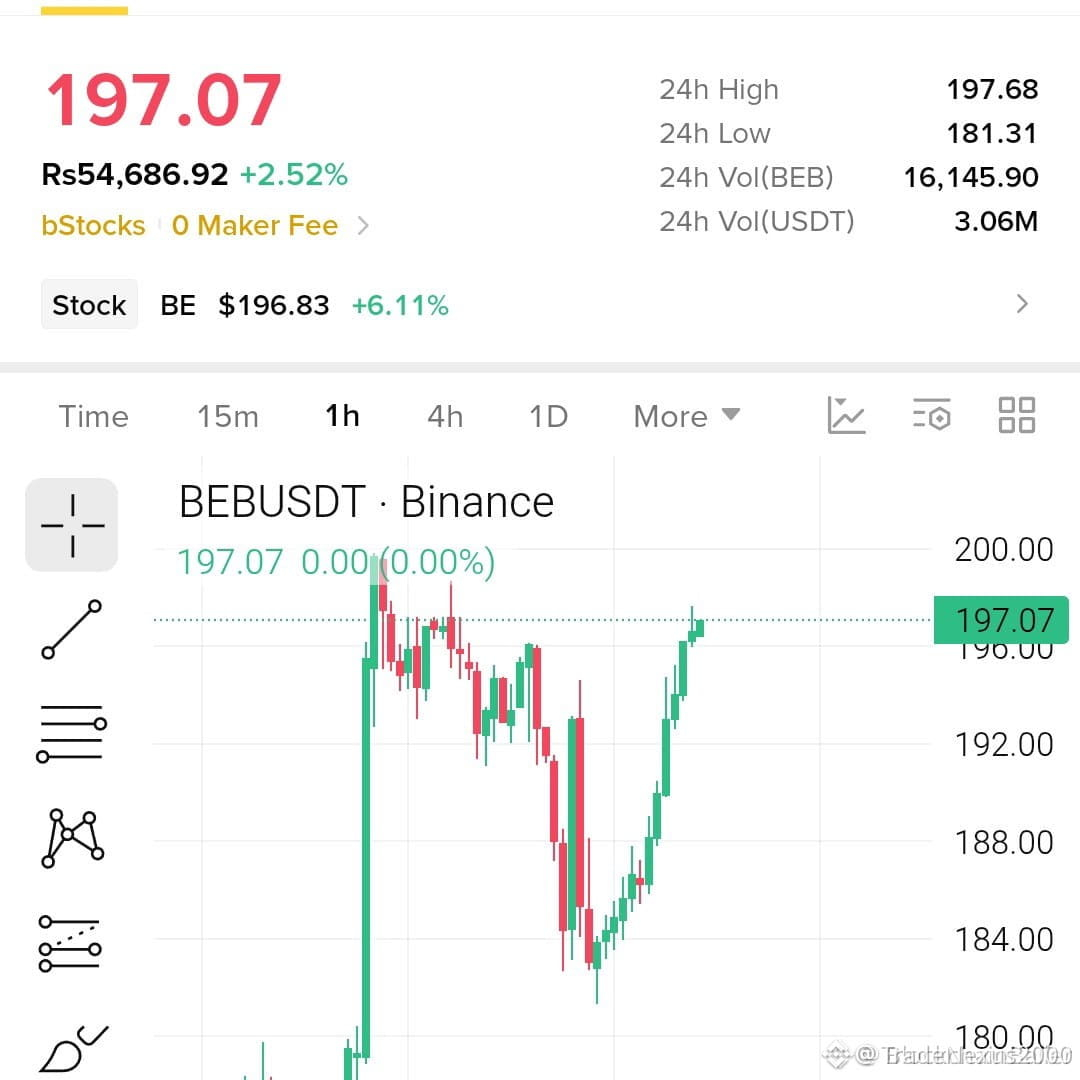
🦈 $BEB SMART MONEY SWEEPING INTO THE PRECISE DEMAND ZONE! 💥
Entry: 197.00 - 197.07 ⚡
Target: 205.00 🚀
Stop Loss: 190.00 ⚠️
Institutional order flow is currently retesting a pristine daily fair value gap right as incoming liquidity gets heavily absorbed near the local lows.
Aggressive sellers are rapidly exhausting their remaining momentum into this structural accumulation block, setting the stage for a powerful and impulsive markup phase. 📊
Are you positioning alongside smart money bids down here or waiting for a clean structural break above the overhead resistance? 💬 👇
⚠️ Not financial advice. Always manage your risk. 🛡️
🏷️ #BEB #SmartMoney #LongSetup #OrderBlock #Crypto
🔥 🦈
🦈 $BEB SMART MONEY SWEEPING INTO THE PRECISE DEMAND ZONE! 💥
Entry: 197.00 - 197.07 ⚡
Target: 205.00 🚀
Stop Loss: 190.00 ⚠️
Institutional order flow is currently retesting a pristine daily fair value gap right as incoming liquidity gets heavily absorbed near the local lows.
Aggressive sellers are rapidly exhausting their remaining momentum into this structural accumulation block, setting the stage for a powerful and impulsive markup phase. 📊
Are you positioning alongside smart money bids down here or waiting for a clean structural break above the overhead resistance? 💬 👇
⚠️ Not financial advice. Always manage your risk. 🛡️
🏷️ #BEB #SmartMoney #LongSetup #OrderBlock #Crypto
🔥 🦈
Entry: 197.00 - 197.07 ⚡
Target: 205.00 🚀
Stop Loss: 190.00 ⚠️
Institutional order flow is currently retesting a pristine daily fair value gap right as incoming liquidity gets heavily absorbed near the local lows.
Aggressive sellers are rapidly exhausting their remaining momentum into this structural accumulation block, setting the stage for a powerful and impulsive markup phase. 📊
Are you positioning alongside smart money bids down here or waiting for a clean structural break above the overhead resistance? 💬 👇
⚠️ Not financial advice. Always manage your risk. 🛡️
🏷️ #BEB #SmartMoney #LongSetup #OrderBlock #Crypto
🔥 🦈
3

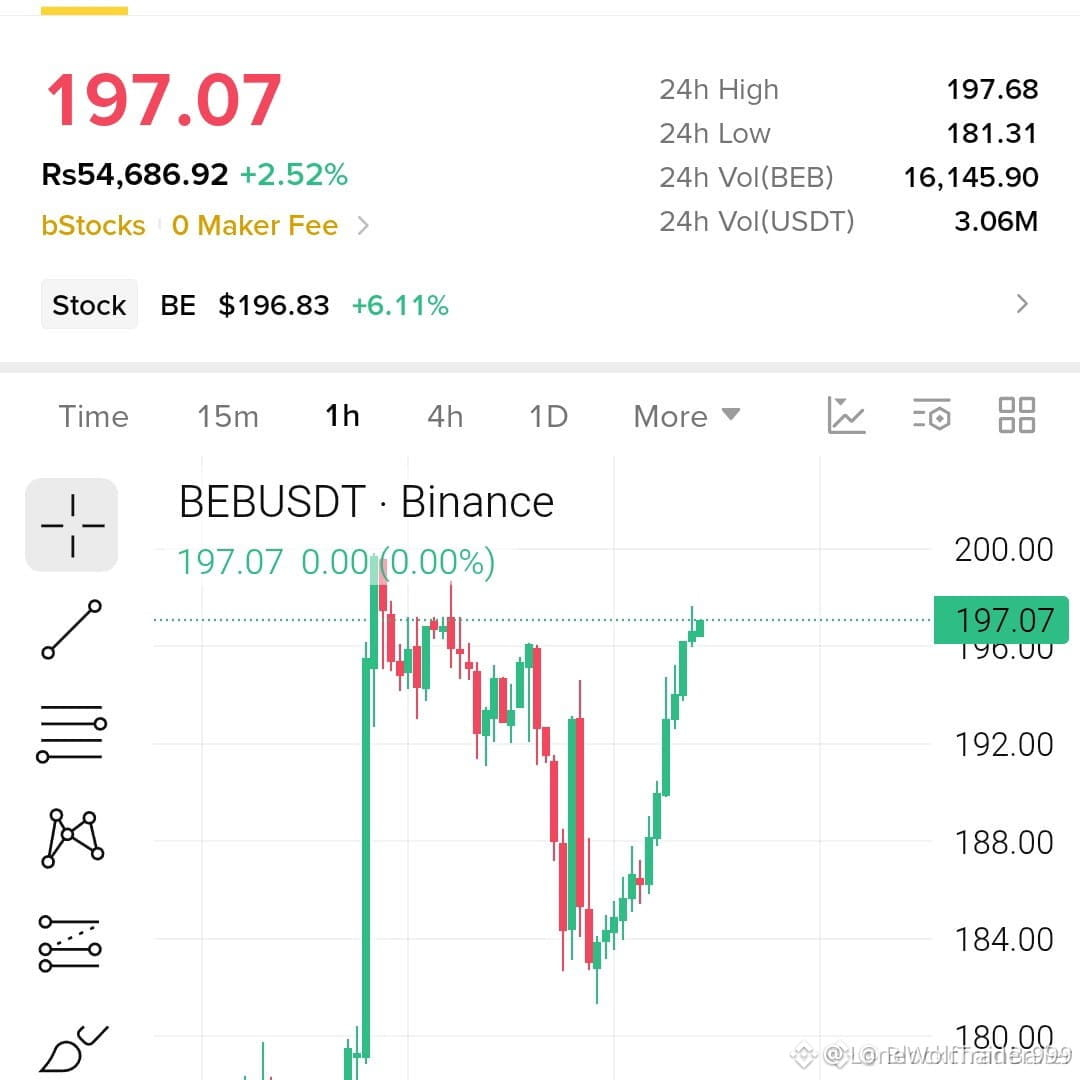
🚨 $BEB READY TO IGNITE AS BUYERS DEFEND THE KEY SUPPORT ZONE 🚀
Entry: 197.00 - 197.07 ⚡
Target: 205.00 🚀
Stop Loss: 190.00 ⚠️
Bulls are quietly building a rock-solid base right inside this demand pocket as order flow shifts in favor of persistent buyers. 📊 Volume profiles show aggressive absorption around these levels, setting the stage for a clean structural continuation toward higher liquidity pools. ⚡
Patience is the ultimate edge here as price coils tightly before the next leg expands across the order book. 💡 Are you positioning ahead of the breakout or waiting for confirmation on the lower timeframe retest? 👇
⚠️ Not financial advice. Always manage your risk. 🛡️
🏷️ #BEB #LongSetup #Momentum #Breakout #Crypto
🔥 💎
🚨 $BEB READY TO IGNITE AS BUYERS DEFEND THE KEY SUPPORT ZONE 🚀
Entry: 197.00 - 197.07 ⚡
Target: 205.00 🚀
Stop Loss: 190.00 ⚠️
Bulls are quietly building a rock-solid base right inside this demand pocket as order flow shifts in favor of persistent buyers. 📊 Volume profiles show aggressive absorption around these levels, setting the stage for a clean structural continuation toward higher liquidity pools. ⚡
Patience is the ultimate edge here as price coils tightly before the next leg expands across the order book. 💡 Are you positioning ahead of the breakout or waiting for confirmation on the lower timeframe retest? 👇
⚠️ Not financial advice. Always manage your risk. 🛡️
🏷️ #BEB #LongSetup #Momentum #Breakout #Crypto
🔥 💎
Entry: 197.00 - 197.07 ⚡
Target: 205.00 🚀
Stop Loss: 190.00 ⚠️
Bulls are quietly building a rock-solid base right inside this demand pocket as order flow shifts in favor of persistent buyers. 📊 Volume profiles show aggressive absorption around these levels, setting the stage for a clean structural continuation toward higher liquidity pools. ⚡
Patience is the ultimate edge here as price coils tightly before the next leg expands across the order book. 💡 Are you positioning ahead of the breakout or waiting for confirmation on the lower timeframe retest? 👇
⚠️ Not financial advice. Always manage your risk. 🛡️
🏷️ #BEB #LongSetup #Momentum #Breakout #Crypto
🔥 💎

·
--
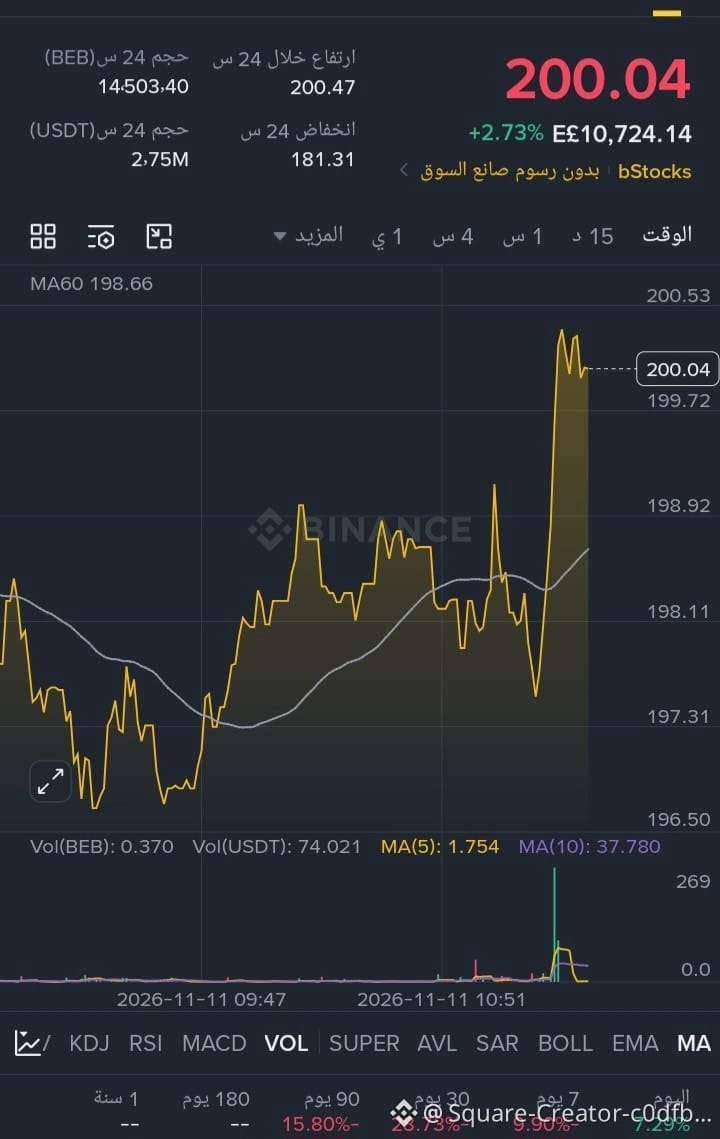
A new price surge opens the door to strong profit opportunities with $BEB!
Technical indicators on the chart for $BEB point to a strong breakout and clear buying momentum, pushing the price to trade at 200.04 and gain 2.73%. The price is currently above the MA60 moving average at 198.66, reflecting the strength of the upward trend and buyers’ dominance in current trading.
Buy zone (entry): It is recommended to seize the opportunity and build investment positions in the range between $198.50 and $199.20 to secure the best entry point.
Sell zone (resistance): Between $200.47 and $200.55 for taking partial profits.
Technical targets:
First target: $201.50.
Second target: $203.20.
Stop-loss: A daily close below $197.00 to protect capital.
Do you expect the coin to continue rising and break through the current resistance, or will it see a correction soon? Share your thoughts in the comments!
#العملات_الرقمية #$BEB
{spot}(BEBUSDT)
#تداول #تحليل_فني #BEB
A new price surge opens the door to strong profit opportunities with $BEB !
Technical indicators on the chart for $BEB point to a strong breakout and clear buying momentum, pushing the price to trade at 200.04 and gain 2.73%. The price is currently above the MA60 moving average at 198.66, reflecting the strength of the upward trend and buyers’ dominance in current trading.
Buy zone (entry): It is recommended to seize the opportunity and build investment positions in the range between $198.50 and $199.20 to secure the best entry point.
Sell zone (resistance): Between $200.47 and $200.55 for taking partial profits.
Technical targets:
First target: $201.50.
Second target: $203.20.
Stop-loss: A daily close below $197.00 to protect capital.
Do you expect the coin to continue rising and break through the current resistance, or will it see a correction soon? Share your thoughts in the comments!
#العملات_الرقمية #$BEB
#تداول #تحليل_فني #BEB
Technical indicators on the chart for $BEB point to a strong breakout and clear buying momentum, pushing the price to trade at 200.04 and gain 2.73%. The price is currently above the MA60 moving average at 198.66, reflecting the strength of the upward trend and buyers’ dominance in current trading.
Buy zone (entry): It is recommended to seize the opportunity and build investment positions in the range between $198.50 and $199.20 to secure the best entry point.
Sell zone (resistance): Between $200.47 and $200.55 for taking partial profits.
Technical targets:
First target: $201.50.
Second target: $203.20.
Stop-loss: A daily close below $197.00 to protect capital.
Do you expect the coin to continue rising and break through the current resistance, or will it see a correction soon? Share your thoughts in the comments!
#العملات_الرقمية #$BEB
#تداول #تحليل_فني #BEB
1
69

◆ TOP GAINERS WATCH ◆
🔥 $BEB — BEB is gaining visibility among Binance market participants.
🚀 $BEAMX — Beam-related market activity is attracting trader attention.
💠 $SIGN — Sign Protocol remains in focus as traders monitor its market momentum.
#BEB #BEAMX #SIGN #AltcoinWatch
{future}(SIGNUSDT)
{future}(BEAMXUSDT)
{spot}(BEBUSDT)
◆ TOP GAINERS WATCH ◆
🔥 $BEB — BEB is gaining visibility among Binance market participants.
🚀 $BEAMX — Beam-related market activity is attracting trader attention.
💠 $SIGN — Sign Protocol remains in focus as traders monitor its market momentum.
#BEB #BEAMX #SIGN #AltcoinWatch
🔥 $BEB — BEB is gaining visibility among Binance market participants.
🚀 $BEAMX — Beam-related market activity is attracting trader attention.
💠 $SIGN — Sign Protocol remains in focus as traders monitor its market momentum.
#BEB #BEAMX #SIGN #AltcoinWatch

18
·
--
$BEB +11.08% | $SIGN +11.07% | $NBISB +10.89%
#BEB climbed to $193.85, up 11.08% on $2.6 M of volume, suggesting fresh buying pressure.
#SIGN nudged higher to $0.00903000, also gaining 11.07% with the same $2.6 M turnover, reinforcing the parallel rally.
#NBISB rose to $140.65, up 10.89% backed by $1.7 M in trades, indicating modest but consistent interest.
📈 The synchronized double‑digit moves across different price ranges could signal a short‑term sector‑wide boost, though the sustainability remains uncertain.
#Write2Earn #Binance
$BEB +11.08% | $SIGN +11.07% | $NBISB +10.89%
#BEB climbed to $193.85, up 11.08% on $2.6 M of volume, suggesting fresh buying pressure.
#SIGN nudged higher to $0.00903000, also gaining 11.07% with the same $2.6 M turnover, reinforcing the parallel rally.
#NBISB rose to $140.65, up 10.89% backed by $1.7 M in trades, indicating modest but consistent interest.
📈 The synchronized double‑digit moves across different price ranges could signal a short‑term sector‑wide boost, though the sustainability remains uncertain.
#Write2Earn #Binance
#BEB climbed to $193.85, up 11.08% on $2.6 M of volume, suggesting fresh buying pressure.
#SIGN nudged higher to $0.00903000, also gaining 11.07% with the same $2.6 M turnover, reinforcing the parallel rally.
#NBISB rose to $140.65, up 10.89% backed by $1.7 M in trades, indicating modest but consistent interest.
📈 The synchronized double‑digit moves across different price ranges could signal a short‑term sector‑wide boost, though the sustainability remains uncertain.
#Write2Earn #Binance
·
--
$BEB +10.73% | $MRVLB +10.32% | $TST +10.21%
#BEB surged to $192.71, up +10.73% on $2.2 M of volume, suggesting fresh buying interest after a quiet stretch.
#MRVLB climbed to $154.32, gaining +10.32% with $2.0 M traded, keeping its momentum in line with the broader rally.
#TST nudged higher to $0.0129, +10.21% on a hefty $8.5 M of volume; the Binance‑deployed memecoin’s buzz appears to be translating into real liquidity.
Watch the contrast between TST’s strong volume and the more modest flows for BEB and MRVLB—it may hint at where community enthusiasm is concentrating.
#Write2Earn #Binance
$BEB +10.73% | $MRVLB +10.32% | $TST +10.21%
#BEB surged to $192.71, up +10.73% on $2.2 M of volume, suggesting fresh buying interest after a quiet stretch.
#MRVLB climbed to $154.32, gaining +10.32% with $2.0 M traded, keeping its momentum in line with the broader rally.
#TST nudged higher to $0.0129, +10.21% on a hefty $8.5 M of volume; the Binance‑deployed memecoin’s buzz appears to be translating into real liquidity.
Watch the contrast between TST’s strong volume and the more modest flows for BEB and MRVLB—it may hint at where community enthusiasm is concentrating.
#Write2Earn #Binance
#BEB surged to $192.71, up +10.73% on $2.2 M of volume, suggesting fresh buying interest after a quiet stretch.
#MRVLB climbed to $154.32, gaining +10.32% with $2.0 M traded, keeping its momentum in line with the broader rally.
#TST nudged higher to $0.0129, +10.21% on a hefty $8.5 M of volume; the Binance‑deployed memecoin’s buzz appears to be translating into real liquidity.
Watch the contrast between TST’s strong volume and the more modest flows for BEB and MRVLB—it may hint at where community enthusiasm is concentrating.
#Write2Earn #Binance
3

BEB RISES 9.3%: THE SURPRISE BEHIND TODAY’S MARKET MOVE
📈 A Strong Start
$BEB
{spot}(BEBUSDT)
has moved into the spotlight with a 9.3% gain in the last 24 hours. Its BEB/USDT price reached 194.89, while trading volume climbed to approximately 1,965,139 USDT as of November 10, 2026, at 02:42 UTC.
📊 The Interesting Twist
The move looks encouraging, but a green price chart does not tell the whole story. Volume shows how much value has been traded, while price change shows how the market has moved. Together, these figures show meaningful trading activity alongside a positive price move.
🔍 What Could Be Behind It?
Possible factors include increased buyer interest, short-term speculation, fresh market attention, or changing trader expectations. However, the available data does not confirm which factor caused BEB to rise. It would be misleading to present any single explanation as fact.
💡 The Lesson for Traders
Dragonfly Official encourages readers to look beyond the percentage gain. Watch whether trading activity remains strong, whether the price can maintain its progress, and whether new market information supports the move. No verified entry, stop-loss, or profit target is available from the supplied figures, so avoid treating this gain as a trading signal.
Keep positions small, use a suitable stop loss, and risk only what you can afford to lose. Crypto trading is risky, and this is not financial advice.
What to Watch Next: Can BEB maintain its momentum, or will profit-taking change the story?
#BEB
#CryptoMarket #MarketAnalysis #Altcoins #CryptoTrading
BEB RISES 9.3%: THE SURPRISE BEHIND TODAY’S MARKET MOVE
📈 A Strong Start
$BEB
has moved into the spotlight with a 9.3% gain in the last 24 hours. Its BEB/USDT price reached 194.89, while trading volume climbed to approximately 1,965,139 USDT as of November 10, 2026, at 02:42 UTC.
📊 The Interesting Twist
The move looks encouraging, but a green price chart does not tell the whole story. Volume shows how much value has been traded, while price change shows how the market has moved. Together, these figures show meaningful trading activity alongside a positive price move.
🔍 What Could Be Behind It?
Possible factors include increased buyer interest, short-term speculation, fresh market attention, or changing trader expectations. However, the available data does not confirm which factor caused BEB to rise. It would be misleading to present any single explanation as fact.
💡 The Lesson for Traders
Dragonfly Official encourages readers to look beyond the percentage gain. Watch whether trading activity remains strong, whether the price can maintain its progress, and whether new market information supports the move. No verified entry, stop-loss, or profit target is available from the supplied figures, so avoid treating this gain as a trading signal.
Keep positions small, use a suitable stop loss, and risk only what you can afford to lose. Crypto trading is risky, and this is not financial advice.
What to Watch Next: Can BEB maintain its momentum, or will profit-taking change the story?
#BEB
#CryptoMarket #MarketAnalysis #Altcoins #CryptoTrading
📈 A Strong Start
$BEB
has moved into the spotlight with a 9.3% gain in the last 24 hours. Its BEB/USDT price reached 194.89, while trading volume climbed to approximately 1,965,139 USDT as of November 10, 2026, at 02:42 UTC.
📊 The Interesting Twist
The move looks encouraging, but a green price chart does not tell the whole story. Volume shows how much value has been traded, while price change shows how the market has moved. Together, these figures show meaningful trading activity alongside a positive price move.
🔍 What Could Be Behind It?
Possible factors include increased buyer interest, short-term speculation, fresh market attention, or changing trader expectations. However, the available data does not confirm which factor caused BEB to rise. It would be misleading to present any single explanation as fact.
💡 The Lesson for Traders
Dragonfly Official encourages readers to look beyond the percentage gain. Watch whether trading activity remains strong, whether the price can maintain its progress, and whether new market information supports the move. No verified entry, stop-loss, or profit target is available from the supplied figures, so avoid treating this gain as a trading signal.
Keep positions small, use a suitable stop loss, and risk only what you can afford to lose. Crypto trading is risky, and this is not financial advice.
What to Watch Next: Can BEB maintain its momentum, or will profit-taking change the story?
#BEB
#CryptoMarket #MarketAnalysis #Altcoins #CryptoTrading
7

·
--
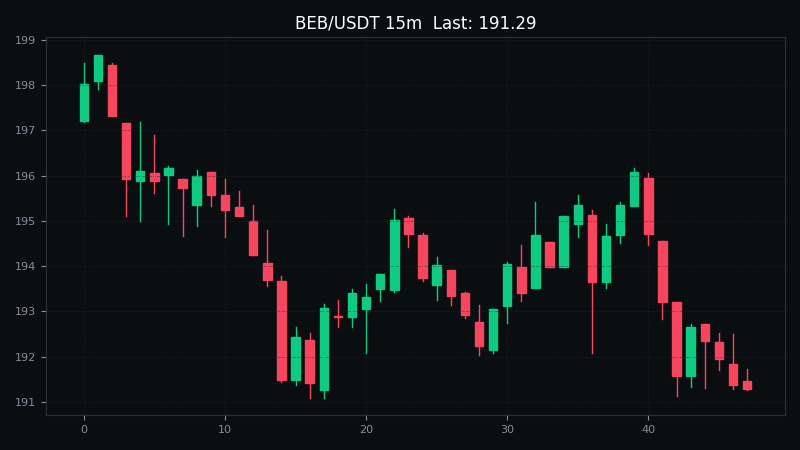
Let’s talk about $BEB ’s market action: up 9.4% in 24 hours, with intense bull-bear battles around 191.32.
This is the kind of level that really tests your judgment: chase it and you worry about a pullback; sit it out and you worry about missing the move. My take: first see whether volume can stay strong, then watch whether 191.32 holds—when the market is trending, going with the trend is always easier than trying to call the top or bottom.
Just sharing thoughts—what’s your trading strategy? #BEB
For discussion only; this is not investment advice.
Let’s talk about $BEB ’s market action: up 9.4% in 24 hours, with intense bull-bear battles around 191.32.
This is the kind of level that really tests your judgment: chase it and you worry about a pullback; sit it out and you worry about missing the move. My take: first see whether volume can stay strong, then watch whether 191.32 holds—when the market is trending, going with the trend is always easier than trying to call the top or bottom.
Just sharing thoughts—what’s your trading strategy? #BEB
For discussion only; this is not investment advice.
This is the kind of level that really tests your judgment: chase it and you worry about a pullback; sit it out and you worry about missing the move. My take: first see whether volume can stay strong, then watch whether 191.32 holds—when the market is trending, going with the trend is always easier than trying to call the top or bottom.
Just sharing thoughts—what’s your trading strategy? #BEB
For discussion only; this is not investment advice.
1
·
--
$BEB +10.72% | $LITEB +10.66% | $SIGN +9.15%
#BEB surged to $194.53, up +10.72% on $1.2 M of volume.
#LITEB climbed to $598.89, gaining +10.66% while seeing $1.9 M traded.
#SIGN pushed higher to $0.00930000, up +9.15% on a $2.5 M volume spike.
📊 The spread in volume—SIGN’s $2.5 M versus the sub‑$2 M for the others—could influence how long each rally holds.
#Write2Earn #Binance
$BEB +10.72% | $LITEB +10.66% | $SIGN +9.15%
#BEB surged to $194.53, up +10.72% on $1.2 M of volume.
#LITEB climbed to $598.89, gaining +10.66% while seeing $1.9 M traded.
#SIGN pushed higher to $0.00930000, up +9.15% on a $2.5 M volume spike.
📊 The spread in volume—SIGN’s $2.5 M versus the sub‑$2 M for the others—could influence how long each rally holds.
#Write2Earn #Binance
#BEB surged to $194.53, up +10.72% on $1.2 M of volume.
#LITEB climbed to $598.89, gaining +10.66% while seeing $1.9 M traded.
#SIGN pushed higher to $0.00930000, up +9.15% on a $2.5 M volume spike.
📊 The spread in volume—SIGN’s $2.5 M versus the sub‑$2 M for the others—could influence how long each rally holds.
#Write2Earn #Binance
5
·
--
$BEB +10.57% | $LITEB +10.35% | $PROM +9.74%
#BEB is holding $194.28, up +10.57% on $1.2 M of volume. The price jump looks solid, though the modest turnover suggests a watchful eye on liquidity.
#LITEB trades at $597.31, gaining +10.35% with $1.9 M volume. Stronger hands are moving in, but the higher price may attract short‑term profit‑taking.
#PROM sits at $5.71, climbing +9.74% on $1.9 M volume. Momentum is clear, yet the modest cap could make it vulnerable to a quick reversal.
👀 Keep an eye on whether the parallel volume lifts for LITEB and PROM can keep the upward bias alive across the session.
#Write2Earn #Binance
$BEB +10.57% | $LITEB +10.35% | $PROM +9.74%
#BEB is holding $194.28, up +10.57% on $1.2 M of volume. The price jump looks solid, though the modest turnover suggests a watchful eye on liquidity.
#LITEB trades at $597.31, gaining +10.35% with $1.9 M volume. Stronger hands are moving in, but the higher price may attract short‑term profit‑taking.
#PROM sits at $5.71, climbing +9.74% on $1.9 M volume. Momentum is clear, yet the modest cap could make it vulnerable to a quick reversal.
👀 Keep an eye on whether the parallel volume lifts for LITEB and PROM can keep the upward bias alive across the session.
#Write2Earn #Binance
#BEB is holding $194.28, up +10.57% on $1.2 M of volume. The price jump looks solid, though the modest turnover suggests a watchful eye on liquidity.
#LITEB trades at $597.31, gaining +10.35% with $1.9 M volume. Stronger hands are moving in, but the higher price may attract short‑term profit‑taking.
#PROM sits at $5.71, climbing +9.74% on $1.9 M volume. Momentum is clear, yet the modest cap could make it vulnerable to a quick reversal.
👀 Keep an eye on whether the parallel volume lifts for LITEB and PROM can keep the upward bias alive across the session.
#Write2Earn #Binance
4
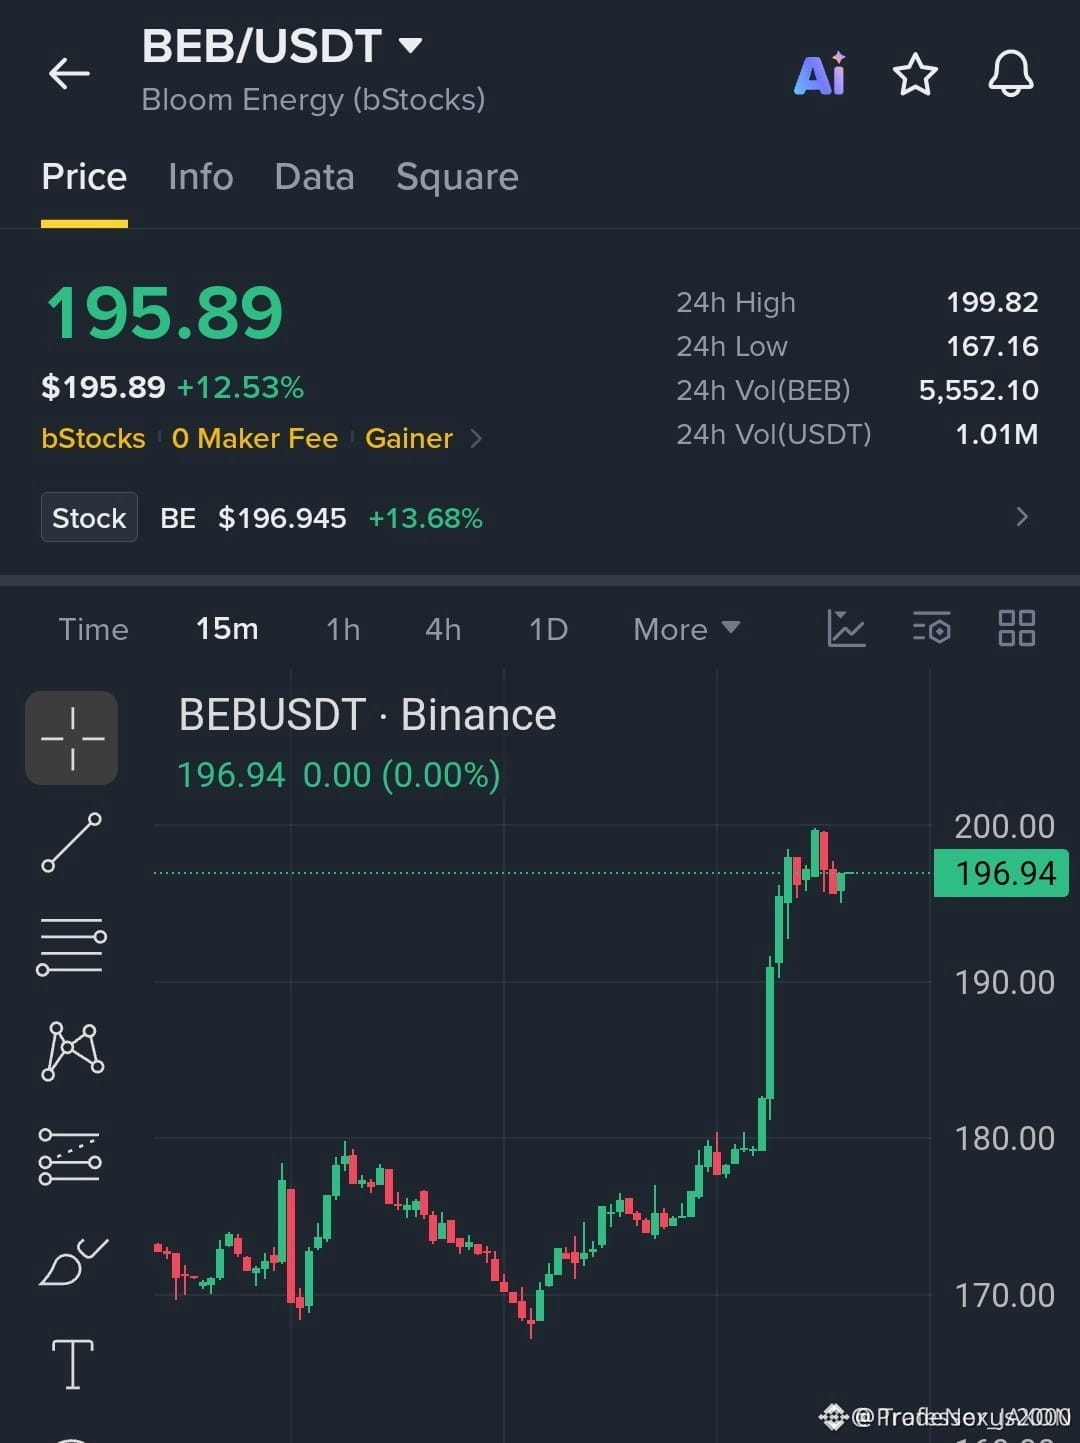
🚨 $BEB CONSOLIDATING RIGHT BELOW MAJOR RESISTANCE AFTER AN IMPULSIVE BREAKOUT 💥
Entry: 194.00–197.00 ⚡
Target: 200.00, 205.00, 210.00 🚀
Stop Loss: 190.00 ⚠️
Institutional order flow on $BEB is displaying textbook accumulation traits as price compresses directly beneath the psychological resistance level. Strong bullish momentum has absorbed early profit-taking, leaving a clean structural base intact above the lower boundary. 📊
Holding the demand floor confirms smart money defense while building energy for a secondary expansion phase. A decisive clearance of overhead supply should unlock rapid acceleration toward higher institutional targets. 💡
Are you looking to scale in during this tight consolidation or waiting for a confirmed candle close above resistance? 👇
⚠️ Not financial advice. Always manage your risk. 🛡️
🏷️ #BEB #LongSetup #Crypto #Breakout #OrderFlow
🔥 💎
🚨 $BEB CONSOLIDATING RIGHT BELOW MAJOR RESISTANCE AFTER AN IMPULSIVE BREAKOUT 💥
Entry: 194.00–197.00 ⚡
Target: 200.00, 205.00, 210.00 🚀
Stop Loss: 190.00 ⚠️
Institutional order flow on $BEB is displaying textbook accumulation traits as price compresses directly beneath the psychological resistance level. Strong bullish momentum has absorbed early profit-taking, leaving a clean structural base intact above the lower boundary. 📊
Holding the demand floor confirms smart money defense while building energy for a secondary expansion phase. A decisive clearance of overhead supply should unlock rapid acceleration toward higher institutional targets. 💡
Are you looking to scale in during this tight consolidation or waiting for a confirmed candle close above resistance? 👇
⚠️ Not financial advice. Always manage your risk. 🛡️
🏷️ #BEB #LongSetup #Crypto #Breakout #OrderFlow
🔥 💎
Entry: 194.00–197.00 ⚡
Target: 200.00, 205.00, 210.00 🚀
Stop Loss: 190.00 ⚠️
Institutional order flow on $BEB is displaying textbook accumulation traits as price compresses directly beneath the psychological resistance level. Strong bullish momentum has absorbed early profit-taking, leaving a clean structural base intact above the lower boundary. 📊
Holding the demand floor confirms smart money defense while building energy for a secondary expansion phase. A decisive clearance of overhead supply should unlock rapid acceleration toward higher institutional targets. 💡
Are you looking to scale in during this tight consolidation or waiting for a confirmed candle close above resistance? 👇
⚠️ Not financial advice. Always manage your risk. 🛡️
🏷️ #BEB #LongSetup #Crypto #Breakout #OrderFlow
🔥 💎
10
Log in to explore more content
Join global crypto users on Binance Square
⚡️ Get latest and useful information about crypto.
💬 Trusted by the world’s largest crypto exchange.
👍 Discover real insights from verified creators.
Email / Phone number
Trending Topics
1
#NvidiaLoses$2.7TrillionInMonthAndAHalf
26,783 views
153 Discussing
2
#CanBTCReboundAfterFallingBelow60K?
831,663 views
3,128 Discussing
3
#GlobalStocksFaceLongestLosingStreakSince2023
309,960 views
2,089 Discussing
4
#BlackRockIBITPostsRecord$541MSingleDayOutflow
38,827 views
112 Discussing
5
#AnthropicPlungesTowardIPOPriceonDay2
159,855 views
1,273 Discussing
6
#TwentyOneCapitalAdds172.25BTC
74,045 views
710 Discussing
7
#HKBillWouldExcludeTokenizedDepositsFromVirtualAssets
10,348 views
52 Discussing
8
#BNBDropsBelow540USDTWith8.46%DailyDecline
85,200 views
688 Discussing
9
#HKBillProposesHK$100KFineForUnauthorizedCryptoTitles
2,899 views
25 Discussing
10
#BitMineFaces$10.1BUnrealizedETHLoss
6,004 views
30 Discussing