
#bera
bera
7.1M views
13,388 Discussing
Hot
Latest

·
--
Bullish
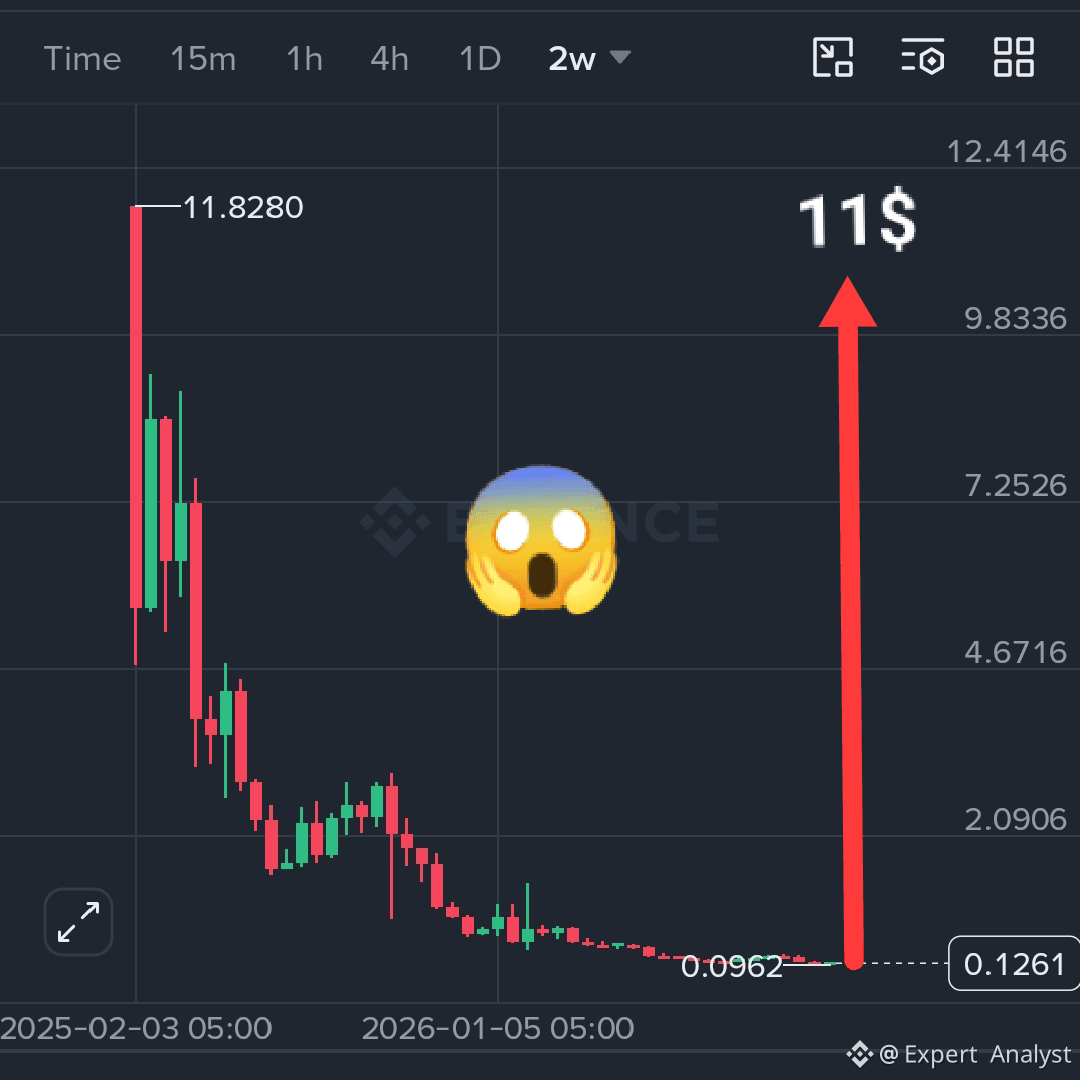
🚀🔥 $BERA — FROM $11.82 TO JUST $0.126!
Next💥 target🎯: $1 → $3 → $5 → $11 could be a game changer! 💰
What’s your target for $BERA ? 👀
#BERA #BinanceSquareFamily #Berachain #Altcoins #BullRun
🚀🔥 $BERA — FROM $11.82 TO JUST $0.126!
Next💥 target🎯: $1 → $3 → $5 → $11 could be a game changer! 💰
What’s your target for $BERA ? 👀
#BERA #BinanceSquareFamily #Berachain #Altcoins #BullRun
Next💥 target🎯: $1 → $3 → $5 → $11 could be a game changer! 💰
What’s your target for $BERA ? 👀
#BERA #BinanceSquareFamily #Berachain #Altcoins #BullRun
checkquake:
:)))))
1
209

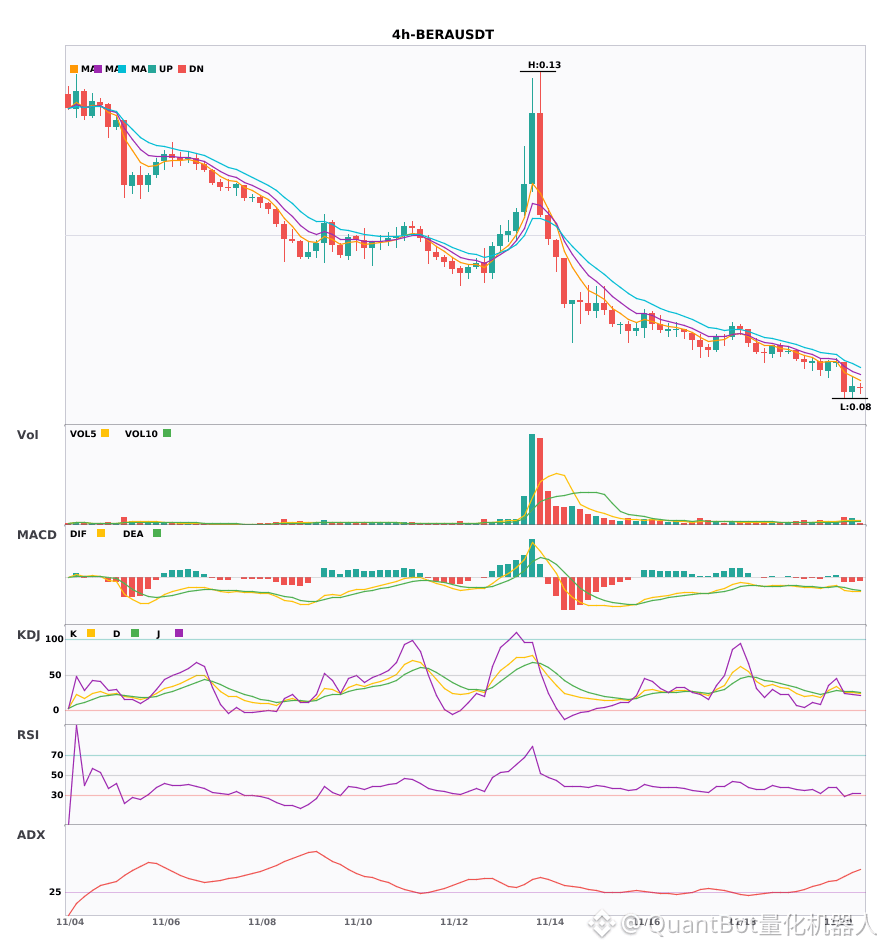
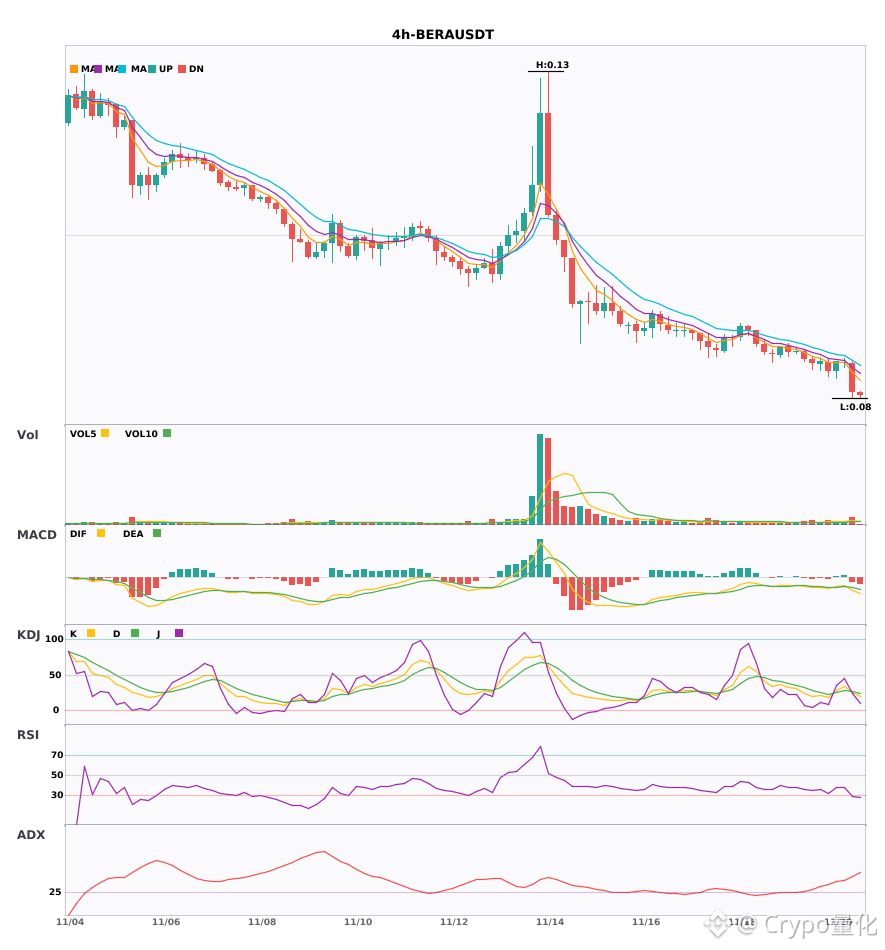
$BERA 4H periodic bearish signal confirmed; downtrend continues
📉 $BERA | 4-hour bearish signal
━━━━━━━━━━━━━━━━━━
Technical analysis: ADX 47 indicates a strong trend; beware of a pullback. MACD is below zero with a bearish crossover, accelerating the downtrend. EMA5<8<13 shows bearish alignment. KDJ bearish crossover (K26.1 D27.2), leaning bearish. Volume increased 2.2x.
Price change: -6.4200%
━━━━━━━━━━━━━━━━━━
#技术分析 #BERA
📌 The above content is for reference only and does not constitute investment advice
$BERA 4H periodic bearish signal confirmed; downtrend continues
📉 $BERA | 4-hour bearish signal
━━━━━━━━━━━━━━━━━━
Technical analysis: ADX 47 indicates a strong trend; beware of a pullback. MACD is below zero with a bearish crossover, accelerating the downtrend. EMA5<8<13 shows bearish alignment. KDJ bearish crossover (K26.1 D27.2), leaning bearish. Volume increased 2.2x.
Price change: -6.4200%
━━━━━━━━━━━━━━━━━━
#技术分析 #BERA
📌 The above content is for reference only and does not constitute investment advice
📉 $BERA | 4-hour bearish signal
━━━━━━━━━━━━━━━━━━
Technical analysis: ADX 47 indicates a strong trend; beware of a pullback. MACD is below zero with a bearish crossover, accelerating the downtrend. EMA5<8<13 shows bearish alignment. KDJ bearish crossover (K26.1 D27.2), leaning bearish. Volume increased 2.2x.
Price change: -6.4200%
━━━━━━━━━━━━━━━━━━
#技术分析 #BERA
📌 The above content is for reference only and does not constitute investment advice
16

·
--
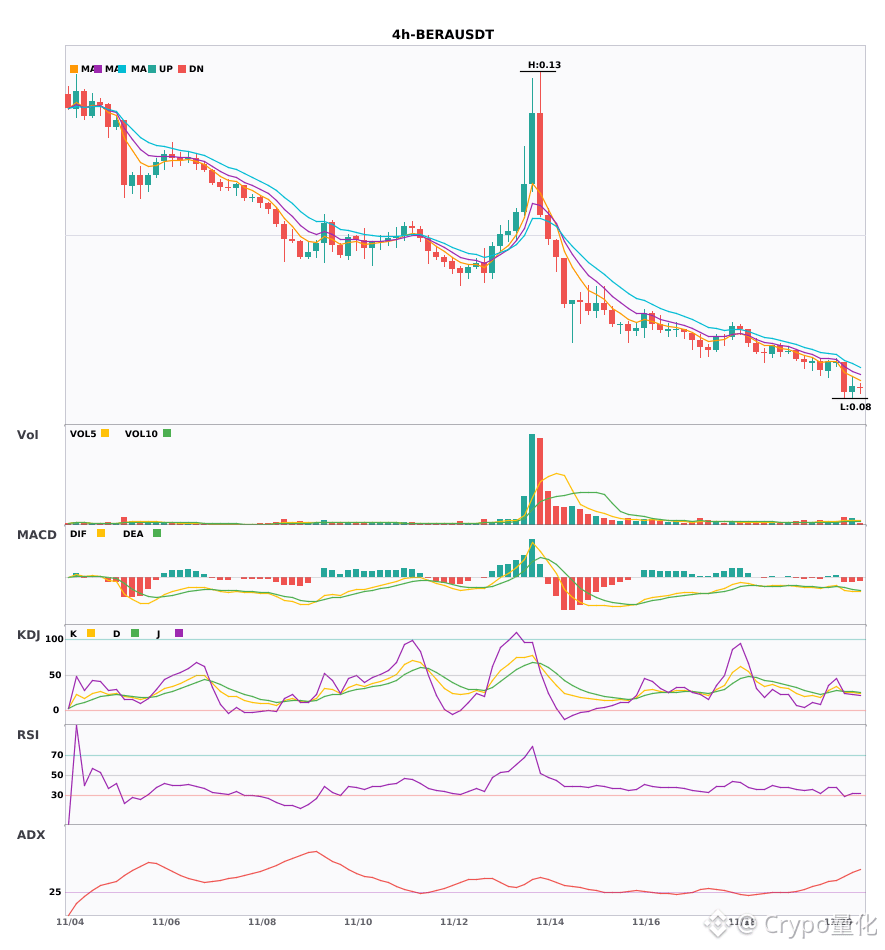
$BERA 4-hour trend has turned bearish, with more short-term pressure ahead 🔥
════════════════════
🟢 $BERA 4-hour bearish signal
⚠️Technical analysis: ADX surged to 47, indicating an extremely strong trend—watch for an overheated pullback; MACD crossed bearishly below zero, accelerating the bearish momentum; moving averages are in bearish alignment; KDJ bearish crossover, short-term outlook is bearish, with volume up 2.2x
════════════════════
🔔 Follow for first-hand market updates 🔔
#技术分析 #BERA
📌 When trading, pay attention to whether the candlestick pattern confirms the signal
$BERA 4-hour trend has turned bearish, with more short-term pressure ahead 🔥
════════════════════
🟢 $BERA 4-hour bearish signal
⚠️Technical analysis: ADX surged to 47, indicating an extremely strong trend—watch for an overheated pullback; MACD crossed bearishly below zero, accelerating the bearish momentum; moving averages are in bearish alignment; KDJ bearish crossover, short-term outlook is bearish, with volume up 2.2x
════════════════════
🔔 Follow for first-hand market updates 🔔
#技术分析 #BERA
📌 When trading, pay attention to whether the candlestick pattern confirms the signal
════════════════════
🟢 $BERA 4-hour bearish signal
⚠️Technical analysis: ADX surged to 47, indicating an extremely strong trend—watch for an overheated pullback; MACD crossed bearishly below zero, accelerating the bearish momentum; moving averages are in bearish alignment; KDJ bearish crossover, short-term outlook is bearish, with volume up 2.2x
════════════════════
🔔 Follow for first-hand market updates 🔔
#技术分析 #BERA
📌 When trading, pay attention to whether the candlestick pattern confirms the signal
17
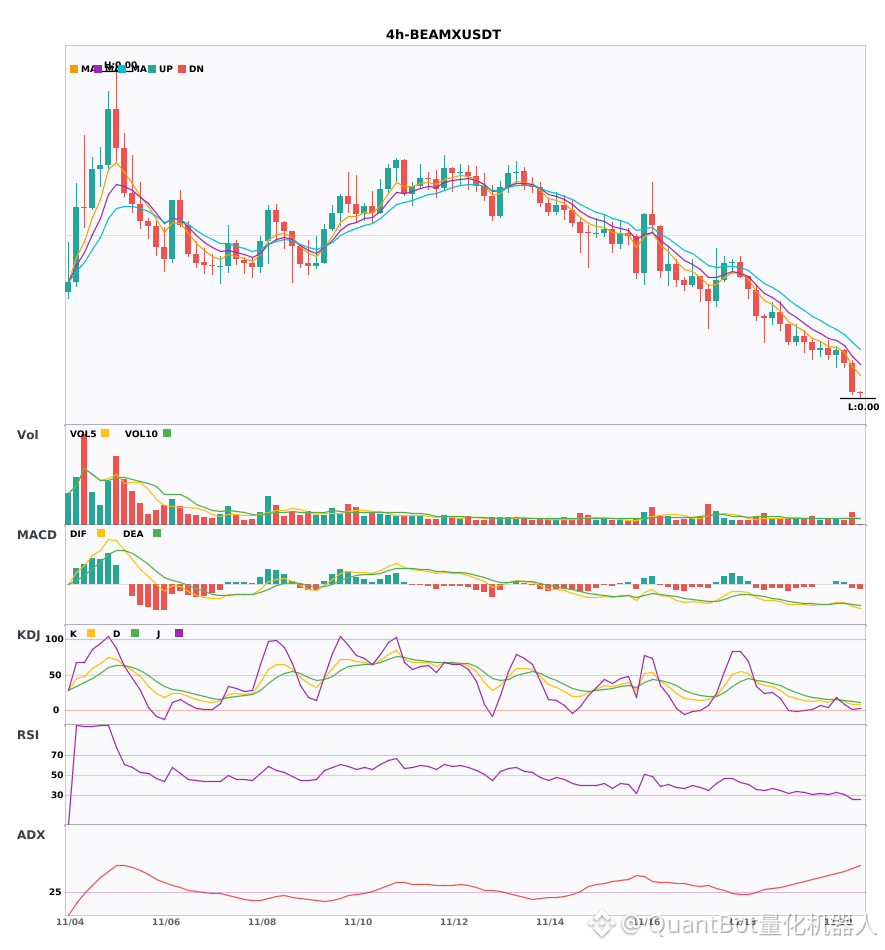
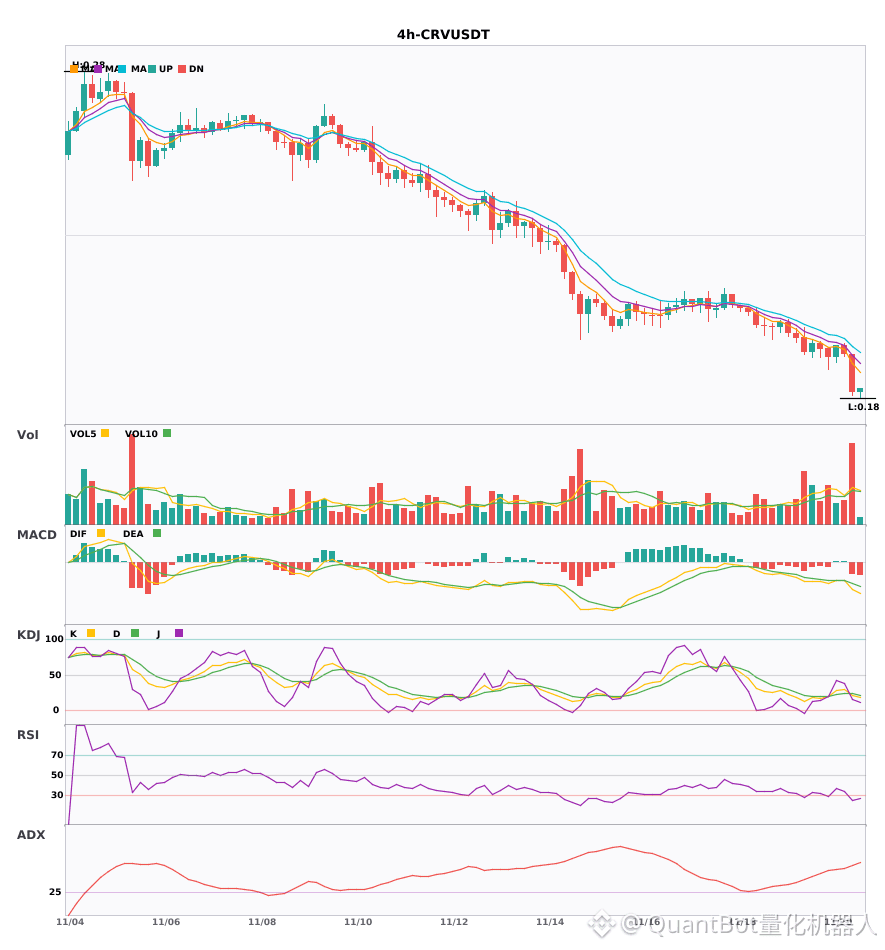
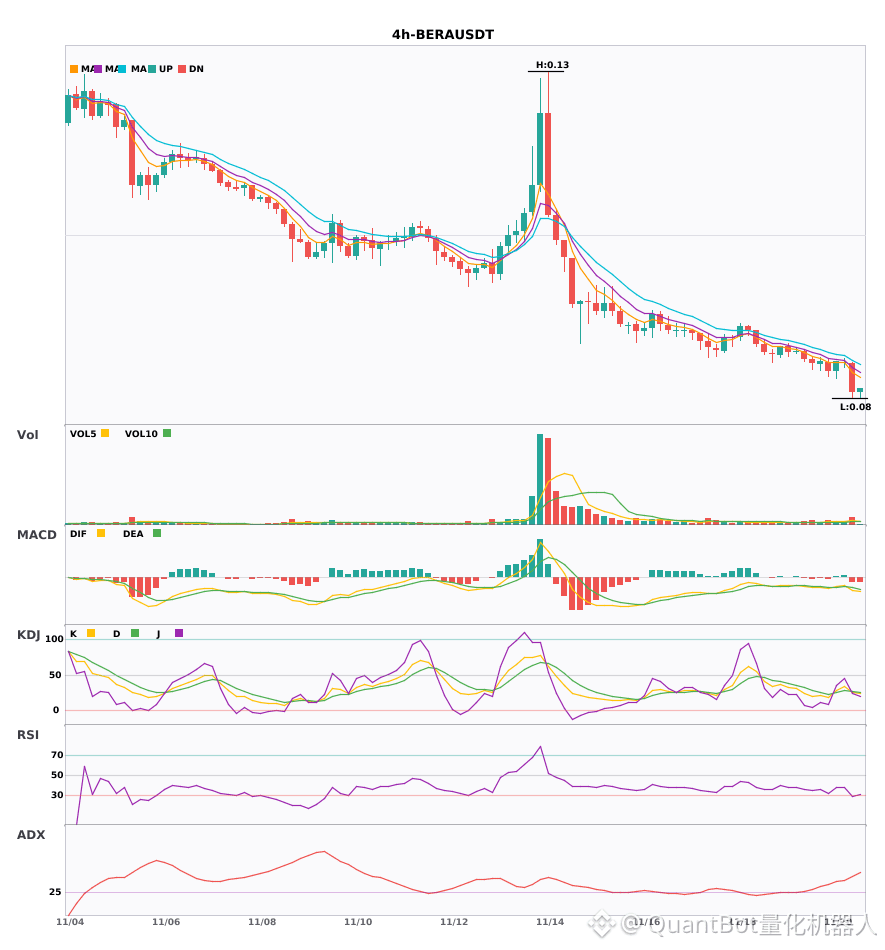
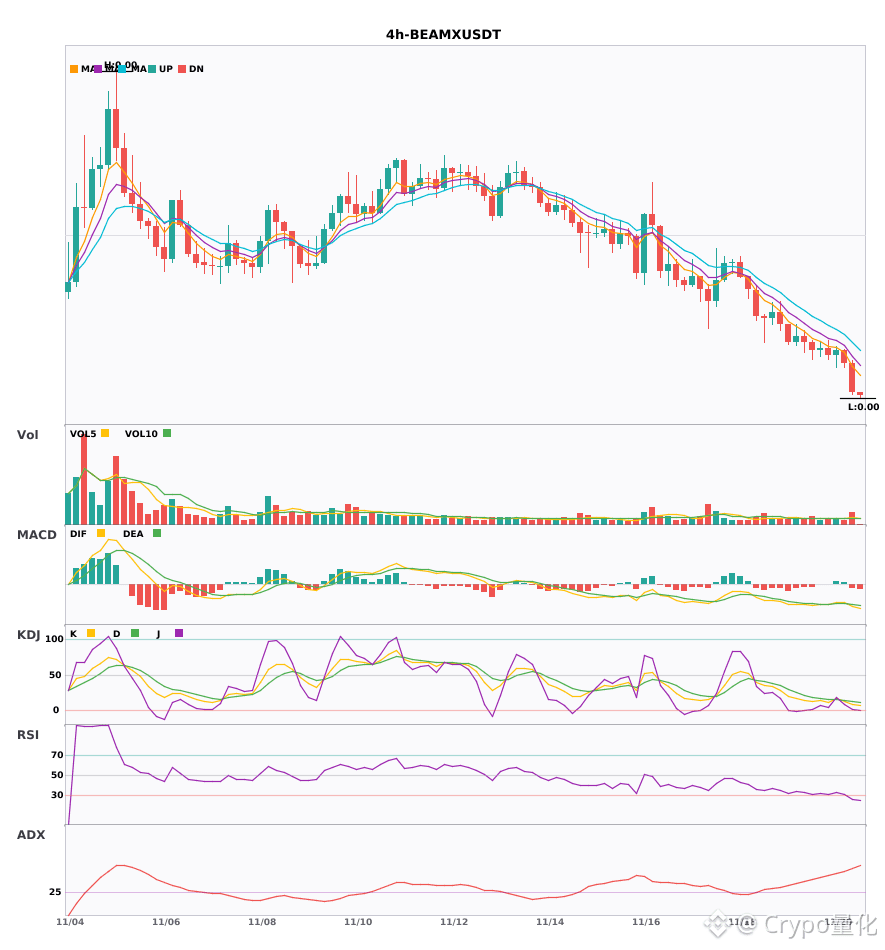
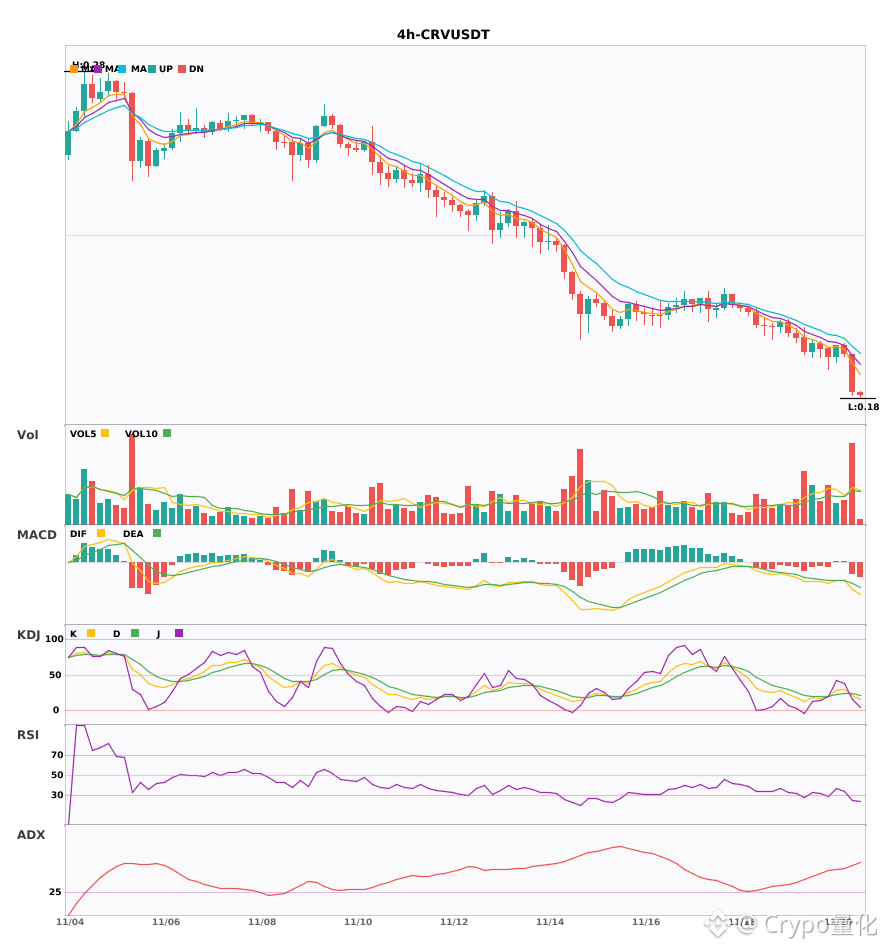
$BEAMX/$CRV/$BERA 4-hour technicals weakening in sync alert
📉 $BEAMX | 4-hour bearish signal
━━━━━━━━━━━━━━━━━━
Technical analysis: ADX(56) indicates a strong trend; MACD bearish crossover below zero, with bearish momentum accelerating; EMA5/8/13 in bearish alignment; KDJ oversold; volume up 1.8x.
Price change: -4.4700%
📉 $CRV | 4-hour bearish signal
━━━━━━━━━━━━━━━━━━
Technical analysis: ADX(58) indicates a strong trend; beware of a pullback from overbought conditions. MACD bearish crossover below zero, with bearish momentum strengthening. EMA5\u0026lt;EMA8\u0026lt;EMA13 in bearish alignment. KDJ bearish crossover (K21.0/D23.5), indicating a short-term bearish bias. Trading volume up 2.3x.
Price change: -6.3600%
📉 $BERA | 4-hour bearish signal
━━━━━━━━━━━━━━━━━━
Technical analysis: ADX47 indicates a strong trend (watch for a pullback); MACD bearish crossover below zero; EMAs in bearish alignment; KDJ bearish crossover (K26.1/D27.2); volume 2.2x.
Price change: -6.4200%
━━━━━━━━━━━━━━━━━━
#技术分析 #BEAMX #CRV #BERA
📌 The above content is for reference only and does not constitute investment advice
$BEAMX /$CRV /$BERA 4-hour technicals weakening in sync alert
📉 $BEAMX | 4-hour bearish signal
━━━━━━━━━━━━━━━━━━
Technical analysis: ADX(56) indicates a strong trend; MACD bearish crossover below zero, with bearish momentum accelerating; EMA5/8/13 in bearish alignment; KDJ oversold; volume up 1.8x.
Price change: -4.4700%
📉 $CRV | 4-hour bearish signal
━━━━━━━━━━━━━━━━━━
Technical analysis: ADX(58) indicates a strong trend; beware of a pullback from overbought conditions. MACD bearish crossover below zero, with bearish momentum strengthening. EMA5\u0026lt;EMA8\u0026lt;EMA13 in bearish alignment. KDJ bearish crossover (K21.0/D23.5), indicating a short-term bearish bias. Trading volume up 2.3x.
Price change: -6.3600%
📉 $BERA | 4-hour bearish signal
━━━━━━━━━━━━━━━━━━
Technical analysis: ADX47 indicates a strong trend (watch for a pullback); MACD bearish crossover below zero; EMAs in bearish alignment; KDJ bearish crossover (K26.1/D27.2); volume 2.2x.
Price change: -6.4200%
━━━━━━━━━━━━━━━━━━
#技术分析 #BEAMX #CRV #BERA
📌 The above content is for reference only and does not constitute investment advice
📉 $BEAMX | 4-hour bearish signal
━━━━━━━━━━━━━━━━━━
Technical analysis: ADX(56) indicates a strong trend; MACD bearish crossover below zero, with bearish momentum accelerating; EMA5/8/13 in bearish alignment; KDJ oversold; volume up 1.8x.
Price change: -4.4700%
📉 $CRV | 4-hour bearish signal
━━━━━━━━━━━━━━━━━━
Technical analysis: ADX(58) indicates a strong trend; beware of a pullback from overbought conditions. MACD bearish crossover below zero, with bearish momentum strengthening. EMA5\u0026lt;EMA8\u0026lt;EMA13 in bearish alignment. KDJ bearish crossover (K21.0/D23.5), indicating a short-term bearish bias. Trading volume up 2.3x.
Price change: -6.3600%
📉 $BERA | 4-hour bearish signal
━━━━━━━━━━━━━━━━━━
Technical analysis: ADX47 indicates a strong trend (watch for a pullback); MACD bearish crossover below zero; EMAs in bearish alignment; KDJ bearish crossover (K26.1/D27.2); volume 2.2x.
Price change: -6.4200%
━━━━━━━━━━━━━━━━━━
#技术分析 #BEAMX #CRV #BERA
📌 The above content is for reference only and does not constitute investment advice
16
·
--
4-hour bearish signals are here $BEAMX $CRV $BERA Pay attention to these three coins 🔥
════════════════════
🟢 $BEAMX 4-hour bearish signal
⚠️Technical analysis: ADX indicates a very strong trend; beware of an overheated pullback. MACD has formed a bearish crossover below zero, and bearish momentum is accelerating. Moving averages are bearishly aligned. KDJ is oversold; watch for a rebound before K crosses above D. Volume is up 1.8x.
════════════════════
🟢 $CRV 4-hour bearish signal
⚠️Technical analysis: The trend is very strong, but watch out for a pullback. MACD has formed a bearish crossover and bearish momentum is accelerating. Moving averages are diverging downward in a bearish alignment. KDJ has formed a bearish crossover, indicating a short-term bearish outlook. Volume is up 2.3x.
════════════════════
🟢 $BERA 4-hour bearish signal
⚠️Technical analysis: ADX indicates a very strong trend, but beware of an overheated pullback; MACD has formed a bearish crossover and bearish momentum is accelerating; moving averages are bearishly aligned and trending downward; KDJ has formed a bearish crossover, indicating a short-term bearish outlook; volume is up 2.2x.
════════════════════
🔔 Follow for first-hand market movement alerts 🔔
#技术分析 #BEAMX #CRV #BERA
📌 When trading, pay attention to whether the candlestick pattern matches.
4-hour bearish signals are here $BEAMX $CRV $BERA Pay attention to these three coins 🔥
════════════════════
🟢 $BEAMX 4-hour bearish signal
⚠️Technical analysis: ADX indicates a very strong trend; beware of an overheated pullback. MACD has formed a bearish crossover below zero, and bearish momentum is accelerating. Moving averages are bearishly aligned. KDJ is oversold; watch for a rebound before K crosses above D. Volume is up 1.8x.
════════════════════
🟢 $CRV 4-hour bearish signal
⚠️Technical analysis: The trend is very strong, but watch out for a pullback. MACD has formed a bearish crossover and bearish momentum is accelerating. Moving averages are diverging downward in a bearish alignment. KDJ has formed a bearish crossover, indicating a short-term bearish outlook. Volume is up 2.3x.
════════════════════
🟢 $BERA 4-hour bearish signal
⚠️Technical analysis: ADX indicates a very strong trend, but beware of an overheated pullback; MACD has formed a bearish crossover and bearish momentum is accelerating; moving averages are bearishly aligned and trending downward; KDJ has formed a bearish crossover, indicating a short-term bearish outlook; volume is up 2.2x.
════════════════════
🔔 Follow for first-hand market movement alerts 🔔
#技术分析 #BEAMX #CRV #BERA
📌 When trading, pay attention to whether the candlestick pattern matches.
════════════════════
🟢 $BEAMX 4-hour bearish signal
⚠️Technical analysis: ADX indicates a very strong trend; beware of an overheated pullback. MACD has formed a bearish crossover below zero, and bearish momentum is accelerating. Moving averages are bearishly aligned. KDJ is oversold; watch for a rebound before K crosses above D. Volume is up 1.8x.
════════════════════
🟢 $CRV 4-hour bearish signal
⚠️Technical analysis: The trend is very strong, but watch out for a pullback. MACD has formed a bearish crossover and bearish momentum is accelerating. Moving averages are diverging downward in a bearish alignment. KDJ has formed a bearish crossover, indicating a short-term bearish outlook. Volume is up 2.3x.
════════════════════
🟢 $BERA 4-hour bearish signal
⚠️Technical analysis: ADX indicates a very strong trend, but beware of an overheated pullback; MACD has formed a bearish crossover and bearish momentum is accelerating; moving averages are bearishly aligned and trending downward; KDJ has formed a bearish crossover, indicating a short-term bearish outlook; volume is up 2.2x.
════════════════════
🔔 Follow for first-hand market movement alerts 🔔
#技术分析 #BEAMX #CRV #BERA
📌 When trading, pay attention to whether the candlestick pattern matches.
28

·
--
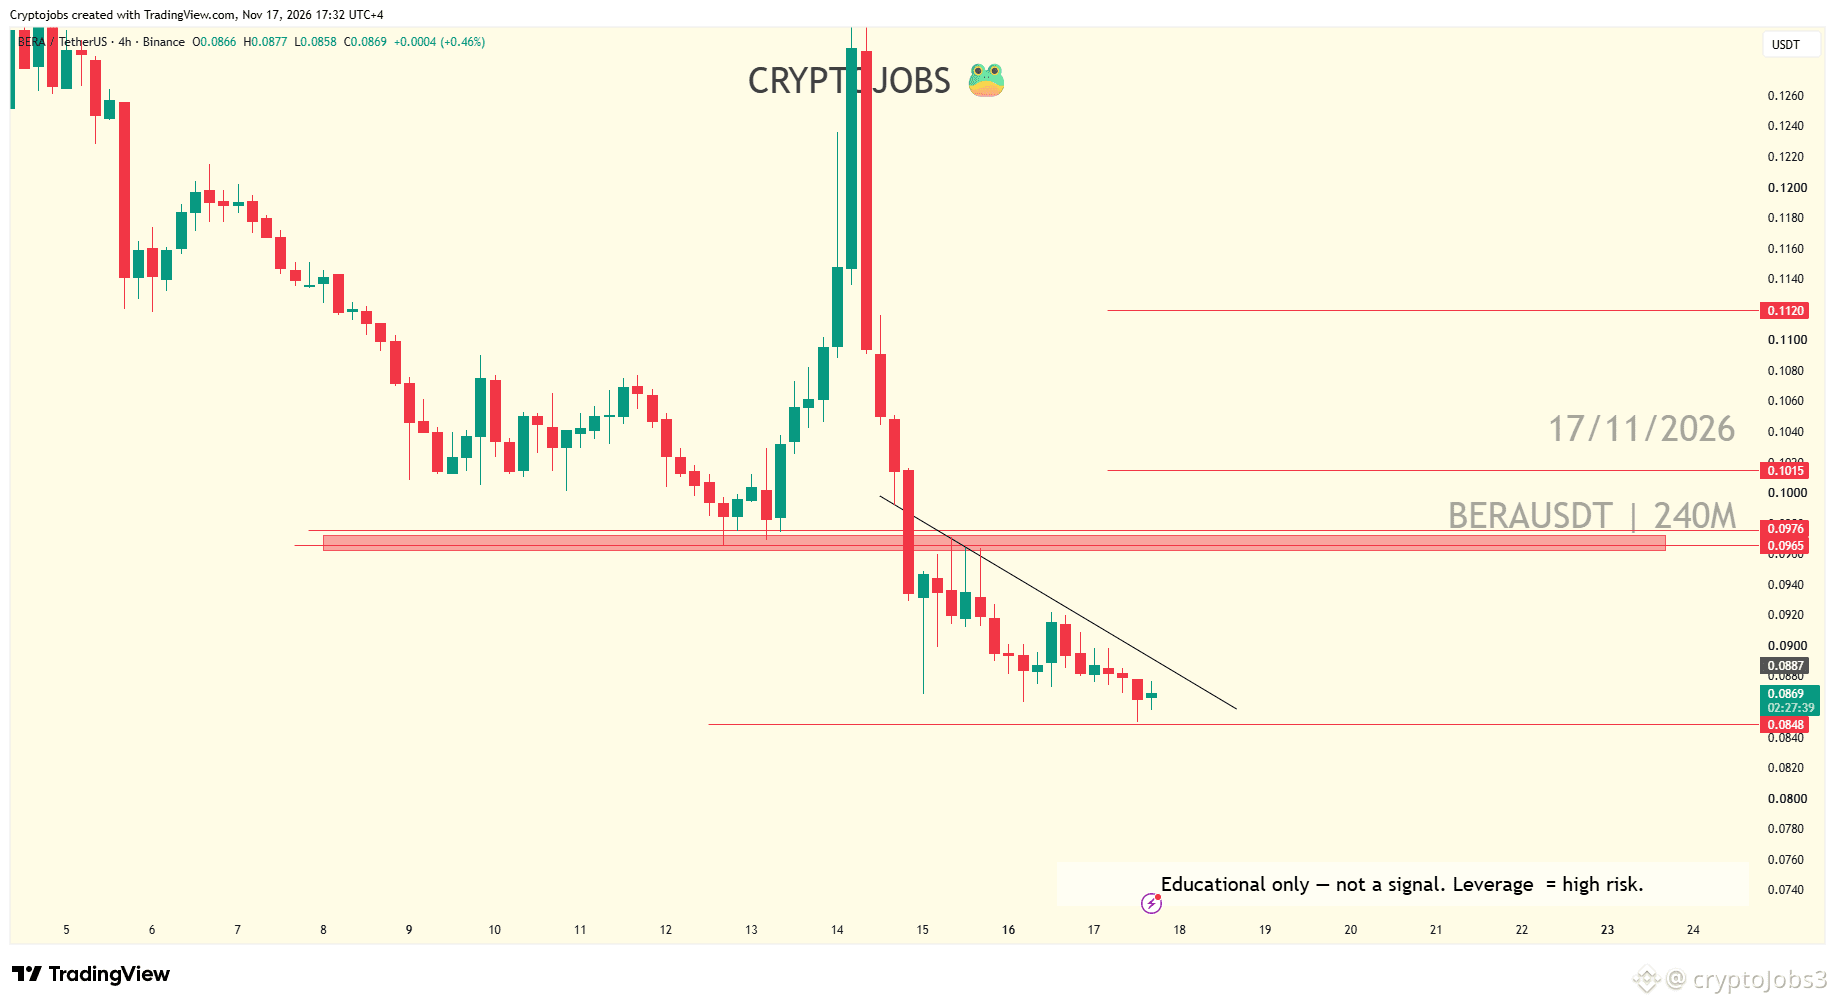
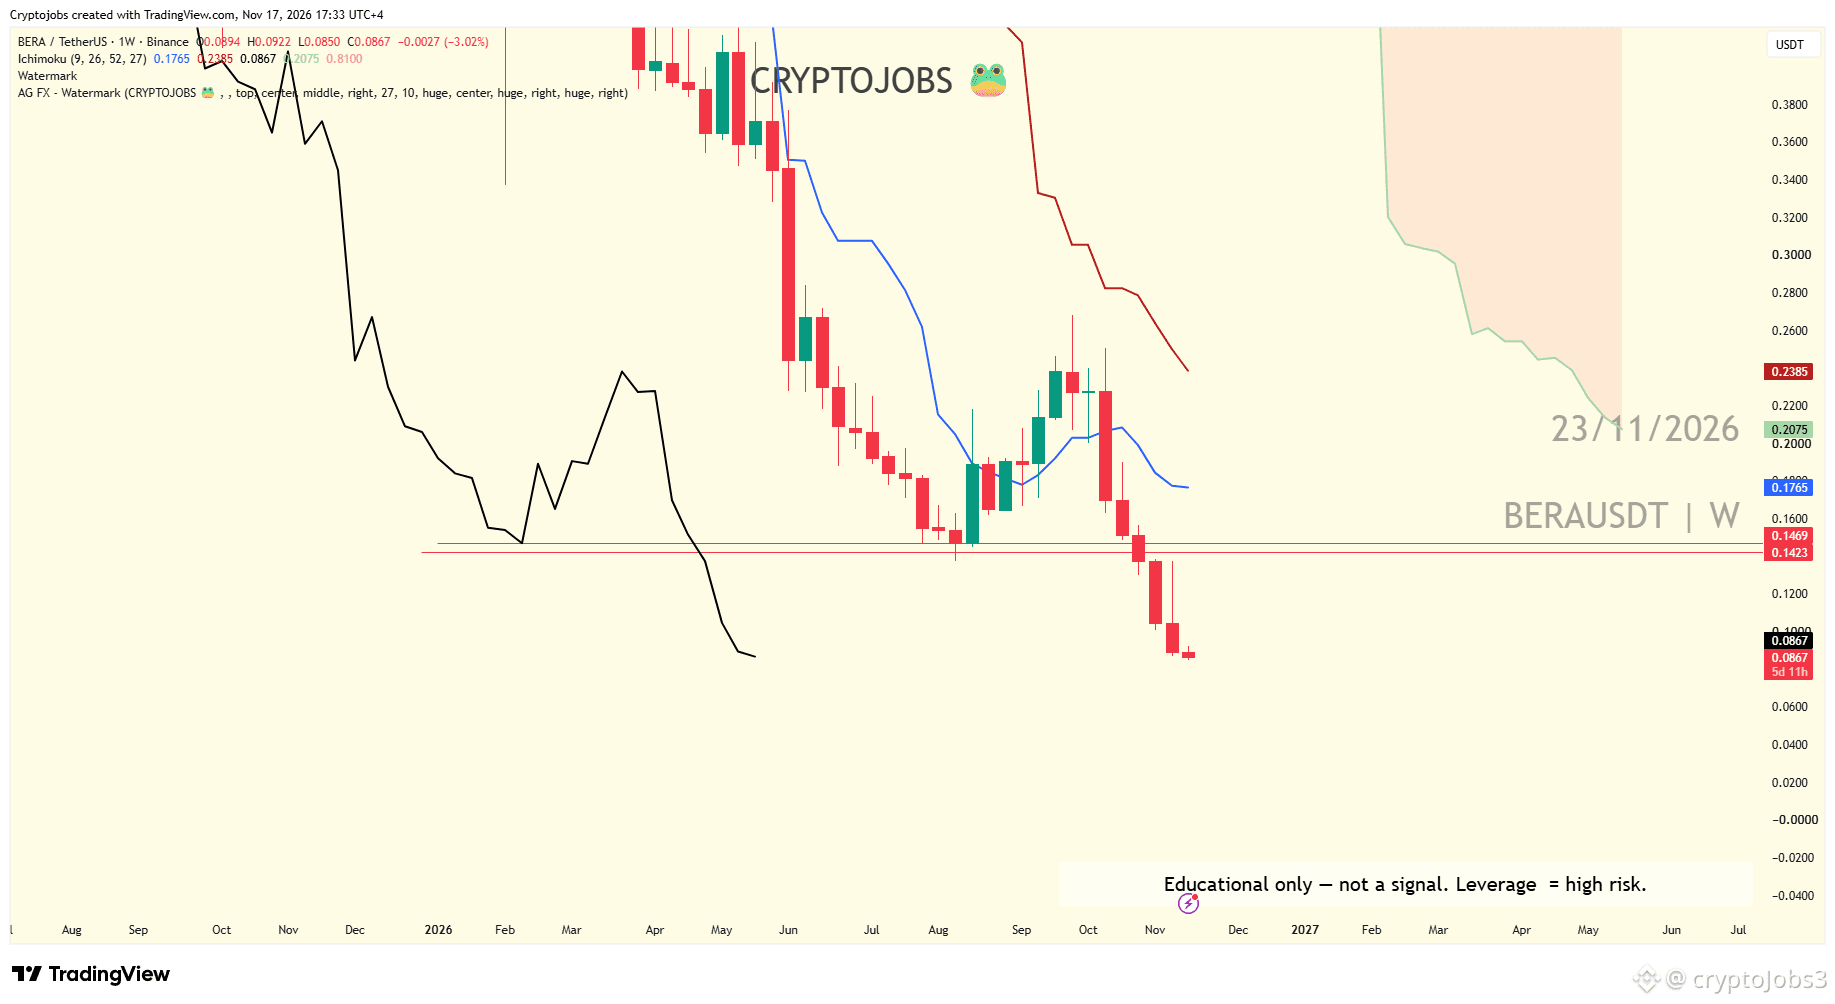
The market is still in extreme fear, while $BERA is battling near its all-time low
Current price around $0.0848, 24h about -2%, range: $0.0826–$0.0897
7 days: -17%, 30 days: -49%, 1 year: -93%
Just hit an all-time low of around $0.08 on November 17; now it's only about 5% above that level
From last March's peak of $8.65, it's fallen to a fraction of that price, with a market cap of around $30 million
My take: this isn't a buy-the-dip signal, but a test of new lows in a bear market—if it can't reclaim $0.09, the all-time low is the next stop. But at levels like these, even the bears may hesitate to push it much lower
Key levels / What signals to watch next:
Break above $0.0897 to confirm a short-term bottom; then watch the $0.10 mark
Break below $0.0826 and the all-time-low zone gives way; watch $0.08, then it's uncharted territory
A move back above $0.10 invalidates the outlook above
BTC is around $62,650, and the Fear Index is at 10. The whole market is still waiting for direction, and BERA is the kind of asset that could be among the first to make a move
Do you think it will break above $0.0897 or fall below $0.0826 to make a new low?
Analysis only; I don't hold a position.
#BERA #BTC #MarketAnalysis
This is personal analysis only and does not constitute investment advice.
The market is still in extreme fear, while $BERA is battling near its all-time low
Current price around $0.0848, 24h about -2%, range: $0.0826–$0.0897
7 days: -17%, 30 days: -49%, 1 year: -93%
Just hit an all-time low of around $0.08 on November 17; now it's only about 5% above that level
From last March's peak of $8.65, it's fallen to a fraction of that price, with a market cap of around $30 million
My take: this isn't a buy-the-dip signal, but a test of new lows in a bear market—if it can't reclaim $0.09, the all-time low is the next stop. But at levels like these, even the bears may hesitate to push it much lower
Key levels / What signals to watch next:
Break above $0.0897 to confirm a short-term bottom; then watch the $0.10 mark
Break below $0.0826 and the all-time-low zone gives way; watch $0.08, then it's uncharted territory
A move back above $0.10 invalidates the outlook above
BTC is around $62,650, and the Fear Index is at 10. The whole market is still waiting for direction, and BERA is the kind of asset that could be among the first to make a move
Do you think it will break above $0.0897 or fall below $0.0826 to make a new low?
Analysis only; I don't hold a position.
#BERA #BTC #MarketAnalysis
This is personal analysis only and does not constitute investment advice.
Current price around $0.0848, 24h about -2%, range: $0.0826–$0.0897
7 days: -17%, 30 days: -49%, 1 year: -93%
Just hit an all-time low of around $0.08 on November 17; now it's only about 5% above that level
From last March's peak of $8.65, it's fallen to a fraction of that price, with a market cap of around $30 million
My take: this isn't a buy-the-dip signal, but a test of new lows in a bear market—if it can't reclaim $0.09, the all-time low is the next stop. But at levels like these, even the bears may hesitate to push it much lower
Key levels / What signals to watch next:
Break above $0.0897 to confirm a short-term bottom; then watch the $0.10 mark
Break below $0.0826 and the all-time-low zone gives way; watch $0.08, then it's uncharted territory
A move back above $0.10 invalidates the outlook above
BTC is around $62,650, and the Fear Index is at 10. The whole market is still waiting for direction, and BERA is the kind of asset that could be among the first to make a move
Do you think it will break above $0.0897 or fall below $0.0826 to make a new low?
Analysis only; I don't hold a position.
#BERA #BTC #MarketAnalysis
This is personal analysis only and does not constitute investment advice.
12

·
--
For this market move, $BERA , it’s a good opportunity to talk about “including fees in the full picture.”
Beyond the bid-ask spread, fees are also part of the actual trading outcome. Rates and fee structures may vary by product, trading role, account status, and promotional rules, so you shouldn’t keep relying on an old screenshot. When calculating the outcome of a trade, looking only at price movements leaves out fees. Frequent trading can also lead to fees accumulating across multiple trades, so be sure to check each one when reviewing your results.
The actual data for comparison: Binance Spot, 11/19 09:30–10:30 (Beijing time). Over this hour, the price rose 1.19%, with a trading volume of 21,300 USDT, 1.29 times that of the previous hour. The closing price for the period was 0.0848 USDT.
When reviewing a trade, list the actual fees for each transaction, then compare the results before and after fees. Don’t just apply a fee rate you remember.
#BERA #CryptoChatter
For this market move, $BERA , it’s a good opportunity to talk about “including fees in the full picture.”
Beyond the bid-ask spread, fees are also part of the actual trading outcome. Rates and fee structures may vary by product, trading role, account status, and promotional rules, so you shouldn’t keep relying on an old screenshot. When calculating the outcome of a trade, looking only at price movements leaves out fees. Frequent trading can also lead to fees accumulating across multiple trades, so be sure to check each one when reviewing your results.
The actual data for comparison: Binance Spot, 11/19 09:30–10:30 (Beijing time). Over this hour, the price rose 1.19%, with a trading volume of 21,300 USDT, 1.29 times that of the previous hour. The closing price for the period was 0.0848 USDT.
When reviewing a trade, list the actual fees for each transaction, then compare the results before and after fees. Don’t just apply a fee rate you remember.
#BERA #CryptoChatter
Beyond the bid-ask spread, fees are also part of the actual trading outcome. Rates and fee structures may vary by product, trading role, account status, and promotional rules, so you shouldn’t keep relying on an old screenshot. When calculating the outcome of a trade, looking only at price movements leaves out fees. Frequent trading can also lead to fees accumulating across multiple trades, so be sure to check each one when reviewing your results.
The actual data for comparison: Binance Spot, 11/19 09:30–10:30 (Beijing time). Over this hour, the price rose 1.19%, with a trading volume of 21,300 USDT, 1.29 times that of the previous hour. The closing price for the period was 0.0848 USDT.
When reviewing a trade, list the actual fees for each transaction, then compare the results before and after fees. Don’t just apply a fee rate you remember.
#BERA #CryptoChatter
64


·
--
Bearish

FBI:
Should I open a long position now, or should I wait for a new low before going long? Ad :((
2
2
1.1k

·
--
Bearish
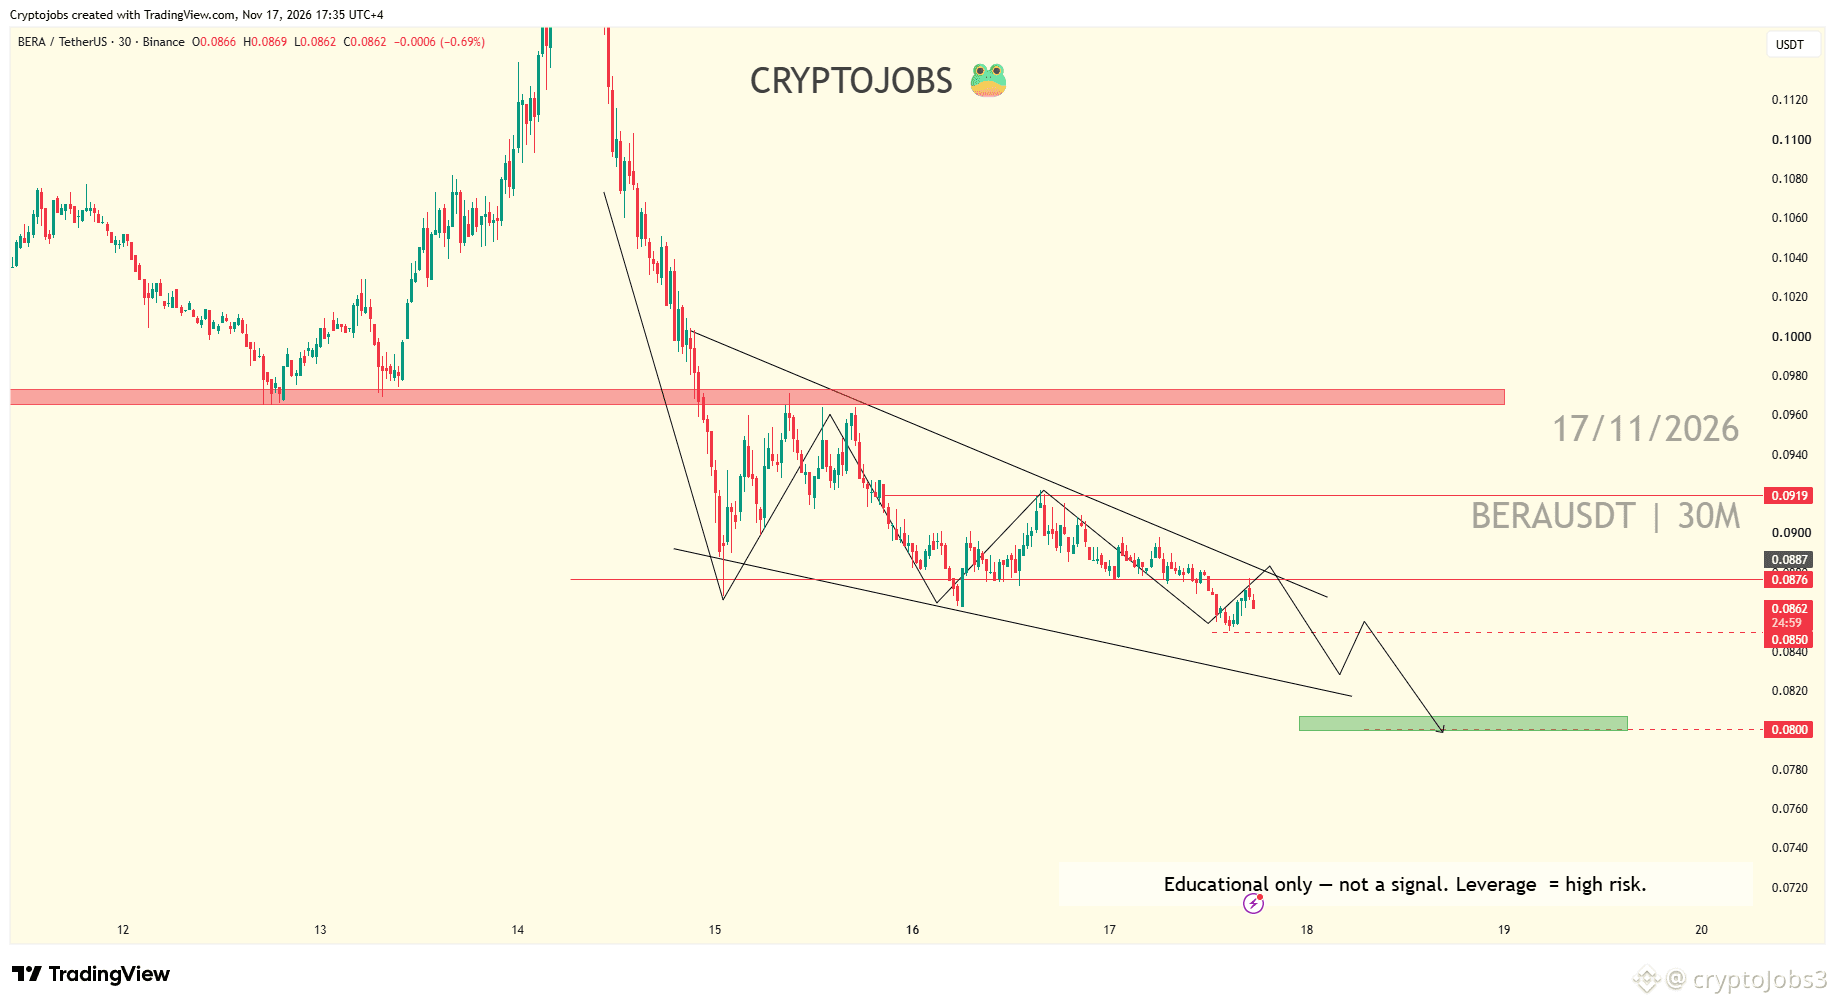
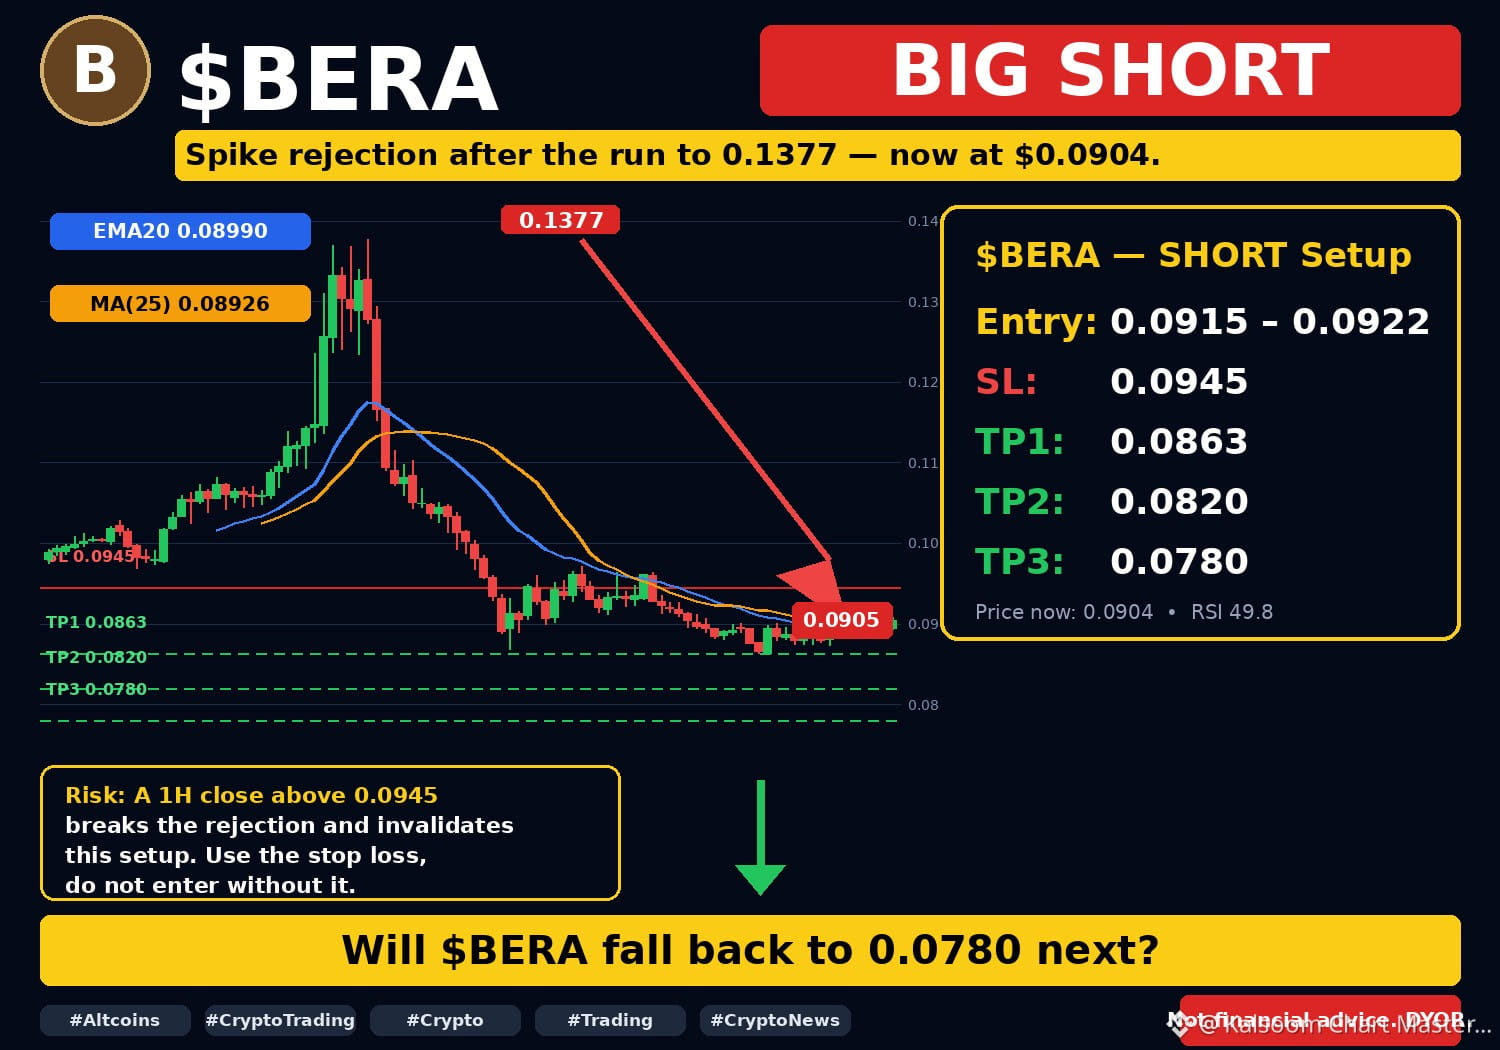
🔴 $BERA — BIG SHORT
Berachain spiked to $0.1377 — and got rejected hard. Since then it has fallen all the way to $0.0904, and it is now sitting below EMA50. The spike is over; the downtrend is the story now.
Roadmap:
$0.0918 bounce → $0.0904 → $0.0863 → $0.0820 → $0.0780
🔴 SHORT — $BERA (on bounce)
Entry: $0.0915 – $0.0922
SL: $0.0945
TP1: $0.0863 | TP2: $0.0820 | TP3: $0.0780
⚠️ Wait for the bounce to $0.0915–$0.0922 — don't short into support. A 1H close above $0.0945 breaks this setup.
Will $BERA fall back to $0.0780 next? 🤔
#BERA #Berachain
NFA — This is not financial advice, DYOR.
🔴 $BERA — BIG SHORT
Berachain spiked to $0.1377 — and got rejected hard. Since then it has fallen all the way to $0.0904, and it is now sitting below EMA50. The spike is over; the downtrend is the story now.
Roadmap:
$0.0918 bounce → $0.0904 → $0.0863 → $0.0820 → $0.0780
🔴 SHORT — $BERA (on bounce)
Entry: $0.0915 – $0.0922
SL: $0.0945
TP1: $0.0863 | TP2: $0.0820 | TP3: $0.0780
⚠️ Wait for the bounce to $0.0915–$0.0922 — don't short into support. A 1H close above $0.0945 breaks this setup.
Will $BERA fall back to $0.0780 next? 🤔
#BERA #Berachain
NFA — This is not financial advice, DYOR.
Berachain spiked to $0.1377 — and got rejected hard. Since then it has fallen all the way to $0.0904, and it is now sitting below EMA50. The spike is over; the downtrend is the story now.
Roadmap:
$0.0918 bounce → $0.0904 → $0.0863 → $0.0820 → $0.0780
🔴 SHORT — $BERA (on bounce)
Entry: $0.0915 – $0.0922
SL: $0.0945
TP1: $0.0863 | TP2: $0.0820 | TP3: $0.0780
⚠️ Wait for the bounce to $0.0915–$0.0922 — don't short into support. A 1H close above $0.0945 breaks this setup.
Will $BERA fall back to $0.0780 next? 🤔
#BERA #Berachain
NFA — This is not financial advice, DYOR.
1
46

·
--
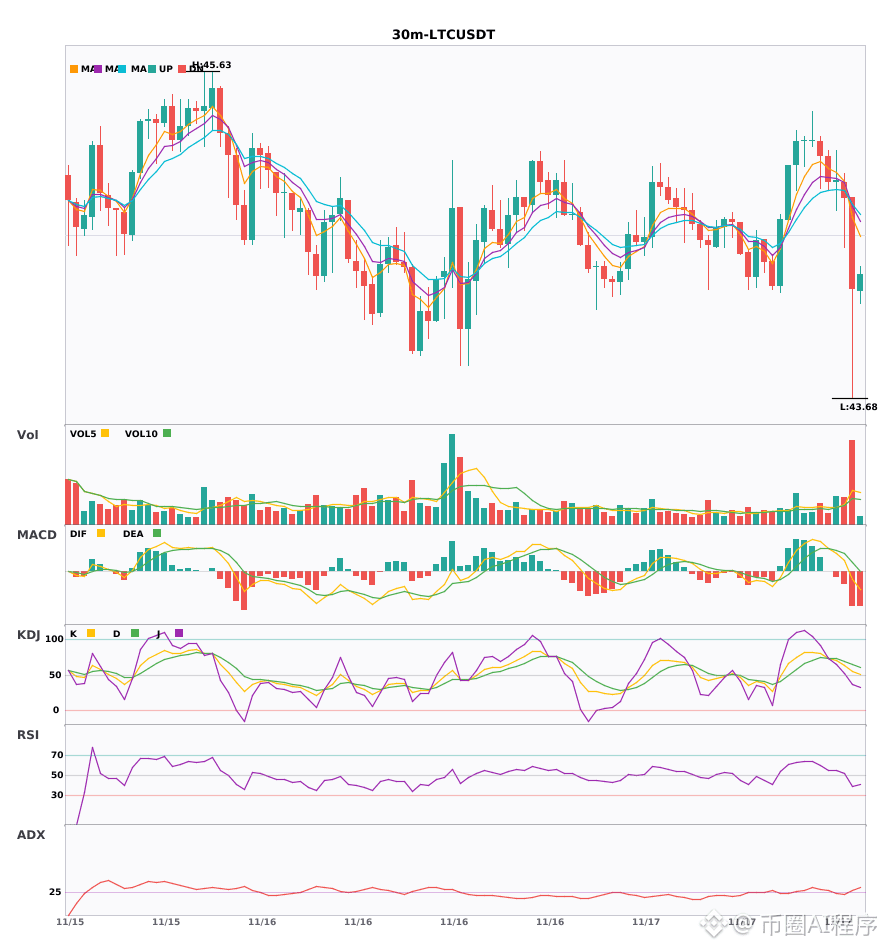
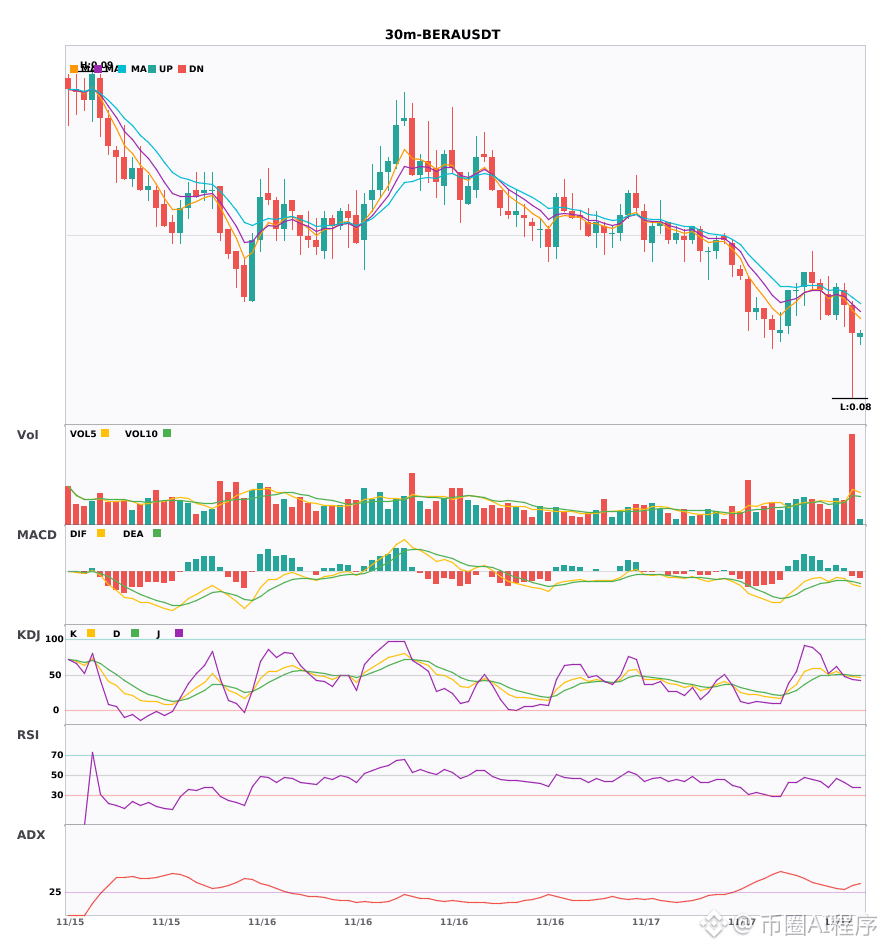
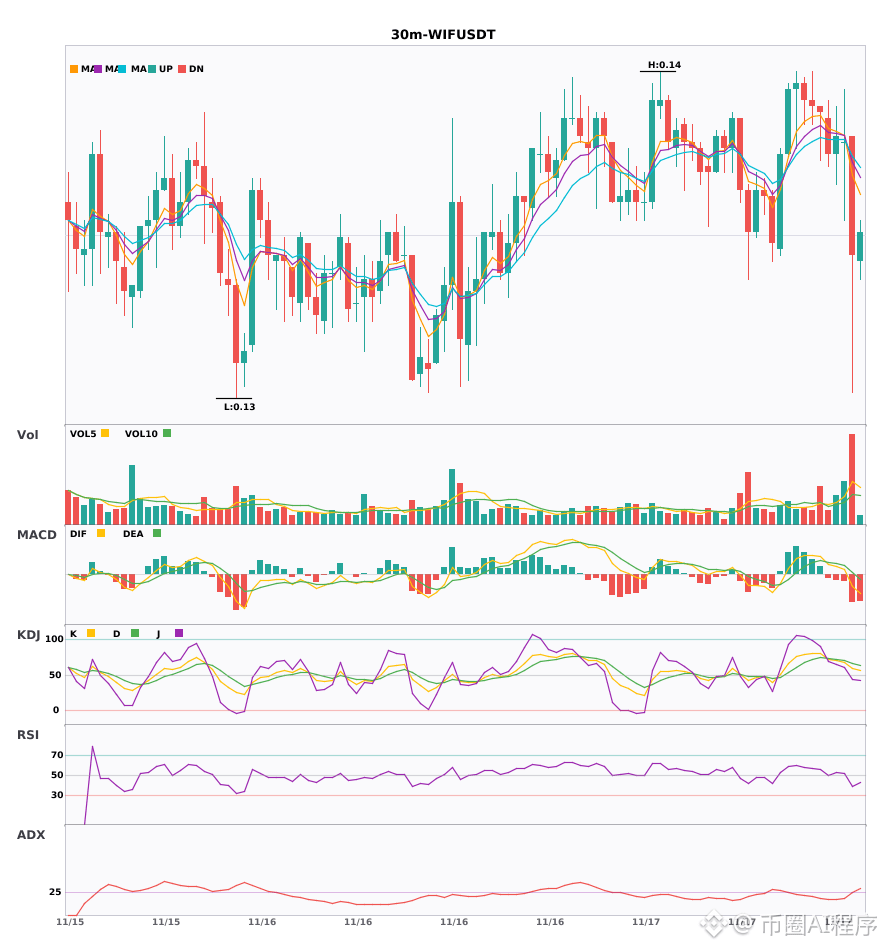
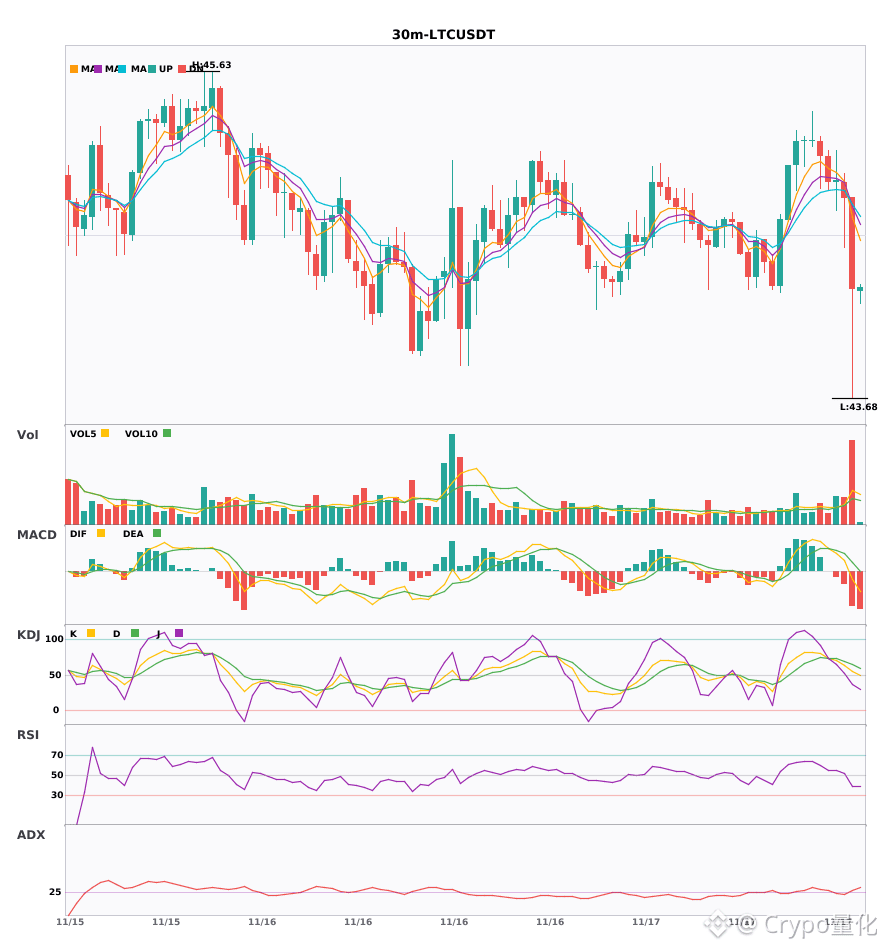
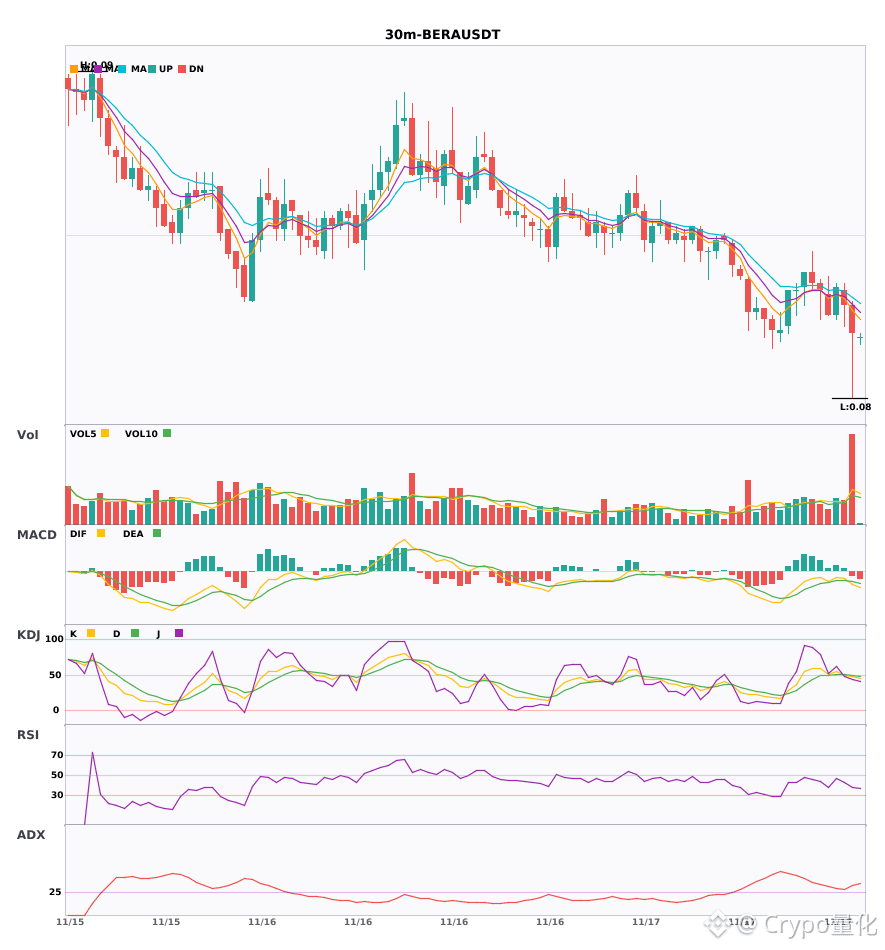
$LTC $BERA $WIF 30-minute bearish; 4-hour trend is bearish 🔥
════════════════════
🟢 $LTC 30-minute bearish signal
⚠️Technical analysis: 4-hour bearish confluence confirmed. 30-minute entry: MACD death cross below the zero line, bearish moving-average alignment, KDJ K crosses above D without being overbought, and volume rises 3.2x
════════════════════
🟢 $BERA 30-minute bearish signal
⚠️Technical analysis: 4-hour and 30-minute bearish confluence! Volume accelerates after the MACD death cross; moving averages are bearishly aligned and diverging downward; KDJ favors the bears.
════════════════════
🟢 $WIF 30-minute bearish signal
⚠️Technical analysis: 4-hour bearish confluence confirmed! 30-minute entry: MACD death cross breaks below the zero line, turning the trend bearish; EMA5 crosses below EMA8, signaling bearishness; KDJ K crosses below D, indicating weakness; volume rises 3x
════════════════════
🔔 Follow for first-hand market movement alerts 🔔
#多周期共振 #LTC #BERA #WIF
📌 When trading, check whether the candlestick pattern confirms the setup
$LTC $BERA $WIF 30-minute bearish; 4-hour trend is bearish 🔥
════════════════════
🟢 $LTC 30-minute bearish signal
⚠️Technical analysis: 4-hour bearish confluence confirmed. 30-minute entry: MACD death cross below the zero line, bearish moving-average alignment, KDJ K crosses above D without being overbought, and volume rises 3.2x
════════════════════
🟢 $BERA 30-minute bearish signal
⚠️Technical analysis: 4-hour and 30-minute bearish confluence! Volume accelerates after the MACD death cross; moving averages are bearishly aligned and diverging downward; KDJ favors the bears.
════════════════════
🟢 $WIF 30-minute bearish signal
⚠️Technical analysis: 4-hour bearish confluence confirmed! 30-minute entry: MACD death cross breaks below the zero line, turning the trend bearish; EMA5 crosses below EMA8, signaling bearishness; KDJ K crosses below D, indicating weakness; volume rises 3x
════════════════════
🔔 Follow for first-hand market movement alerts 🔔
#多周期共振 #LTC #BERA #WIF
📌 When trading, check whether the candlestick pattern confirms the setup
════════════════════
🟢 $LTC 30-minute bearish signal
⚠️Technical analysis: 4-hour bearish confluence confirmed. 30-minute entry: MACD death cross below the zero line, bearish moving-average alignment, KDJ K crosses above D without being overbought, and volume rises 3.2x
════════════════════
🟢 $BERA 30-minute bearish signal
⚠️Technical analysis: 4-hour and 30-minute bearish confluence! Volume accelerates after the MACD death cross; moving averages are bearishly aligned and diverging downward; KDJ favors the bears.
════════════════════
🟢 $WIF 30-minute bearish signal
⚠️Technical analysis: 4-hour bearish confluence confirmed! 30-minute entry: MACD death cross breaks below the zero line, turning the trend bearish; EMA5 crosses below EMA8, signaling bearishness; KDJ K crosses below D, indicating weakness; volume rises 3x
════════════════════
🔔 Follow for first-hand market movement alerts 🔔
#多周期共振 #LTC #BERA #WIF
📌 When trading, check whether the candlestick pattern confirms the setup
29
·
--
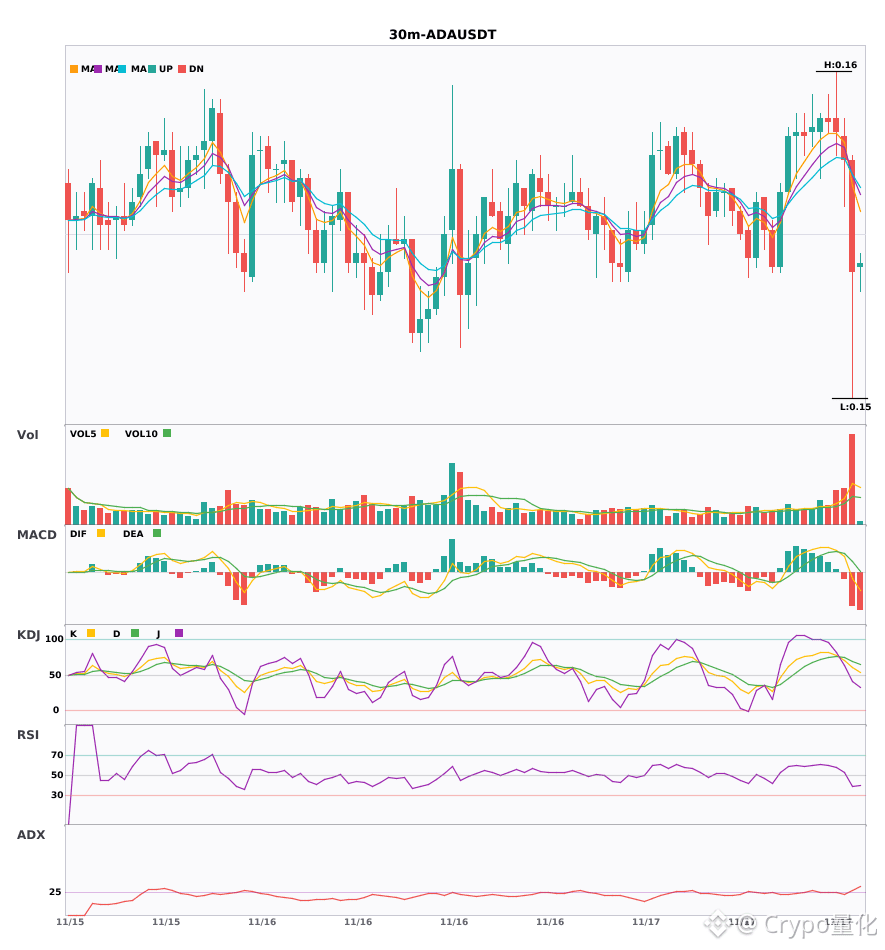
$LTC $BERA $ADA 30-minute bearish signal detected—watch out for a decline 🔥
════════════════════
🟢 $LTC 30-minute bearish signal
⚠️Technical analysis: ADX30 indicates a formed trend that you can trade; MACD has crossed below the zero line and turned bearish; EMA5 has crossed below EMA8, turning bearish; KDJ favors the bulls; volume has surged 3.2x.
════════════════════
🟢 $BERA 30-minute bearish signal
⚠️Technical analysis: ADX is rising, showing a clear trend; MACD’s bearish crossover below zero is accelerating the downtrend; moving averages are bearishly aligned and diverging downward; KDJ is weak, with K crossing below D; trading volume has surged 3.1x.
════════════════════
🟢 $ADA 30-minute bearish signal
⚠️Technical analysis: ADX31 indicates a clear trend; MACD has made a bearish crossover below the zero line; short-term moving averages have made a bearish crossover; KDJ favors the strong bulls; volume has surged 3.1x.
════════════════════
🔔 Follow us for the latest market movements 🔔
#技术分析 #LTC #BERA #ADA
📌 When trading, pay attention to whether the candlestick pattern confirms the signal.
$LTC $BERA $ADA 30-minute bearish signal detected—watch out for a decline 🔥
════════════════════
🟢 $LTC 30-minute bearish signal
⚠️Technical analysis: ADX30 indicates a formed trend that you can trade; MACD has crossed below the zero line and turned bearish; EMA5 has crossed below EMA8, turning bearish; KDJ favors the bulls; volume has surged 3.2x.
════════════════════
🟢 $BERA 30-minute bearish signal
⚠️Technical analysis: ADX is rising, showing a clear trend; MACD’s bearish crossover below zero is accelerating the downtrend; moving averages are bearishly aligned and diverging downward; KDJ is weak, with K crossing below D; trading volume has surged 3.1x.
════════════════════
🟢 $ADA 30-minute bearish signal
⚠️Technical analysis: ADX31 indicates a clear trend; MACD has made a bearish crossover below the zero line; short-term moving averages have made a bearish crossover; KDJ favors the strong bulls; volume has surged 3.1x.
════════════════════
🔔 Follow us for the latest market movements 🔔
#技术分析 #LTC #BERA #ADA
📌 When trading, pay attention to whether the candlestick pattern confirms the signal.
════════════════════
🟢 $LTC 30-minute bearish signal
⚠️Technical analysis: ADX30 indicates a formed trend that you can trade; MACD has crossed below the zero line and turned bearish; EMA5 has crossed below EMA8, turning bearish; KDJ favors the bulls; volume has surged 3.2x.
════════════════════
🟢 $BERA 30-minute bearish signal
⚠️Technical analysis: ADX is rising, showing a clear trend; MACD’s bearish crossover below zero is accelerating the downtrend; moving averages are bearishly aligned and diverging downward; KDJ is weak, with K crossing below D; trading volume has surged 3.1x.
════════════════════
🟢 $ADA 30-minute bearish signal
⚠️Technical analysis: ADX31 indicates a clear trend; MACD has made a bearish crossover below the zero line; short-term moving averages have made a bearish crossover; KDJ favors the strong bulls; volume has surged 3.1x.
════════════════════
🔔 Follow us for the latest market movements 🔔
#技术分析 #LTC #BERA #ADA
📌 When trading, pay attention to whether the candlestick pattern confirms the signal.
29

·
--
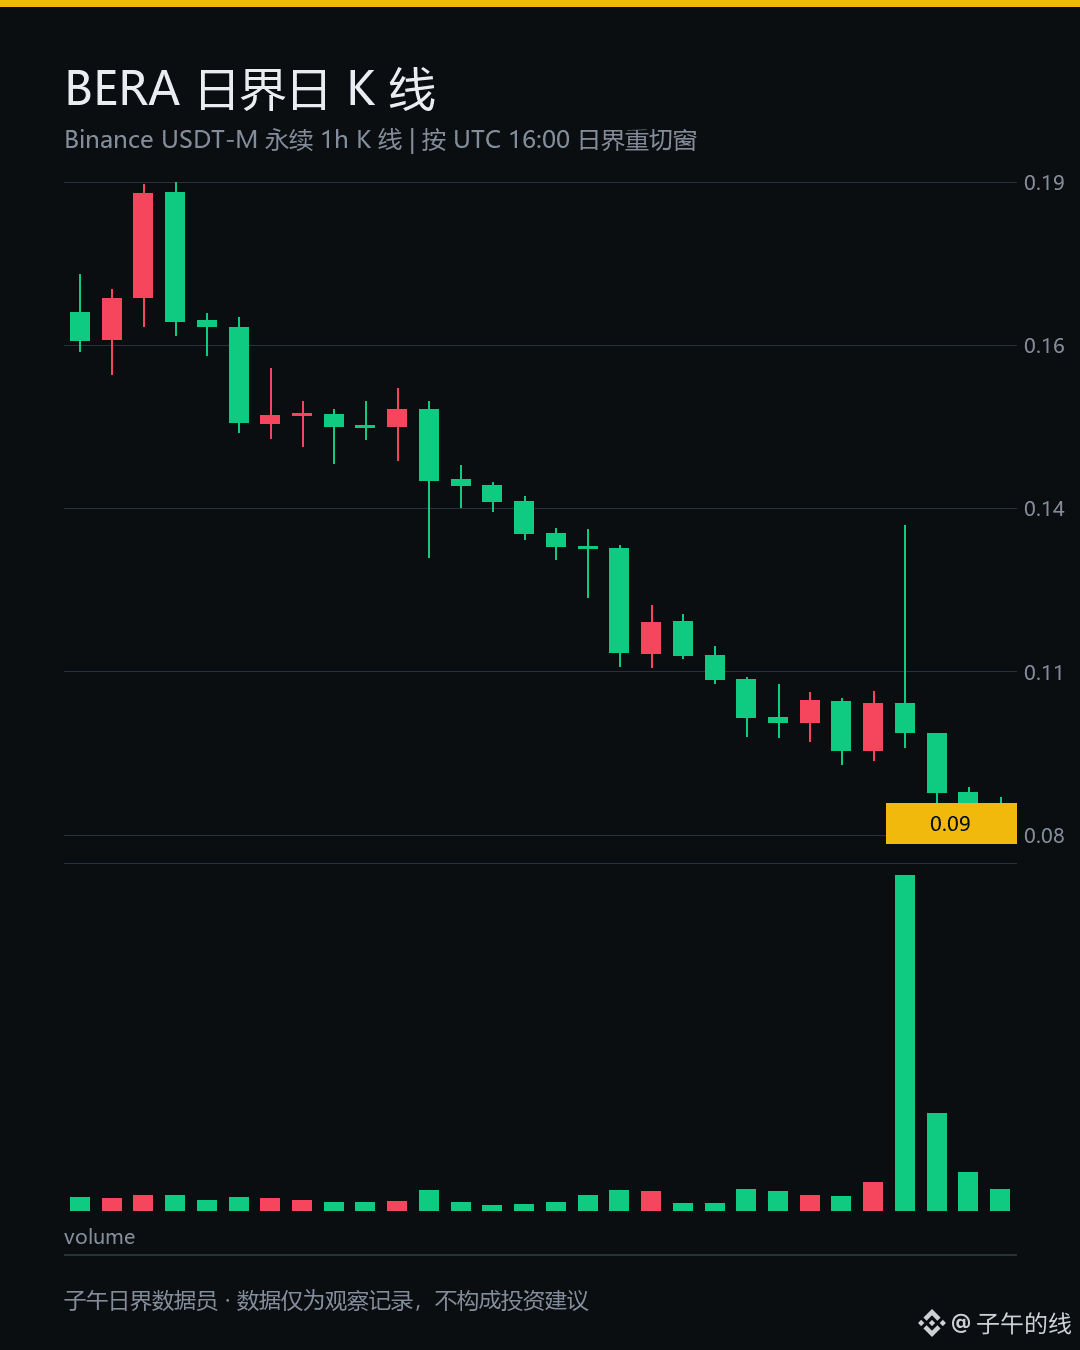
I was poring over the positions table until the middle of the night. Honestly, I’m not confident about this $BERA line.
The price is 0.1264, up 26.274% in a day. It’s not particularly high at the 47.48th percentile of the 20-day range, but a single candle swallowed the previous six red candles.
I’m not chasing it.
I’m watching those two columns for positions: the number of contracts is up 75.35%, but the notional value has risen 126.47%. That gap comes from existing positions becoming more expensive as the price rose, not new money coming in to buy.
The funding rate stands out even more. Negative 1.20% means shorts are paying longs by the hour—something you don’t see often in perpetuals.
The positions are piled up on one side, and the disagreement just isn’t coming.
It’s like water on the stove just about to boil: the flame is strong, but the ingredients are still on the chopping board.
At the time, the broader market was down 3.746% for $BTC and 4.176% for $ETH , yet this one managed to move against the trend. It was relying on its own liquidity, and the market was small to begin with.
When something moves against the trend from a position like this, I usually just keep watching and don’t rush to act.
What do you think, everyone? How many more candles can a rally built on negative funding rates last?
#BERA #比特币 #Crypto
The above is a record of my personal trading system and observations of data, and does not constitute investment advice.
I was poring over the positions table until the middle of the night. Honestly, I’m not confident about this $BERA line.
The price is 0.1264, up 26.274% in a day. It’s not particularly high at the 47.48th percentile of the 20-day range, but a single candle swallowed the previous six red candles.
I’m not chasing it.
I’m watching those two columns for positions: the number of contracts is up 75.35%, but the notional value has risen 126.47%. That gap comes from existing positions becoming more expensive as the price rose, not new money coming in to buy.
The funding rate stands out even more. Negative 1.20% means shorts are paying longs by the hour—something you don’t see often in perpetuals.
The positions are piled up on one side, and the disagreement just isn’t coming.
It’s like water on the stove just about to boil: the flame is strong, but the ingredients are still on the chopping board.
At the time, the broader market was down 3.746% for $BTC and 4.176% for $ETH , yet this one managed to move against the trend. It was relying on its own liquidity, and the market was small to begin with.
When something moves against the trend from a position like this, I usually just keep watching and don’t rush to act.
What do you think, everyone? How many more candles can a rally built on negative funding rates last?
#BERA #比特币 #Crypto
The above is a record of my personal trading system and observations of data, and does not constitute investment advice.
The price is 0.1264, up 26.274% in a day. It’s not particularly high at the 47.48th percentile of the 20-day range, but a single candle swallowed the previous six red candles.
I’m not chasing it.
I’m watching those two columns for positions: the number of contracts is up 75.35%, but the notional value has risen 126.47%. That gap comes from existing positions becoming more expensive as the price rose, not new money coming in to buy.
The funding rate stands out even more. Negative 1.20% means shorts are paying longs by the hour—something you don’t see often in perpetuals.
The positions are piled up on one side, and the disagreement just isn’t coming.
It’s like water on the stove just about to boil: the flame is strong, but the ingredients are still on the chopping board.
At the time, the broader market was down 3.746% for $BTC and 4.176% for $ETH , yet this one managed to move against the trend. It was relying on its own liquidity, and the market was small to begin with.
When something moves against the trend from a position like this, I usually just keep watching and don’t rush to act.
What do you think, everyone? How many more candles can a rally built on negative funding rates last?
#BERA #比特币 #Crypto
The above is a record of my personal trading system and observations of data, and does not constitute investment advice.
1
295

Big money making moves?
$BERA 24-hour low: 0.0862, current price 0.0862, previous low 0.0867, 24h -2.82%.
There’s still no clear support at these lows, and large orders are still being pulled. Don’t rush to buy the dip.
Which way do you think it’ll go? Let us know in the comments.
#BERA
Big money making moves?
$BERA 24-hour low: 0.0862, current price 0.0862, previous low 0.0867, 24h -2.82%.
There’s still no clear support at these lows, and large orders are still being pulled. Don’t rush to buy the dip.
Which way do you think it’ll go? Let us know in the comments.
#BERA
$BERA 24-hour low: 0.0862, current price 0.0862, previous low 0.0867, 24h -2.82%.
There’s still no clear support at these lows, and large orders are still being pulled. Don’t rush to buy the dip.
Which way do you think it’ll go? Let us know in the comments.
#BERA
6

·
--
🔴 $BERA SHORT · 1h
✅ Proven · Scallop, Descending
Entry 0.0866
Target 0.0765 (−11.7%)
Stop 0.1064 (+22.9%)
Reward:risk 0.5
📊 All coins, 1h: 64% won of 206 · avg +3.1%
🪙 On BERA: 2 of 3 won
Automated chart-pattern signal. Not financial advice.
#BERA #CryptoSignals
🔴 $BERA SHORT · 1h
✅ Proven · Scallop, Descending
Entry 0.0866
Target 0.0765 (−11.7%)
Stop 0.1064 (+22.9%)
Reward:risk 0.5
📊 All coins, 1h: 64% won of 206 · avg +3.1%
🪙 On BERA: 2 of 3 won
Automated chart-pattern signal. Not financial advice.
#BERA #CryptoSignals
✅ Proven · Scallop, Descending
Entry 0.0866
Target 0.0765 (−11.7%)
Stop 0.1064 (+22.9%)
Reward:risk 0.5
📊 All coins, 1h: 64% won of 206 · avg +3.1%
🪙 On BERA: 2 of 3 won
Automated chart-pattern signal. Not financial advice.
#BERA #CryptoSignals
44

·
--
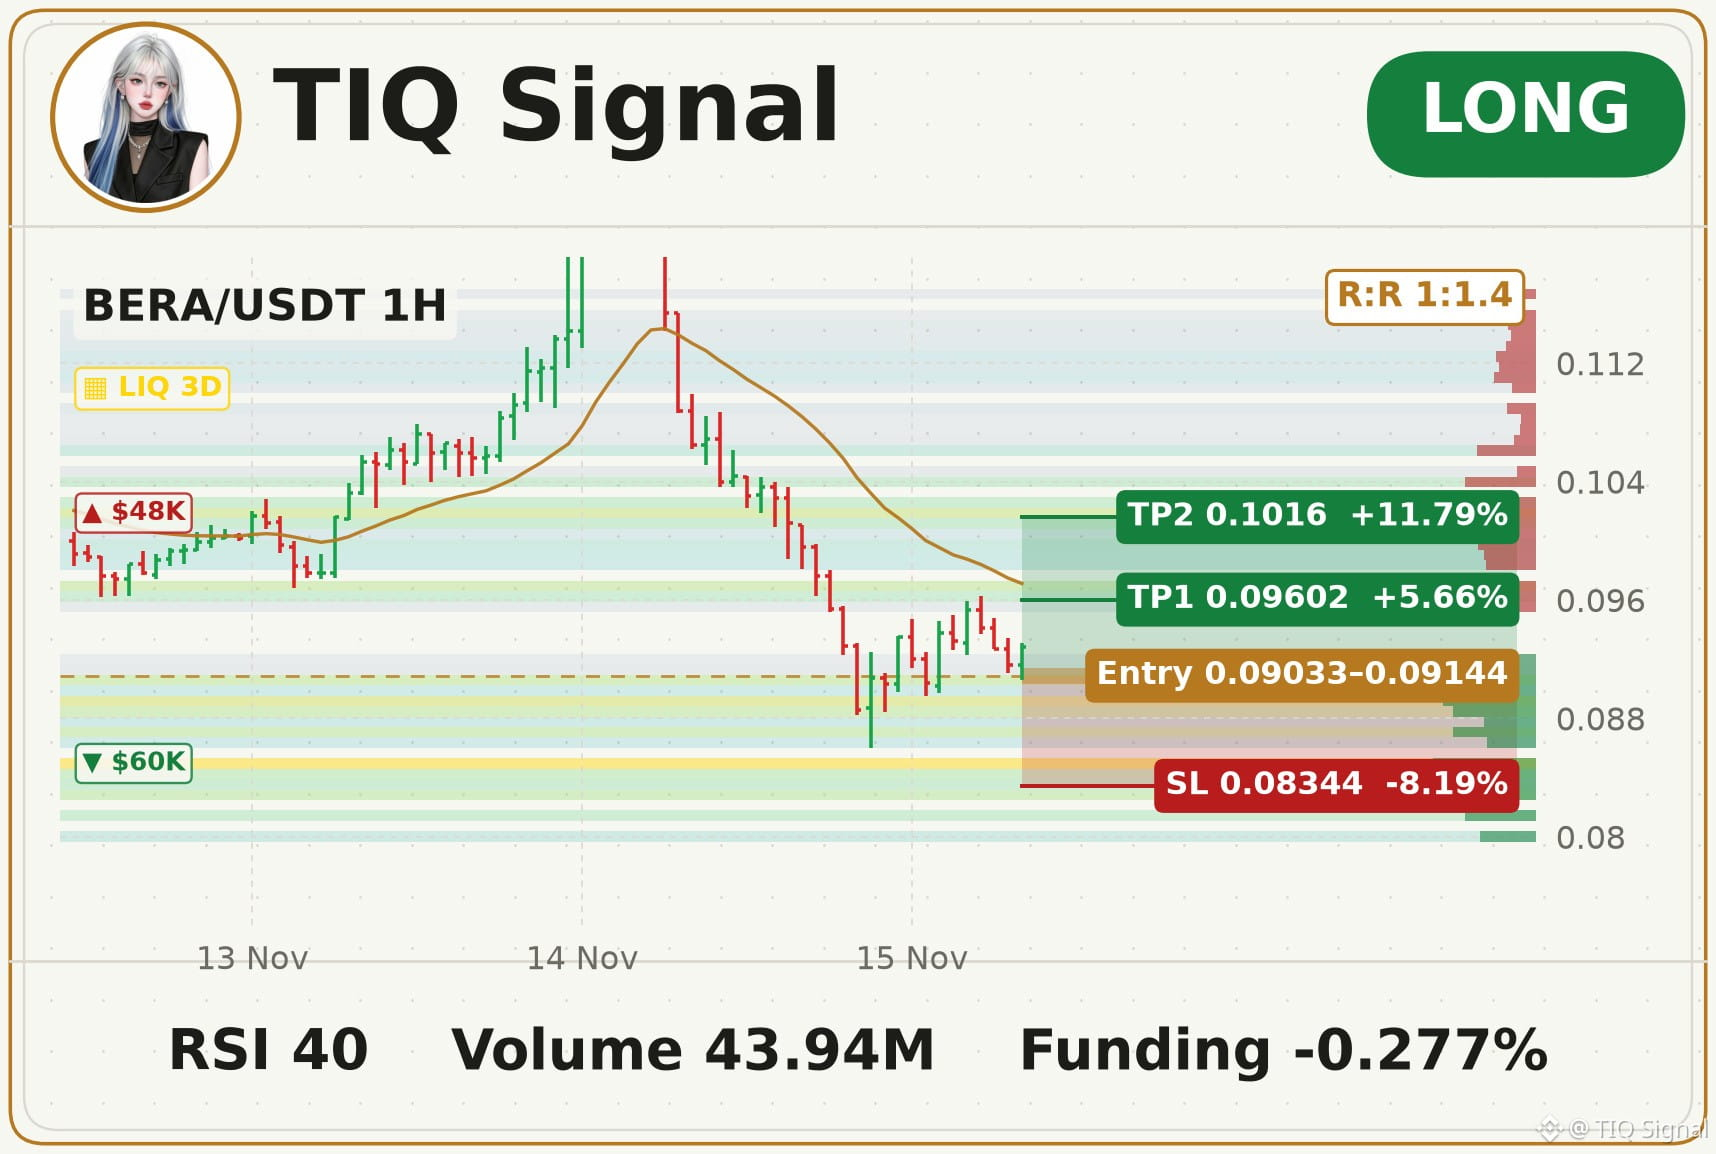
"Be greedy when others are fearful", $BERA edition 😏
1H: momentum leaning bullish. Note: price is below EMA200, so this is a counter-trend trade.
Entry: 0.09033 - 0.09144
TP: 0.09602 - 0.1016 - 0.1058
SL: 0.08344 (risk ~8.2%)
Scared? Size smaller. Nobody's judging.
#BERA
⚠️ This signal is based on technical indicators and is not investment advice. Always set a stop-loss and manage your own risk.
"Be greedy when others are fearful", $BERA edition 😏
1H: momentum leaning bullish. Note: price is below EMA200, so this is a counter-trend trade.
Entry: 0.09033 - 0.09144
TP: 0.09602 - 0.1016 - 0.1058
SL: 0.08344 (risk ~8.2%)
Scared? Size smaller. Nobody's judging.
#BERA
⚠️ This signal is based on technical indicators and is not investment advice. Always set a stop-loss and manage your own risk.
1H: momentum leaning bullish. Note: price is below EMA200, so this is a counter-trend trade.
Entry: 0.09033 - 0.09144
TP: 0.09602 - 0.1016 - 0.1058
SL: 0.08344 (risk ~8.2%)
Scared? Size smaller. Nobody's judging.
#BERA
⚠️ This signal is based on technical indicators and is not investment advice. Always set a stop-loss and manage your own risk.
32

🔥✅ TP3 TARGET HIT & RUNNING: $BERA +92.0% ROI (25x)! 💸✅
Our earlier $BERA (SHORT 25x) institutional VIP setup is printing clean profits alongside $BTC!
📈 Live Trade Proof ($BERAUSDT Perpetual):
• Direction: SHORT (Cross 25x)
• Institutional Entry Price: 0.09510 ➔ Current Price: 0.09160
• Profit Achieved: +92.0% ROI 🔥
• TP1 (0.09283): ✅ HIT
• TP2 (0.09055): ✅ HIT
• TP3 (0.08827): ✅ HIT
• Final Target TP4 (0.08600): ⏳ Next Up!
• 📌 Entry Call Shared Earlier on Our Square Feed (11-15 01:08 PM)
🛡️ Trade Management: TP1, TP2 & TP3 smashed! Stop Loss trailed deep in green profit — hunting final TP4 (0.08600) next!
🦅 BLACK PHOENIX INSTITUTIONAL DESK:
We track 1H Smart Money orderblocks, Fair Value Gaps (FVG) & real-time orderflow across $BTC and top movers.
🔔 Tap 'Follow' on our profile so you never miss our next live setup and target update!
Did you catch this $BERA move with us? Drop a '🔥' below and follow our feed for the next setup! 👇
#BinanceSquare #Write2Earn #BERA #BlackPhoenixSignals #CryptoSignals
🔥✅ TP3 TARGET HIT & RUNNING: $BERA +92.0% ROI (25x)! 💸✅
Our earlier $BERA (SHORT 25x) institutional VIP setup is printing clean profits alongside $BTC !
📈 Live Trade Proof ($BERAUSDT Perpetual):
• Direction: SHORT (Cross 25x)
• Institutional Entry Price: 0.09510 ➔ Current Price: 0.09160
• Profit Achieved: +92.0% ROI 🔥
• TP1 (0.09283): ✅ HIT
• TP2 (0.09055): ✅ HIT
• TP3 (0.08827): ✅ HIT
• Final Target TP4 (0.08600): ⏳ Next Up!
• 📌 Entry Call Shared Earlier on Our Square Feed (11-15 01:08 PM)
🛡️ Trade Management: TP1, TP2 & TP3 smashed! Stop Loss trailed deep in green profit — hunting final TP4 (0.08600) next!
🦅 BLACK PHOENIX INSTITUTIONAL DESK:
We track 1H Smart Money orderblocks, Fair Value Gaps (FVG) & real-time orderflow across $BTC and top movers.
🔔 Tap 'Follow' on our profile so you never miss our next live setup and target update!
Did you catch this $BERA move with us? Drop a '🔥' below and follow our feed for the next setup! 👇
#BinanceSquare #Write2Earn #BERA #BlackPhoenixSignals #CryptoSignals
Our earlier $BERA (SHORT 25x) institutional VIP setup is printing clean profits alongside $BTC !
📈 Live Trade Proof ($BERAUSDT Perpetual):
• Direction: SHORT (Cross 25x)
• Institutional Entry Price: 0.09510 ➔ Current Price: 0.09160
• Profit Achieved: +92.0% ROI 🔥
• TP1 (0.09283): ✅ HIT
• TP2 (0.09055): ✅ HIT
• TP3 (0.08827): ✅ HIT
• Final Target TP4 (0.08600): ⏳ Next Up!
• 📌 Entry Call Shared Earlier on Our Square Feed (11-15 01:08 PM)
🛡️ Trade Management: TP1, TP2 & TP3 smashed! Stop Loss trailed deep in green profit — hunting final TP4 (0.08600) next!
🦅 BLACK PHOENIX INSTITUTIONAL DESK:
We track 1H Smart Money orderblocks, Fair Value Gaps (FVG) & real-time orderflow across $BTC and top movers.
🔔 Tap 'Follow' on our profile so you never miss our next live setup and target update!
Did you catch this $BERA move with us? Drop a '🔥' below and follow our feed for the next setup! 👇
#BinanceSquare #Write2Earn #BERA #BlackPhoenixSignals #CryptoSignals
73

·
--
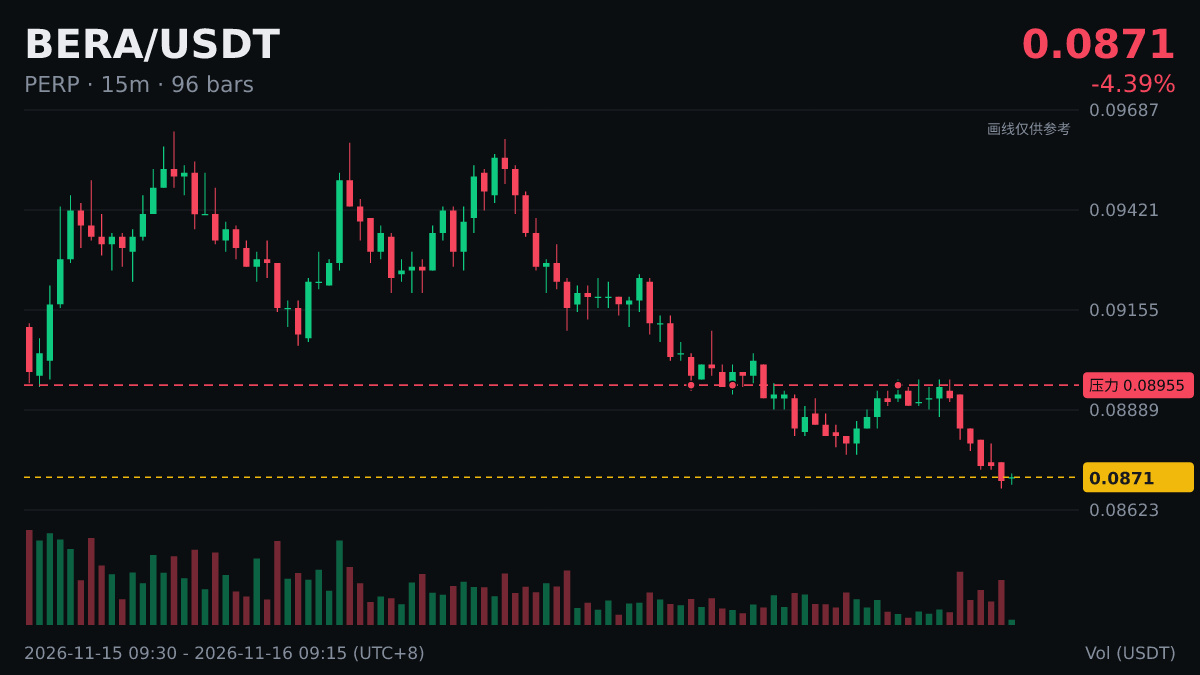
$BERA fell below the 24-hour low
Current price: 0.0872, previous low: 0.0873, 24h: -5.63%.
Protect your principal first; there will always be more opportunities. Did anyone manage to get out in time? Share your thoughts.
#BERA
Just chatting—whether you make or lose money, you have to bear the consequences yourself.
$BERA fell below the 24-hour low
Current price: 0.0872, previous low: 0.0873, 24h: -5.63%.
Protect your principal first; there will always be more opportunities. Did anyone manage to get out in time? Share your thoughts.
#BERA
Just chatting—whether you make or lose money, you have to bear the consequences yourself.
Current price: 0.0872, previous low: 0.0873, 24h: -5.63%.
Protect your principal first; there will always be more opportunities. Did anyone manage to get out in time? Share your thoughts.
#BERA
Just chatting—whether you make or lose money, you have to bear the consequences yourself.
16

·
--
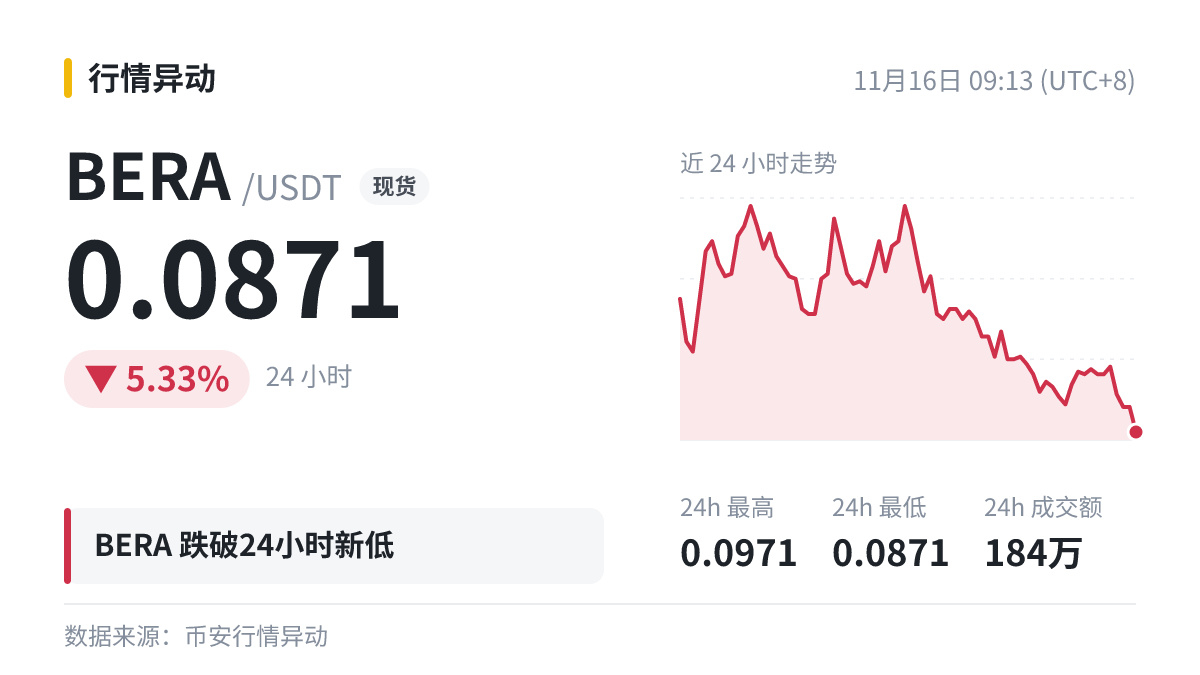
💣 $BERA set a new 24-hour low at 0.0871, breaking below the previous low of 0.0873.
The bulls can’t catch it for now. When prices are falling fast, it’s best not to rush to call the bottom. Did anyone get out early? Share your experience.
#BERA
💣 $BERA set a new 24-hour low at 0.0871, breaking below the previous low of 0.0873.
The bulls can’t catch it for now. When prices are falling fast, it’s best not to rush to call the bottom. Did anyone get out early? Share your experience.
#BERA
The bulls can’t catch it for now. When prices are falling fast, it’s best not to rush to call the bottom. Did anyone get out early? Share your experience.
#BERA
290

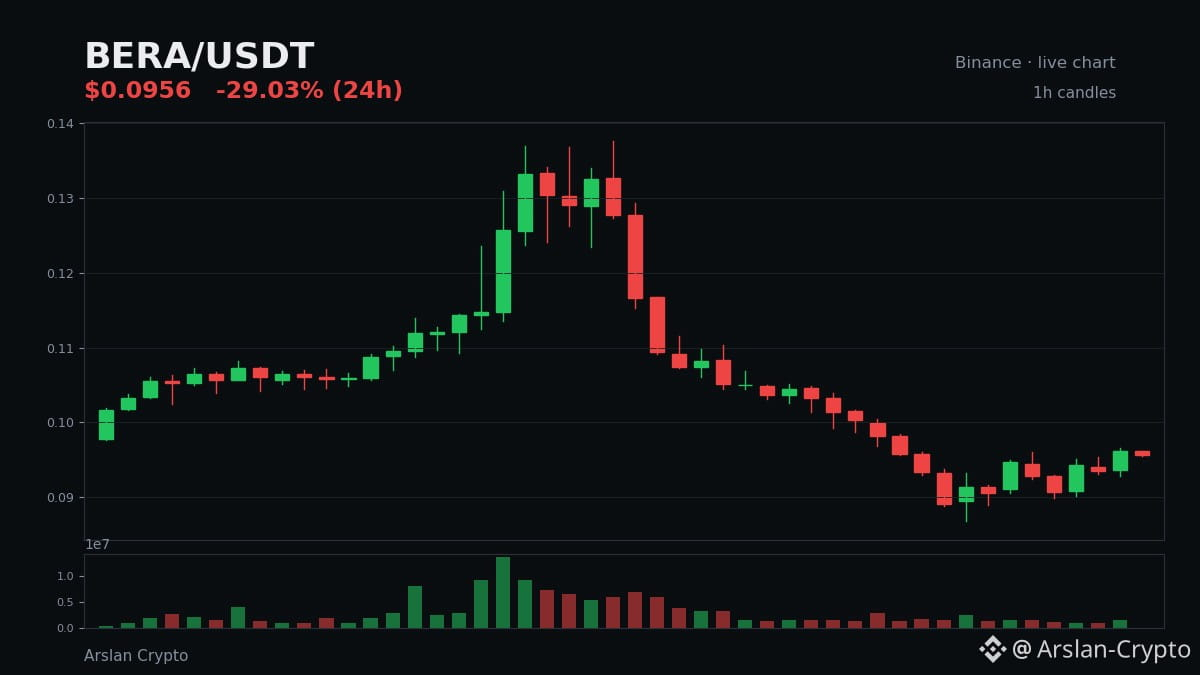
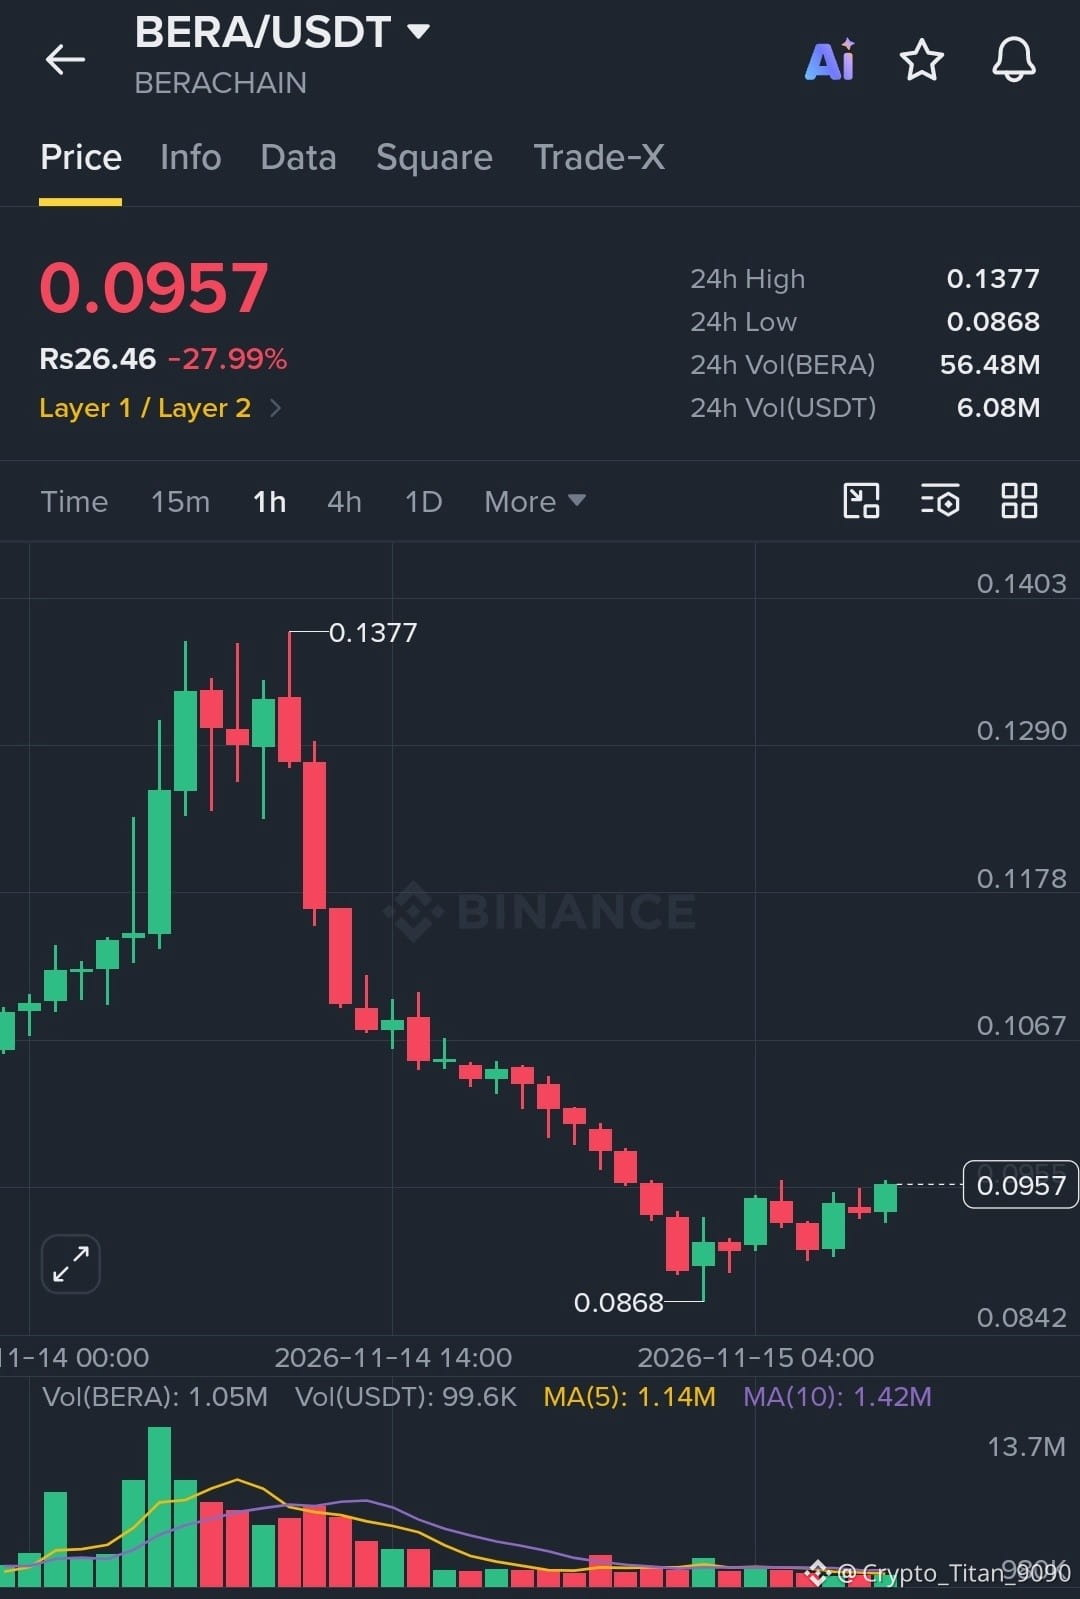
BERA flipped from gainer to loser in one day, and the fall got worse since this morning.
Yesterday BERA was up around +14%. Today $BERA is down -28.8% at $0.0956, on $6.0M volume. The high is $0.1377, the low $0.0868.
The last 12 hourly closes are a staircase down — $0.1003, $0.0982, $0.0958, $0.0934, $0.0891… then a small bounce. The $0.0868 low got tested and held, for now.
The levels I am watching:
Support: $0.0868
Resistance: $0.10
Trigger: an hourly close above $0.098 would tell me the slide is pausing
Invalidation: an hourly close under $0.0868 and the next stop is lower
No verified news reason for either day. And remember the bigger picture: BERA is still down more than 90% over the last year, even after yesterday's green day.
A coin that flips +14% then -29% — is that a trade, or a warning?
#BERA #Crypto #Binance
Not financial advice.
BERA flipped from gainer to loser in one day, and the fall got worse since this morning.
Yesterday BERA was up around +14%. Today $BERA is down -28.8% at $0.0956, on $6.0M volume. The high is $0.1377, the low $0.0868.
The last 12 hourly closes are a staircase down — $0.1003, $0.0982, $0.0958, $0.0934, $0.0891… then a small bounce. The $0.0868 low got tested and held, for now.
The levels I am watching:
Support: $0.0868
Resistance: $0.10
Trigger: an hourly close above $0.098 would tell me the slide is pausing
Invalidation: an hourly close under $0.0868 and the next stop is lower
No verified news reason for either day. And remember the bigger picture: BERA is still down more than 90% over the last year, even after yesterday's green day.
A coin that flips +14% then -29% — is that a trade, or a warning?
#BERA #Crypto #Binance
Not financial advice.
Yesterday BERA was up around +14%. Today $BERA is down -28.8% at $0.0956, on $6.0M volume. The high is $0.1377, the low $0.0868.
The last 12 hourly closes are a staircase down — $0.1003, $0.0982, $0.0958, $0.0934, $0.0891… then a small bounce. The $0.0868 low got tested and held, for now.
The levels I am watching:
Support: $0.0868
Resistance: $0.10
Trigger: an hourly close above $0.098 would tell me the slide is pausing
Invalidation: an hourly close under $0.0868 and the next stop is lower
No verified news reason for either day. And remember the bigger picture: BERA is still down more than 90% over the last year, even after yesterday's green day.
A coin that flips +14% then -29% — is that a trade, or a warning?
#BERA #Crypto #Binance
Not financial advice.
14

$BERA - bullish trend continuation.
🎯 TP1: $0.0868
🎯 TP2: $0.0800
🛑 SL: $0.138
Short on aligned bearish tape. Stop above 24h high.
Click here to Trade 👇
#BERA
{future}(BERAUSDT)
$BERA - bullish trend continuation.
🎯 TP1: $0.0868
🎯 TP2: $0.0800
🛑 SL: $0.138
Short on aligned bearish tape. Stop above 24h high.
Click here to Trade 👇
#BERA
🎯 TP1: $0.0868
🎯 TP2: $0.0800
🛑 SL: $0.138
Short on aligned bearish tape. Stop above 24h high.
Click here to Trade 👇
#BERA
1
18
Log in to explore more content
Join global crypto users on Binance Square
⚡️ Get latest and useful information about crypto.
💬 Trusted by the world’s largest crypto exchange.
👍 Discover real insights from verified creators.
Email / Phone number
Trending Topics
1
#NvidiaLoses$2.7TrillionInMonthAndAHalf
12,751 views
103 Discussing
2
#CanBTCReboundAfterFallingBelow60K?
696,869 views
2,851 Discussing
3
#GlobalStocksFaceLongestLosingStreakSince2023
250,239 views
1,925 Discussing
4
#BlackRockIBITPostsRecord$541MSingleDayOutflow
27,354 views
81 Discussing
5
#AnthropicPlungesTowardIPOPriceonDay2
125,970 views
1,165 Discussing
6
#TwentyOneCapitalAdds172.25BTC
56,557 views
632 Discussing
7
#HKBillWouldExcludeTokenizedDepositsFromVirtualAssets
6,762 views
49 Discussing
8
#BNBDropsBelow540USDTWith8.46%DailyDecline
69,900 views
615 Discussing
9
#HKBillProposesHK$100KFineForUnauthorizedCryptoTitles
2,356 views
22 Discussing
10
#BitMineFaces$10.1BUnrealizedETHLoss
4,704 views
26 Discussing