
#btc
btc
9.5G views
62M Discussing
Hot
Latest


🟡 Bitcoin price wobbles ahead of Fed’s rate decision
Bitcoin (BTC) dipped as low as $59,500 on Binance ahead of tomorrow’s Federal Open Market Committee (FOMC) meeting. Market participants are bracing for a hawkish stance from the Federal Reserve (Fed), with expectations set for unchanged interest rates.
The CME FedWatch Tool indicates a mere 4.4% of economists predict a rate cut—the first in over a decade—while a dominant 95.6% anticipate rates to hold steady between 525-550 basis points.
According to The Kobeissi Letter, current market data indicates a 36% probability that there will be no interest rate cuts this year. Four months ago, the likelihood of maintaining current rates was only about 3%.
Expectations have also shifted to just one reduction this year. Previously, the market anticipated six rate cuts. Additionally, the probability of experiencing two or more rate cuts has diminished to 31%.
🔺 Stagflation risk
Amidst this financial climate, the US grapples with stagflation risks as inflation persists and economic growth slows.
The first quarter of 2024 saw GDP growth decelerate to 1.6%, falling short of the 2.2% forecast and down from the previous quarter’s 3.4%. Concurrently, the US Core PCE inflation index climbed from 2.0% to 3.7%.
Fed Chair Jerome Powell stated that recent data does not make the Fed more confident, suggesting a longer timeline to regain economic stability. He expressed belief in the adequacy of current policies to navigate the risks at hand, hinting at sustained high-interest rates without increases.
Bitcoin’s trajectory mirrored these economic uncertainties, dropping below $62,000 earlier in the week due to renewed stagflation worries.
A brief rally above $64,000 occurred with the launch of spot Bitcoin and Ethereum ETFs in Hong Kong yesterday, but the momentum was short-lived as investor caution set in ahead of the Fed’s key decision.
$BTC #BTC #Bitcoin
🟡 Bitcoin price wobbles ahead of Fed’s rate decision
Bitcoin (BTC) dipped as low as $59,500 on Binance ahead of tomorrow’s Federal Open Market Committee (FOMC) meeting. Market participants are bracing for a hawkish stance from the Federal Reserve (Fed), with expectations set for unchanged interest rates.
The CME FedWatch Tool indicates a mere 4.4% of economists predict a rate cut—the first in over a decade—while a dominant 95.6% anticipate rates to hold steady between 525-550 basis points.
According to The Kobeissi Letter, current market data indicates a 36% probability that there will be no interest rate cuts this year. Four months ago, the likelihood of maintaining current rates was only about 3%.
Expectations have also shifted to just one reduction this year. Previously, the market anticipated six rate cuts. Additionally, the probability of experiencing two or more rate cuts has diminished to 31%.
🔺 Stagflation risk
Amidst this financial climate, the US grapples with stagflation risks as inflation persists and economic growth slows.
The first quarter of 2024 saw GDP growth decelerate to 1.6%, falling short of the 2.2% forecast and down from the previous quarter’s 3.4%. Concurrently, the US Core PCE inflation index climbed from 2.0% to 3.7%.
Fed Chair Jerome Powell stated that recent data does not make the Fed more confident, suggesting a longer timeline to regain economic stability. He expressed belief in the adequacy of current policies to navigate the risks at hand, hinting at sustained high-interest rates without increases.
Bitcoin’s trajectory mirrored these economic uncertainties, dropping below $62,000 earlier in the week due to renewed stagflation worries.
A brief rally above $64,000 occurred with the launch of spot Bitcoin and Ethereum ETFs in Hong Kong yesterday, but the momentum was short-lived as investor caution set in ahead of the Fed’s key decision.
$BTC #BTC #Bitcoin
Bitcoin (BTC) dipped as low as $59,500 on Binance ahead of tomorrow’s Federal Open Market Committee (FOMC) meeting. Market participants are bracing for a hawkish stance from the Federal Reserve (Fed), with expectations set for unchanged interest rates.
The CME FedWatch Tool indicates a mere 4.4% of economists predict a rate cut—the first in over a decade—while a dominant 95.6% anticipate rates to hold steady between 525-550 basis points.
According to The Kobeissi Letter, current market data indicates a 36% probability that there will be no interest rate cuts this year. Four months ago, the likelihood of maintaining current rates was only about 3%.
Expectations have also shifted to just one reduction this year. Previously, the market anticipated six rate cuts. Additionally, the probability of experiencing two or more rate cuts has diminished to 31%.
🔺 Stagflation risk
Amidst this financial climate, the US grapples with stagflation risks as inflation persists and economic growth slows.
The first quarter of 2024 saw GDP growth decelerate to 1.6%, falling short of the 2.2% forecast and down from the previous quarter’s 3.4%. Concurrently, the US Core PCE inflation index climbed from 2.0% to 3.7%.
Fed Chair Jerome Powell stated that recent data does not make the Fed more confident, suggesting a longer timeline to regain economic stability. He expressed belief in the adequacy of current policies to navigate the risks at hand, hinting at sustained high-interest rates without increases.
Bitcoin’s trajectory mirrored these economic uncertainties, dropping below $62,000 earlier in the week due to renewed stagflation worries.
A brief rally above $64,000 occurred with the launch of spot Bitcoin and Ethereum ETFs in Hong Kong yesterday, but the momentum was short-lived as investor caution set in ahead of the Fed’s key decision.
$BTC #BTC #Bitcoin

138
58
403
301.3k

$BTC
{future}(BTCUSDT)
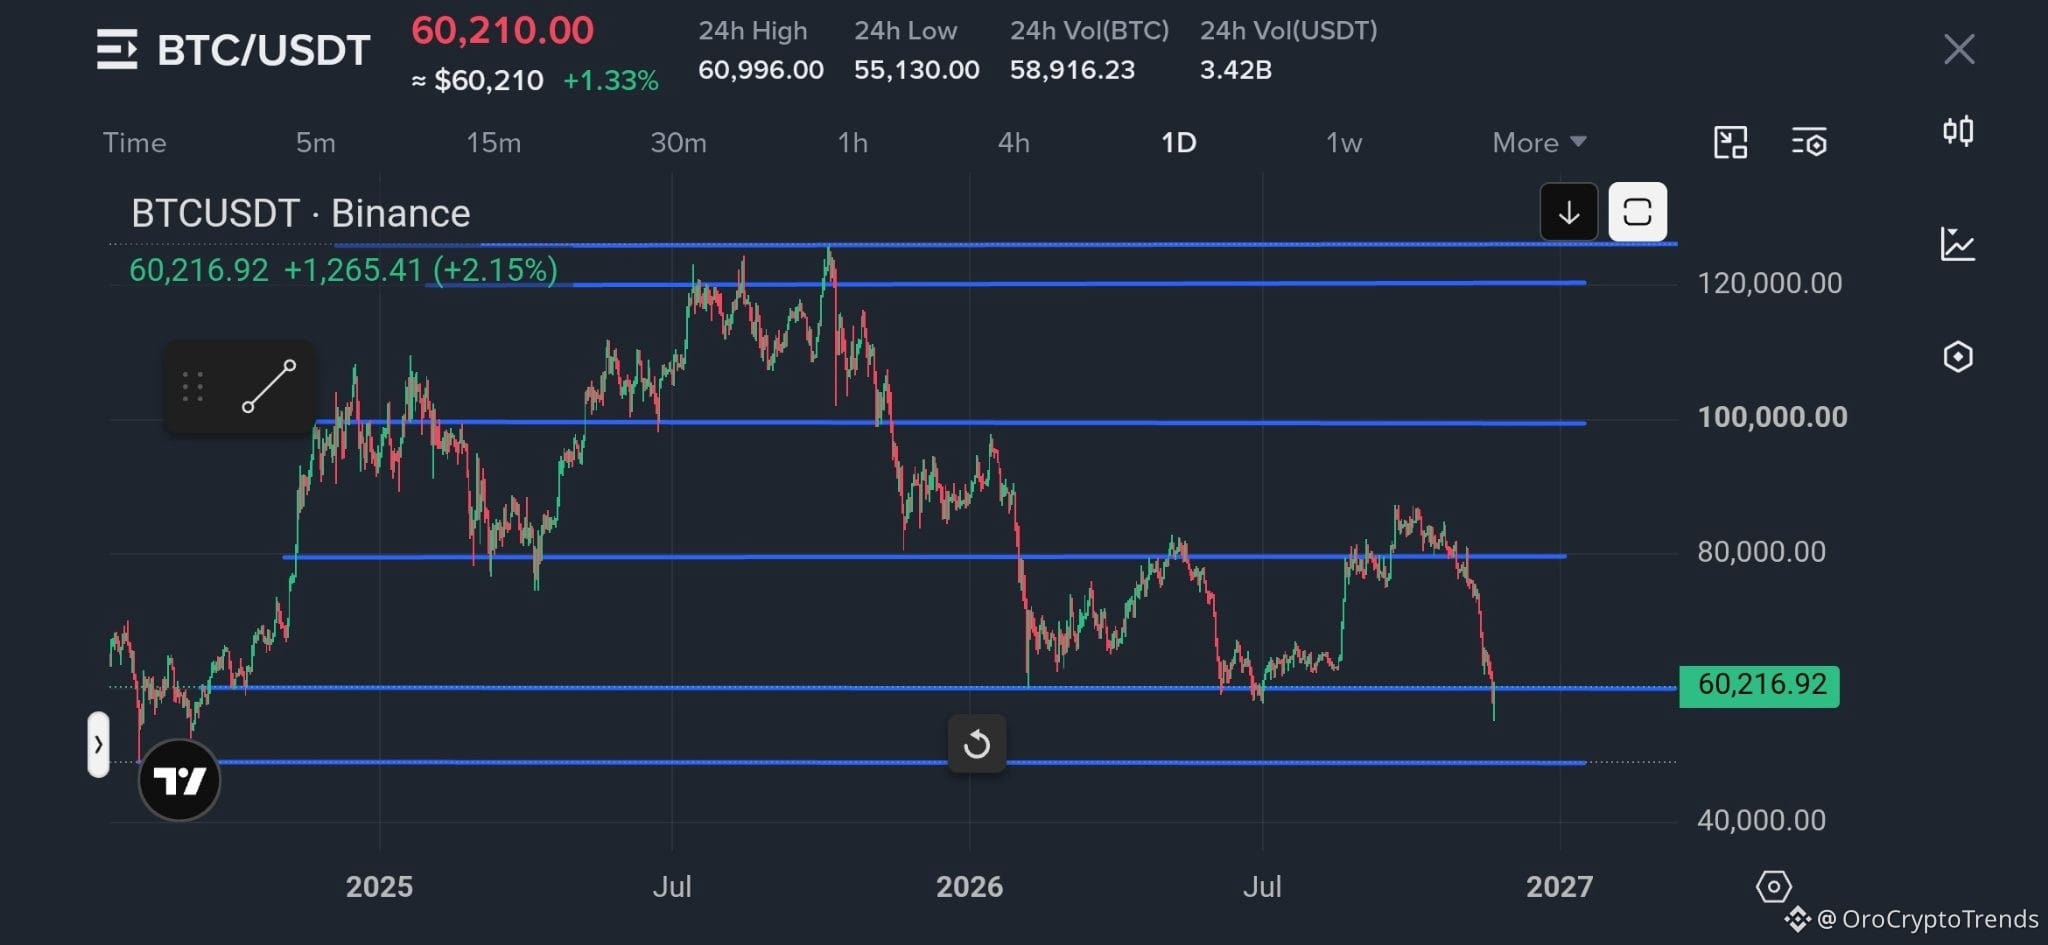
$BTC swept below $60K, hit $55K, and bounced back. The close decides what it means. 📉
My last update said a daily close below $60K would break the multi-month floor. According to Binance's BTC/USDT spot charts, BTC wicked down to $55,130 in the last 24 hours and is now back near $60,300, up about 1.7% on the 24h. It reclaimed the floor, but the daily candle is still open.
What changed:
🔻 The floor broke, then reclaimed. Price dropped about 8% below $60K, then recovered the full move in a V-shape. The daily candle now shows a long lower wick.
🔻 The bounce stalled under resistance. The recovery topped near $61K, below the $62K level that was support until this week.
🔻 Trendline reclaimed. On the 1H and 4H, price wicked below the descending line from the October top and closed back above it. That is a better sign than last week, but it is one reclaim, not a trend change.
🔻 Still a multi-month range. BTC has traded between roughly $60K and $85K-$87K for most of the year. The $57K-$58K July low and the $55K wick are now both in play as a zone.
Key levels to watch:
🟥 Resistance: $61K, $62K-$62.3K, $64K
🟩 Support: $60K, then $57K-$58K, then $55.1K
Scenarios:
Bullish: A daily close above $60K keeps the wick as a failed breakdown. A daily close above $62K would confirm it and put $64K in play.
Bearish: A rejection at $61K-$62K, then a loss of $60K again, puts the $55K low back in play. A daily close below it opens the high-$40Ks.
Unchanged: Chop between $59K and $61K on fading volume is compression, not a signal.
What I'm watching: today's daily close relative to $60K, whether the bounce holds on a retest, and whether volume stays high on the way up.
No hype and no prediction. A fast reclaim helps the bulls, but it is not confirmation. A single wick doesn't change the trend.
⚠️ This is a chart read, not financial advice. Manage your risk and do your own research.
What's your read: was $55K the low, or just the first sweep? 👇
#BTC #Bitcoin #BTCUSDT #OroCryptoTrends
$BTC
$BTC swept below $60K, hit $55K, and bounced back. The close decides what it means. 📉
My last update said a daily close below $60K would break the multi-month floor. According to Binance's BTC/USDT spot charts, BTC wicked down to $55,130 in the last 24 hours and is now back near $60,300, up about 1.7% on the 24h. It reclaimed the floor, but the daily candle is still open.
What changed:
🔻 The floor broke, then reclaimed. Price dropped about 8% below $60K, then recovered the full move in a V-shape. The daily candle now shows a long lower wick.
🔻 The bounce stalled under resistance. The recovery topped near $61K, below the $62K level that was support until this week.
🔻 Trendline reclaimed. On the 1H and 4H, price wicked below the descending line from the October top and closed back above it. That is a better sign than last week, but it is one reclaim, not a trend change.
🔻 Still a multi-month range. BTC has traded between roughly $60K and $85K-$87K for most of the year. The $57K-$58K July low and the $55K wick are now both in play as a zone.
Key levels to watch:
🟥 Resistance: $61K, $62K-$62.3K, $64K
🟩 Support: $60K, then $57K-$58K, then $55.1K
Scenarios:
Bullish: A daily close above $60K keeps the wick as a failed breakdown. A daily close above $62K would confirm it and put $64K in play.
Bearish: A rejection at $61K-$62K, then a loss of $60K again, puts the $55K low back in play. A daily close below it opens the high-$40Ks.
Unchanged: Chop between $59K and $61K on fading volume is compression, not a signal.
What I'm watching: today's daily close relative to $60K, whether the bounce holds on a retest, and whether volume stays high on the way up.
No hype and no prediction. A fast reclaim helps the bulls, but it is not confirmation. A single wick doesn't change the trend.
⚠️ This is a chart read, not financial advice. Manage your risk and do your own research.
What's your read: was $55K the low, or just the first sweep? 👇
#BTC #Bitcoin #BTCUSDT #OroCryptoTrends
$BTC swept below $60K, hit $55K, and bounced back. The close decides what it means. 📉
My last update said a daily close below $60K would break the multi-month floor. According to Binance's BTC/USDT spot charts, BTC wicked down to $55,130 in the last 24 hours and is now back near $60,300, up about 1.7% on the 24h. It reclaimed the floor, but the daily candle is still open.
What changed:
🔻 The floor broke, then reclaimed. Price dropped about 8% below $60K, then recovered the full move in a V-shape. The daily candle now shows a long lower wick.
🔻 The bounce stalled under resistance. The recovery topped near $61K, below the $62K level that was support until this week.
🔻 Trendline reclaimed. On the 1H and 4H, price wicked below the descending line from the October top and closed back above it. That is a better sign than last week, but it is one reclaim, not a trend change.
🔻 Still a multi-month range. BTC has traded between roughly $60K and $85K-$87K for most of the year. The $57K-$58K July low and the $55K wick are now both in play as a zone.
Key levels to watch:
🟥 Resistance: $61K, $62K-$62.3K, $64K
🟩 Support: $60K, then $57K-$58K, then $55.1K
Scenarios:
Bullish: A daily close above $60K keeps the wick as a failed breakdown. A daily close above $62K would confirm it and put $64K in play.
Bearish: A rejection at $61K-$62K, then a loss of $60K again, puts the $55K low back in play. A daily close below it opens the high-$40Ks.
Unchanged: Chop between $59K and $61K on fading volume is compression, not a signal.
What I'm watching: today's daily close relative to $60K, whether the bounce holds on a retest, and whether volume stays high on the way up.
No hype and no prediction. A fast reclaim helps the bulls, but it is not confirmation. A single wick doesn't change the trend.
⚠️ This is a chart read, not financial advice. Manage your risk and do your own research.
What's your read: was $55K the low, or just the first sweep? 👇
#BTC #Bitcoin #BTCUSDT #OroCryptoTrends
1
753

·
--
Bullish
2/2 $BTC TPs HIT TODAY ($57,800 Short + $59,800 Long) 🎯
Guys, I’m opening a LONG on $BTC here.
TP: $61,850
SL: $58,950
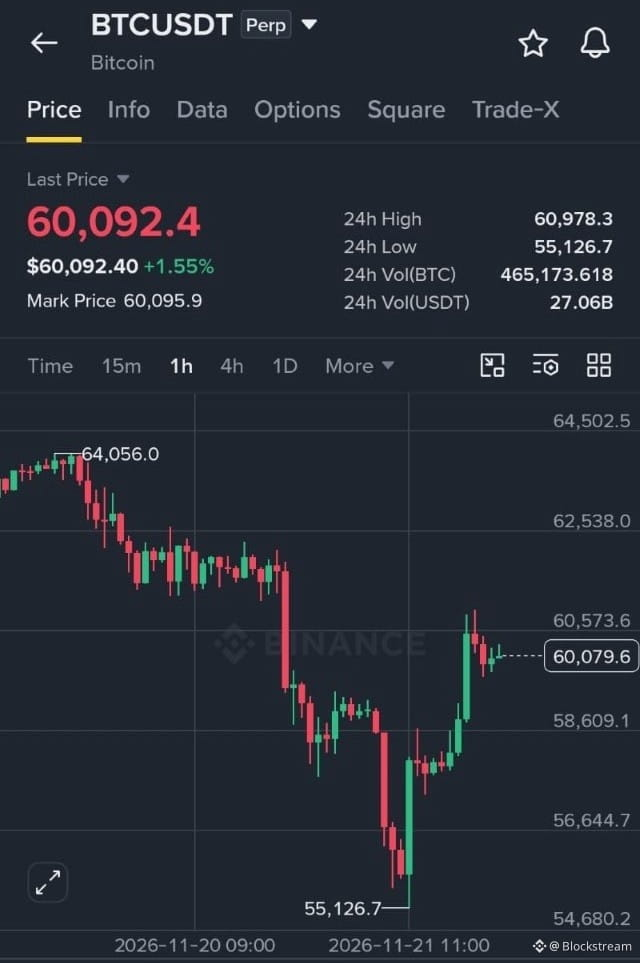
$BTC cleanly reclaimed the $60,000 psychological level on $27.06B in 24h volume after sweeping $55,126.7 earlier today. Price is now consolidating tightly above $60,000 on the 1H chart with strong NY session buyer absorption — holding above $59,500 keeps the upside continuation toward $60,978 and $61,850 intact. Using 5x–10x max leverage with a strict SL at $58,950 to protect capital.
{spot}(BTCUSDT)
#BTC #CanBTCReboundAfterFallingBelow60K?
2/2 $BTC TPs HIT TODAY ($57,800 Short + $59,800 Long) 🎯
Guys, I’m opening a LONG on $BTC here.
TP: $61,850
SL: $58,950
$BTC cleanly reclaimed the $60,000 psychological level on $27.06B in 24h volume after sweeping $55,126.7 earlier today. Price is now consolidating tightly above $60,000 on the 1H chart with strong NY session buyer absorption — holding above $59,500 keeps the upside continuation toward $60,978 and $61,850 intact. Using 5x–10x max leverage with a strict SL at $58,950 to protect capital.
#BTC #CanBTCReboundAfterFallingBelow60K?
Guys, I’m opening a LONG on $BTC here.
TP: $61,850
SL: $58,950
$BTC cleanly reclaimed the $60,000 psychological level on $27.06B in 24h volume after sweeping $55,126.7 earlier today. Price is now consolidating tightly above $60,000 on the 1H chart with strong NY session buyer absorption — holding above $59,500 keeps the upside continuation toward $60,978 and $61,850 intact. Using 5x–10x max leverage with a strict SL at $58,950 to protect capital.
#BTC #CanBTCReboundAfterFallingBelow60K?
1
2
1.1k

·
--
Bearish
🚨 BULLS HIT A BRICK WALL AT $61K. SHORT IT. 🚨
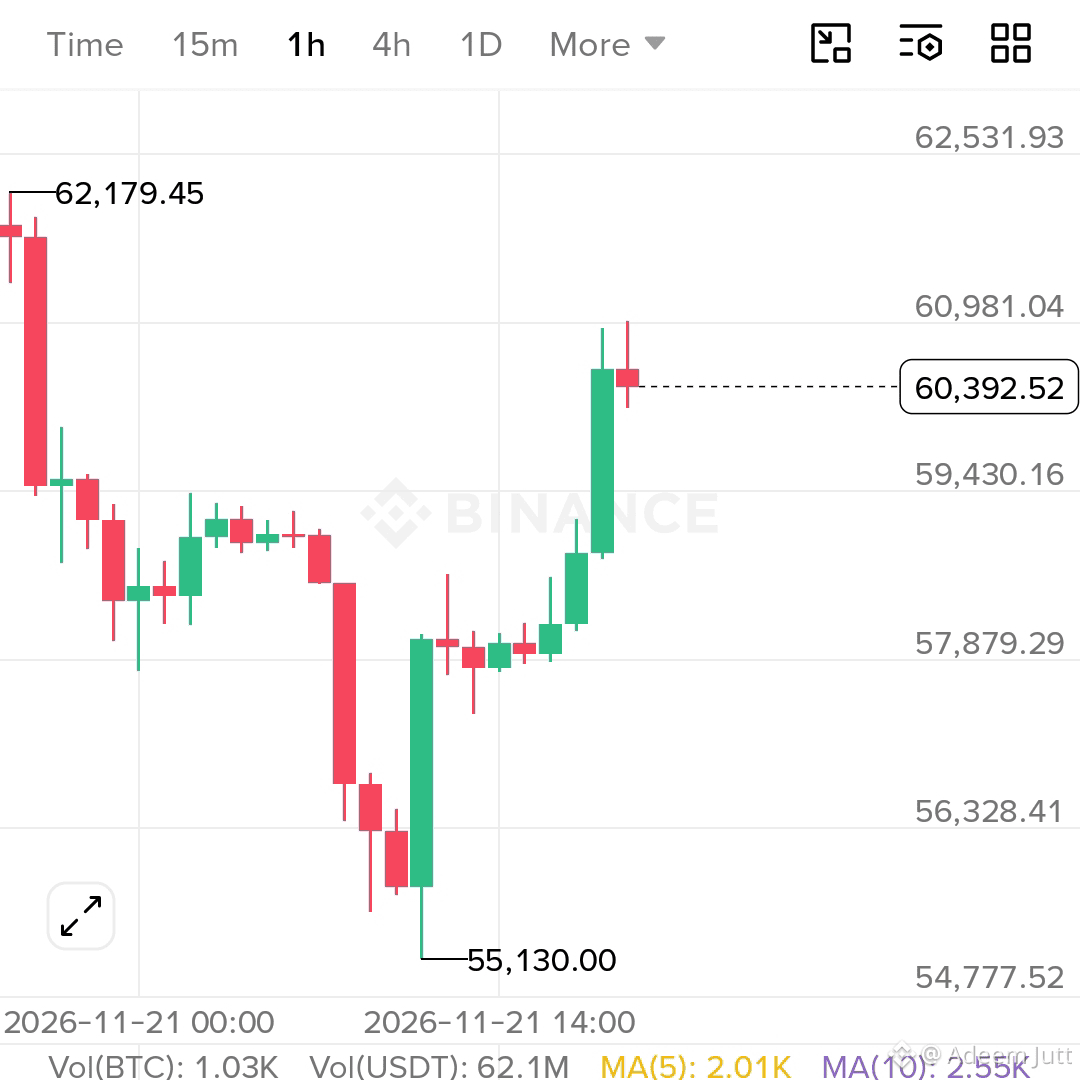
That V-shaped pump from $55k is running on fumes. Clear rejection at the $61,000 resistance means gravity is about to take over. We are taking the short on the pullback.
🔻 SHORT $BTC
🎯 Entry: $60,400 - $60,700
💰 TP1: $59,500
💰 TP2: $58,500
🛑 SL: $61,350 (Strict)
Don't overleverage. Let the dump begin. 📉👇
{future}(BTCUSDT)
#CanBTCReboundAfterFallingBelow60K? #BTC #XRPDropsToTwoYearLowNear87Cents
🚨 BULLS HIT A BRICK WALL AT $61K. SHORT IT. 🚨
That V-shaped pump from $55k is running on fumes. Clear rejection at the $61,000 resistance means gravity is about to take over. We are taking the short on the pullback.
🔻 SHORT $BTC
🎯 Entry: $60,400 - $60,700
💰 TP1: $59,500
💰 TP2: $58,500
🛑 SL: $61,350 (Strict)
Don't overleverage. Let the dump begin. 📉👇
#CanBTCReboundAfterFallingBelow60K? #BTC #XRPDropsToTwoYearLowNear87Cents
That V-shaped pump from $55k is running on fumes. Clear rejection at the $61,000 resistance means gravity is about to take over. We are taking the short on the pullback.
🔻 SHORT $BTC
🎯 Entry: $60,400 - $60,700
💰 TP1: $59,500
💰 TP2: $58,500
🛑 SL: $61,350 (Strict)
Don't overleverage. Let the dump begin. 📉👇
#CanBTCReboundAfterFallingBelow60K? #BTC #XRPDropsToTwoYearLowNear87Cents
Binance BiBi:
I see! The post claims BTC bulls got rejected at the $61,000 resistance after a V-shaped pump from ~$55k and says the rally is “running on fumes.” It proposes a short on BTC (BTCUSDT futures) with an entry zone of $60,400–$60,700, take-profit targets at $59,500 and $58,500, and a strict stop-loss at $61,350, while warning not to overleverage.
3
1
200



·
--
📉 BTC: my personal view on the 48K-55K zone
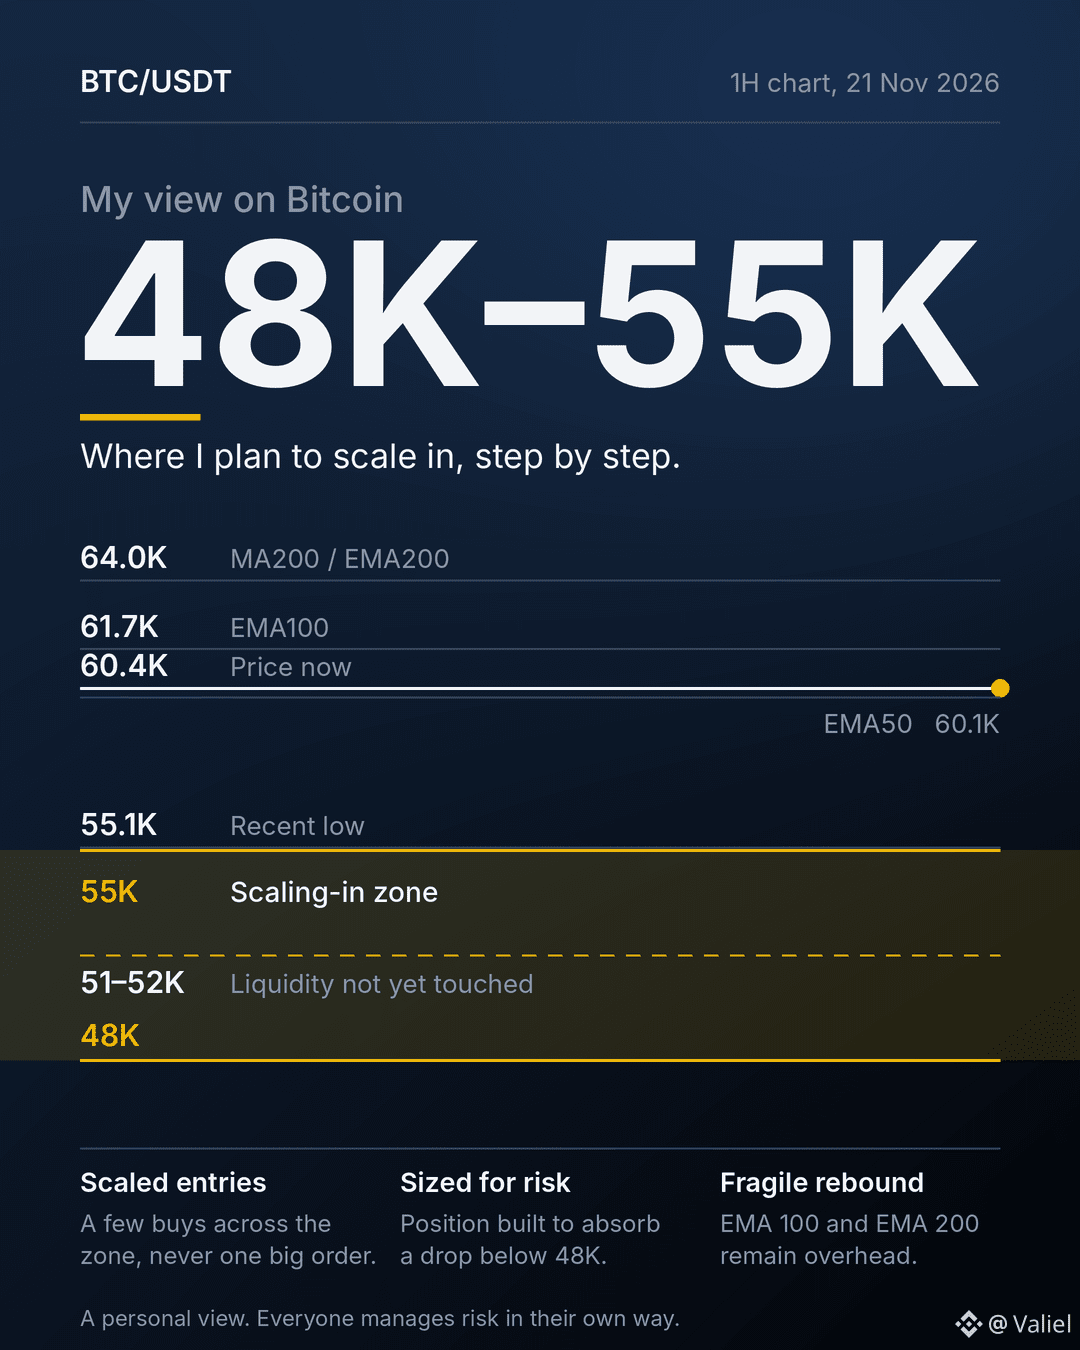
After the drop to $55,130, Bitcoin is bouncing around $60,400 (+9% from the low), with a huge volume spike at the bottom. To me, this looks like a capitulation phase 👀
🔹 I'm not trying to catch the exact bottom
🔹 I'm targeting the 48K-55K zone for a few scaled buys
🔹 My position size is built to absorb a drop below 48K
🔹 Keeping cash on the side is essential: if BTC breaks below 48K, I want dry powder left, not an empty wallet
Technically, caution is still key:
🔹 EMA 100 (~61.7K) and EMA 200 (~64K) are still overhead and sloping down
🔹 The liquidity around 51-52K hasn't been touched yet
🔹 Until those levels are reclaimed, this bounce could stay technical
Everyone has their own way of reading the market and managing risk. This one is mine. What about you: do you wait for confirmation or scale in? 💬
⚠️ Not financial advice.
#BTC #Bitcoin $BTC
{spot}(BTCUSDT)
📉 BTC: my personal view on the 48K-55K zone
After the drop to $55,130, Bitcoin is bouncing around $60,400 (+9% from the low), with a huge volume spike at the bottom. To me, this looks like a capitulation phase 👀
🔹 I'm not trying to catch the exact bottom
🔹 I'm targeting the 48K-55K zone for a few scaled buys
🔹 My position size is built to absorb a drop below 48K
🔹 Keeping cash on the side is essential: if BTC breaks below 48K, I want dry powder left, not an empty wallet
Technically, caution is still key:
🔹 EMA 100 (~61.7K) and EMA 200 (~64K) are still overhead and sloping down
🔹 The liquidity around 51-52K hasn't been touched yet
🔹 Until those levels are reclaimed, this bounce could stay technical
Everyone has their own way of reading the market and managing risk. This one is mine. What about you: do you wait for confirmation or scale in? 💬
⚠️ Not financial advice.
#BTC #Bitcoin $BTC
After the drop to $55,130, Bitcoin is bouncing around $60,400 (+9% from the low), with a huge volume spike at the bottom. To me, this looks like a capitulation phase 👀
🔹 I'm not trying to catch the exact bottom
🔹 I'm targeting the 48K-55K zone for a few scaled buys
🔹 My position size is built to absorb a drop below 48K
🔹 Keeping cash on the side is essential: if BTC breaks below 48K, I want dry powder left, not an empty wallet
Technically, caution is still key:
🔹 EMA 100 (~61.7K) and EMA 200 (~64K) are still overhead and sloping down
🔹 The liquidity around 51-52K hasn't been touched yet
🔹 Until those levels are reclaimed, this bounce could stay technical
Everyone has their own way of reading the market and managing risk. This one is mine. What about you: do you wait for confirmation or scale in? 💬
⚠️ Not financial advice.
#BTC #Bitcoin $BTC
162

·
--
$BTC
{future}(BTCUSDT)
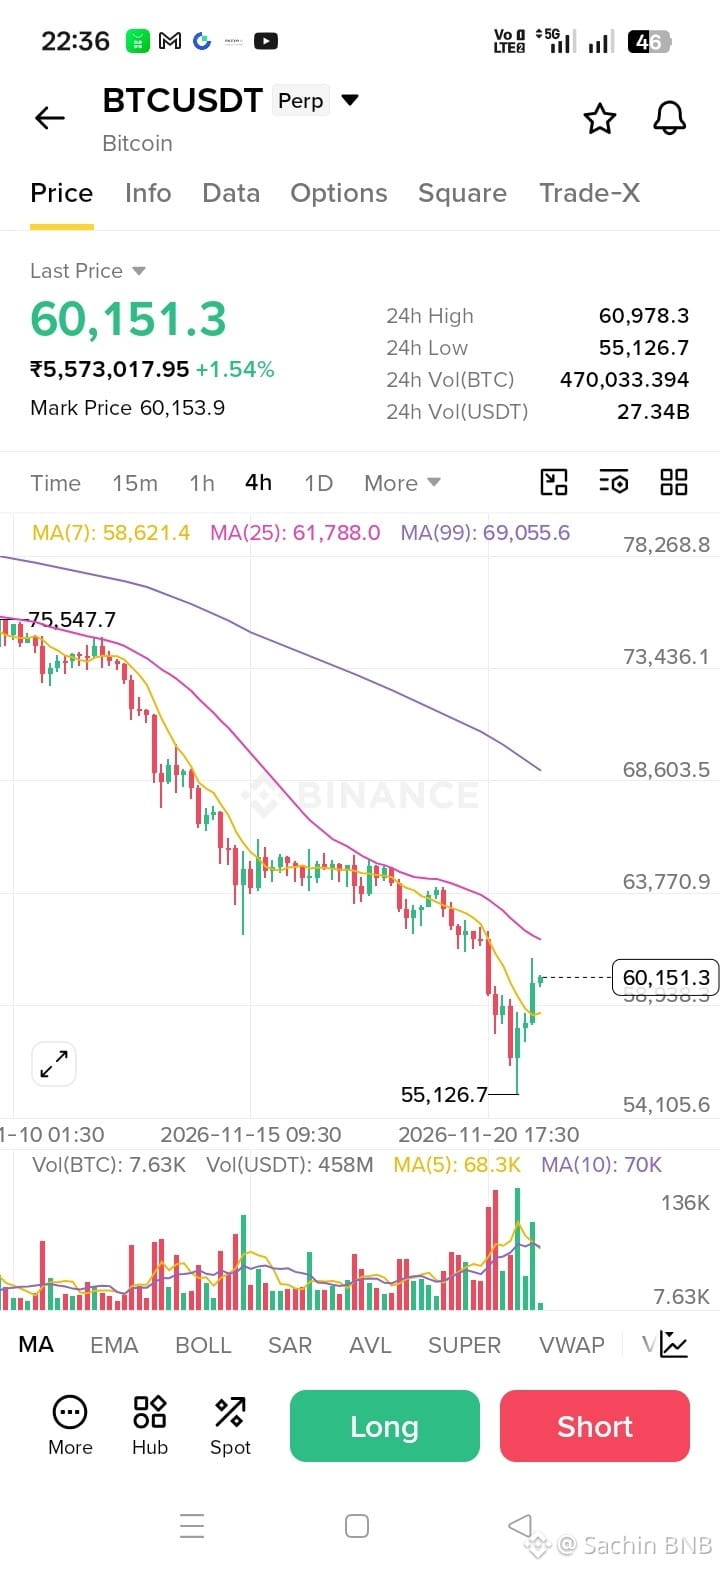
is showing signs of a bounce, but is the worst over? 👀
Bitcoin is trading around $60,150 after recovering from a sharp drop to $55,126.
📊 4H chart watch:
• Buyers stepped in strongly near $55.1K.
• Price is back above MA(7) at $58.6K.
• MA(25) around $61.8K is the next resistance to watch.
• MA(99) near $69K shows the broader trend is still bearish.
My take: This looks like a relief bounce for now, not a confirmed trend reversal.
BTC needs to reclaim $61.8K to build stronger bullish momentum. Otherwise, another rejection could bring selling pressure back.
Are we witnessing a recovery or just a dead cat bounce? 👇
#BTC #CryptoMarket
$BTC
is showing signs of a bounce, but is the worst over? 👀
Bitcoin is trading around $60,150 after recovering from a sharp drop to $55,126.
📊 4H chart watch:
• Buyers stepped in strongly near $55.1K.
• Price is back above MA(7) at $58.6K.
• MA(25) around $61.8K is the next resistance to watch.
• MA(99) near $69K shows the broader trend is still bearish.
My take: This looks like a relief bounce for now, not a confirmed trend reversal.
BTC needs to reclaim $61.8K to build stronger bullish momentum. Otherwise, another rejection could bring selling pressure back.
Are we witnessing a recovery or just a dead cat bounce? 👇
#BTC #CryptoMarket
is showing signs of a bounce, but is the worst over? 👀
Bitcoin is trading around $60,150 after recovering from a sharp drop to $55,126.
📊 4H chart watch:
• Buyers stepped in strongly near $55.1K.
• Price is back above MA(7) at $58.6K.
• MA(25) around $61.8K is the next resistance to watch.
• MA(99) near $69K shows the broader trend is still bearish.
My take: This looks like a relief bounce for now, not a confirmed trend reversal.
BTC needs to reclaim $61.8K to build stronger bullish momentum. Otherwise, another rejection could bring selling pressure back.
Are we witnessing a recovery or just a dead cat bounce? 👇
#BTC #CryptoMarket
128

·
--
Bullish
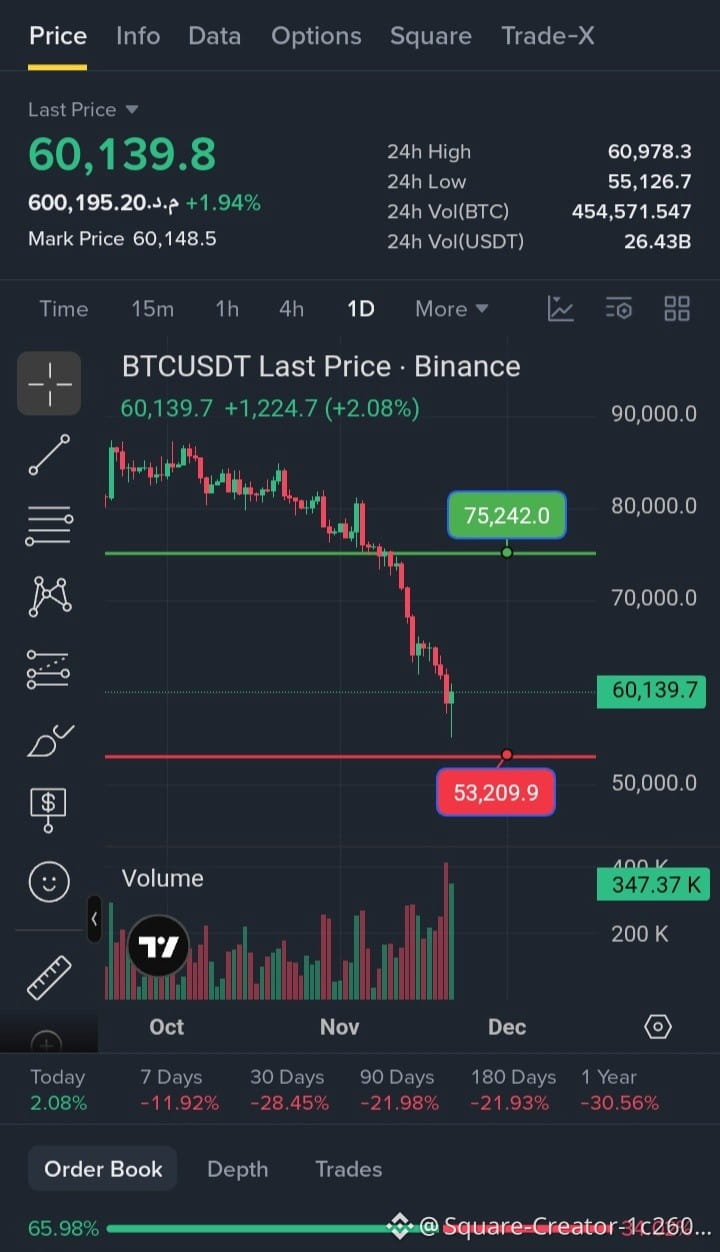
$BTC holding strong around $60K⚡️
After sweeping into the mid $55K zone and reclaiming the $60K mark, the heaviest selling pressure looks absorbed.
✨ In my view, BTC will not drop below $53,209 and is currently on its way toward the $75,242 level.
Volatility cuts both ways, so keep a close eye on key support and resistance as momentum builds. (DYOR)
$BTC
{future}(BTCUSDT)
#BTC #bitcoin
$BTC holding strong around $60K⚡️
After sweeping into the mid $55K zone and reclaiming the $60K mark, the heaviest selling pressure looks absorbed.
✨ In my view, BTC will not drop below $53,209 and is currently on its way toward the $75,242 level.
Volatility cuts both ways, so keep a close eye on key support and resistance as momentum builds. (DYOR)
$BTC
#BTC #bitcoin
After sweeping into the mid $55K zone and reclaiming the $60K mark, the heaviest selling pressure looks absorbed.
✨ In my view, BTC will not drop below $53,209 and is currently on its way toward the $75,242 level.
Volatility cuts both ways, so keep a close eye on key support and resistance as momentum builds. (DYOR)
$BTC
#BTC #bitcoin
1
159


·
--
#BİNANCE #BTC
BTC is already below all of its major moving averages — the 50-day (~$77K), the 200-day (~$72K), and even the 200-week (~$68K). That means every rally from here has to climb through a wall of overhead resistance before anyone can call it a trend reversal. A bounce off $57.7K is plausible, especially with RSI readings in the teens and the Z-score at -3 historically preceding short-term rallies. But a bounce is not a bottom.
The level to watch is $57,700–$58,500. Hold it, and the worst of the panic may be priced in. Lose it on a daily close, and $55K and then $48K.become the next conversations.
#BİNANCE #BTC
BTC is already below all of its major moving averages — the 50-day (~$77K), the 200-day (~$72K), and even the 200-week (~$68K). That means every rally from here has to climb through a wall of overhead resistance before anyone can call it a trend reversal. A bounce off $57.7K is plausible, especially with RSI readings in the teens and the Z-score at -3 historically preceding short-term rallies. But a bounce is not a bottom.
The level to watch is $57,700–$58,500. Hold it, and the worst of the panic may be priced in. Lose it on a daily close, and $55K and then $48K.become the next conversations.
BTC is already below all of its major moving averages — the 50-day (~$77K), the 200-day (~$72K), and even the 200-week (~$68K). That means every rally from here has to climb through a wall of overhead resistance before anyone can call it a trend reversal. A bounce off $57.7K is plausible, especially with RSI readings in the teens and the Z-score at -3 historically preceding short-term rallies. But a bounce is not a bottom.
The level to watch is $57,700–$58,500. Hold it, and the worst of the panic may be priced in. Lose it on a daily close, and $55K and then $48K.become the next conversations.

135

·
--
Bullish
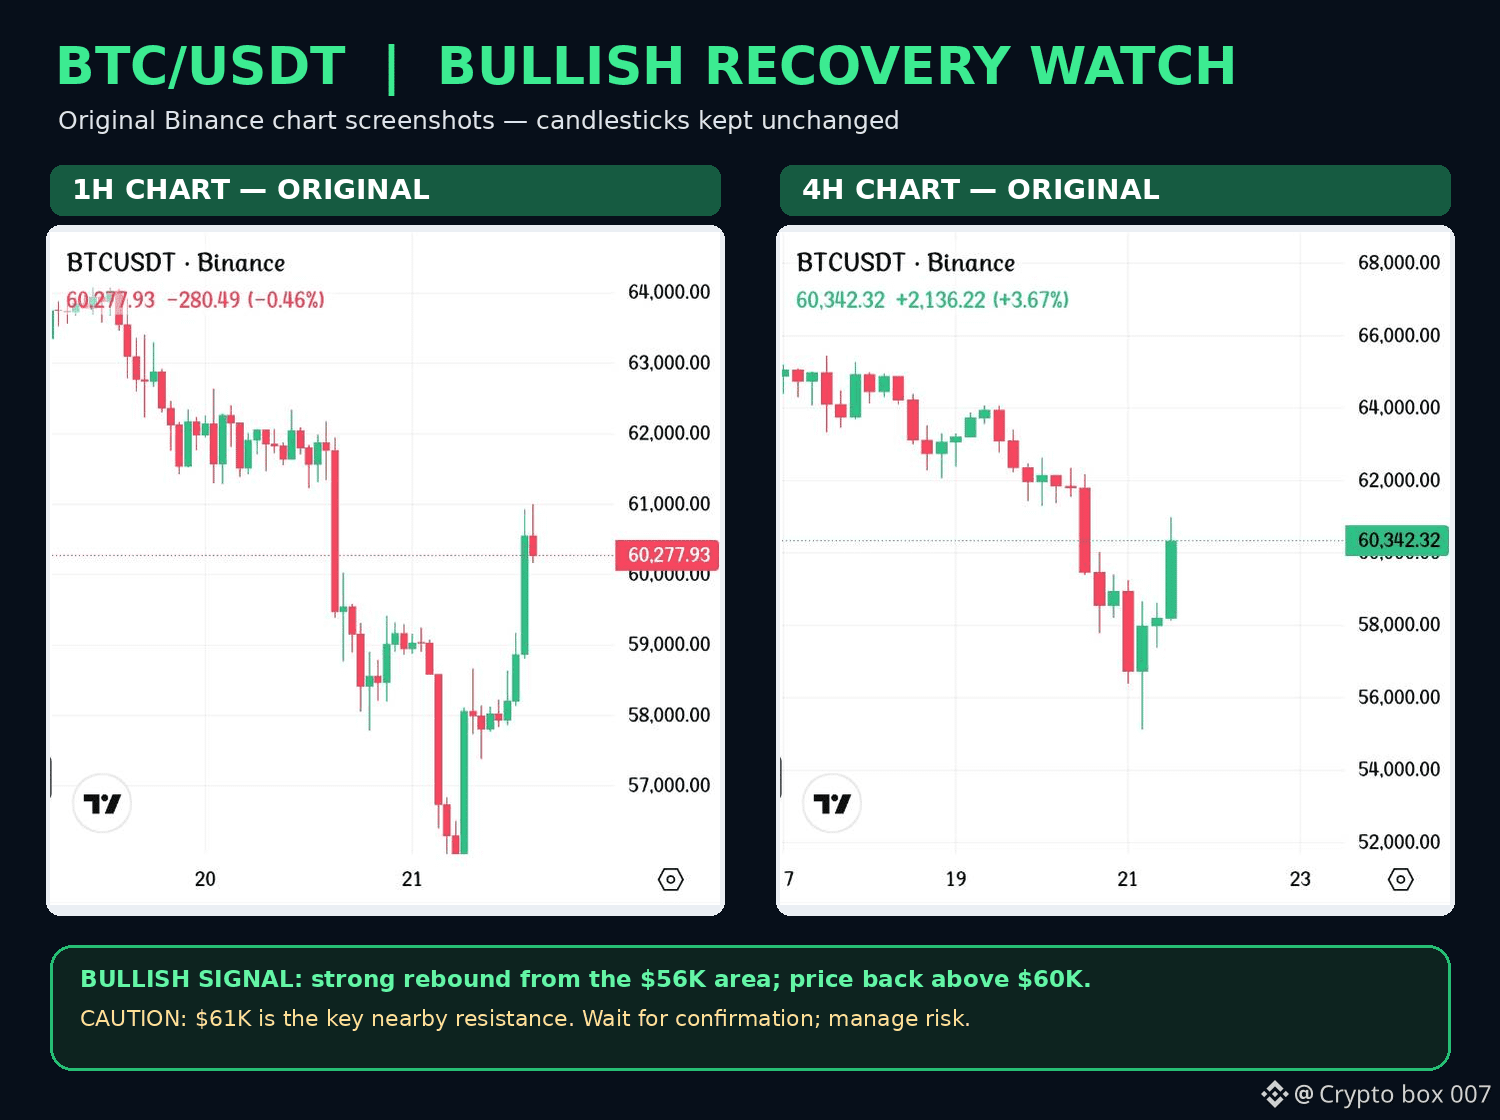
🚀 BITCOIN: BULLISH REVERSAL SIGNALS ARE EMERGING!
Bitcoin is showing encouraging signs of recovery after a sharp correction.
BTC has bounced strongly from the $56,000 region and has now climbed back above $60,000. Both the 1H and 4H charts are showing a strong bullish recovery.
📈 Bullish Outlook:
Strong bounce from the $56K support zone.
Price has reclaimed the $60K level.
Next resistance: $61K.
A confirmed breakout above $61K could open the door toward $62K–$63K.
Further upside may follow if buying momentum continues.
⚠️ But Don't Get Too Excited Yet!
The broader market structure is still fragile. BTC is approaching an important resistance area.
If Bitcoin fails to break above $61K, a pullback toward $59K–$58K remains possible.
My Strategy: I'm cautiously bullish, but I want to see a confirmed breakout above $61K before becoming more confident.
No FOMO. No reckless leverage. Risk management comes first.
The recovery looks promising, but confirmation is everything.
#Bitcoin #BTC #CryptoMarket #bullishreversal #BinanceSquare
$BTC
{spot}(BTCUSDT)
🚀 BITCOIN: BULLISH REVERSAL SIGNALS ARE EMERGING!
Bitcoin is showing encouraging signs of recovery after a sharp correction.
BTC has bounced strongly from the $56,000 region and has now climbed back above $60,000. Both the 1H and 4H charts are showing a strong bullish recovery.
📈 Bullish Outlook:
Strong bounce from the $56K support zone.
Price has reclaimed the $60K level.
Next resistance: $61K.
A confirmed breakout above $61K could open the door toward $62K–$63K.
Further upside may follow if buying momentum continues.
⚠️ But Don't Get Too Excited Yet!
The broader market structure is still fragile. BTC is approaching an important resistance area.
If Bitcoin fails to break above $61K, a pullback toward $59K–$58K remains possible.
My Strategy: I'm cautiously bullish, but I want to see a confirmed breakout above $61K before becoming more confident.
No FOMO. No reckless leverage. Risk management comes first.
The recovery looks promising, but confirmation is everything.
#Bitcoin #BTC #CryptoMarket #bullishreversal #BinanceSquare
$BTC
Bitcoin is showing encouraging signs of recovery after a sharp correction.
BTC has bounced strongly from the $56,000 region and has now climbed back above $60,000. Both the 1H and 4H charts are showing a strong bullish recovery.
📈 Bullish Outlook:
Strong bounce from the $56K support zone.
Price has reclaimed the $60K level.
Next resistance: $61K.
A confirmed breakout above $61K could open the door toward $62K–$63K.
Further upside may follow if buying momentum continues.
⚠️ But Don't Get Too Excited Yet!
The broader market structure is still fragile. BTC is approaching an important resistance area.
If Bitcoin fails to break above $61K, a pullback toward $59K–$58K remains possible.
My Strategy: I'm cautiously bullish, but I want to see a confirmed breakout above $61K before becoming more confident.
No FOMO. No reckless leverage. Risk management comes first.
The recovery looks promising, but confirmation is everything.
#Bitcoin #BTC #CryptoMarket #bullishreversal #BinanceSquare
$BTC
Doglas costa:
may be
1
2
33
🚨 $BTC WILL BTC RECOVER OR CRASH FURTHER? 🚨
📉 Bitcoin is facing serious selling pressure after dropping below $57,000.
The crypto market is experiencing uncertainty, and investors are closely watching Bitcoin's next move.
🔴 BEARISH SCENARIO:
If BTC breaks below the $55,000 support level, further downside toward $53,700 could become possible.
🟢 BULLISH SCENARIO:
If buyers regain control and BTC moves above $58,000–$60,000, a stronger recovery could begin.
📊 WHAT IS AFFECTING BITCOIN?
1️⃣ Rising US Treasury yields.
2️⃣ Federal Reserve interest rate concerns.
3️⃣ Heavy liquidations in leveraged positions.
4️⃣ Weakness in global stock markets.
5️⃣ Investor uncertainty and market fear.
🔥 MY MARKET VIEW:
For now, Bitcoin's short-term trend looks bearish. However, oversold conditions could trigger a temporary recovery.
The next few trading sessions could be very important.
⚠️ Remember: No one can predict the market with 100% certainty. Always manage your risk and do your own research.
👇 WHAT DO YOU THINK?
📉 BTC BELOW $50K?
📈 BTC RECOVERS ABOVE $60K?
Comment your prediction!
{spot}(BTCUSDT)
#BTC #CryptoNews #CryptoMarket #cryptotrading #Binance
🚨 $BTC WILL BTC RECOVER OR CRASH FURTHER? 🚨
📉 Bitcoin is facing serious selling pressure after dropping below $57,000.
The crypto market is experiencing uncertainty, and investors are closely watching Bitcoin's next move.
🔴 BEARISH SCENARIO:
If BTC breaks below the $55,000 support level, further downside toward $53,700 could become possible.
🟢 BULLISH SCENARIO:
If buyers regain control and BTC moves above $58,000–$60,000, a stronger recovery could begin.
📊 WHAT IS AFFECTING BITCOIN?
1️⃣ Rising US Treasury yields.
2️⃣ Federal Reserve interest rate concerns.
3️⃣ Heavy liquidations in leveraged positions.
4️⃣ Weakness in global stock markets.
5️⃣ Investor uncertainty and market fear.
🔥 MY MARKET VIEW:
For now, Bitcoin's short-term trend looks bearish. However, oversold conditions could trigger a temporary recovery.
The next few trading sessions could be very important.
⚠️ Remember: No one can predict the market with 100% certainty. Always manage your risk and do your own research.
👇 WHAT DO YOU THINK?
📉 BTC BELOW $50K?
📈 BTC RECOVERS ABOVE $60K?
Comment your prediction!
#BTC #CryptoNews #CryptoMarket #cryptotrading #Binance
📉 Bitcoin is facing serious selling pressure after dropping below $57,000.
The crypto market is experiencing uncertainty, and investors are closely watching Bitcoin's next move.
🔴 BEARISH SCENARIO:
If BTC breaks below the $55,000 support level, further downside toward $53,700 could become possible.
🟢 BULLISH SCENARIO:
If buyers regain control and BTC moves above $58,000–$60,000, a stronger recovery could begin.
📊 WHAT IS AFFECTING BITCOIN?
1️⃣ Rising US Treasury yields.
2️⃣ Federal Reserve interest rate concerns.
3️⃣ Heavy liquidations in leveraged positions.
4️⃣ Weakness in global stock markets.
5️⃣ Investor uncertainty and market fear.
🔥 MY MARKET VIEW:
For now, Bitcoin's short-term trend looks bearish. However, oversold conditions could trigger a temporary recovery.
The next few trading sessions could be very important.
⚠️ Remember: No one can predict the market with 100% certainty. Always manage your risk and do your own research.
👇 WHAT DO YOU THINK?
📉 BTC BELOW $50K?
📈 BTC RECOVERS ABOVE $60K?
Comment your prediction!
#BTC #CryptoNews #CryptoMarket #cryptotrading #Binance

98

·
--
Bullish
🚨 BTC BOUNCING ABOVE $60K! CAN BUYERS RECLAIM $62K RESISTANCE?
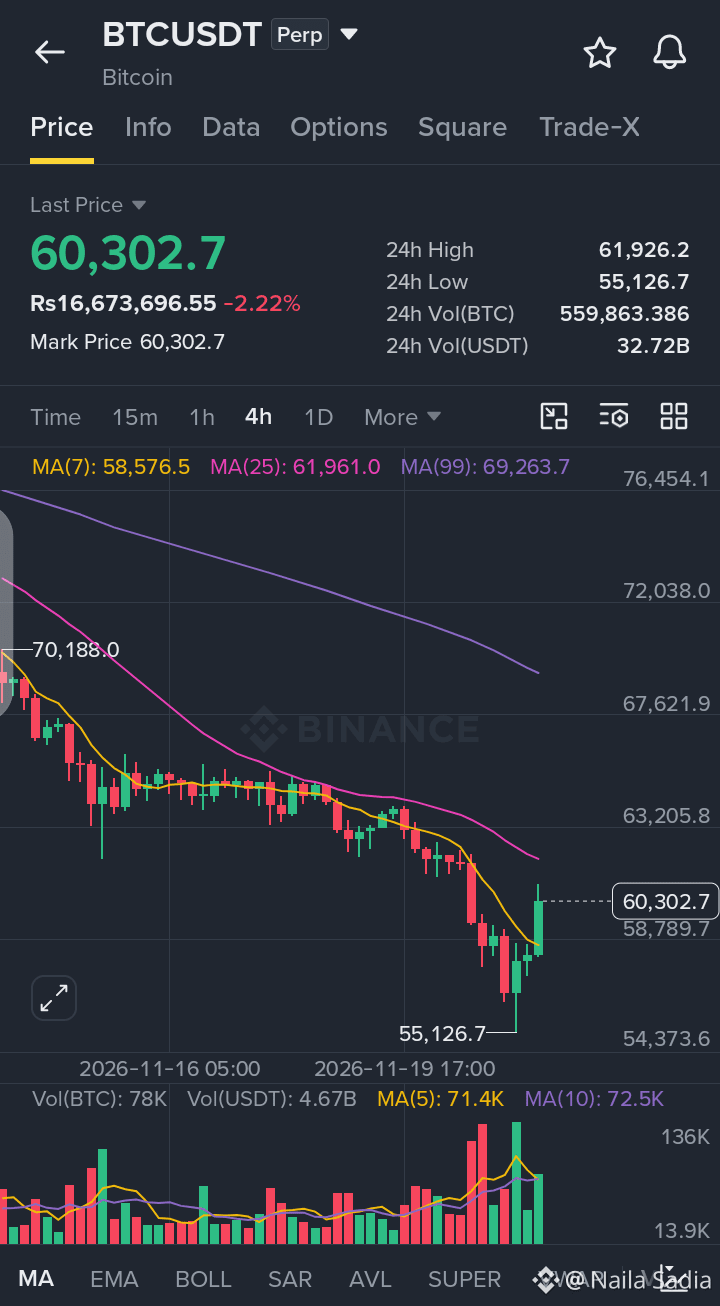
$BTC is trading near $60,302.7, down 2.22%. The 4H chart shows a recovery bounce off the $55,126.7 low, pushing above MA(7) ($58,576.5) while facing overhead resistance near MA(25) ($61,961.0) and MA(99) ($69,263.7).
📉 Market Outlook: Short-term recovery momentum is active above MA(7), though broader 4H structure remains under overhead resistance. A sustained break above $61,926.2–$61,961.0 could extend the bounce higher, while dropping back below $58,576.5 may invite renewed selling pressure toward $55,126.7.
🎯 TRADE PLAN – LONG
Entry: $59,200.00–$60,300.00
TP1: $61,900.00
TP2: $63,500.00
SL: $57,800.00
💬 Will $BTC break above $62K resistance or fade back toward $58.5K?
👇 CLICK HERE FOR TRADE
$BTC
{future}(BTCUSDT)
#BTC #bitcoin #CryptoAnalysis #BinanceSquare
🚨 BTC BOUNCING ABOVE $60K! CAN BUYERS RECLAIM $62K RESISTANCE?
$BTC is trading near $60,302.7, down 2.22%. The 4H chart shows a recovery bounce off the $55,126.7 low, pushing above MA(7) ($58,576.5) while facing overhead resistance near MA(25) ($61,961.0) and MA(99) ($69,263.7).
📉 Market Outlook: Short-term recovery momentum is active above MA(7), though broader 4H structure remains under overhead resistance. A sustained break above $61,926.2–$61,961.0 could extend the bounce higher, while dropping back below $58,576.5 may invite renewed selling pressure toward $55,126.7.
🎯 TRADE PLAN – LONG
Entry: $59,200.00–$60,300.00
TP1: $61,900.00
TP2: $63,500.00
SL: $57,800.00
💬 Will $BTC break above $62K resistance or fade back toward $58.5K?
👇 CLICK HERE FOR TRADE
$BTC
#BTC #bitcoin #CryptoAnalysis #BinanceSquare
$BTC is trading near $60,302.7, down 2.22%. The 4H chart shows a recovery bounce off the $55,126.7 low, pushing above MA(7) ($58,576.5) while facing overhead resistance near MA(25) ($61,961.0) and MA(99) ($69,263.7).
📉 Market Outlook: Short-term recovery momentum is active above MA(7), though broader 4H structure remains under overhead resistance. A sustained break above $61,926.2–$61,961.0 could extend the bounce higher, while dropping back below $58,576.5 may invite renewed selling pressure toward $55,126.7.
🎯 TRADE PLAN – LONG
Entry: $59,200.00–$60,300.00
TP1: $61,900.00
TP2: $63,500.00
SL: $57,800.00
💬 Will $BTC break above $62K resistance or fade back toward $58.5K?
👇 CLICK HERE FOR TRADE
$BTC
#BTC #bitcoin #CryptoAnalysis #BinanceSquare
110

·
--
🐋 WHALES ARE BUYING THE DIP
Abraxas Capital reportedly scooped up 10,356 $BTC — $607M — at an average of $58,651 during Friday's flush, per Lookonchain and TradingBeats monitoring.
That is not a retail-sized bet. A nine-figure dip buy from a major fund, right after BTC tagged the $55K zone and spot ETF outflows hit record levels, tells you where the smart money sees value.
BTC has already bounced back above $60K. But let's be honest: one whale buy does not flip a downtrend. The attribution is onchain monitoring, not a confirmed filing, and ETF outflows plus macro fear are still the dominant flow.
Still, when funds start deploying hundreds of millions into a panic flush, it is a signal worth watching, not ignoring.
🐂 Dip buyers stepping in, or 🐻 dead-cat bounce?
📌 Sharing personal opinions only, not financial advice or a recommendation to buy/sell. Crypto is highly risky; DYOR and you are solely responsible. No coin promotion.
#Bitcoin #BTC #Whale #Crypto #Binance
🐋 WHALES ARE BUYING THE DIP
Abraxas Capital reportedly scooped up 10,356 $BTC — $607M — at an average of $58,651 during Friday's flush, per Lookonchain and TradingBeats monitoring.
That is not a retail-sized bet. A nine-figure dip buy from a major fund, right after BTC tagged the $55K zone and spot ETF outflows hit record levels, tells you where the smart money sees value.
BTC has already bounced back above $60K. But let's be honest: one whale buy does not flip a downtrend. The attribution is onchain monitoring, not a confirmed filing, and ETF outflows plus macro fear are still the dominant flow.
Still, when funds start deploying hundreds of millions into a panic flush, it is a signal worth watching, not ignoring.
🐂 Dip buyers stepping in, or 🐻 dead-cat bounce?
📌 Sharing personal opinions only, not financial advice or a recommendation to buy/sell. Crypto is highly risky; DYOR and you are solely responsible. No coin promotion.
#Bitcoin #BTC #Whale #Crypto #Binance
Abraxas Capital reportedly scooped up 10,356 $BTC — $607M — at an average of $58,651 during Friday's flush, per Lookonchain and TradingBeats monitoring.
That is not a retail-sized bet. A nine-figure dip buy from a major fund, right after BTC tagged the $55K zone and spot ETF outflows hit record levels, tells you where the smart money sees value.
BTC has already bounced back above $60K. But let's be honest: one whale buy does not flip a downtrend. The attribution is onchain monitoring, not a confirmed filing, and ETF outflows plus macro fear are still the dominant flow.
Still, when funds start deploying hundreds of millions into a panic flush, it is a signal worth watching, not ignoring.
🐂 Dip buyers stepping in, or 🐻 dead-cat bounce?
📌 Sharing personal opinions only, not financial advice or a recommendation to buy/sell. Crypto is highly risky; DYOR and you are solely responsible. No coin promotion.
#Bitcoin #BTC #Whale #Crypto #Binance
3
738

·
--
Bearish
Bitcoin Price Analysis!!!
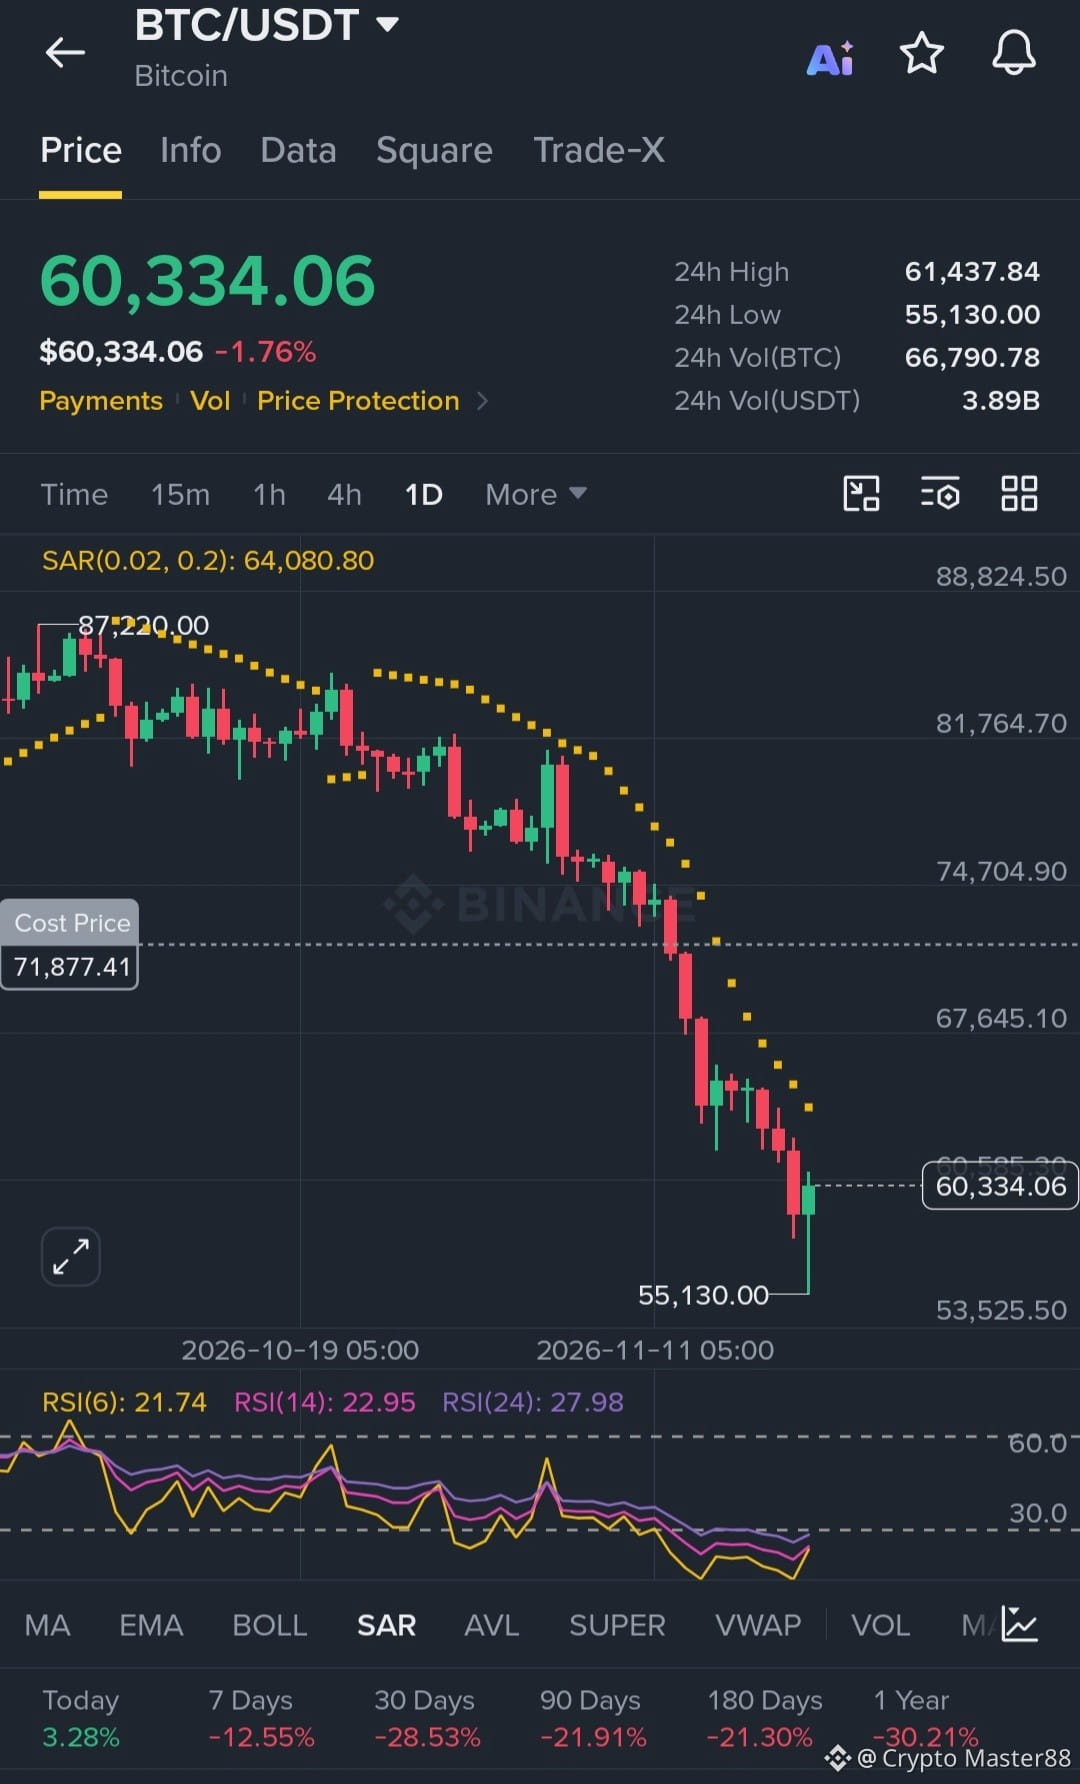
Bitcoin has just experienced a brutal flash crash, nosediving to a low of 55,130 before bouncing back to 60,334. The daily chart shows extreme panic, but also a massive opportunity. The RSI(6) has plummeted to 21.74, and RSI(14) is at 22.95, which is deep in the oversold zone. The Parabolic SAR is still high above at 64,080, confirming the heavy downtrend. However, the long lower wick at 55,130 shows that buyers are aggressively stepping in. Historically, when RSI drops this low and a long wick forms, a violent short squeeze bounce is usually right around the corner.
Here is the critical news driving this chaos. The entire market is in extreme fear, with the Fear and Greed Index at just 12. US spot Bitcoin ETFs have seen massive outflows, with over 3.47 billion withdrawn in November alone, and BlackRock's IBIT recording its largest single-day outflow of 541 million. On top of that, the Fed's hawkish stance on rate hikes is adding pressure. However, the sharp drop triggered a massive liquidation cascade of nearly 700 million, which often marks a local bottom as leveraged positions are flushed out.
Here is your exact trading plan for this volatile setup:
🟢 BUY ZONE: Wait for a retest of the 58,000 to 59,000 support area. If a strong green rejection candle forms on the 15-minute chart, go long with targets at 63,000 and 65,000. Keep a tight stop-loss below 56,500.
🔴 SELL ZONE: If BTC pumps up to the 63,500 to 64,000 resistance zone and gets rejected with a red candle, you can short with targets at 61,000 and 59,000. Stop-loss should be above 65,500.
The market is in extreme panic mode, so never use high leverage and always protect your capital first! 🛡️
#BTC #Signal🚥. #signaladvisor $BTC
{future}(BTCUSDT)
Bitcoin Price Analysis!!!
Bitcoin has just experienced a brutal flash crash, nosediving to a low of 55,130 before bouncing back to 60,334. The daily chart shows extreme panic, but also a massive opportunity. The RSI(6) has plummeted to 21.74, and RSI(14) is at 22.95, which is deep in the oversold zone. The Parabolic SAR is still high above at 64,080, confirming the heavy downtrend. However, the long lower wick at 55,130 shows that buyers are aggressively stepping in. Historically, when RSI drops this low and a long wick forms, a violent short squeeze bounce is usually right around the corner.
Here is the critical news driving this chaos. The entire market is in extreme fear, with the Fear and Greed Index at just 12. US spot Bitcoin ETFs have seen massive outflows, with over 3.47 billion withdrawn in November alone, and BlackRock's IBIT recording its largest single-day outflow of 541 million. On top of that, the Fed's hawkish stance on rate hikes is adding pressure. However, the sharp drop triggered a massive liquidation cascade of nearly 700 million, which often marks a local bottom as leveraged positions are flushed out.
Here is your exact trading plan for this volatile setup:
🟢 BUY ZONE: Wait for a retest of the 58,000 to 59,000 support area. If a strong green rejection candle forms on the 15-minute chart, go long with targets at 63,000 and 65,000. Keep a tight stop-loss below 56,500.
🔴 SELL ZONE: If BTC pumps up to the 63,500 to 64,000 resistance zone and gets rejected with a red candle, you can short with targets at 61,000 and 59,000. Stop-loss should be above 65,500.
The market is in extreme panic mode, so never use high leverage and always protect your capital first! 🛡️
#BTC #Signal🚥. #signaladvisor $BTC
Bitcoin has just experienced a brutal flash crash, nosediving to a low of 55,130 before bouncing back to 60,334. The daily chart shows extreme panic, but also a massive opportunity. The RSI(6) has plummeted to 21.74, and RSI(14) is at 22.95, which is deep in the oversold zone. The Parabolic SAR is still high above at 64,080, confirming the heavy downtrend. However, the long lower wick at 55,130 shows that buyers are aggressively stepping in. Historically, when RSI drops this low and a long wick forms, a violent short squeeze bounce is usually right around the corner.
Here is the critical news driving this chaos. The entire market is in extreme fear, with the Fear and Greed Index at just 12. US spot Bitcoin ETFs have seen massive outflows, with over 3.47 billion withdrawn in November alone, and BlackRock's IBIT recording its largest single-day outflow of 541 million. On top of that, the Fed's hawkish stance on rate hikes is adding pressure. However, the sharp drop triggered a massive liquidation cascade of nearly 700 million, which often marks a local bottom as leveraged positions are flushed out.
Here is your exact trading plan for this volatile setup:
🟢 BUY ZONE: Wait for a retest of the 58,000 to 59,000 support area. If a strong green rejection candle forms on the 15-minute chart, go long with targets at 63,000 and 65,000. Keep a tight stop-loss below 56,500.
🔴 SELL ZONE: If BTC pumps up to the 63,500 to 64,000 resistance zone and gets rejected with a red candle, you can short with targets at 61,000 and 59,000. Stop-loss should be above 65,500.
The market is in extreme panic mode, so never use high leverage and always protect your capital first! 🛡️
#BTC #Signal🚥. #signaladvisor $BTC
216

·
--
Bullish
🚀 BITCOIN (BTC) – Bullish Momentum Is Back! 🟢
📊 Price Movement:
Previous Price: $5,513,000
Current Price: $6,037,664
Price Increase: +$524,664
Growth: +9.52% 🔥
Watch the trend. Respect the risk. Trade with a strategy. 📈
What's your next BTC target? 👇
#Bitcoin #BTC #CryptoMarket #BullishMomentum #Binance
🚀 BITCOIN (BTC) – Bullish Momentum Is Back! 🟢
📊 Price Movement:
Previous Price: $5,513,000
Current Price: $6,037,664
Price Increase: +$524,664
Growth: +9.52% 🔥
Watch the trend. Respect the risk. Trade with a strategy. 📈
What's your next BTC target? 👇
#Bitcoin #BTC #CryptoMarket #BullishMomentum #Binance
📊 Price Movement:
Previous Price: $5,513,000
Current Price: $6,037,664
Price Increase: +$524,664
Growth: +9.52% 🔥
Watch the trend. Respect the risk. Trade with a strategy. 📈
What's your next BTC target? 👇
#Bitcoin #BTC #CryptoMarket #BullishMomentum #Binance

1
154

BTC IS BACK ABOVE $60,000! GOLD HOLDING $3,538! Did The BOTTOM Just Happen?
LIVE Today - 22 Nov:
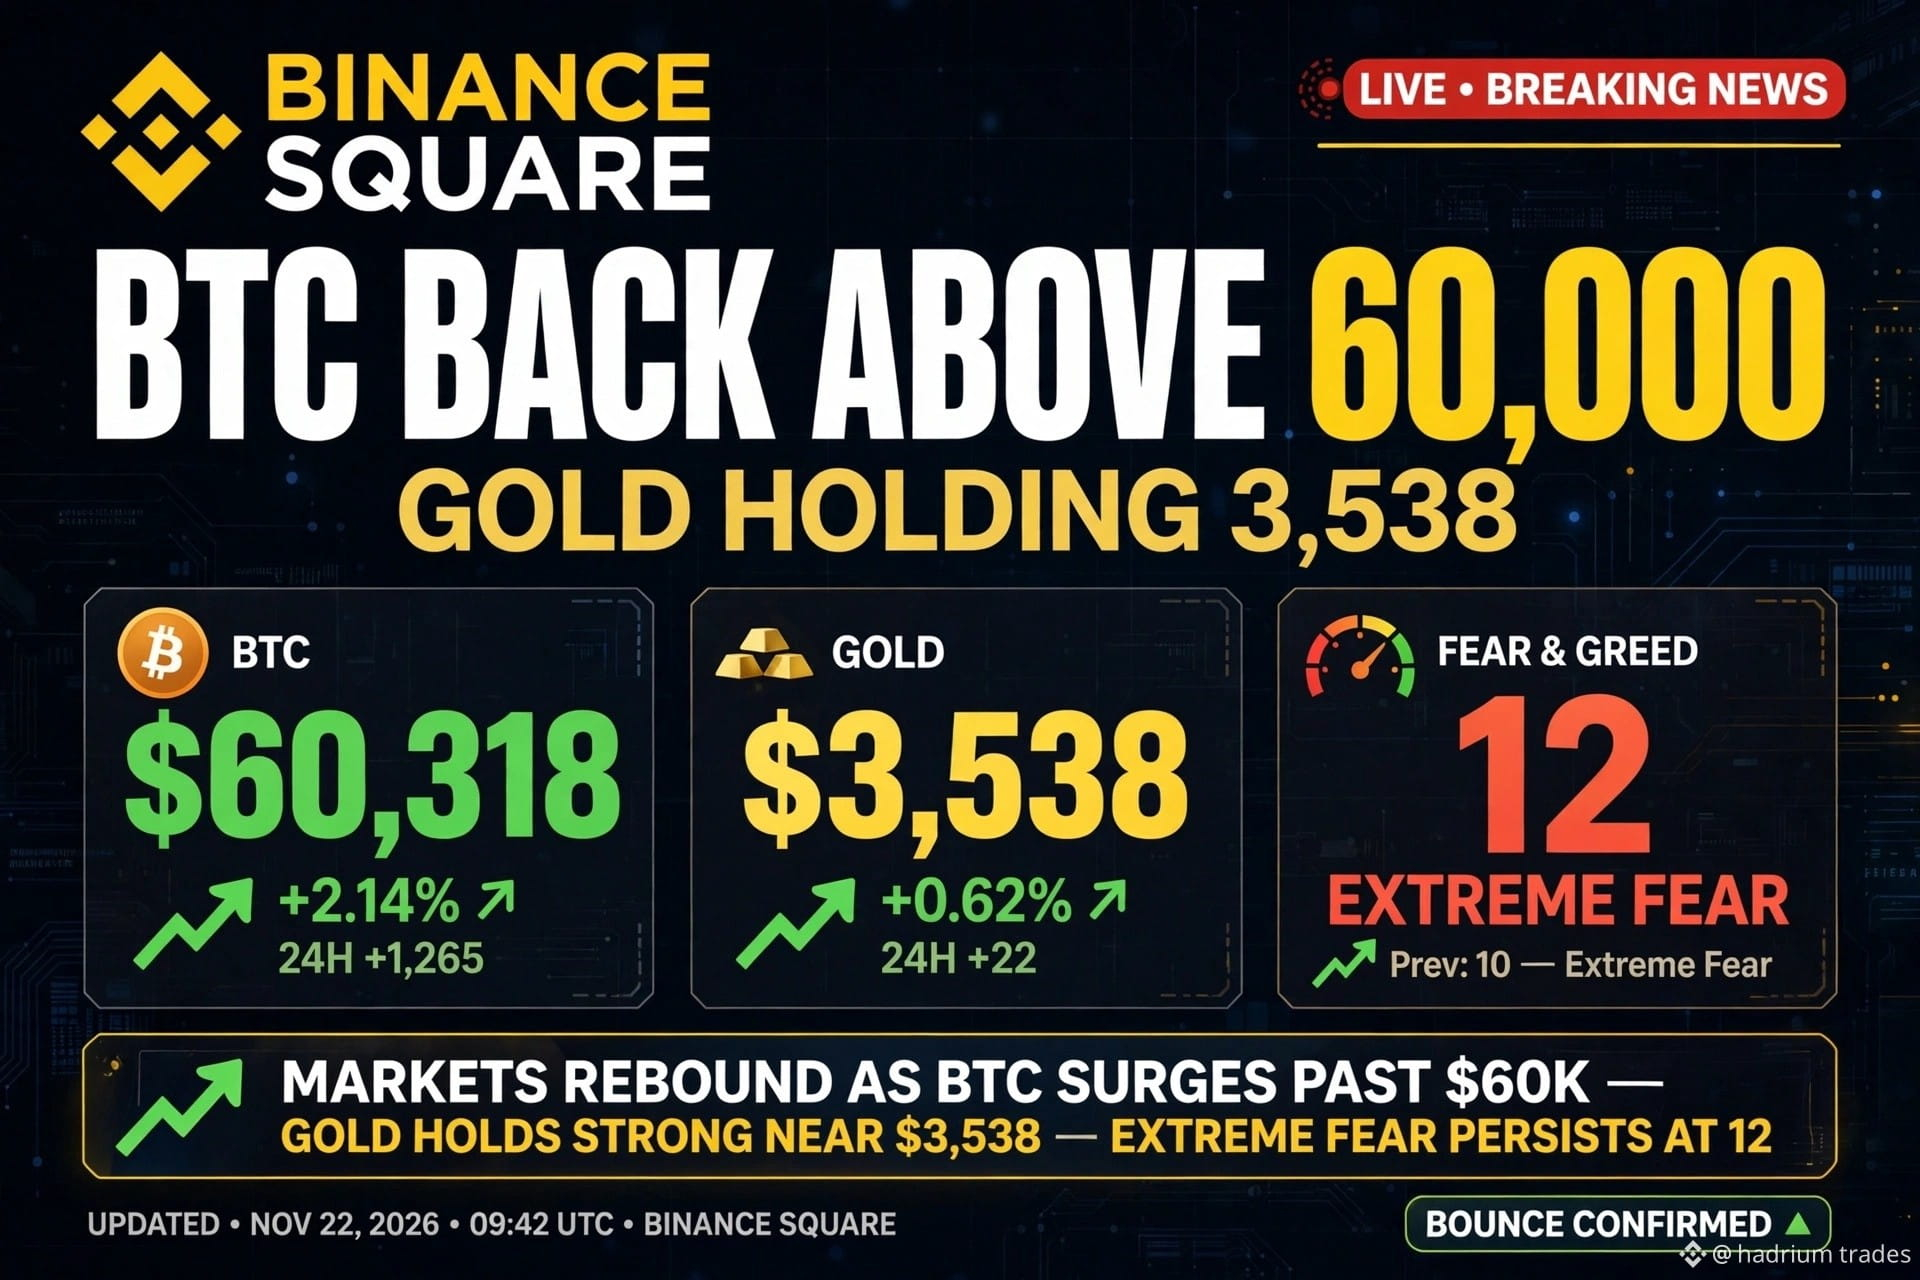
BTC: $60,318 - BACK ABOVE $60K! +2.87% Today! Bounced From $55,130 Low!
GOLD: $3,538 - Holding Above $3,502 Low! Worst Week Since March is OVER?
FEAR: 12 - EXTREME FEAR! Bearish talk is everywhere!
My Last Post Got 650 Views! Thank You! This Is PART 13!
Yesterday Everyone Was Panicking:
BTC fell to $55,130 - Lowest since 2024!
GOLD fell to $3,502 - 14-month low!
Fear hit 6-12 - Lowest since February!
Everyone said "Sell! Sell! Sell!"
Today Market Said NO!
BTC bounced $55,130 -> $60,318 = +$5,188 BOUNCE! +9.4%!
GOLD held $3,502 -> $3,538 = Holding!
BTC is now up +2.14% to $60,192! Back above $60K for first time since Friday!
Why Did It Bounce?
1. Capitulation Done - Everyone who had to sell, sold!
2. Buyers Came At $55K - Smart money bought the fear!
3. Short Covering - Shorts had to buy back!
Is This REAL Bounce Or FAKE Bounce?
If BTC holds $60,000: Next $62,000 -> $65,000!
If BTC falls below $60,000 again: Next $57,000 -> $55,000!
GOLD: If holds $3,500: Next $3,600 -> $3,700! If breaks $3,500: Next $3,400!
My Plan As GOLD Trader:
I am NOT chasing. I am waiting for BOS.
No BOS, No Trade. 1% Risk Only.
My P&L is zero. I share learning, not fake profit.
If you want Part 14 - Dec 9 Fed War - follow me now. Otherwise you will miss the real move!
Do you think BOTTOM is IN or This Is A TRAP?
Comment BOTTOM or TRAP + Your Country 👇
I don't ask for follow. I earn it with truth.
NFA. Educational Only.
#BTC #Bitcoin #GOLD #XAUUSD #Fear #Crypto #GoldCrash #Bottom #bounce
BTC IS BACK ABOVE $60,000! GOLD HOLDING $3,538! Did The BOTTOM Just Happen?
LIVE Today - 22 Nov:
BTC: $60,318 - BACK ABOVE $60K! +2.87% Today! Bounced From $55,130 Low!
GOLD: $3,538 - Holding Above $3,502 Low! Worst Week Since March is OVER?
FEAR: 12 - EXTREME FEAR! Bearish talk is everywhere!
My Last Post Got 650 Views! Thank You! This Is PART 13!
Yesterday Everyone Was Panicking:
BTC fell to $55,130 - Lowest since 2024!
GOLD fell to $3,502 - 14-month low!
Fear hit 6-12 - Lowest since February!
Everyone said "Sell! Sell! Sell!"
Today Market Said NO!
BTC bounced $55,130 -> $60,318 = +$5,188 BOUNCE! +9.4%!
GOLD held $3,502 -> $3,538 = Holding!
BTC is now up +2.14% to $60,192! Back above $60K for first time since Friday!
Why Did It Bounce?
1. Capitulation Done - Everyone who had to sell, sold!
2. Buyers Came At $55K - Smart money bought the fear!
3. Short Covering - Shorts had to buy back!
Is This REAL Bounce Or FAKE Bounce?
If BTC holds $60,000: Next $62,000 -> $65,000!
If BTC falls below $60,000 again: Next $57,000 -> $55,000!
GOLD: If holds $3,500: Next $3,600 -> $3,700! If breaks $3,500: Next $3,400!
My Plan As GOLD Trader:
I am NOT chasing. I am waiting for BOS.
No BOS, No Trade. 1% Risk Only.
My P&L is zero. I share learning, not fake profit.
If you want Part 14 - Dec 9 Fed War - follow me now. Otherwise you will miss the real move!
Do you think BOTTOM is IN or This Is A TRAP?
Comment BOTTOM or TRAP + Your Country 👇
I don't ask for follow. I earn it with truth.
NFA. Educational Only.
#BTC #Bitcoin #GOLD #XAUUSD #Fear #Crypto #GoldCrash #Bottom #bounce
LIVE Today - 22 Nov:
BTC: $60,318 - BACK ABOVE $60K! +2.87% Today! Bounced From $55,130 Low!
GOLD: $3,538 - Holding Above $3,502 Low! Worst Week Since March is OVER?
FEAR: 12 - EXTREME FEAR! Bearish talk is everywhere!
My Last Post Got 650 Views! Thank You! This Is PART 13!
Yesterday Everyone Was Panicking:
BTC fell to $55,130 - Lowest since 2024!
GOLD fell to $3,502 - 14-month low!
Fear hit 6-12 - Lowest since February!
Everyone said "Sell! Sell! Sell!"
Today Market Said NO!
BTC bounced $55,130 -> $60,318 = +$5,188 BOUNCE! +9.4%!
GOLD held $3,502 -> $3,538 = Holding!
BTC is now up +2.14% to $60,192! Back above $60K for first time since Friday!
Why Did It Bounce?
1. Capitulation Done - Everyone who had to sell, sold!
2. Buyers Came At $55K - Smart money bought the fear!
3. Short Covering - Shorts had to buy back!
Is This REAL Bounce Or FAKE Bounce?
If BTC holds $60,000: Next $62,000 -> $65,000!
If BTC falls below $60,000 again: Next $57,000 -> $55,000!
GOLD: If holds $3,500: Next $3,600 -> $3,700! If breaks $3,500: Next $3,400!
My Plan As GOLD Trader:
I am NOT chasing. I am waiting for BOS.
No BOS, No Trade. 1% Risk Only.
My P&L is zero. I share learning, not fake profit.
If you want Part 14 - Dec 9 Fed War - follow me now. Otherwise you will miss the real move!
Do you think BOTTOM is IN or This Is A TRAP?
Comment BOTTOM or TRAP + Your Country 👇
I don't ask for follow. I earn it with truth.
NFA. Educational Only.
#BTC #Bitcoin #GOLD #XAUUSD #Fear #Crypto #GoldCrash #Bottom #bounce
197

₿ BITCOIN (BTC): What's the Next Move? Bulls vs Bears 🔥
Bitcoin is facing a critical moment. After a sharp sell-off, BTC has dropped below the $60,000 psychological level and is now showing signs of extreme market weakness.
But is this the beginning of another major downside move, or could we see a strong relief rally?
Let's break down the key levels. 👇
📉 BEARISH SCENARIO
The overall trend remains bearish across major timeframes.
Key support levels to watch:
- $58,100
- $56,400
- $54,700
A decisive daily close below $58,100 could open the door for another move toward $56,400 and potentially lower.
📈 BULLISH SCENARIO
Bitcoin needs to reclaim important resistance levels before bulls can regain control.
Key resistance levels:
- $60,850
- $62,270
- $65,000
A strong daily close above $60,850 could be the first sign of recovery. A breakout above $62,270 would strengthen the bullish case.
🎯 MY EXPECTATION:
I am watching the $58,000 support zone very closely.
If buyers defend this area, BTC could experience a short-term relief rally.
However, if support breaks, another downside move cannot be ruled out.
One thing is clear: catching the bottom is not a strategy. Waiting for confirmation is more important than predicting the exact reversal.
What do you think?
Will BTC recover above $65K, or are we heading toward $55K next?
#Bitcoin #BTC #cryptomarket #BinanceSquare #CryptoAnalysis
₿ BITCOIN (BTC): What's the Next Move? Bulls vs Bears 🔥
Bitcoin is facing a critical moment. After a sharp sell-off, BTC has dropped below the $60,000 psychological level and is now showing signs of extreme market weakness.
But is this the beginning of another major downside move, or could we see a strong relief rally?
Let's break down the key levels. 👇
📉 BEARISH SCENARIO
The overall trend remains bearish across major timeframes.
Key support levels to watch:
- $58,100
- $56,400
- $54,700
A decisive daily close below $58,100 could open the door for another move toward $56,400 and potentially lower.
📈 BULLISH SCENARIO
Bitcoin needs to reclaim important resistance levels before bulls can regain control.
Key resistance levels:
- $60,850
- $62,270
- $65,000
A strong daily close above $60,850 could be the first sign of recovery. A breakout above $62,270 would strengthen the bullish case.
🎯 MY EXPECTATION:
I am watching the $58,000 support zone very closely.
If buyers defend this area, BTC could experience a short-term relief rally.
However, if support breaks, another downside move cannot be ruled out.
One thing is clear: catching the bottom is not a strategy. Waiting for confirmation is more important than predicting the exact reversal.
What do you think?
Will BTC recover above $65K, or are we heading toward $55K next?
#Bitcoin #BTC #cryptomarket #BinanceSquare #CryptoAnalysis
Bitcoin is facing a critical moment. After a sharp sell-off, BTC has dropped below the $60,000 psychological level and is now showing signs of extreme market weakness.
But is this the beginning of another major downside move, or could we see a strong relief rally?
Let's break down the key levels. 👇
📉 BEARISH SCENARIO
The overall trend remains bearish across major timeframes.
Key support levels to watch:
- $58,100
- $56,400
- $54,700
A decisive daily close below $58,100 could open the door for another move toward $56,400 and potentially lower.
📈 BULLISH SCENARIO
Bitcoin needs to reclaim important resistance levels before bulls can regain control.
Key resistance levels:
- $60,850
- $62,270
- $65,000
A strong daily close above $60,850 could be the first sign of recovery. A breakout above $62,270 would strengthen the bullish case.
🎯 MY EXPECTATION:
I am watching the $58,000 support zone very closely.
If buyers defend this area, BTC could experience a short-term relief rally.
However, if support breaks, another downside move cannot be ruled out.
One thing is clear: catching the bottom is not a strategy. Waiting for confirmation is more important than predicting the exact reversal.
What do you think?
Will BTC recover above $65K, or are we heading toward $55K next?
#Bitcoin #BTC #cryptomarket #BinanceSquare #CryptoAnalysis

HUSSIN AL EAFAE:
70k
629
2
36
629

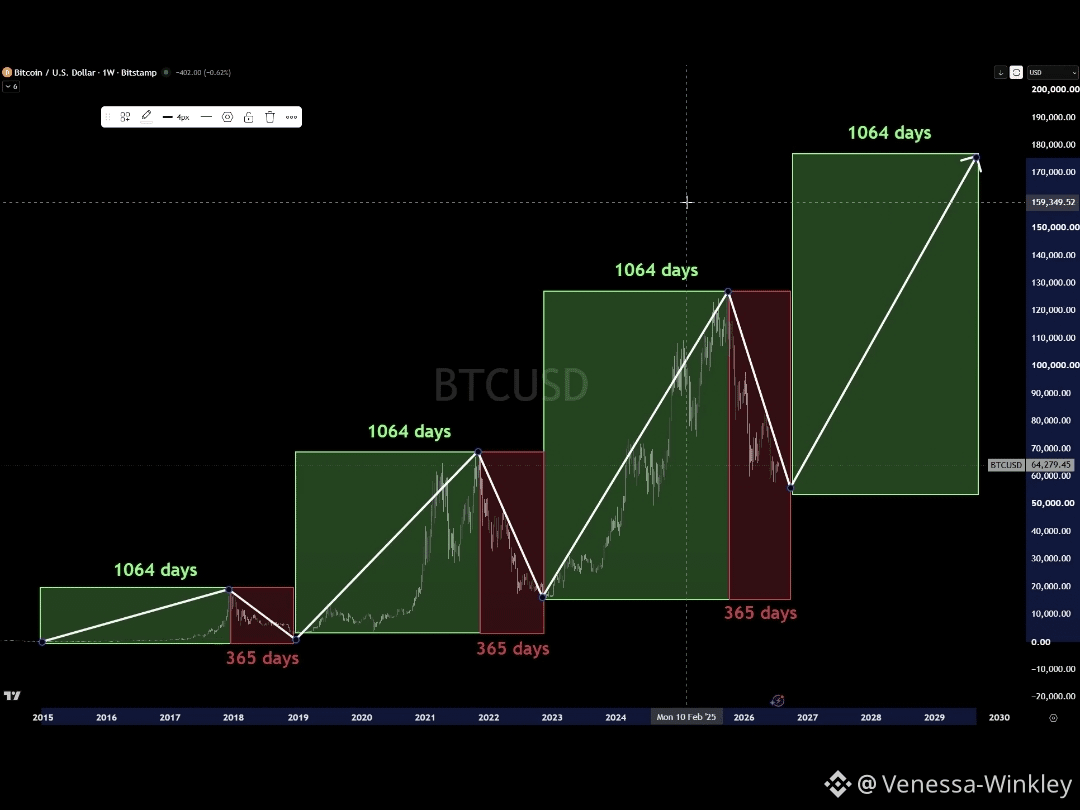
$BTC has followed almost the SAME pattern for over a decade. But there's a catch. 👀
You've probably seen that chart claiming BTC always goes up for 1,064 days and then crashes for exactly 365 days.
Sounds a little too perfect, right? So I looked into the actual numbers.
Here's what I found:
📈 2015–2017: 1,067 days of growth.
📈 2018–2021: 1,059 days of growth.
📈 2022–2025: 1,050 days of growth.
That's actually pretty crazy when you think about it. Three separate bull runs, all lasting roughly the same amount of time.
And the bear markets?
📉 2017–2018: Around 364 days.
📉 2021–2022: Around 378 days.
So yes, there's definitely a historical pattern here. But saying Bitcoin follows an EXACT 1,064-day clock is stretching the truth.
Here's where things get even more interesting.
BTC peaked around $126K in October 2025, and we've already seen a major correction since then. The lowest point so far came in June 2026, just 267 days after the peak.
If that turns out to be the actual bottom, this cycle would be noticeably shorter on the bearish side.
Personally, I think the four-year cycle is still worth watching. But markets don't run on a stopwatch, and three similar cycles aren't enough to guarantee a fourth.
The real question is, are we seeing the same cycle play out again, or is Bitcoin finally starting to behave differently?
What do you guys think? 🤔
$BTC
{future}(BTCUSDT)
#bitcoin #crypto #BTC
$BTC has followed almost the SAME pattern for over a decade. But there's a catch. 👀
You've probably seen that chart claiming BTC always goes up for 1,064 days and then crashes for exactly 365 days.
Sounds a little too perfect, right? So I looked into the actual numbers.
Here's what I found:
📈 2015–2017: 1,067 days of growth.
📈 2018–2021: 1,059 days of growth.
📈 2022–2025: 1,050 days of growth.
That's actually pretty crazy when you think about it. Three separate bull runs, all lasting roughly the same amount of time.
And the bear markets?
📉 2017–2018: Around 364 days.
📉 2021–2022: Around 378 days.
So yes, there's definitely a historical pattern here. But saying Bitcoin follows an EXACT 1,064-day clock is stretching the truth.
Here's where things get even more interesting.
BTC peaked around $126K in October 2025, and we've already seen a major correction since then. The lowest point so far came in June 2026, just 267 days after the peak.
If that turns out to be the actual bottom, this cycle would be noticeably shorter on the bearish side.
Personally, I think the four-year cycle is still worth watching. But markets don't run on a stopwatch, and three similar cycles aren't enough to guarantee a fourth.
The real question is, are we seeing the same cycle play out again, or is Bitcoin finally starting to behave differently?
What do you guys think? 🤔
$BTC
#bitcoin #crypto #BTC
You've probably seen that chart claiming BTC always goes up for 1,064 days and then crashes for exactly 365 days.
Sounds a little too perfect, right? So I looked into the actual numbers.
Here's what I found:
📈 2015–2017: 1,067 days of growth.
📈 2018–2021: 1,059 days of growth.
📈 2022–2025: 1,050 days of growth.
That's actually pretty crazy when you think about it. Three separate bull runs, all lasting roughly the same amount of time.
And the bear markets?
📉 2017–2018: Around 364 days.
📉 2021–2022: Around 378 days.
So yes, there's definitely a historical pattern here. But saying Bitcoin follows an EXACT 1,064-day clock is stretching the truth.
Here's where things get even more interesting.
BTC peaked around $126K in October 2025, and we've already seen a major correction since then. The lowest point so far came in June 2026, just 267 days after the peak.
If that turns out to be the actual bottom, this cycle would be noticeably shorter on the bearish side.
Personally, I think the four-year cycle is still worth watching. But markets don't run on a stopwatch, and three similar cycles aren't enough to guarantee a fourth.
The real question is, are we seeing the same cycle play out again, or is Bitcoin finally starting to behave differently?
What do you guys think? 🤔
$BTC
#bitcoin #crypto #BTC
41

·
--
🚨 BITCOIN JUST WIPED OUT $2.4 BILLION IN TRADER POSITIONS!
The market is sending a brutal warning, and leveraged bulls are paying the price.
Here's what just happened:
🔴 $BTC crashed below $57,000, hitting its lowest level since September 2024.
💥 $2.40 BILLION in crypto futures positions liquidated within 24 hours.
📉 Bitcoin futures liquidations exceeded $1 BILLION.
⚠️ ETH traders also suffered approximately $545 MILLION in liquidations.
📊 BTC has recovered toward $59,300, but the bigger picture remains bearish.
What's driving this crash?
• Rising US Treasury yields.
• Growing expectations of Fed rate hikes.
• Weakness across global risk assets.
• Excessive leverage and aggressive bullish positioning.
THE BIG QUESTION NOW:
Is this a temporary liquidity flush before a major recovery, or are we witnessing another leg down in Bitcoin's bear market?
One thing is certain: Trading with excessive leverage in this market can be extremely dangerous.
{spot}(BTCUSDT)
#BTC #CryptoMarketMoves
🚨 BITCOIN JUST WIPED OUT $2.4 BILLION IN TRADER POSITIONS!
The market is sending a brutal warning, and leveraged bulls are paying the price.
Here's what just happened:
🔴 $BTC crashed below $57,000, hitting its lowest level since September 2024.
💥 $2.40 BILLION in crypto futures positions liquidated within 24 hours.
📉 Bitcoin futures liquidations exceeded $1 BILLION.
⚠️ ETH traders also suffered approximately $545 MILLION in liquidations.
📊 BTC has recovered toward $59,300, but the bigger picture remains bearish.
What's driving this crash?
• Rising US Treasury yields.
• Growing expectations of Fed rate hikes.
• Weakness across global risk assets.
• Excessive leverage and aggressive bullish positioning.
THE BIG QUESTION NOW:
Is this a temporary liquidity flush before a major recovery, or are we witnessing another leg down in Bitcoin's bear market?
One thing is certain: Trading with excessive leverage in this market can be extremely dangerous.
#BTC #CryptoMarketMoves
The market is sending a brutal warning, and leveraged bulls are paying the price.
Here's what just happened:
🔴 $BTC crashed below $57,000, hitting its lowest level since September 2024.
💥 $2.40 BILLION in crypto futures positions liquidated within 24 hours.
📉 Bitcoin futures liquidations exceeded $1 BILLION.
⚠️ ETH traders also suffered approximately $545 MILLION in liquidations.
📊 BTC has recovered toward $59,300, but the bigger picture remains bearish.
What's driving this crash?
• Rising US Treasury yields.
• Growing expectations of Fed rate hikes.
• Weakness across global risk assets.
• Excessive leverage and aggressive bullish positioning.
THE BIG QUESTION NOW:
Is this a temporary liquidity flush before a major recovery, or are we witnessing another leg down in Bitcoin's bear market?
One thing is certain: Trading with excessive leverage in this market can be extremely dangerous.
#BTC #CryptoMarketMoves

77

·
--
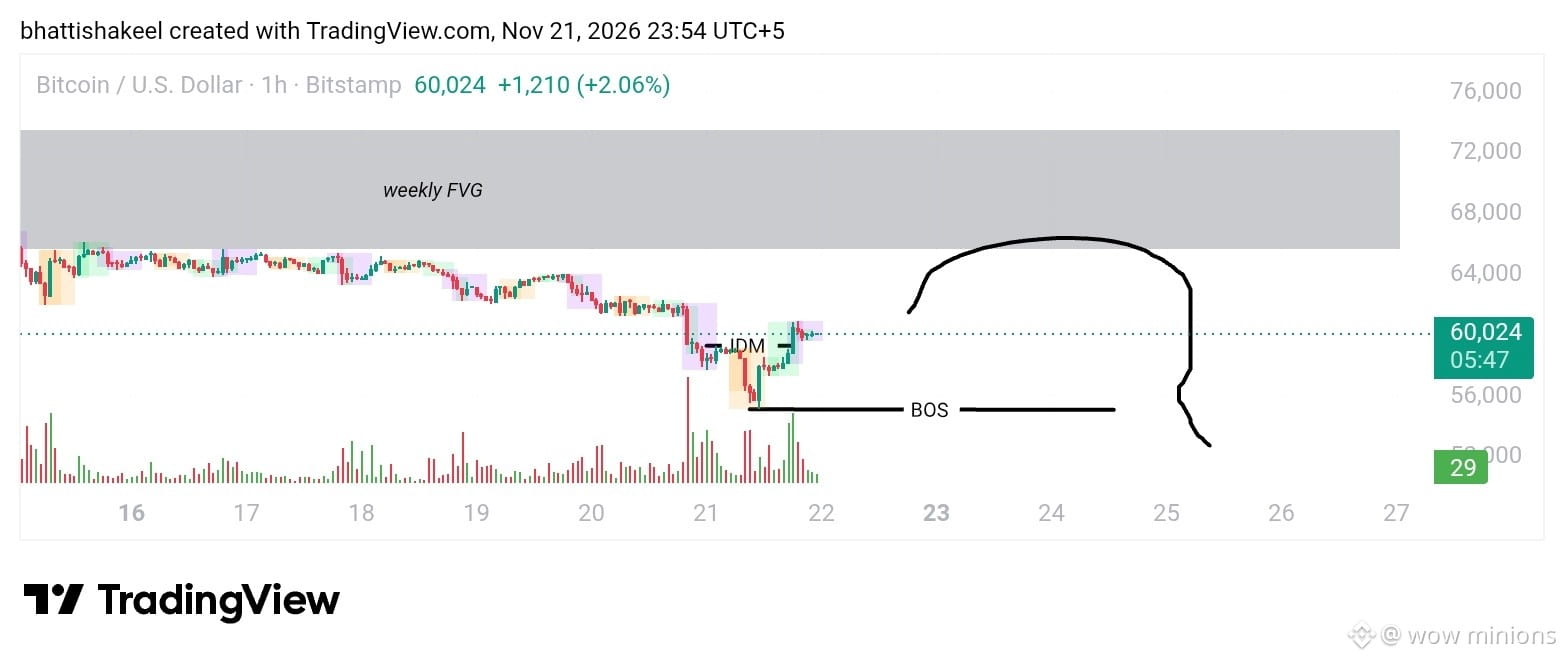
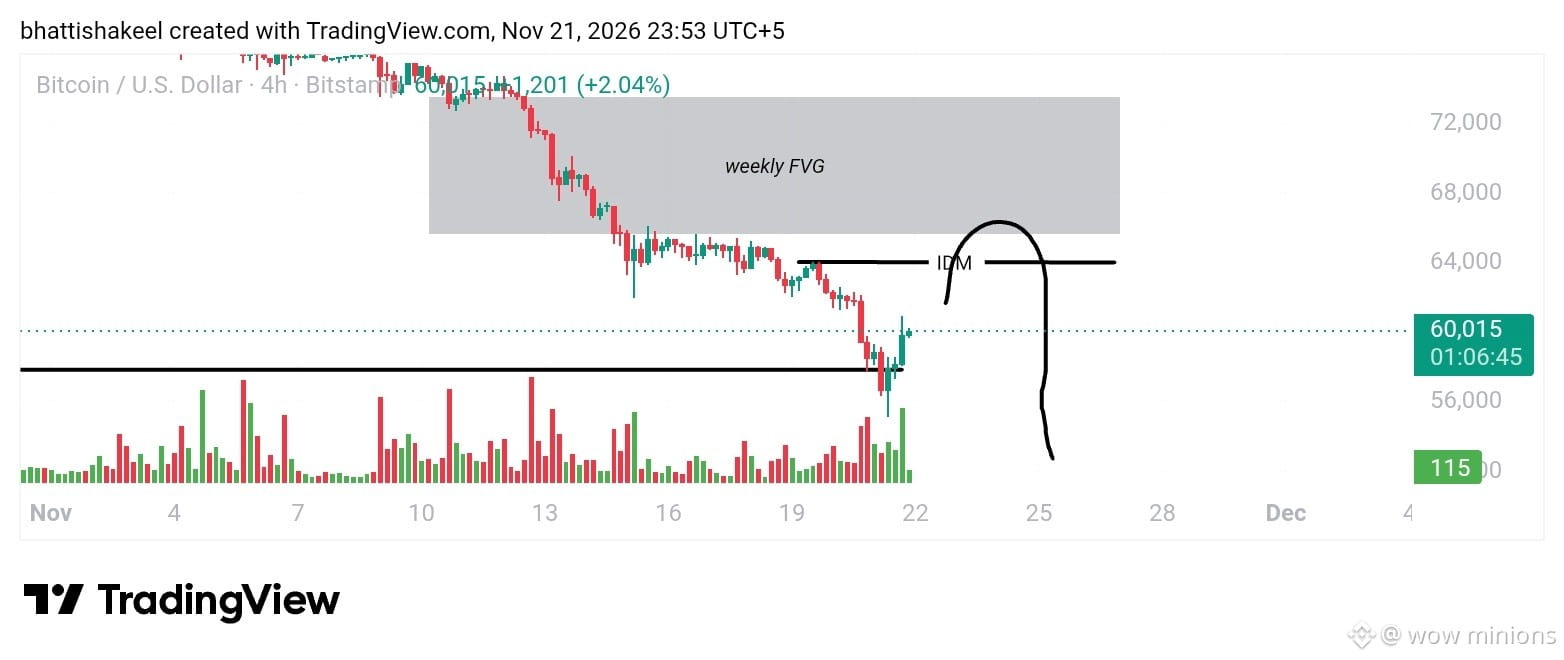
🚨 𝐁𝐓𝐂 (~𝟔𝟎,𝟎𝟐𝟎): 𝐋𝐈𝐐𝐔𝐈𝐃𝐈𝐓𝐘 𝐆𝐑𝐀𝐁 𝐎𝐑 𝐍𝐄𝐗𝐓 𝐃𝐑𝐎𝐏? ❓
Price is holding around 60K on 4H & 1H with IDM and a Weekly FVG overhead after the recent BOS move. 🔥
Do you see BTC pushing into the FVG/IDM zone first, or rejecting right here? 👇
$BTC
{spot}(BTCUSDT)
#BTC #CryptoMarketTrends #BinanceSquare
🚨 𝐁𝐓𝐂 (~𝟔𝟎,𝟎𝟐𝟎): 𝐋𝐈𝐐𝐔𝐈𝐃𝐈𝐓𝐘 𝐆𝐑𝐀𝐁 𝐎𝐑 𝐍𝐄𝐗𝐓 𝐃𝐑𝐎𝐏? ❓
Price is holding around 60K on 4H & 1H with IDM and a Weekly FVG overhead after the recent BOS move. 🔥
Do you see BTC pushing into the FVG/IDM zone first, or rejecting right here? 👇
$BTC
#BTC #CryptoMarketTrends #BinanceSquare
Price is holding around 60K on 4H & 1H with IDM and a Weekly FVG overhead after the recent BOS move. 🔥
Do you see BTC pushing into the FVG/IDM zone first, or rejecting right here? 👇
$BTC
#BTC #CryptoMarketTrends #BinanceSquare
1
1
224
Log in to explore more content
Join global crypto users on Binance Square
⚡️ Get latest and useful information about crypto.
💬 Trusted by the world’s largest crypto exchange.
👍 Discover real insights from verified creators.
Email / Phone number
Trending Topics
1
#NvidiaLoses$2.7TrillionInMonthAndAHalf
16,477 views
113 Discussing
2
#CanBTCReboundAfterFallingBelow60K?
732,977 views
2,924 Discussing
3
#GlobalStocksFaceLongestLosingStreakSince2023
265,205 views
1,960 Discussing
4
#BlackRockIBITPostsRecord$541MSingleDayOutflow
30,570 views
88 Discussing
5
#AnthropicPlungesTowardIPOPriceonDay2
134,831 views
1,189 Discussing
6
#TwentyOneCapitalAdds172.25BTC
61,462 views
647 Discussing
7
#HKBillWouldExcludeTokenizedDepositsFromVirtualAssets
7,591 views
50 Discussing
8
#BNBDropsBelow540USDTWith8.46%DailyDecline
74,156 views
636 Discussing
9
#HKBillProposesHK$100KFineForUnauthorizedCryptoTitles
2,490 views
22 Discussing
10
#BitMineFaces$10.1BUnrealizedETHLoss
5,188 views
27 Discussing