
#cryptoanalysiscryptoanalysis
cryptoanalysiscryptoanalysis
1,086 views
12 Discussing
Hot
Latest

·
--
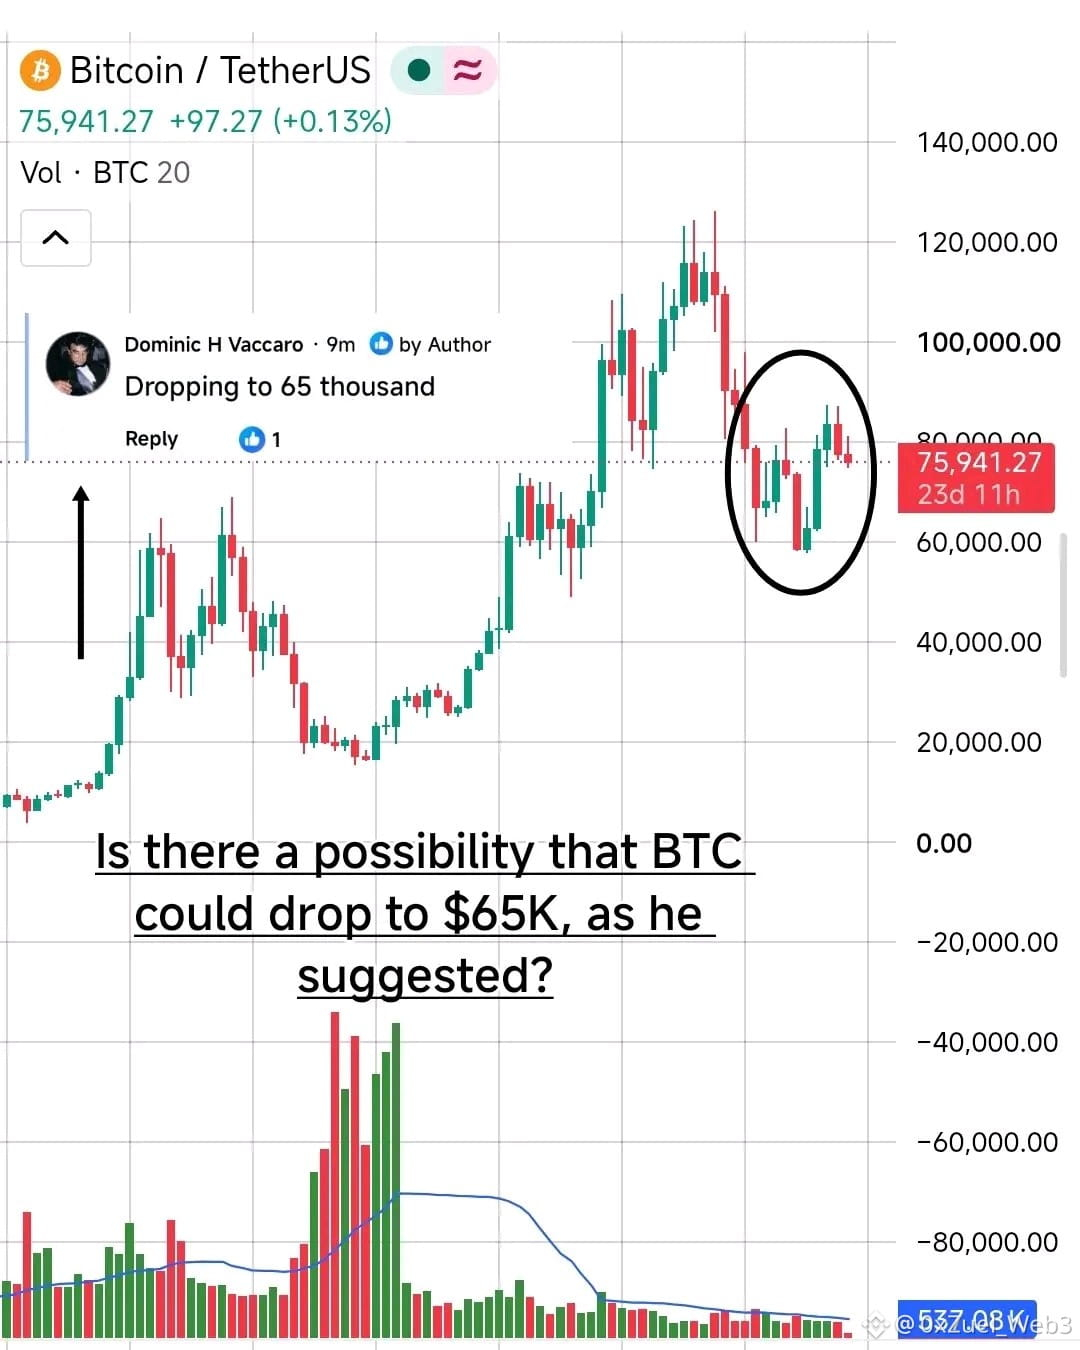
BTC at $65K? Is This a Realistic Possibility? 📉🤔
Could Bitcoin revisit the $65,000 level, or is the market preparing for a stronger recovery?
The crypto market is unpredictable, and both bullish and bearish scenarios deserve attention. Rather than relying on predictions, let's examine market structure, key support levels, and possible confirmation signals.
Let's hear your thoughts! 👇
Do you think BTC could drop to $65K, or do you believe the bears are getting too ambitious?
Share your analysis and reasons in the comments. Let's learn from one another!
Disclaimer: This post is for educational purposes only and is not financial advice. It does not guarantee any trading outcome or profit. Always conduct your own research and manage your risk responsibly.
#BTC #CryptoAnalysisCryptoAnalysis #BitcoinPrediction
BTC at $65K? Is This a Realistic Possibility? 📉🤔
Could Bitcoin revisit the $65,000 level, or is the market preparing for a stronger recovery?
The crypto market is unpredictable, and both bullish and bearish scenarios deserve attention. Rather than relying on predictions, let's examine market structure, key support levels, and possible confirmation signals.
Let's hear your thoughts! 👇
Do you think BTC could drop to $65K, or do you believe the bears are getting too ambitious?
Share your analysis and reasons in the comments. Let's learn from one another!
Disclaimer: This post is for educational purposes only and is not financial advice. It does not guarantee any trading outcome or profit. Always conduct your own research and manage your risk responsibly.
#BTC #CryptoAnalysisCryptoAnalysis #BitcoinPrediction
Could Bitcoin revisit the $65,000 level, or is the market preparing for a stronger recovery?
The crypto market is unpredictable, and both bullish and bearish scenarios deserve attention. Rather than relying on predictions, let's examine market structure, key support levels, and possible confirmation signals.
Let's hear your thoughts! 👇
Do you think BTC could drop to $65K, or do you believe the bears are getting too ambitious?
Share your analysis and reasons in the comments. Let's learn from one another!
Disclaimer: This post is for educational purposes only and is not financial advice. It does not guarantee any trading outcome or profit. Always conduct your own research and manage your risk responsibly.
#BTC #CryptoAnalysisCryptoAnalysis #BitcoinPrediction
1
154

Article
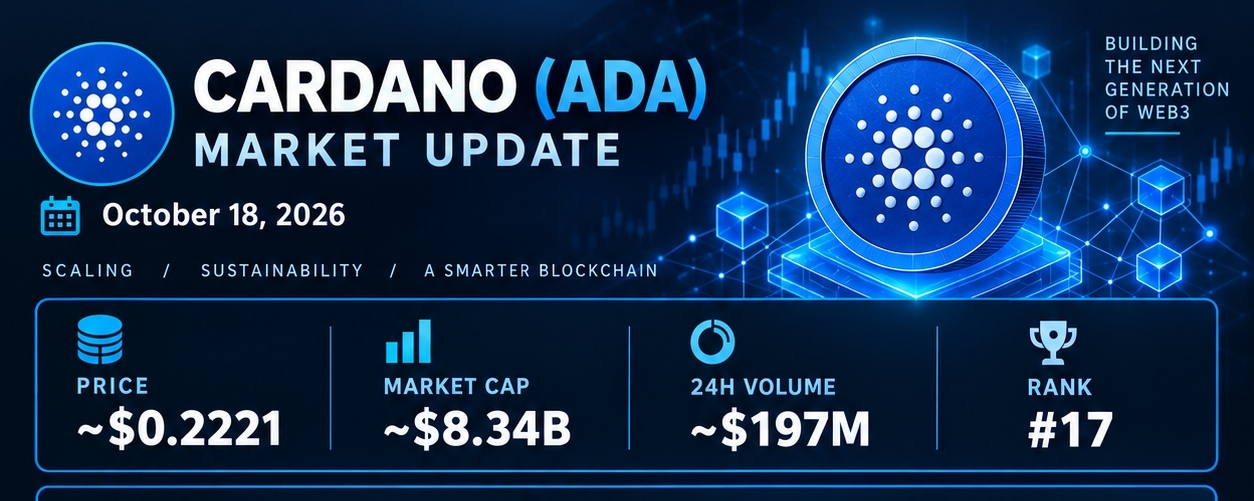
ADACardano (ADA) — Market Update | October 18, 2026
💰 Price: ~$0.2221
📊 Market Cap: ~$8.34B
🔄 24H Volume: ~$197M
🏆 Rank: #17
📉 24H: −0.6% | 7D: −12.6% | 30D: +9.4%
📊 Market Condition: Cautious / bearish. ADA is facing a sharp weekly pullback.
🎯 Key Levels
Support: $0.218–$0.220
Resistance: $0.226–$0.233
📰 Key Catalysts: Cardano’s Leios scaling upgrade continues progressing, while x402 SDK integration creates a potential use case for ADA-powered API payments. <Cite refs={["turn364477search0","turn364477news9"]}/>
🔮 Outlook
🟢 Bullish: Reclaim $0.233 with strong volume.
🔴 Bearish: Break below $0.218.
🟡 Neutral: Range between $0.218–$0.233.
⚠️ Approximate market snapshot. Not financial advice.
#Cardano #ADA #CryptoMarket #CryptoAnalysisCryptoAnalysis
ADA
Cardano (ADA) — Market Update | October 18, 2026
💰 Price: ~$0.2221
📊 Market Cap: ~$8.34B
🔄 24H Volume: ~$197M
🏆 Rank: #17
📉 24H: −0.6% | 7D: −12.6% | 30D: +9.4%
📊 Market Condition: Cautious / bearish. ADA is facing a sharp weekly pullback.
🎯 Key Levels
Support: $0.218–$0.220
Resistance: $0.226–$0.233
📰 Key Catalysts: Cardano’s Leios scaling upgrade continues progressing, while x402 SDK integration creates a potential use case for ADA-powered API payments. <Cite refs={["turn364477search0","turn364477news9"]}/>
🔮 Outlook
🟢 Bullish: Reclaim $0.233 with strong volume.
🔴 Bearish: Break below $0.218.
🟡 Neutral: Range between $0.218–$0.233.
⚠️ Approximate market snapshot. Not financial advice.
#Cardano #ADA #CryptoMarket #CryptoAnalysisCryptoAnalysis
💰 Price: ~$0.2221
📊 Market Cap: ~$8.34B
🔄 24H Volume: ~$197M
🏆 Rank: #17
📉 24H: −0.6% | 7D: −12.6% | 30D: +9.4%
📊 Market Condition: Cautious / bearish. ADA is facing a sharp weekly pullback.
🎯 Key Levels
Support: $0.218–$0.220
Resistance: $0.226–$0.233
📰 Key Catalysts: Cardano’s Leios scaling upgrade continues progressing, while x402 SDK integration creates a potential use case for ADA-powered API payments. <Cite refs={["turn364477search0","turn364477news9"]}/>
🔮 Outlook
🟢 Bullish: Reclaim $0.233 with strong volume.
🔴 Bearish: Break below $0.218.
🟡 Neutral: Range between $0.218–$0.233.
⚠️ Approximate market snapshot. Not financial advice.
#Cardano #ADA #CryptoMarket #CryptoAnalysisCryptoAnalysis
2
1
300

·
--
🚨 $ZEC USDT: Is a Recovery Starting After a Sharp Market Correction?
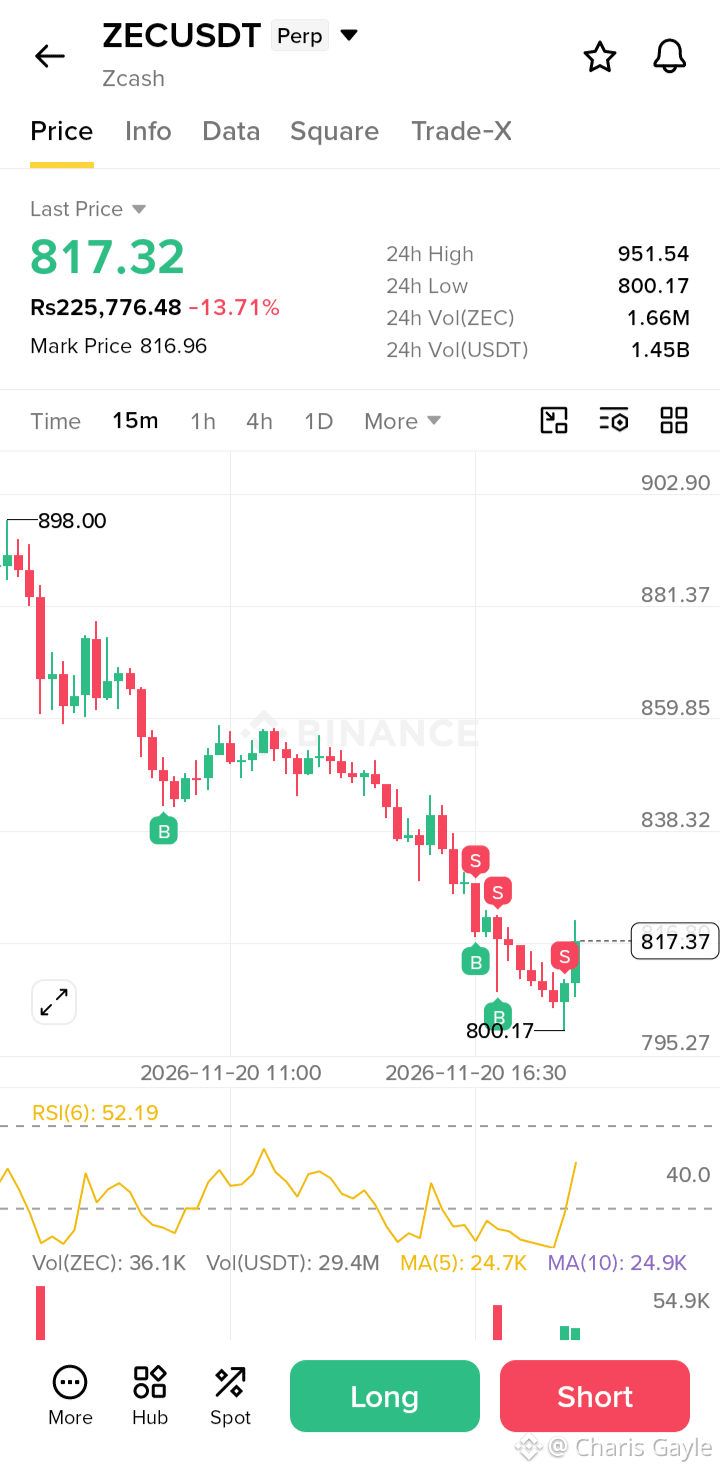
Zcash (ZEC) is showing signs of a potential short-term recovery after a significant bearish move.
📊 15-Minute Market Analysis:
Current Price: $817.32
24H Change: -13.71%
24H High: $951.54
24H Low: $800.17
RSI (6): 52.19
🔍 What the Chart Shows:
ZEC recently tested the $800.17 support zone and bounced back toward $817. Buyers are attempting to regain momentum, while the market remains sensitive to selling pressure.
🎯 Key Levels to Watch:
Support: $800–805
Resistance: $825–830
Next Resistance: $838–840
📈 Market Outlook:
A sustained move above resistance could strengthen the recovery. However, losing the $800 support may bring further downside pressure.
⚠️ Trade Smart: Wait for confirmation before entering any position. Manage risk and avoid emotional trading.
💬 Your Opinion:
Will ZEC recover toward $840, or will sellers push the price below $800?
Drop your analysis in the comments!
#ZEC #Zcash #CryptoAnalysisCryptoAnalysis #BinanceSquareFamily
{future}(ZECUSDT)
🚨 $ZEC USDT: Is a Recovery Starting After a Sharp Market Correction?
Zcash (ZEC) is showing signs of a potential short-term recovery after a significant bearish move.
📊 15-Minute Market Analysis:
Current Price: $817.32
24H Change: -13.71%
24H High: $951.54
24H Low: $800.17
RSI (6): 52.19
🔍 What the Chart Shows:
ZEC recently tested the $800.17 support zone and bounced back toward $817. Buyers are attempting to regain momentum, while the market remains sensitive to selling pressure.
🎯 Key Levels to Watch:
Support: $800–805
Resistance: $825–830
Next Resistance: $838–840
📈 Market Outlook:
A sustained move above resistance could strengthen the recovery. However, losing the $800 support may bring further downside pressure.
⚠️ Trade Smart: Wait for confirmation before entering any position. Manage risk and avoid emotional trading.
💬 Your Opinion:
Will ZEC recover toward $840, or will sellers push the price below $800?
Drop your analysis in the comments!
#ZEC #Zcash #CryptoAnalysisCryptoAnalysis #BinanceSquareFamily
Zcash (ZEC) is showing signs of a potential short-term recovery after a significant bearish move.
📊 15-Minute Market Analysis:
Current Price: $817.32
24H Change: -13.71%
24H High: $951.54
24H Low: $800.17
RSI (6): 52.19
🔍 What the Chart Shows:
ZEC recently tested the $800.17 support zone and bounced back toward $817. Buyers are attempting to regain momentum, while the market remains sensitive to selling pressure.
🎯 Key Levels to Watch:
Support: $800–805
Resistance: $825–830
Next Resistance: $838–840
📈 Market Outlook:
A sustained move above resistance could strengthen the recovery. However, losing the $800 support may bring further downside pressure.
⚠️ Trade Smart: Wait for confirmation before entering any position. Manage risk and avoid emotional trading.
💬 Your Opinion:
Will ZEC recover toward $840, or will sellers push the price below $800?
Drop your analysis in the comments!
#ZEC #Zcash #CryptoAnalysisCryptoAnalysis #BinanceSquareFamily
1
343

🚨 $BTC — THE NEXT 7 DAYS COULD BE IMPORTANT!
🔥 Can Bitcoin make a comeback?
📍 Current reference price: $63,185
📊 7-Day Scenario Analysis
🟢 Bullish scenario: $66,000–$68,000
Potential move: +4.5% to +7.6%
🔴 Bearish scenario: $60,000–$62,000
Potential move: -5.0% to -1.9%
🎯 Key Levels to Watch
• Resistance: $65,000
• Support: $62,000
• Recovery confirmation: Sustained strength above resistance.
⚠️ These are hypothetical scenarios, NOT guaranteed price targets. Market conditions can change quickly.
💬 QUESTION:
Which scenario do you think is more likely over the next 7 days?
🚀 Follow
{spot}(BTCUSDT)
for more market analysis!
#BTC #bitcoin.” #CryptoAnalysisCryptoAnalysis #BinanceSquare #PricePrediction #DigitalFinanceWorld
🚨 $BTC — THE NEXT 7 DAYS COULD BE IMPORTANT!
🔥 Can Bitcoin make a comeback?
📍 Current reference price: $63,185
📊 7-Day Scenario Analysis
🟢 Bullish scenario: $66,000–$68,000
Potential move: +4.5% to +7.6%
🔴 Bearish scenario: $60,000–$62,000
Potential move: -5.0% to -1.9%
🎯 Key Levels to Watch
• Resistance: $65,000
• Support: $62,000
• Recovery confirmation: Sustained strength above resistance.
⚠️ These are hypothetical scenarios, NOT guaranteed price targets. Market conditions can change quickly.
💬 QUESTION:
Which scenario do you think is more likely over the next 7 days?
🚀 Follow
for more market analysis!
#BTC #bitcoin.” #CryptoAnalysisCryptoAnalysis #BinanceSquare #PricePrediction #DigitalFinanceWorld
🔥 Can Bitcoin make a comeback?
📍 Current reference price: $63,185
📊 7-Day Scenario Analysis
🟢 Bullish scenario: $66,000–$68,000
Potential move: +4.5% to +7.6%
🔴 Bearish scenario: $60,000–$62,000
Potential move: -5.0% to -1.9%
🎯 Key Levels to Watch
• Resistance: $65,000
• Support: $62,000
• Recovery confirmation: Sustained strength above resistance.
⚠️ These are hypothetical scenarios, NOT guaranteed price targets. Market conditions can change quickly.
💬 QUESTION:
Which scenario do you think is more likely over the next 7 days?
🚀 Follow
for more market analysis!
#BTC #bitcoin.” #CryptoAnalysisCryptoAnalysis #BinanceSquare #PricePrediction #DigitalFinanceWorld

98

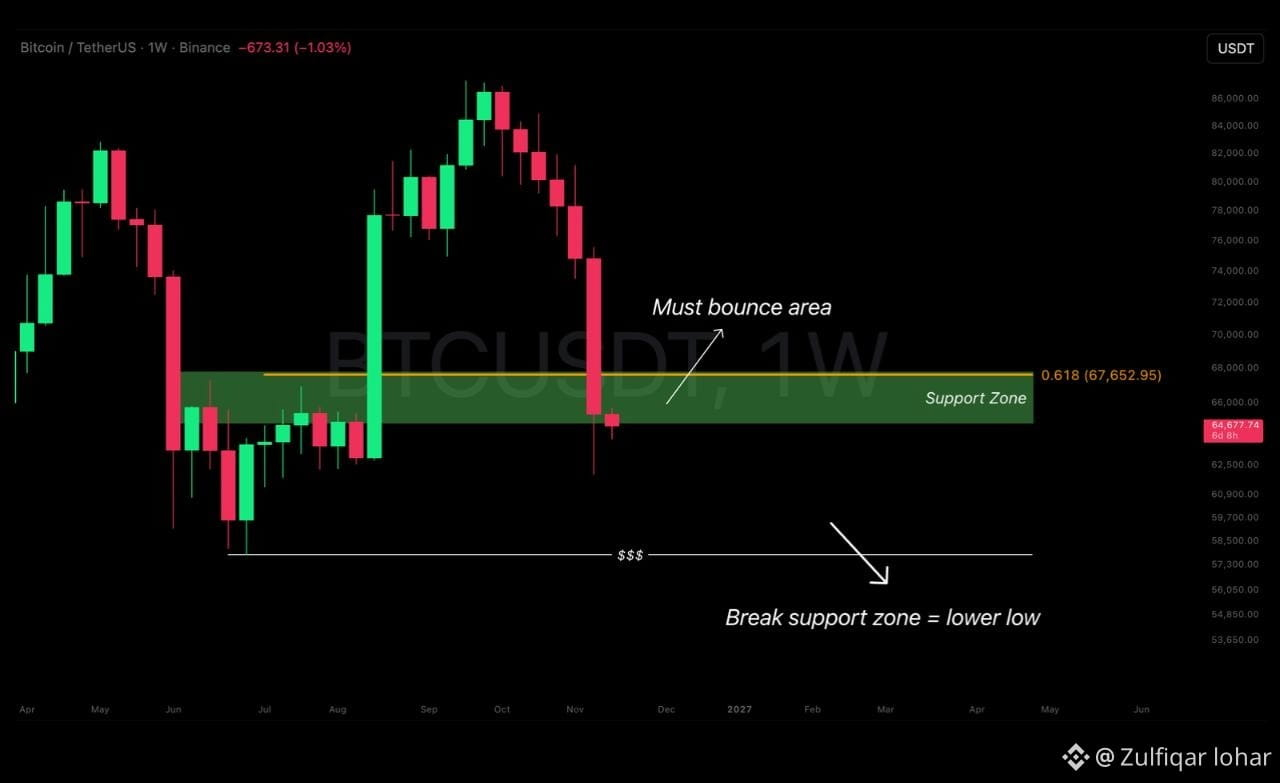
📌 BITCOIN MACRO ANALYSIS — 1W
BTC is now trading deep inside the key zone highlighted in the previous outlook. This price action is not unexpected.
⚠️ Critical Level: Bitcoin must hold this weekly support zone.
🔴 Bearish Scenario: If BTC loses this level, there is a significant possibility of forming a new lower low.
🎯 My Outlook: This is a crucial area for Bitcoin. Watch the weekly reaction carefully before taking a position.
#BTC #Bitcoin #WeeklyAnalysis #CryptoAnalysisCryptoAnalysis #BinanceSquareQuiz
📌 BITCOIN MACRO ANALYSIS — 1W
BTC is now trading deep inside the key zone highlighted in the previous outlook. This price action is not unexpected.
⚠️ Critical Level: Bitcoin must hold this weekly support zone.
🔴 Bearish Scenario: If BTC loses this level, there is a significant possibility of forming a new lower low.
🎯 My Outlook: This is a crucial area for Bitcoin. Watch the weekly reaction carefully before taking a position.
#BTC #Bitcoin #WeeklyAnalysis #CryptoAnalysisCryptoAnalysis #BinanceSquareQuiz
BTC is now trading deep inside the key zone highlighted in the previous outlook. This price action is not unexpected.
⚠️ Critical Level: Bitcoin must hold this weekly support zone.
🔴 Bearish Scenario: If BTC loses this level, there is a significant possibility of forming a new lower low.
🎯 My Outlook: This is a crucial area for Bitcoin. Watch the weekly reaction carefully before taking a position.
#BTC #Bitcoin #WeeklyAnalysis #CryptoAnalysisCryptoAnalysis #BinanceSquareQuiz
Osama Al-Muntasir:
Predict BTC’s next move?
1
25

·
--
Bullish
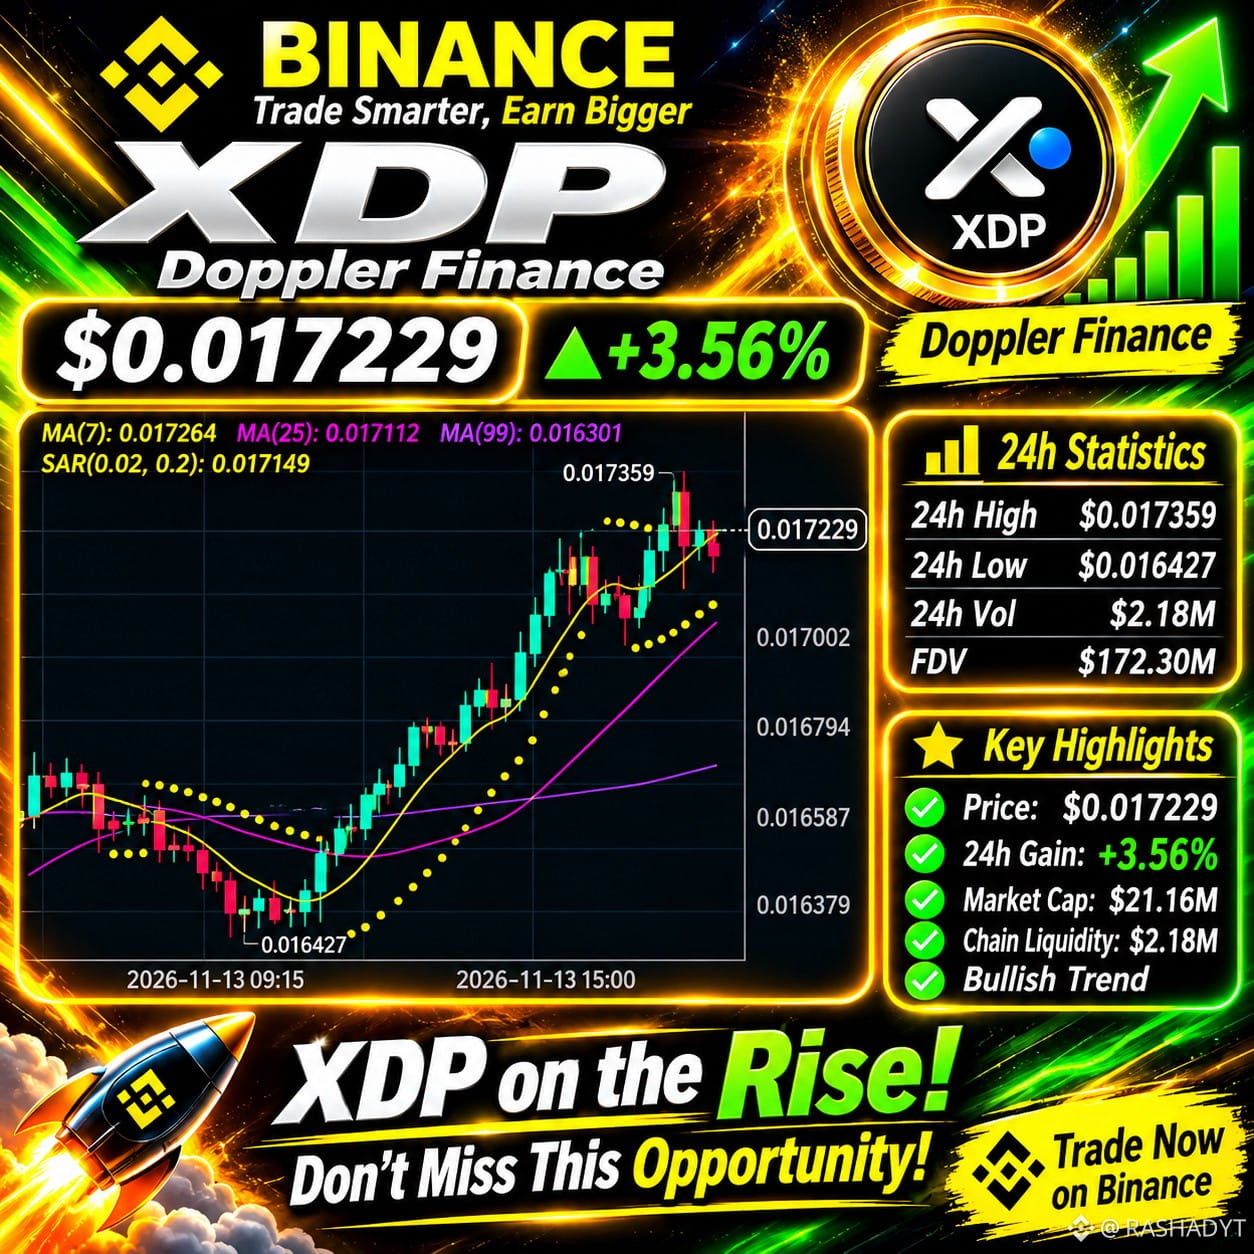
🚀 $XDP (Doppler Finance) — Bullish Momentum!
XDP is showing positive market movement with a +3.56% gain!
💰 Current Price: $0.017229
📈 24H Change: +3.56%
🏦 Market Cap: $21.16M
💧 Chain Liquidity: $2.18M
👥 Holders: 15,897
📊 FDV: $172.30M
Can XDP maintain its upward momentum?
What is your prediction? Bullish or Bearish? 🔥
Share your thoughts below! 👇
#XDP #DopplerFinance
{alpha}(84530x07b3d902783c3c12b077508c3b5c00113d1291d0)
#BinanceHerYerde #CryptoMarket #Altcoins👀🚀 #CryptoAnalysisCryptoAnalysis
🚀 $XDP (Doppler Finance) — Bullish Momentum!
XDP is showing positive market movement with a +3.56% gain!
💰 Current Price: $0.017229
📈 24H Change: +3.56%
🏦 Market Cap: $21.16M
💧 Chain Liquidity: $2.18M
👥 Holders: 15,897
📊 FDV: $172.30M
Can XDP maintain its upward momentum?
What is your prediction? Bullish or Bearish? 🔥
Share your thoughts below! 👇
#XDP #DopplerFinance
#BinanceHerYerde #CryptoMarket #Altcoins👀🚀 #CryptoAnalysisCryptoAnalysis
XDP is showing positive market movement with a +3.56% gain!
💰 Current Price: $0.017229
📈 24H Change: +3.56%
🏦 Market Cap: $21.16M
💧 Chain Liquidity: $2.18M
👥 Holders: 15,897
📊 FDV: $172.30M
Can XDP maintain its upward momentum?
What is your prediction? Bullish or Bearish? 🔥
Share your thoughts below! 👇
#XDP #DopplerFinance
#BinanceHerYerde #CryptoMarket #Altcoins👀🚀 #CryptoAnalysisCryptoAnalysis
1
2
313

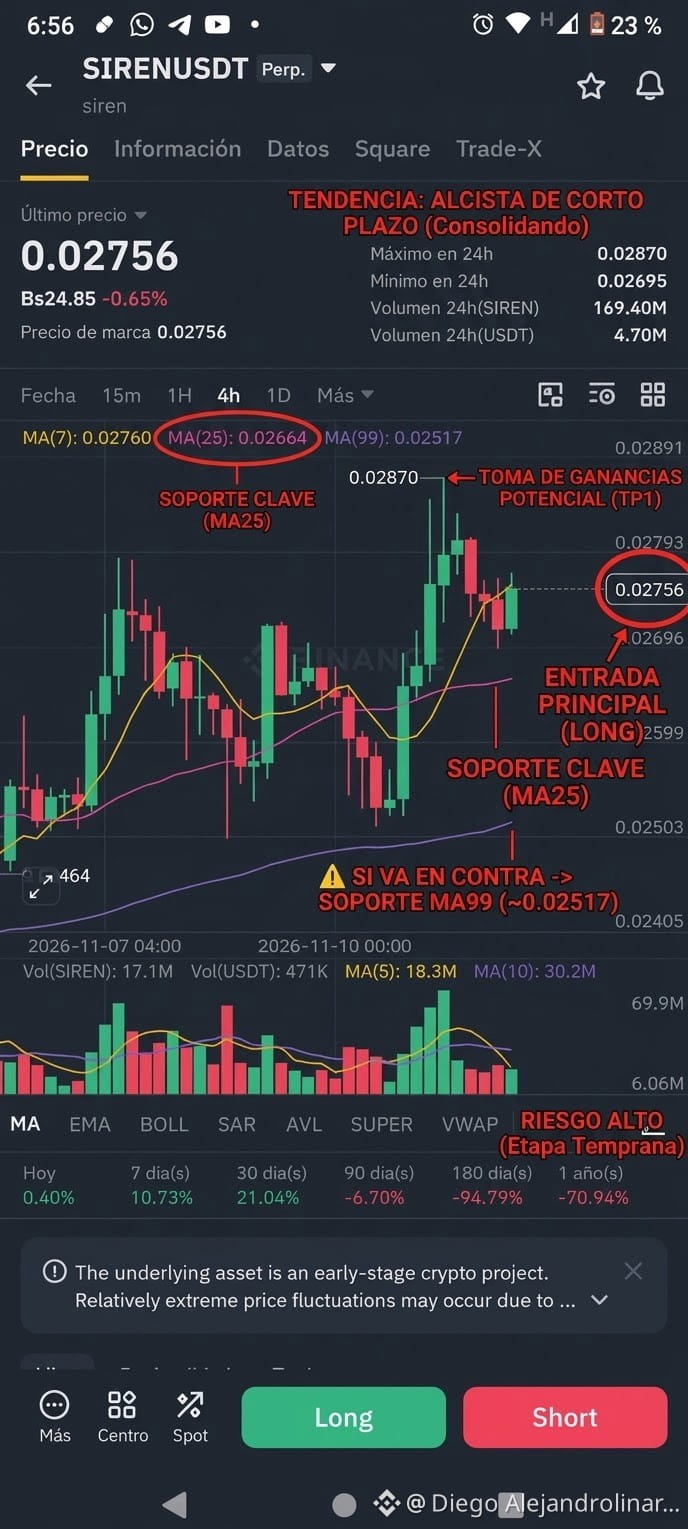
🎯 Trading Plan: SIREN/USDT (4H Chart)
SIREN maintains a short-term bullish structure with higher lows, currently consolidating around 0.02756 USDT just above its key moving averages (MA25 at 0.02664 and MA99 at 0.02517).
Here are the key levels for trading this move long:
🟢 Pullback Entry (Conservative): 0.02660–0.02700 USDT zone, looking for a bounce off the dynamic support at MA(25) and the 24-hour low.
🚀 Breakout Entry: Wait for a 4H candle to close above 0.02880 USDT with a clear increase in volume.
💰 Take Profit (TP):
TP1: 0.02870 USDT (recent resistance).
TP2: 0.03000 USDT (psychological level).
.
⚠️ What if it moves against you? (Contingency Plan):
Stop Loss: Below 0.02610 USDT. If it breaks decisively below MA(25), the bullish structure is invalidated, and the price could fall toward the MA(99) zone at 0.02520 USDT.
Note: As this is an early-stage asset with high volatility, avoid overleveraging.
What do you think of SIREN over the next few hours? Let me know in the comments! 👇
#BinanceSquare #SIREN #TradingPlan #CryptoAnalysisCryptoAnalysis #Altcoins
$SIREN
{future}(SIRENUSDT)
🎯 Trading Plan: SIREN/USDT (4H Chart)
SIREN maintains a short-term bullish structure with higher lows, currently consolidating around 0.02756 USDT just above its key moving averages (MA25 at 0.02664 and MA99 at 0.02517).
Here are the key levels for trading this move long:
🟢 Pullback Entry (Conservative): 0.02660–0.02700 USDT zone, looking for a bounce off the dynamic support at MA(25) and the 24-hour low.
🚀 Breakout Entry: Wait for a 4H candle to close above 0.02880 USDT with a clear increase in volume.
💰 Take Profit (TP):
TP1: 0.02870 USDT (recent resistance).
TP2: 0.03000 USDT (psychological level).
.
⚠️ What if it moves against you? (Contingency Plan):
Stop Loss: Below 0.02610 USDT. If it breaks decisively below MA(25), the bullish structure is invalidated, and the price could fall toward the MA(99) zone at 0.02520 USDT.
Note: As this is an early-stage asset with high volatility, avoid overleveraging.
What do you think of SIREN over the next few hours? Let me know in the comments! 👇
#BinanceSquare #SIREN #TradingPlan #CryptoAnalysisCryptoAnalysis #Altcoins
$SIREN
SIREN maintains a short-term bullish structure with higher lows, currently consolidating around 0.02756 USDT just above its key moving averages (MA25 at 0.02664 and MA99 at 0.02517).
Here are the key levels for trading this move long:
🟢 Pullback Entry (Conservative): 0.02660–0.02700 USDT zone, looking for a bounce off the dynamic support at MA(25) and the 24-hour low.
🚀 Breakout Entry: Wait for a 4H candle to close above 0.02880 USDT with a clear increase in volume.
💰 Take Profit (TP):
TP1: 0.02870 USDT (recent resistance).
TP2: 0.03000 USDT (psychological level).
.
⚠️ What if it moves against you? (Contingency Plan):
Stop Loss: Below 0.02610 USDT. If it breaks decisively below MA(25), the bullish structure is invalidated, and the price could fall toward the MA(99) zone at 0.02520 USDT.
Note: As this is an early-stage asset with high volatility, avoid overleveraging.
What do you think of SIREN over the next few hours? Let me know in the comments! 👇
#BinanceSquare #SIREN #TradingPlan #CryptoAnalysisCryptoAnalysis #Altcoins
$SIREN
286

·
--
Bullish
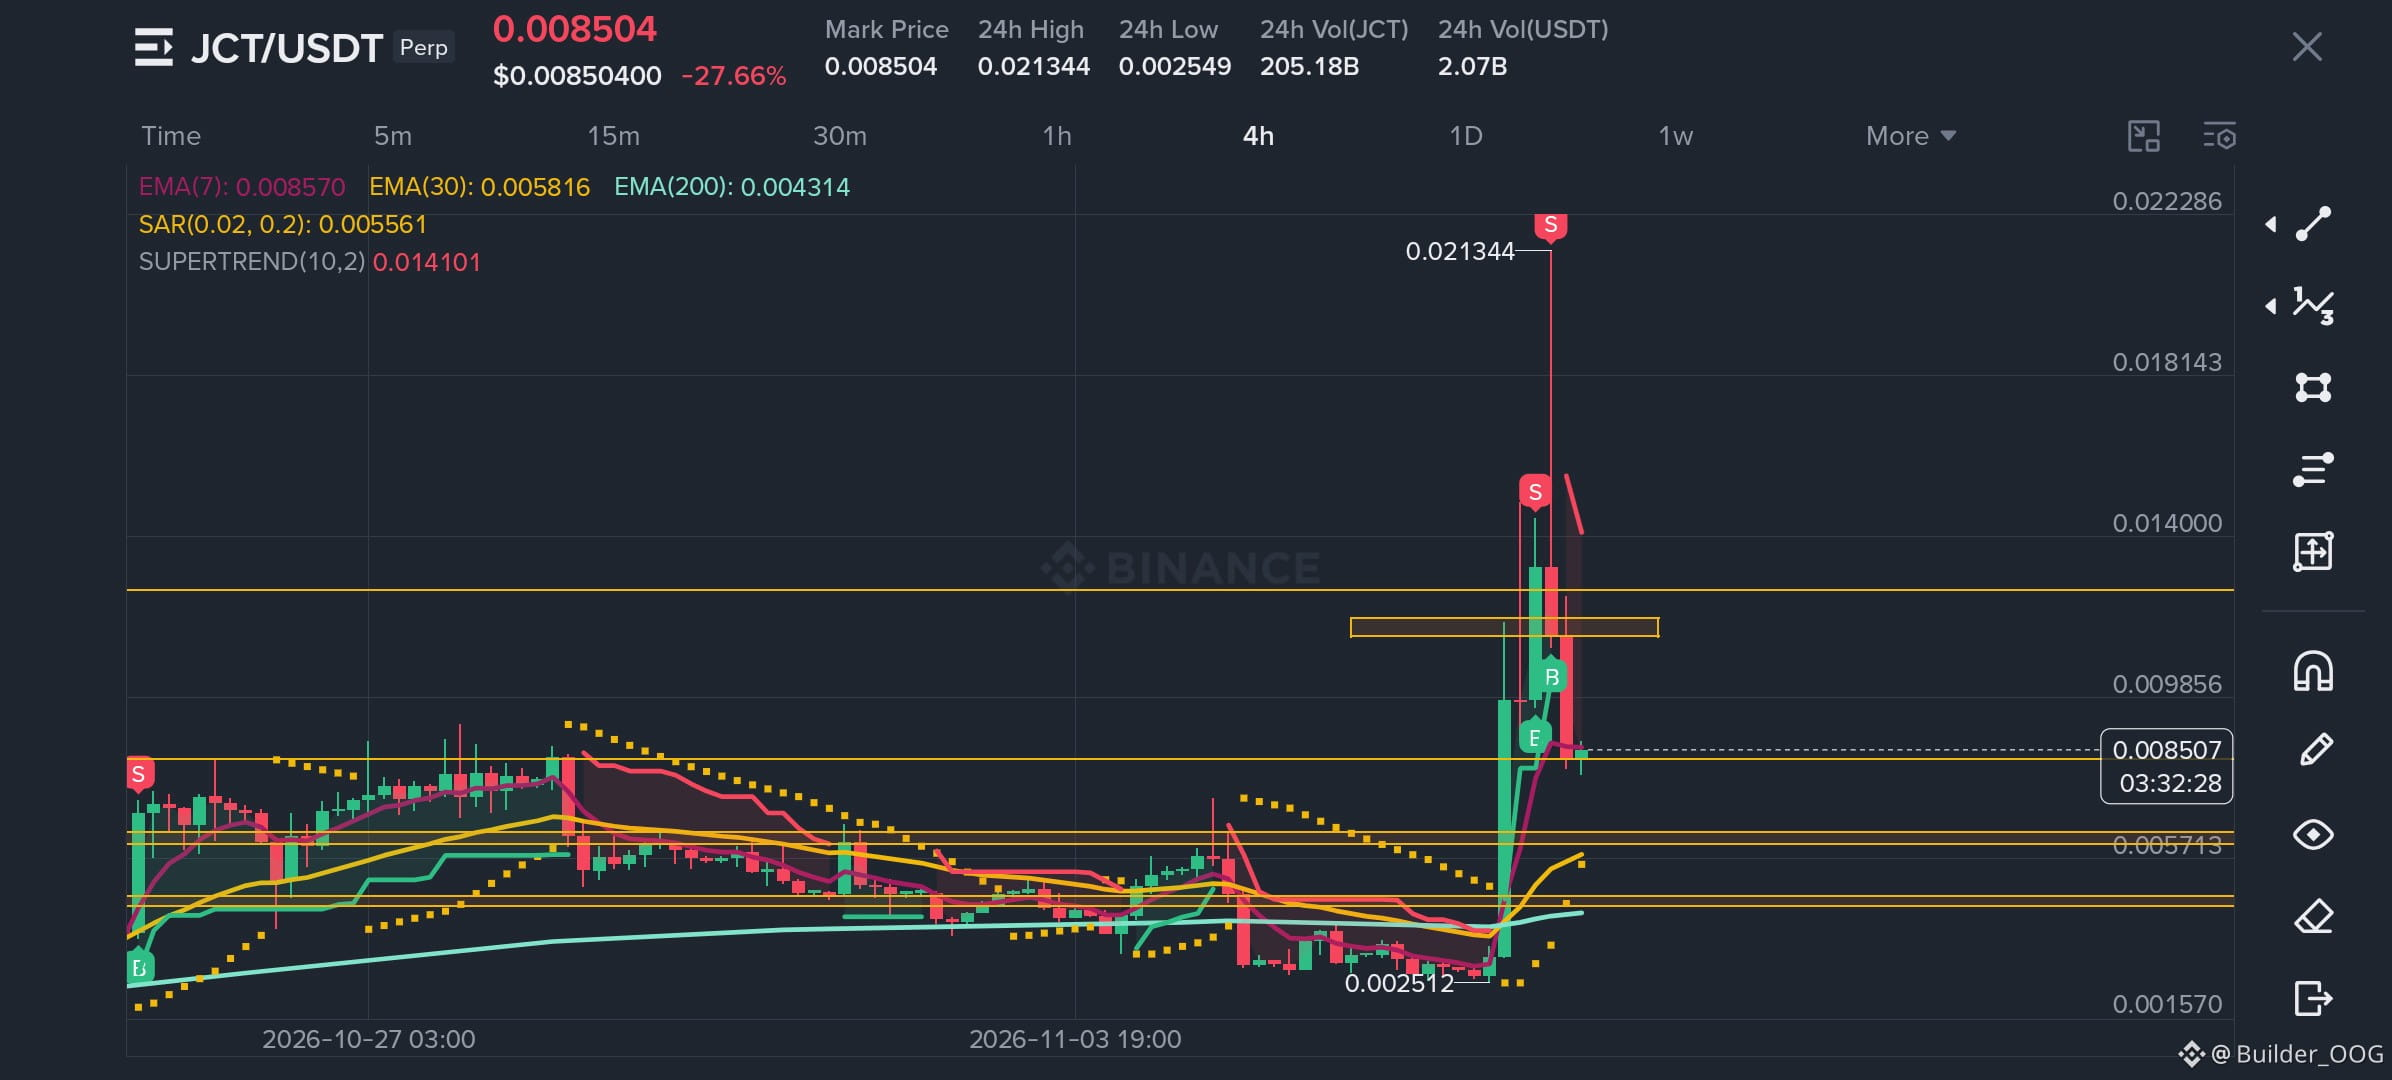
📊 **JCT/USDT – 4H Technical Analysis**
JCT is experiencing a strong correction after a massive pump, dropping approximately 27.66% in the last 24 hours.
**Current Price:** $0.008504
**Key Support Levels:**
- $0.0080 – Immediate support
- $0.0074 – Important support
- $0.0058 – Stronger support zone
- $0.0043 – Major EMA 200 support
**Key Resistance Levels:**
- $0.0105–$0.0112 – Immediate resistance
- $0.0125 – Next resistance
- $0.0141 – Major resistance
**Technical Outlook:**
Price is hovering around EMA 7, while EMA 30 and EMA 200 remain below the current price. However, the Supertrend is still bearish, indicating that selling pressure remains.
**My Observation:**
JCT needs to reclaim the $0.0105–$0.0112 resistance zone and hold above it to show signs of recovery. A breakdown below $0.0080 could lead to further downside toward $0.0074.
⚠️ **Strategy:** Wait for confirmation before making any decision. Avoid chasing the price during high volatility.
*Not financial advice. Always manage your risk.*
#JCT #JCTUSDT #CryptoAnalysisCryptoAnalysis #TechnicalAnalysise #Binance
My suggestion: Watch the 4H candle close around $0.0080 and the $0.0110 resistance zone. These levels are important for understanding the next move.
📊 **JCT/USDT – 4H Technical Analysis**
JCT is experiencing a strong correction after a massive pump, dropping approximately 27.66% in the last 24 hours.
**Current Price:** $0.008504
**Key Support Levels:**
- $0.0080 – Immediate support
- $0.0074 – Important support
- $0.0058 – Stronger support zone
- $0.0043 – Major EMA 200 support
**Key Resistance Levels:**
- $0.0105–$0.0112 – Immediate resistance
- $0.0125 – Next resistance
- $0.0141 – Major resistance
**Technical Outlook:**
Price is hovering around EMA 7, while EMA 30 and EMA 200 remain below the current price. However, the Supertrend is still bearish, indicating that selling pressure remains.
**My Observation:**
JCT needs to reclaim the $0.0105–$0.0112 resistance zone and hold above it to show signs of recovery. A breakdown below $0.0080 could lead to further downside toward $0.0074.
⚠️ **Strategy:** Wait for confirmation before making any decision. Avoid chasing the price during high volatility.
*Not financial advice. Always manage your risk.*
#JCT #JCTUSDT #CryptoAnalysisCryptoAnalysis #TechnicalAnalysise #Binance
My suggestion: Watch the 4H candle close around $0.0080 and the $0.0110 resistance zone. These levels are important for understanding the next move.
JCT is experiencing a strong correction after a massive pump, dropping approximately 27.66% in the last 24 hours.
**Current Price:** $0.008504
**Key Support Levels:**
- $0.0080 – Immediate support
- $0.0074 – Important support
- $0.0058 – Stronger support zone
- $0.0043 – Major EMA 200 support
**Key Resistance Levels:**
- $0.0105–$0.0112 – Immediate resistance
- $0.0125 – Next resistance
- $0.0141 – Major resistance
**Technical Outlook:**
Price is hovering around EMA 7, while EMA 30 and EMA 200 remain below the current price. However, the Supertrend is still bearish, indicating that selling pressure remains.
**My Observation:**
JCT needs to reclaim the $0.0105–$0.0112 resistance zone and hold above it to show signs of recovery. A breakdown below $0.0080 could lead to further downside toward $0.0074.
⚠️ **Strategy:** Wait for confirmation before making any decision. Avoid chasing the price during high volatility.
*Not financial advice. Always manage your risk.*
#JCT #JCTUSDT #CryptoAnalysisCryptoAnalysis #TechnicalAnalysise #Binance
My suggestion: Watch the 4H candle close around $0.0080 and the $0.0110 resistance zone. These levels are important for understanding the next move.
333

·
--
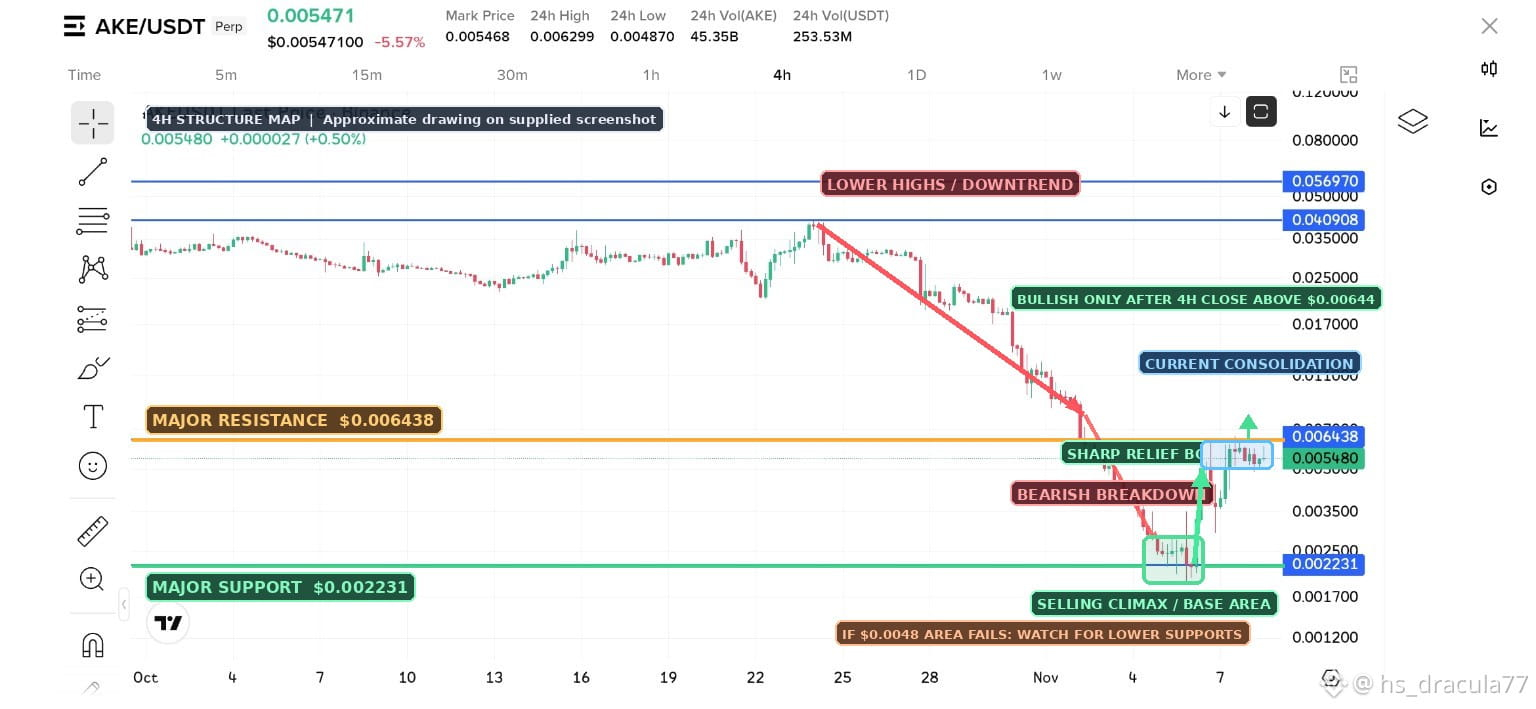
📊 **AKE/USDT – 4H Market Analysis**
$AKE is showing a strong recovery after a massive bearish move from its previous highs. Buyers have defended the $0.00223 support and pushed price toward $0.00644 resistance.
🔹 **Resistance:** $0.00644
🔹 **Support:** $0.00480
🔹 **Major Support:** $0.00223
**Bullish Scenario:** A confirmed 4H breakout above $0.00644 could open the way toward $0.0090–$0.0110.
**Bearish Scenario:** Rejection at resistance could trigger another pullback toward $0.00480.
**My Take:** The recovery looks promising, but the overall trend remains bearish until resistance is reclaimed.
Patience is key. Wait for confirmation before entering. 📈
#AKE #AKEUSDT #CryptoAnalysisCryptoAnalysis #BinanceSquareTurkey #CryptoTrading
📊 **AKE/USDT – 4H Market Analysis**
$AKE is showing a strong recovery after a massive bearish move from its previous highs. Buyers have defended the $0.00223 support and pushed price toward $0.00644 resistance.
🔹 **Resistance:** $0.00644
🔹 **Support:** $0.00480
🔹 **Major Support:** $0.00223
**Bullish Scenario:** A confirmed 4H breakout above $0.00644 could open the way toward $0.0090–$0.0110.
**Bearish Scenario:** Rejection at resistance could trigger another pullback toward $0.00480.
**My Take:** The recovery looks promising, but the overall trend remains bearish until resistance is reclaimed.
Patience is key. Wait for confirmation before entering. 📈
#AKE #AKEUSDT #CryptoAnalysisCryptoAnalysis #BinanceSquareTurkey #CryptoTrading
$AKE is showing a strong recovery after a massive bearish move from its previous highs. Buyers have defended the $0.00223 support and pushed price toward $0.00644 resistance.
🔹 **Resistance:** $0.00644
🔹 **Support:** $0.00480
🔹 **Major Support:** $0.00223
**Bullish Scenario:** A confirmed 4H breakout above $0.00644 could open the way toward $0.0090–$0.0110.
**Bearish Scenario:** Rejection at resistance could trigger another pullback toward $0.00480.
**My Take:** The recovery looks promising, but the overall trend remains bearish until resistance is reclaimed.
Patience is key. Wait for confirmation before entering. 📈
#AKE #AKEUSDT #CryptoAnalysisCryptoAnalysis #BinanceSquareTurkey #CryptoTrading
496

·
--
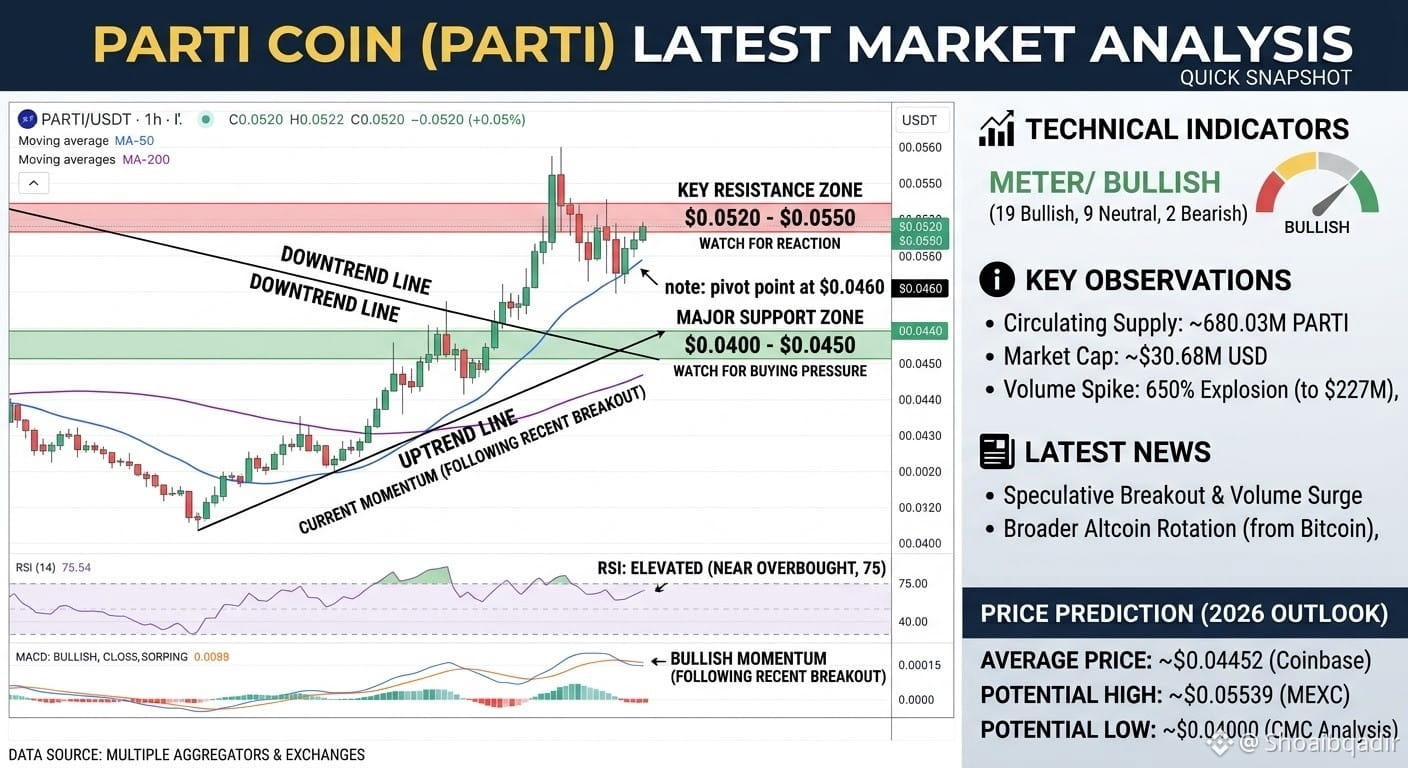
📊 $PARTI
{spot}(PARTIUSDT)
(Particle Network) – Latest Crypto Analysis | November 5, 2026
💰 Current Price: $0.044815
📉 24H Change: -0.93% (Currently in Loss)
Market Analysis:
PARTI is experiencing slight bearish pressure in the short term. The price is trading near the $0.0445 support zone, while resistance is around $0.0497. A breakout above resistance could bring bullish momentum back. However, traders should watch for further downside before entering a position.
📈 Market Outlook: Short-term Neutral to Bearish.
⚠️ Disclaimer: This post is for educational and informational purposes only, not financial advice. Cryptocurrency markets are highly volatile. Always DYOR and manage your risk before trading.
#PARTI #ParticleNetwork #BinanceSquareFamily #CryptoAnalysisCryptoAnalysis #CryptoTrading #Altcoins #MarketUpdate #CryptoMarket
📊 $PARTI
(Particle Network) – Latest Crypto Analysis | November 5, 2026
💰 Current Price: $0.044815
📉 24H Change: -0.93% (Currently in Loss)
Market Analysis:
PARTI is experiencing slight bearish pressure in the short term. The price is trading near the $0.0445 support zone, while resistance is around $0.0497. A breakout above resistance could bring bullish momentum back. However, traders should watch for further downside before entering a position.
📈 Market Outlook: Short-term Neutral to Bearish.
⚠️ Disclaimer: This post is for educational and informational purposes only, not financial advice. Cryptocurrency markets are highly volatile. Always DYOR and manage your risk before trading.
#PARTI #ParticleNetwork #BinanceSquareFamily #CryptoAnalysisCryptoAnalysis #CryptoTrading #Altcoins #MarketUpdate #CryptoMarket
(Particle Network) – Latest Crypto Analysis | November 5, 2026
💰 Current Price: $0.044815
📉 24H Change: -0.93% (Currently in Loss)
Market Analysis:
PARTI is experiencing slight bearish pressure in the short term. The price is trading near the $0.0445 support zone, while resistance is around $0.0497. A breakout above resistance could bring bullish momentum back. However, traders should watch for further downside before entering a position.
📈 Market Outlook: Short-term Neutral to Bearish.
⚠️ Disclaimer: This post is for educational and informational purposes only, not financial advice. Cryptocurrency markets are highly volatile. Always DYOR and manage your risk before trading.
#PARTI #ParticleNetwork #BinanceSquareFamily #CryptoAnalysisCryptoAnalysis #CryptoTrading #Altcoins #MarketUpdate #CryptoMarket
290

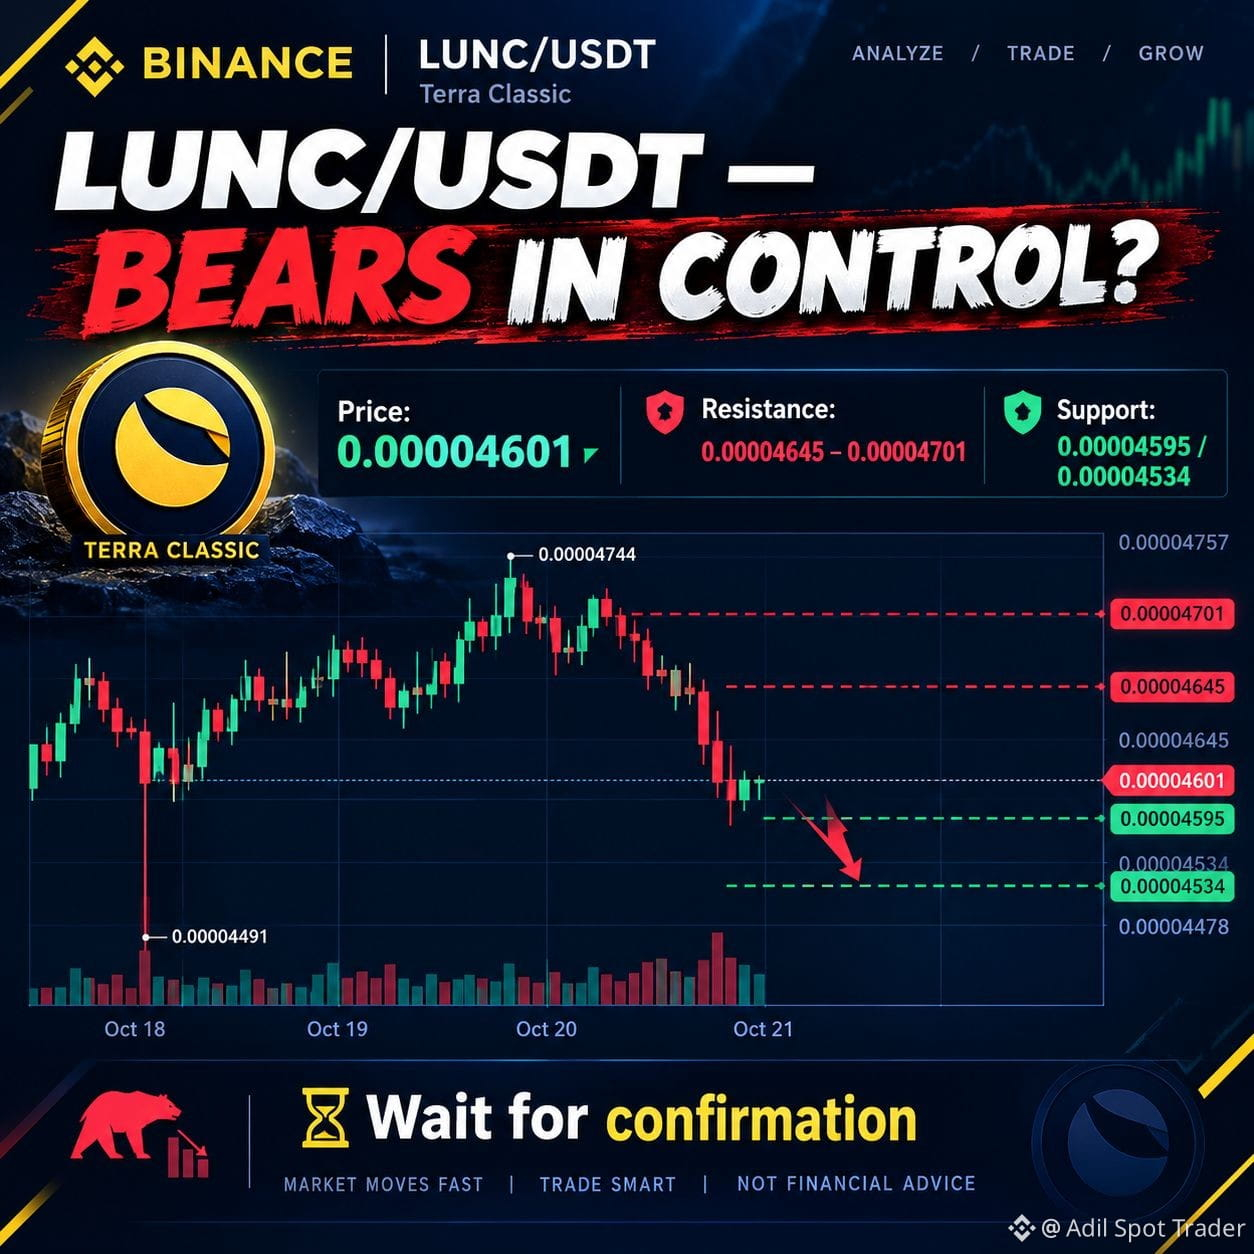
🚨 $LUNC USDT — BEARS IN CONTROL? 📉
Terra Classic is facing selling pressure! The screenshot shows LUNC near $0.00004601, down 1.14%.
🔴 Resistance: $0.00004645–$0.00004701
🟢 Support: $0.00004595, then $0.00004534
A breakdown could bring more downside, while a recovery above resistance may signal a short-term bounce.
👇 Your prediction: $0.0000475 next 🚀 or $0.0000453 first 📉?
Vote below and tell us WHY! 🔥
#LUNC #TERRACLASSİC #CryptoAnalysisCryptoAnalysis #BİNANCESQUARE
🚨 $LUNC USDT — BEARS IN CONTROL? 📉
Terra Classic is facing selling pressure! The screenshot shows LUNC near $0.00004601, down 1.14%.
🔴 Resistance: $0.00004645–$0.00004701
🟢 Support: $0.00004595, then $0.00004534
A breakdown could bring more downside, while a recovery above resistance may signal a short-term bounce.
👇 Your prediction: $0.0000475 next 🚀 or $0.0000453 first 📉?
Vote below and tell us WHY! 🔥
#LUNC #TERRACLASSİC #CryptoAnalysisCryptoAnalysis #BİNANCESQUARE
Terra Classic is facing selling pressure! The screenshot shows LUNC near $0.00004601, down 1.14%.
🔴 Resistance: $0.00004645–$0.00004701
🟢 Support: $0.00004595, then $0.00004534
A breakdown could bring more downside, while a recovery above resistance may signal a short-term bounce.
👇 Your prediction: $0.0000475 next 🚀 or $0.0000453 first 📉?
Vote below and tell us WHY! 🔥
#LUNC #TERRACLASSİC #CryptoAnalysisCryptoAnalysis #BİNANCESQUARE
1
216
Log in to explore more content
Join global crypto users on Binance Square
⚡️ Get latest and useful information about crypto.
💬 Trusted by the world’s largest crypto exchange.
👍 Discover real insights from verified creators.
Email / Phone number
Trending Topics
1
#CanBTCReboundAfterFallingBelow60K?
0 views
388 Discussing
2
#GlobalStocksFaceLongestLosingStreakSince2023
0 views
434 Discussing
3
#AnthropicPlungesTowardIPOPriceonDay2
0 views
142 Discussing
4
#GaoTengBitcoinETFListsOnHKEX
0 views
348 Discussing
5
#TradFiForBeginners
946,825 views
5,734 Discussing
6
#NvidiaBoardReportedlySplitOverHuang’sReturn
258,674 views
2,534 Discussing
7
#TetherBurns8BillionUSDTInPast20Days
0 views
138 Discussing
8
#BitcoinWalletSignatureFlawExploitableWithinSeconds
0 views
66 Discussing
9
#CanGTA6'sLaunchLiftTTWOShares?
207,868 views
1,780 Discussing
10
#HongKongProposesSFCLicensingForFourVirtualAssetServices
404 views
35 Discussing