
#technicalanalysise
technicalanalysise
5,947 views
33 Discussing
Hot
Latest

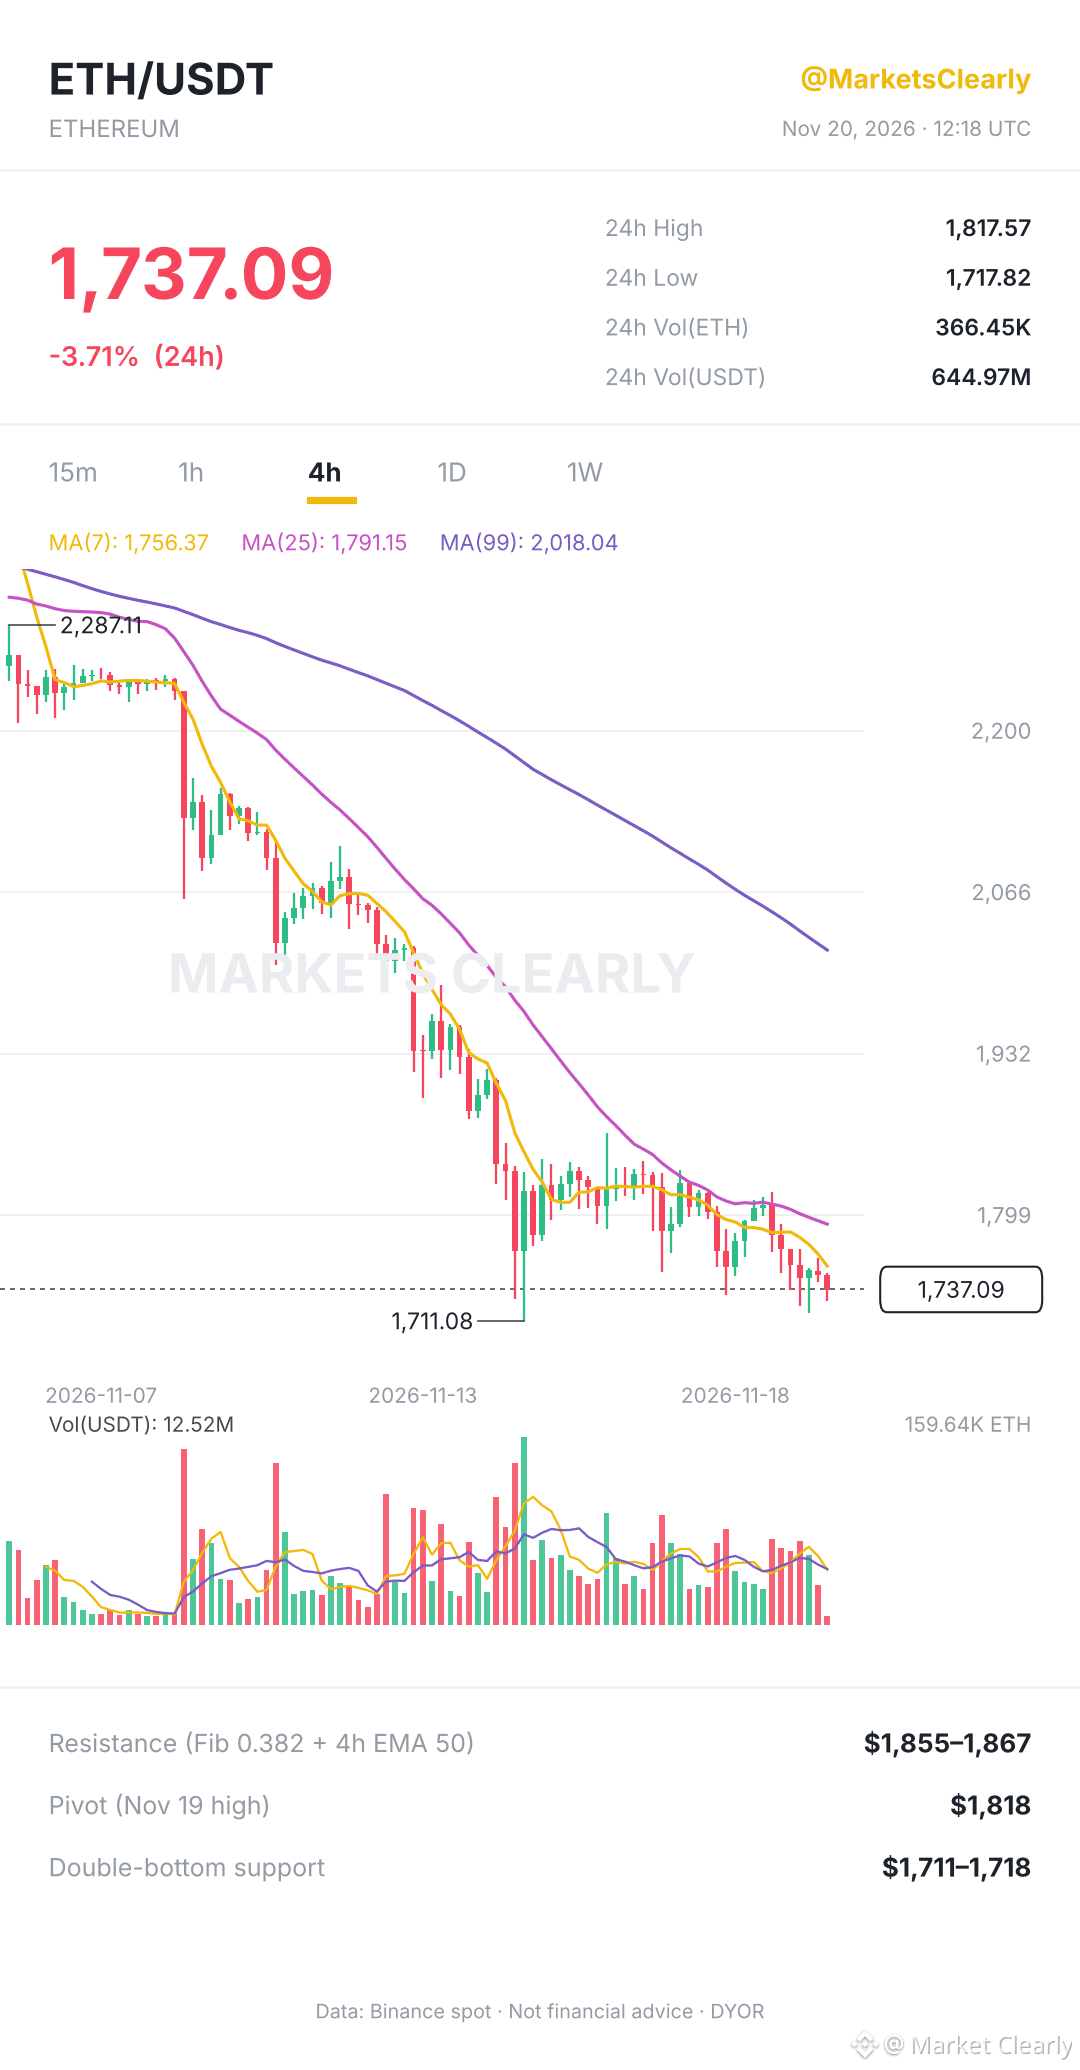
Ethereum 4h: bulls defending $1,711 for the second time
$ETH trades near $1,737 (Binance, 12:18 UTC), down 3.7% in 24h. Daily RSI is 23, deeply oversold.
Key levels (4h)
Support: $1,711–1,718 (Nov 15 low, retested today)
Pivot: $1,818 (Nov 19 high)
Resistance: $1,855–1,867 (Fib 0.382 of the $2,104 → $1,711 drop + 4h EMA 50)
Bull: a 4h close above $1,818 opens $1,855–1,867.
Bear: a 4h close below $1,711 leaves little structure until the June lows near $1,506–1,512.
Macro: final UMich sentiment (15:00 UTC) and Fed Governor Cook (17:15 UTC) can move the dollar today.
Our view: oversold is not a reversal signal. The $1,711 floor decides the next leg.
Which level are you watching: the $1,711 support or the $1,818 breakout?
$ETH $BTC
{spot}(BTCUSDT)
#TechnicalAnalysise
Ethereum 4h: bulls defending $1,711 for the second time
$ETH trades near $1,737 (Binance, 12:18 UTC), down 3.7% in 24h. Daily RSI is 23, deeply oversold.
Key levels (4h)
Support: $1,711–1,718 (Nov 15 low, retested today)
Pivot: $1,818 (Nov 19 high)
Resistance: $1,855–1,867 (Fib 0.382 of the $2,104 → $1,711 drop + 4h EMA 50)
Bull: a 4h close above $1,818 opens $1,855–1,867.
Bear: a 4h close below $1,711 leaves little structure until the June lows near $1,506–1,512.
Macro: final UMich sentiment (15:00 UTC) and Fed Governor Cook (17:15 UTC) can move the dollar today.
Our view: oversold is not a reversal signal. The $1,711 floor decides the next leg.
Which level are you watching: the $1,711 support or the $1,818 breakout?
$ETH $BTC
#TechnicalAnalysise
$ETH trades near $1,737 (Binance, 12:18 UTC), down 3.7% in 24h. Daily RSI is 23, deeply oversold.
Key levels (4h)
Support: $1,711–1,718 (Nov 15 low, retested today)
Pivot: $1,818 (Nov 19 high)
Resistance: $1,855–1,867 (Fib 0.382 of the $2,104 → $1,711 drop + 4h EMA 50)
Bull: a 4h close above $1,818 opens $1,855–1,867.
Bear: a 4h close below $1,711 leaves little structure until the June lows near $1,506–1,512.
Macro: final UMich sentiment (15:00 UTC) and Fed Governor Cook (17:15 UTC) can move the dollar today.
Our view: oversold is not a reversal signal. The $1,711 floor decides the next leg.
Which level are you watching: the $1,711 support or the $1,818 breakout?
$ETH $BTC
#TechnicalAnalysise
1
88

·
--
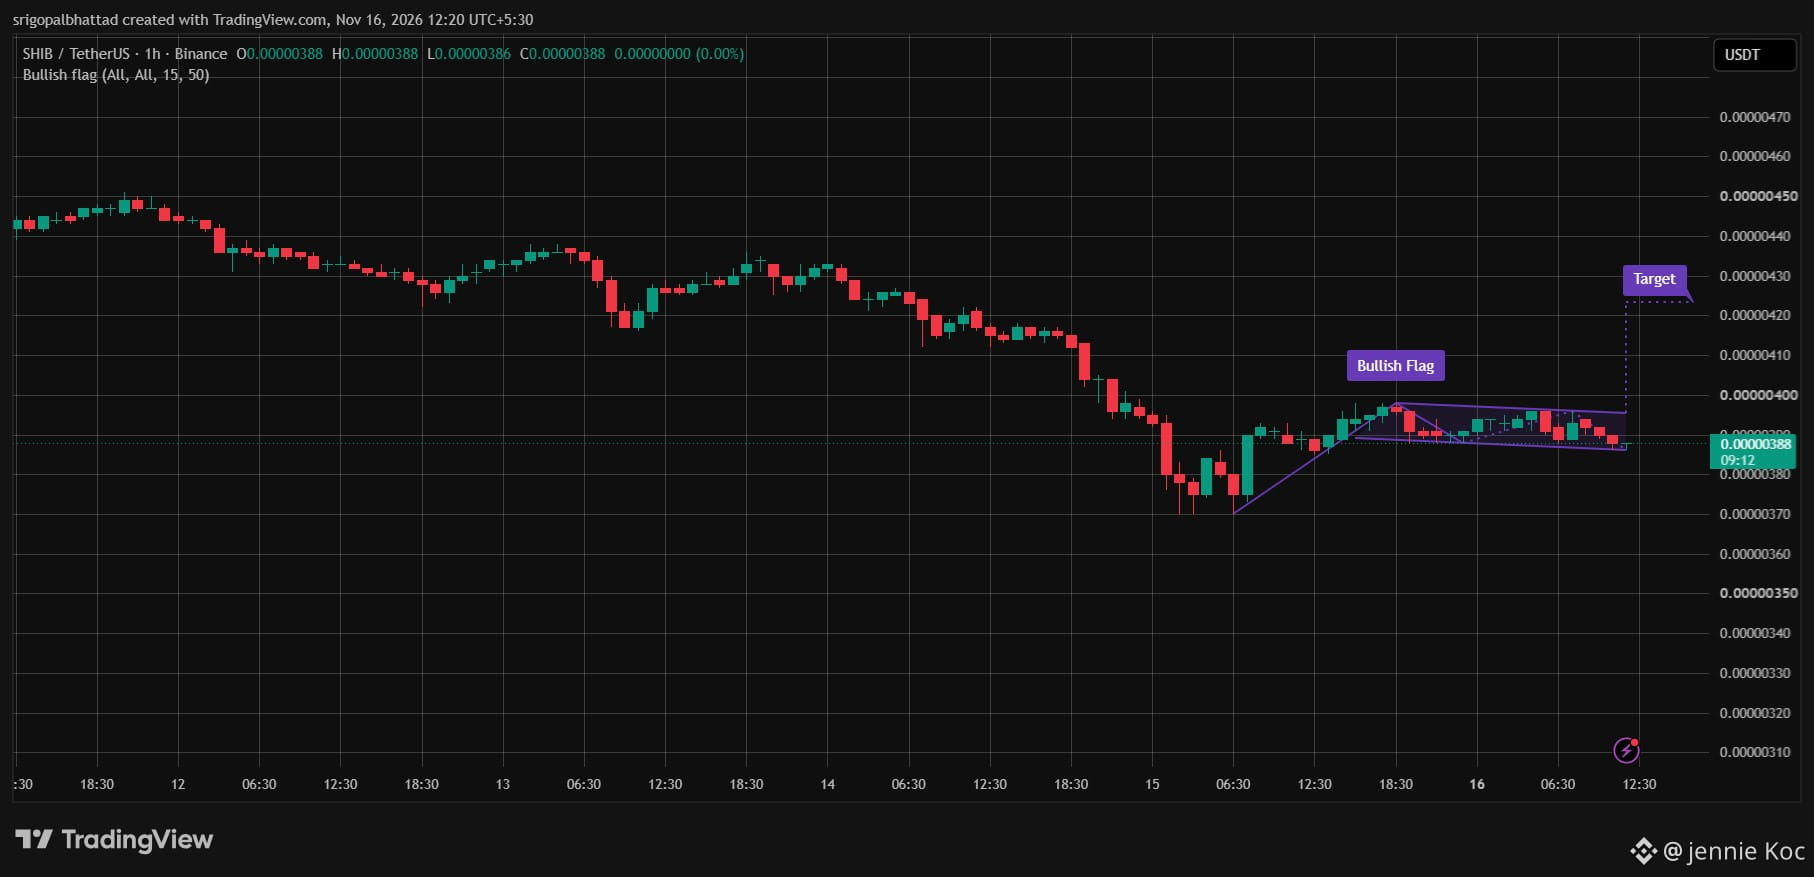
$SHIB 1H 🐕👀
Printing a potential Bullish Flag formation after a strong bounce from the $0.00000370 support zone. Buyers are consolidating near $0.00000388, building pressure for the next move.
A breakout above $0.00000398 could trigger a push towards $0.00000425. Bulls need to reclaim resistance to confirm the setup. 📈🔥
SHIB could be gearing up for a bullish comeback!
#SHIB #ShibaInu #Crypto #Altcoins #TechnicalAnalysise
$SHIB 1H 🐕👀
Printing a potential Bullish Flag formation after a strong bounce from the $0.00000370 support zone. Buyers are consolidating near $0.00000388, building pressure for the next move.
A breakout above $0.00000398 could trigger a push towards $0.00000425. Bulls need to reclaim resistance to confirm the setup. 📈🔥
SHIB could be gearing up for a bullish comeback!
#SHIB #ShibaInu #Crypto #Altcoins #TechnicalAnalysise
Printing a potential Bullish Flag formation after a strong bounce from the $0.00000370 support zone. Buyers are consolidating near $0.00000388, building pressure for the next move.
A breakout above $0.00000398 could trigger a push towards $0.00000425. Bulls need to reclaim resistance to confirm the setup. 📈🔥
SHIB could be gearing up for a bullish comeback!
#SHIB #ShibaInu #Crypto #Altcoins #TechnicalAnalysise
1
244

·
--
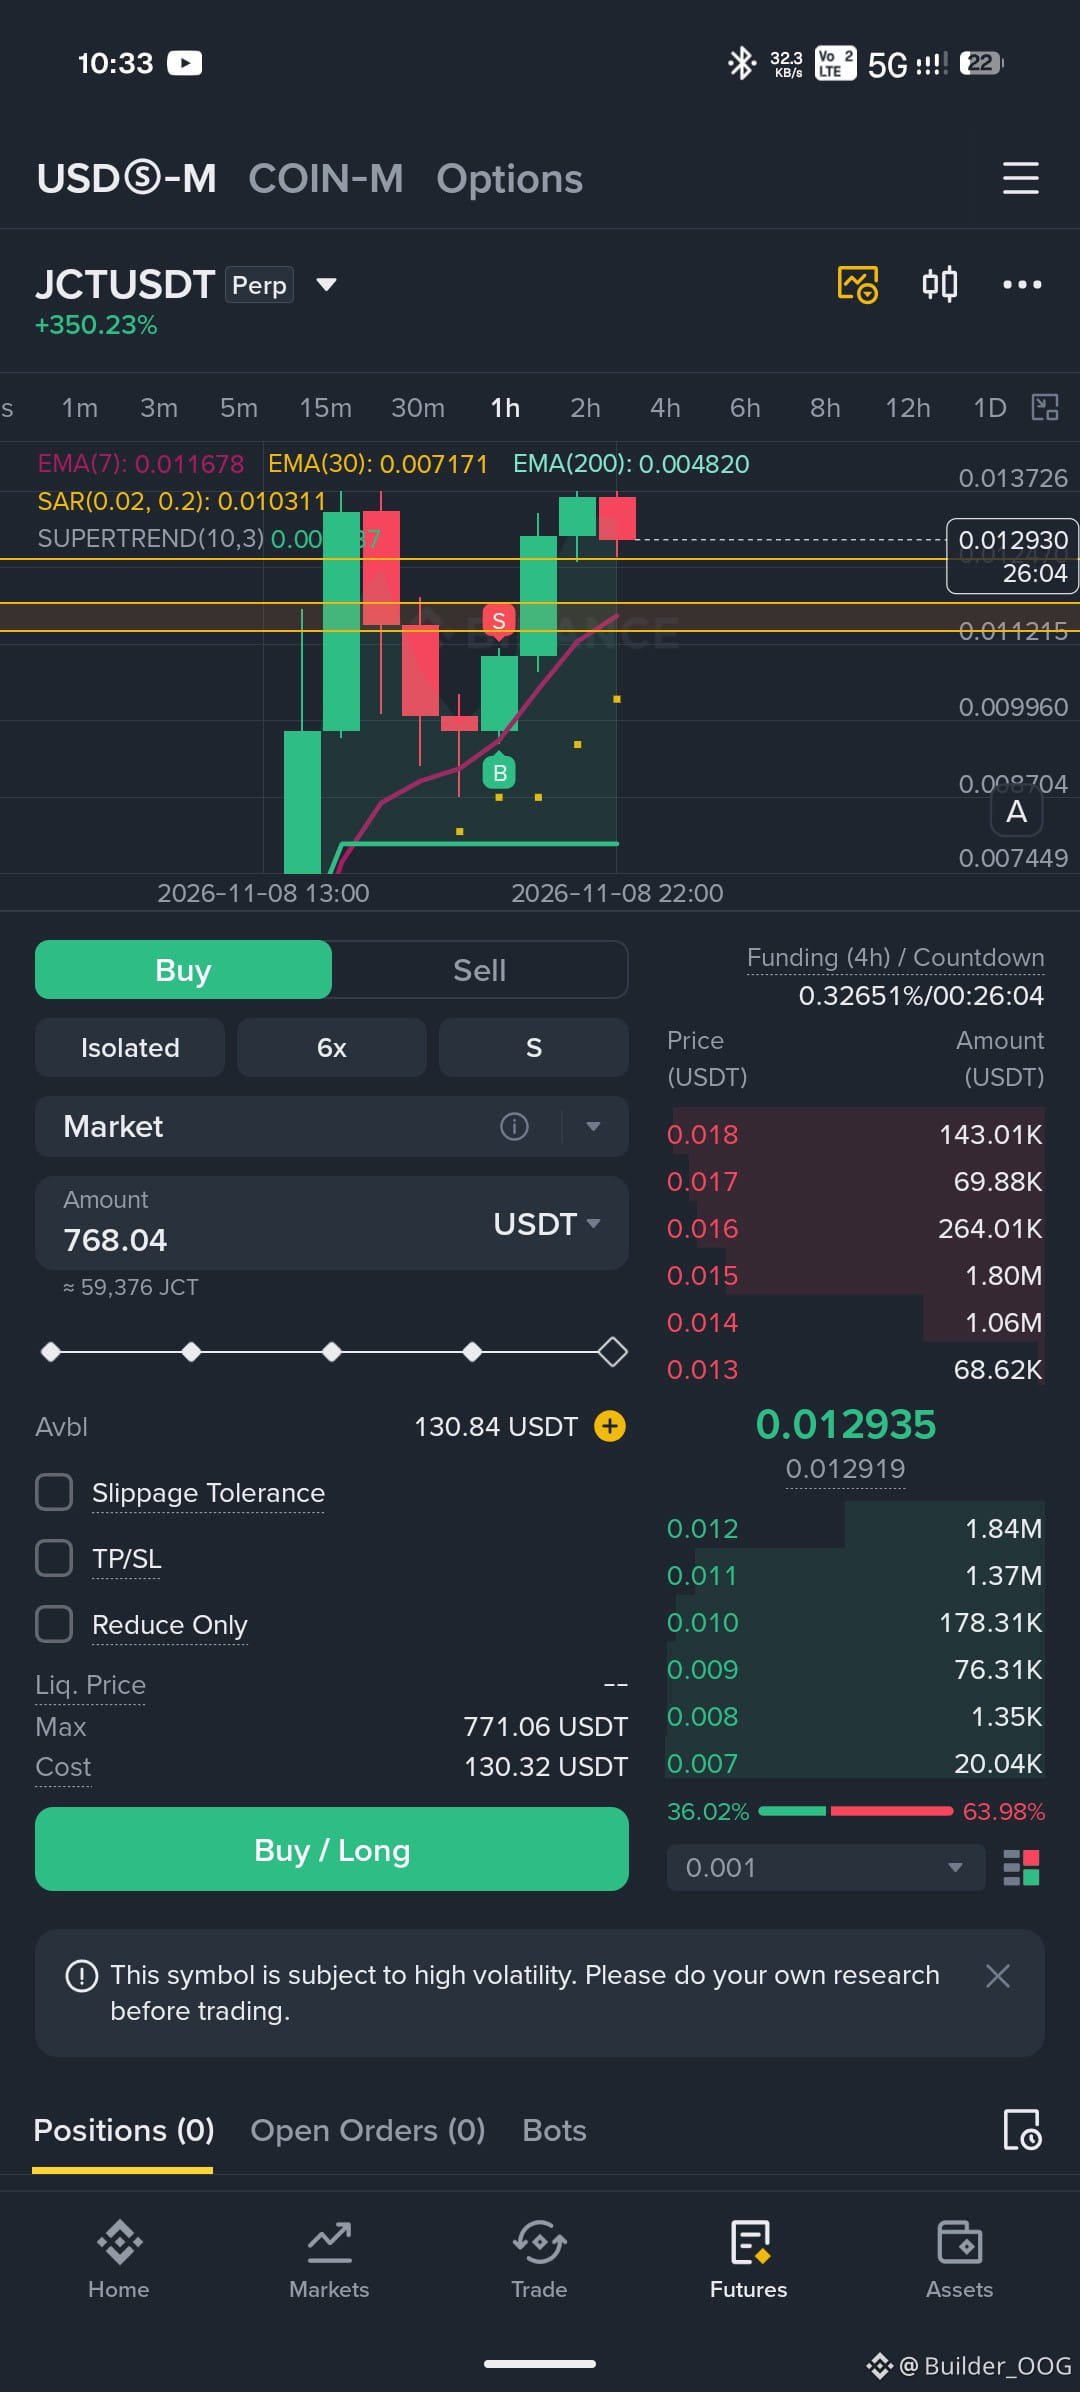
📊 JCTUSDT | 1H Market Analysis
🚀 Trend: Bullish
🟢 Support: 0.01210 – 0.01170
🔴 Resistance: 0.01330 – 0.01370
EMA, PSAR & Supertrend indicate bullish momentum. However, after a massive pump, a pullback is possible.
⚠️ Waiting for confirmation before entry. No FOMO, trade with discipline!
#JCTUSDT #CryptoTrading. #BinanceFutureSignal #TechnicalAnalysise #TradeSmart
📊 JCTUSDT | 1H Market Analysis
🚀 Trend: Bullish
🟢 Support: 0.01210 – 0.01170
🔴 Resistance: 0.01330 – 0.01370
EMA, PSAR & Supertrend indicate bullish momentum. However, after a massive pump, a pullback is possible.
⚠️ Waiting for confirmation before entry. No FOMO, trade with discipline!
#JCTUSDT #CryptoTrading. #BinanceFutureSignal #TechnicalAnalysise #TradeSmart
🚀 Trend: Bullish
🟢 Support: 0.01210 – 0.01170
🔴 Resistance: 0.01330 – 0.01370
EMA, PSAR & Supertrend indicate bullish momentum. However, after a massive pump, a pullback is possible.
⚠️ Waiting for confirmation before entry. No FOMO, trade with discipline!
#JCTUSDT #CryptoTrading. #BinanceFutureSignal #TechnicalAnalysise #TradeSmart
85

·
--
Bullish
📊 $ETC
Relief Bounce in Play?
After printing a local base around the 7.06–7.07 zone, $ETC is showing signs of life on the 1-hour chart, printing consecutive green candles and pushing back toward 7.13.
Support: 7.12 – 7.13 USDT
Immediate Resistance: 7.137 – 7.141 USDT order book wall
Target Zone: Eyes on a potential run back to 7.20 – 7.25 $USDT if buyers chew through current overhead supply.
Are you catching this bounce or waiting for a cleaner breakout? Let me know your levels below! 👇
#ETC #CryptoTrading #BinanceSquare #TechnicalAnalysise
{spot}(ETCUSDT)
📊 $ETC
Relief Bounce in Play?
After printing a local base around the 7.06–7.07 zone, $ETC is showing signs of life on the 1-hour chart, printing consecutive green candles and pushing back toward 7.13.
Support: 7.12 – 7.13 USDT
Immediate Resistance: 7.137 – 7.141 USDT order book wall
Target Zone: Eyes on a potential run back to 7.20 – 7.25 $USDT if buyers chew through current overhead supply.
Are you catching this bounce or waiting for a cleaner breakout? Let me know your levels below! 👇
#ETC #CryptoTrading #BinanceSquare #TechnicalAnalysise
Relief Bounce in Play?
After printing a local base around the 7.06–7.07 zone, $ETC is showing signs of life on the 1-hour chart, printing consecutive green candles and pushing back toward 7.13.
Support: 7.12 – 7.13 USDT
Immediate Resistance: 7.137 – 7.141 USDT order book wall
Target Zone: Eyes on a potential run back to 7.20 – 7.25 $USDT if buyers chew through current overhead supply.
Are you catching this bounce or waiting for a cleaner breakout? Let me know your levels below! 👇
#ETC #CryptoTrading #BinanceSquare #TechnicalAnalysise
159

·
--
$BTCUSDT — Bearish Continuation Setup | Futures Analysis
Bitcoin is showing bearish momentum after losing ground near the $80,000 psychological resistance. Sellers remain in control while BTC trades below the $79,000–$80,000 recovery zone.
A relief bounce into resistance could offer a realistic short opportunity, but chasing the current decline is not recommended.
EP: $79,000–$79,500
TP1: $78,000
TP2: $77,500
TP3: $76,800
SL: $80,000
The $78,000 area is an important nearby liquidity zone. A confirmed rejection near entry would support the bearish structure, while a sustained move above $80,000 would invalidate this setup. Wait for a pullback and seller confirmation before entering.
#BTC #Bitcoin #FuturesTrading #TechnicalAnalysise #HeYiSaysWithdrawalsExpectedtoResumeWithin42Hours $BTC
{future}(BTCUSDT)
$BTCUSDT — Bearish Continuation Setup | Futures Analysis
Bitcoin is showing bearish momentum after losing ground near the $80,000 psychological resistance. Sellers remain in control while BTC trades below the $79,000–$80,000 recovery zone.
A relief bounce into resistance could offer a realistic short opportunity, but chasing the current decline is not recommended.
EP: $79,000–$79,500
TP1: $78,000
TP2: $77,500
TP3: $76,800
SL: $80,000
The $78,000 area is an important nearby liquidity zone. A confirmed rejection near entry would support the bearish structure, while a sustained move above $80,000 would invalidate this setup. Wait for a pullback and seller confirmation before entering.
#BTC #Bitcoin #FuturesTrading #TechnicalAnalysise #HeYiSaysWithdrawalsExpectedtoResumeWithin42Hours $BTC
Bitcoin is showing bearish momentum after losing ground near the $80,000 psychological resistance. Sellers remain in control while BTC trades below the $79,000–$80,000 recovery zone.
A relief bounce into resistance could offer a realistic short opportunity, but chasing the current decline is not recommended.
EP: $79,000–$79,500
TP1: $78,000
TP2: $77,500
TP3: $76,800
SL: $80,000
The $78,000 area is an important nearby liquidity zone. A confirmed rejection near entry would support the bearish structure, while a sustained move above $80,000 would invalidate this setup. Wait for a pullback and seller confirmation before entering.
#BTC #Bitcoin #FuturesTrading #TechnicalAnalysise #HeYiSaysWithdrawalsExpectedtoResumeWithin42Hours $BTC
22

·
--
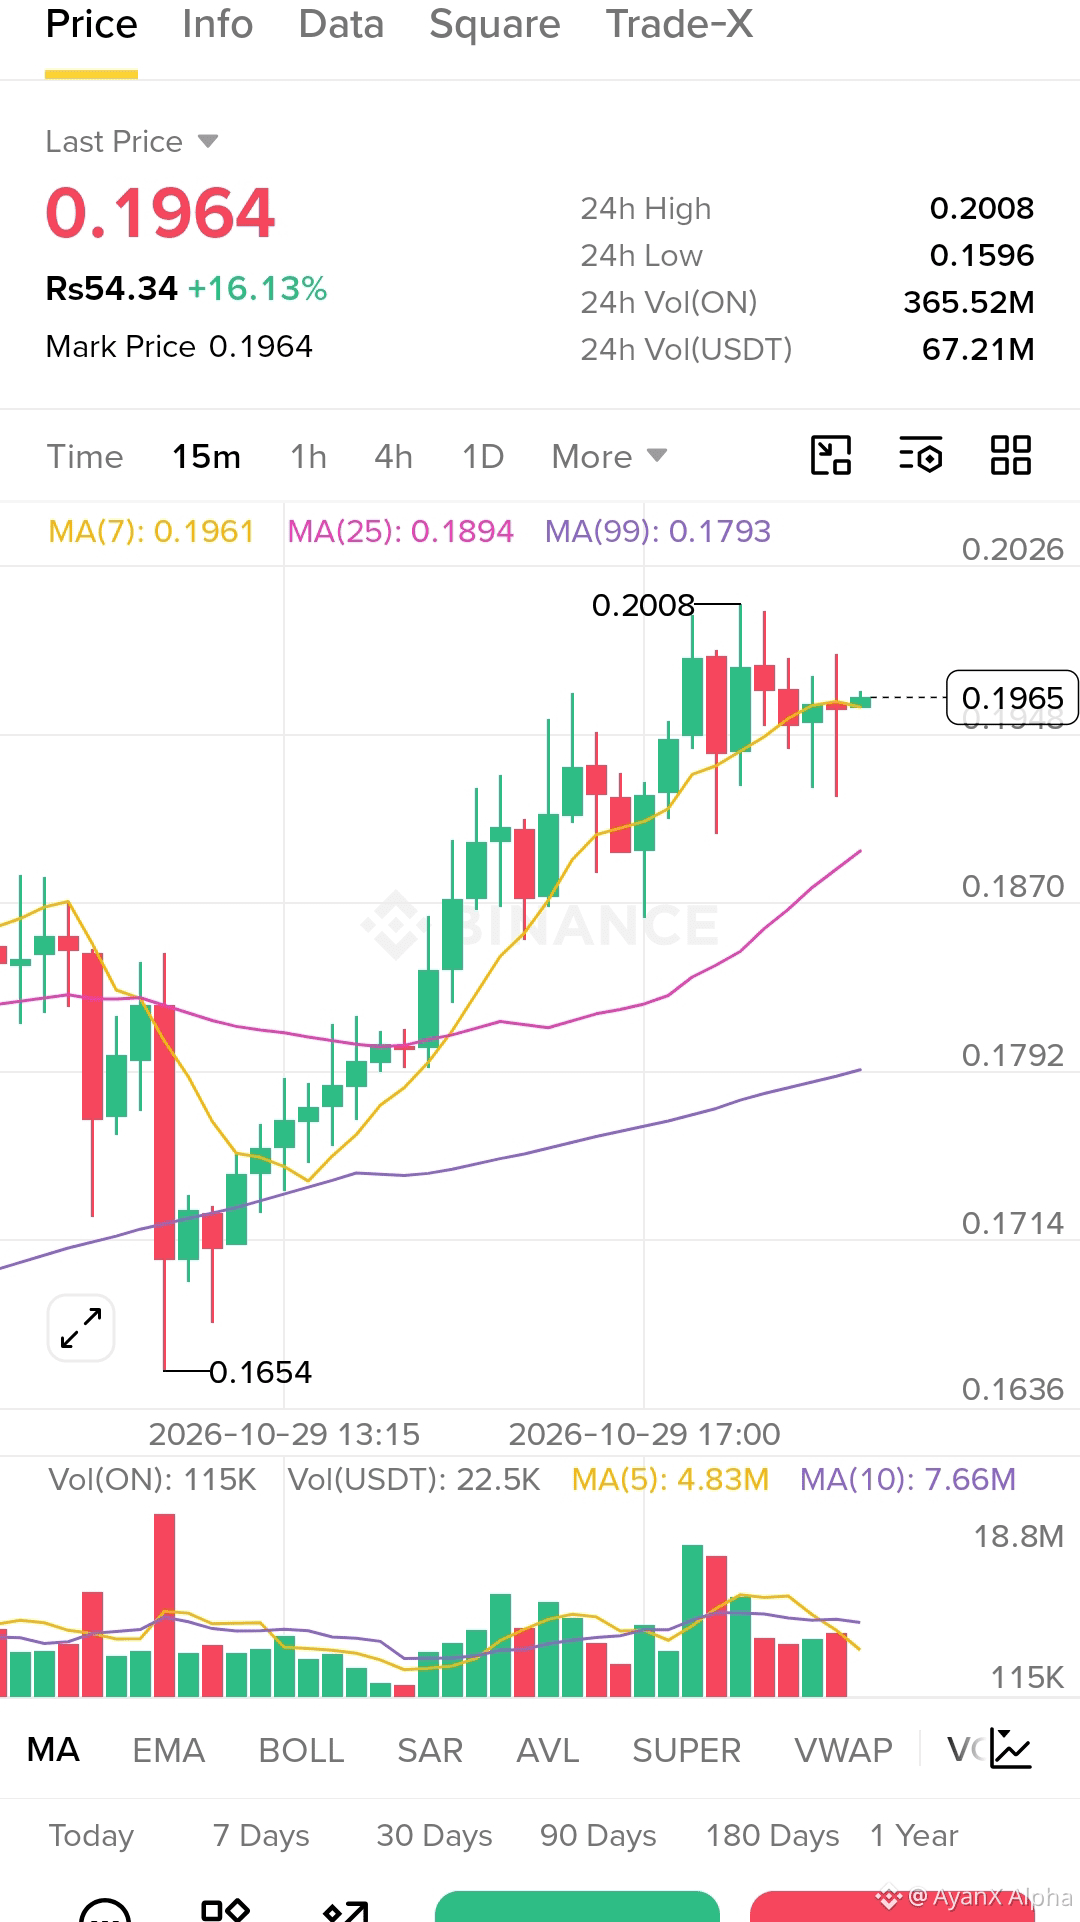
🚨 **$ON: BULLISH REVERSAL OR ANOTHER FAKEOUT? 📈**
$ON
{future}(ONUSDT)
$ON has shown strong volatility, and traders are watching for a potential breakout.
🎯 **Key Levels to Watch**
🟢 Entry zone: $0.1940–$0.1970 *(reclaim required)*
🎯 TP1: $0.2120
🎯 TP2: $0.2360
🚀 Final target: $0.2500
🛑 Stop-loss: $0.1700
**What confirms the setup?**
• A strong candle close above $0.2120
• Rising buying volume
• Successful breakout retest
⚠️ Don't chase the pump. Wait for confirmation and manage leverage carefully. 10x leverage can liquidate your position quickly.
👀 Can $ON reach $0.2500, or will sellers reject the breakout?
Follow **AyanX Alpha** for more crypto setups.
#ON #ONUSDT #CryptoTrading. #Altcoins #TechnicalAnalysise #AyanXAlpha
🚨 **$ON : BULLISH REVERSAL OR ANOTHER FAKEOUT? 📈**
$ON
$ON has shown strong volatility, and traders are watching for a potential breakout.
🎯 **Key Levels to Watch**
🟢 Entry zone: $0.1940–$0.1970 *(reclaim required)*
🎯 TP1: $0.2120
🎯 TP2: $0.2360
🚀 Final target: $0.2500
🛑 Stop-loss: $0.1700
**What confirms the setup?**
• A strong candle close above $0.2120
• Rising buying volume
• Successful breakout retest
⚠️ Don't chase the pump. Wait for confirmation and manage leverage carefully. 10x leverage can liquidate your position quickly.
👀 Can $ON reach $0.2500, or will sellers reject the breakout?
Follow **AyanX Alpha** for more crypto setups.
#ON #ONUSDT #CryptoTrading. #Altcoins #TechnicalAnalysise #AyanXAlpha
$ON
$ON has shown strong volatility, and traders are watching for a potential breakout.
🎯 **Key Levels to Watch**
🟢 Entry zone: $0.1940–$0.1970 *(reclaim required)*
🎯 TP1: $0.2120
🎯 TP2: $0.2360
🚀 Final target: $0.2500
🛑 Stop-loss: $0.1700
**What confirms the setup?**
• A strong candle close above $0.2120
• Rising buying volume
• Successful breakout retest
⚠️ Don't chase the pump. Wait for confirmation and manage leverage carefully. 10x leverage can liquidate your position quickly.
👀 Can $ON reach $0.2500, or will sellers reject the breakout?
Follow **AyanX Alpha** for more crypto setups.
#ON #ONUSDT #CryptoTrading. #Altcoins #TechnicalAnalysise #AyanXAlpha
307

·
--
Bearish
$BTC
{spot}(BTCUSDT)
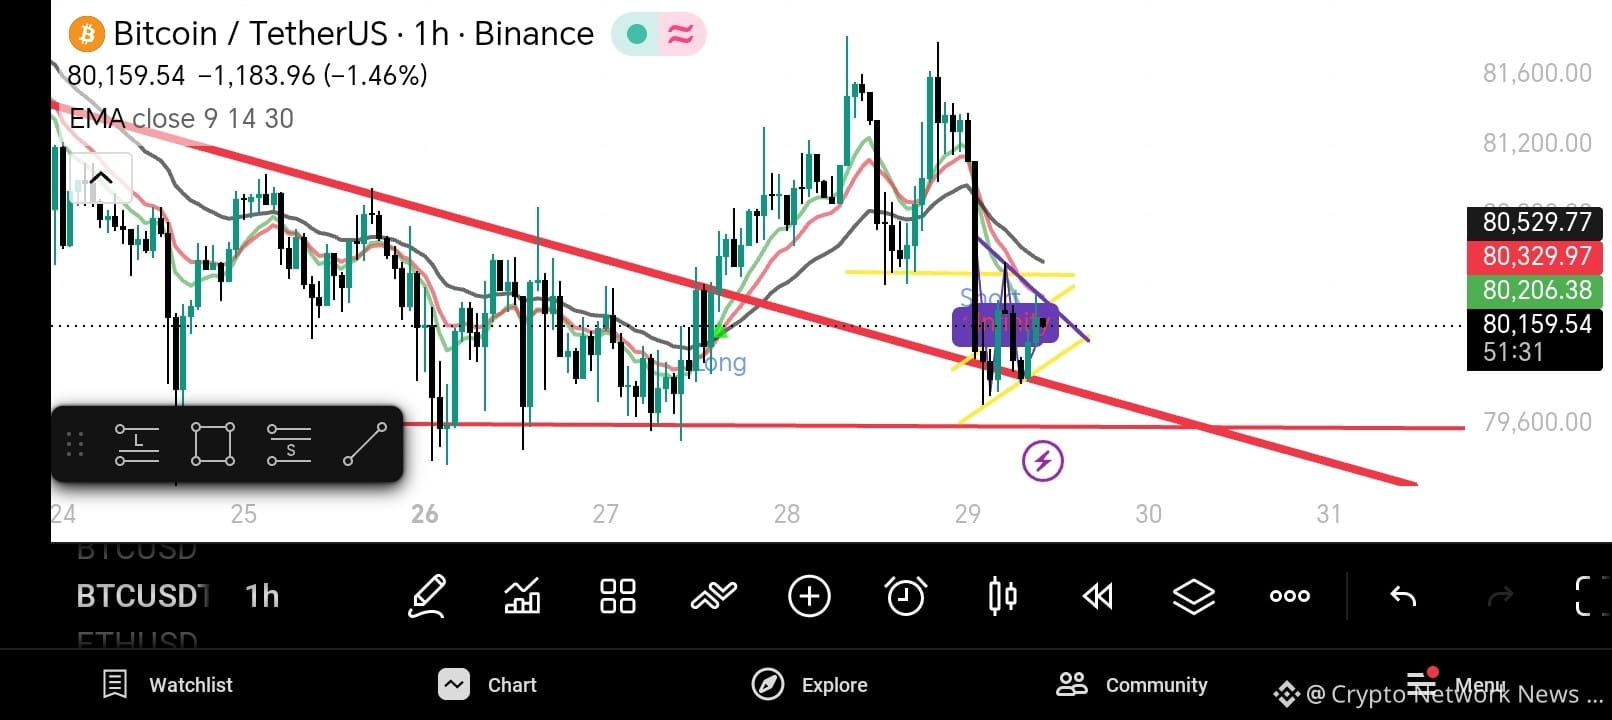
#BTC scalping
🚀 BTC Consolidation: Breakout or Retest Next? 📊
Bitcoin ($80,215) is compressing at a critical pivot zone. After facing rejection at the $84.5K–$85K ceiling, the market is locked in a tight tug-of-war.
⚡ The Technical Landscape
• Bull Target: A daily close above $80,900 opens the doors to $81,600 and $83,650.
• Bear Risk: Dropping below $79,400 support risks a cascading slide to $78,600 or the macro floor at $75.5K.
🔥 Core Fundamentals & High Volumes
• Leverage Building: A massive 10% surge in Derivatives Open Interest indicates heavy leveraged capital primed for a violent directional breakout.
• Institutional Backing: On-chain data shows steady spot ETF absorption and climbing network hash rates, keeping long-term structural demand incredibly strong.
• Macro Headwinds: Rising U.S. Treasury yields are acting as a temporary drag, cooling off immediate aggressive spot buying.
🔮 The Verdict: Keep a close eye on the $79.4K support and $80.9K resistance. Volume is building, and the next expansion move will be sharp.
#Bitcoin #BTC #CryptoAnalysis #BinanceSquare #TechnicalAnalysise
$BTC
#BTC scalping
🚀 BTC Consolidation: Breakout or Retest Next? 📊
Bitcoin ($80,215) is compressing at a critical pivot zone. After facing rejection at the $84.5K–$85K ceiling, the market is locked in a tight tug-of-war.
⚡ The Technical Landscape
• Bull Target: A daily close above $80,900 opens the doors to $81,600 and $83,650.
• Bear Risk: Dropping below $79,400 support risks a cascading slide to $78,600 or the macro floor at $75.5K.
🔥 Core Fundamentals & High Volumes
• Leverage Building: A massive 10% surge in Derivatives Open Interest indicates heavy leveraged capital primed for a violent directional breakout.
• Institutional Backing: On-chain data shows steady spot ETF absorption and climbing network hash rates, keeping long-term structural demand incredibly strong.
• Macro Headwinds: Rising U.S. Treasury yields are acting as a temporary drag, cooling off immediate aggressive spot buying.
🔮 The Verdict: Keep a close eye on the $79.4K support and $80.9K resistance. Volume is building, and the next expansion move will be sharp.
#Bitcoin #BTC #CryptoAnalysis #BinanceSquare #TechnicalAnalysise
#BTC scalping
🚀 BTC Consolidation: Breakout or Retest Next? 📊
Bitcoin ($80,215) is compressing at a critical pivot zone. After facing rejection at the $84.5K–$85K ceiling, the market is locked in a tight tug-of-war.
⚡ The Technical Landscape
• Bull Target: A daily close above $80,900 opens the doors to $81,600 and $83,650.
• Bear Risk: Dropping below $79,400 support risks a cascading slide to $78,600 or the macro floor at $75.5K.
🔥 Core Fundamentals & High Volumes
• Leverage Building: A massive 10% surge in Derivatives Open Interest indicates heavy leveraged capital primed for a violent directional breakout.
• Institutional Backing: On-chain data shows steady spot ETF absorption and climbing network hash rates, keeping long-term structural demand incredibly strong.
• Macro Headwinds: Rising U.S. Treasury yields are acting as a temporary drag, cooling off immediate aggressive spot buying.
🔮 The Verdict: Keep a close eye on the $79.4K support and $80.9K resistance. Volume is building, and the next expansion move will be sharp.
#Bitcoin #BTC #CryptoAnalysis #BinanceSquare #TechnicalAnalysise
1
2
120

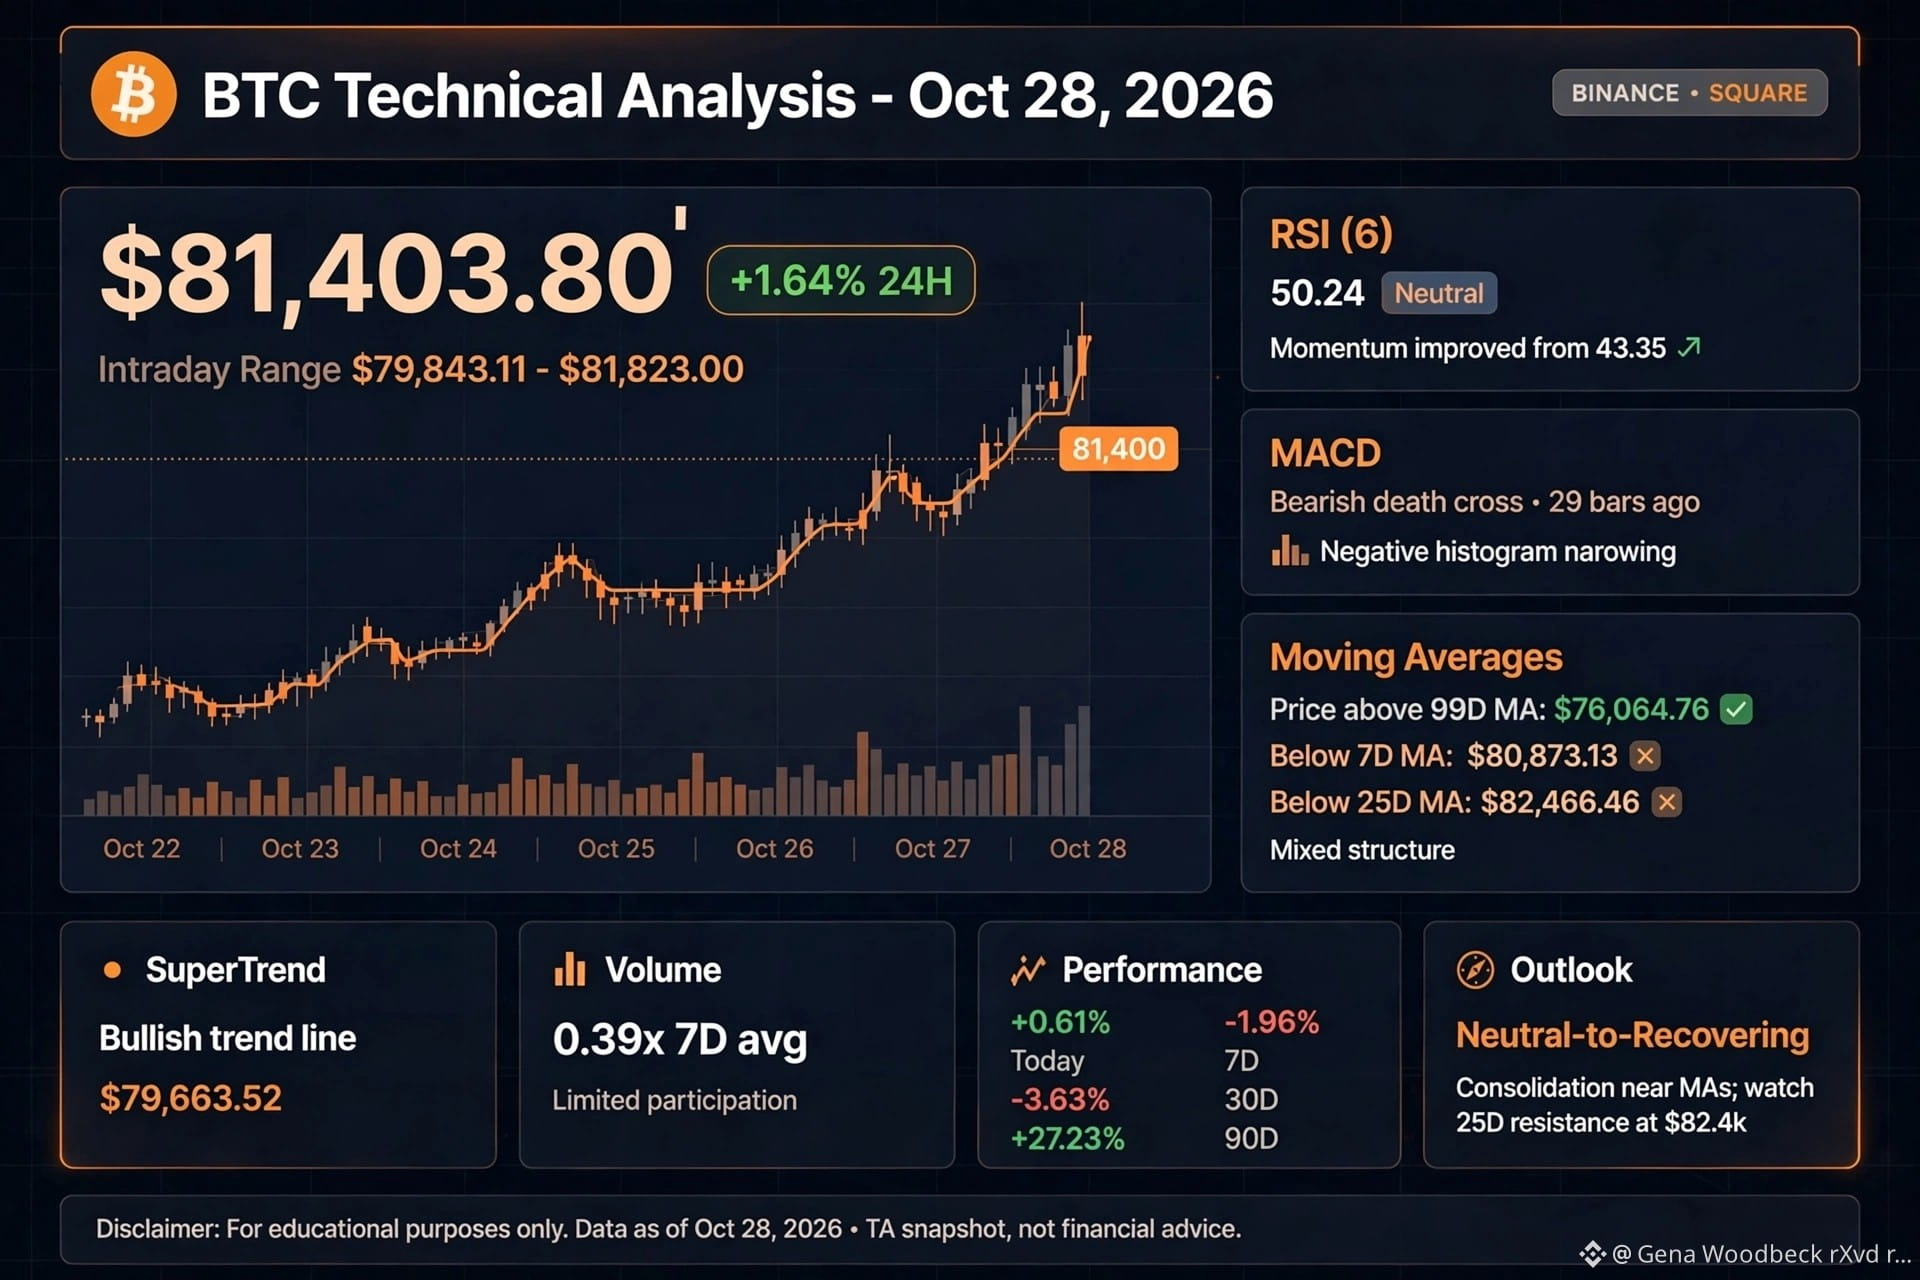
BTC Technical Analysis - Oct 28, 2026 | $81,403.80 (+1.64%)
As of 2026-10-28: BTC trading at $81,403.80, intraday $79,843.11–$81,823.00.
RSI(6): 50.24 — Neutral. Momentum improved from 43.35, not overbought.
MACD: Bearish, death cross 29 bars ago. Negative histogram narrowing — downside momentum easing but not yet positive.
MAs: Price above 99D MA ($76,064.76) but below 7D ($80,873.13) and 25D ($82,466.46). Mixed structure: longer-term support intact, short-term recovery being tested.
SuperTrend: Bullish, trend line $79,663.52.
Volume: 0.39x 7D avg — rebound has limited participation.
Performance: +0.61% Today, -1.96% 7D, -3.63% 30D, +27.23% 90D.
Outlook: Neutral-to-recovering, not decisively bullish. Need stronger volume for confirmation. Hold above $79,663.52 SuperTrend support key; break below increases downside pressure. Watch $82,466 25D MA as resistance.
Not financial advice. DYOR.
#BTC #Bitcoin #TechnicalAnalysise #writetoearn #writetoernBinance #write2earnonbinancesquare #BTC🔥🔥🔥🔥🔥 $BTC $BTC
{spot}(BTCUSDT)
BTC Technical Analysis - Oct 28, 2026 | $81,403.80 (+1.64%)
As of 2026-10-28: BTC trading at $81,403.80, intraday $79,843.11–$81,823.00.
RSI(6): 50.24 — Neutral. Momentum improved from 43.35, not overbought.
MACD: Bearish, death cross 29 bars ago. Negative histogram narrowing — downside momentum easing but not yet positive.
MAs: Price above 99D MA ($76,064.76) but below 7D ($80,873.13) and 25D ($82,466.46). Mixed structure: longer-term support intact, short-term recovery being tested.
SuperTrend: Bullish, trend line $79,663.52.
Volume: 0.39x 7D avg — rebound has limited participation.
Performance: +0.61% Today, -1.96% 7D, -3.63% 30D, +27.23% 90D.
Outlook: Neutral-to-recovering, not decisively bullish. Need stronger volume for confirmation. Hold above $79,663.52 SuperTrend support key; break below increases downside pressure. Watch $82,466 25D MA as resistance.
Not financial advice. DYOR.
#BTC #Bitcoin #TechnicalAnalysise #writetoearn #writetoernBinance #write2earnonbinancesquare #BTC🔥🔥🔥🔥🔥 $BTC $BTC
As of 2026-10-28: BTC trading at $81,403.80, intraday $79,843.11–$81,823.00.
RSI(6): 50.24 — Neutral. Momentum improved from 43.35, not overbought.
MACD: Bearish, death cross 29 bars ago. Negative histogram narrowing — downside momentum easing but not yet positive.
MAs: Price above 99D MA ($76,064.76) but below 7D ($80,873.13) and 25D ($82,466.46). Mixed structure: longer-term support intact, short-term recovery being tested.
SuperTrend: Bullish, trend line $79,663.52.
Volume: 0.39x 7D avg — rebound has limited participation.
Performance: +0.61% Today, -1.96% 7D, -3.63% 30D, +27.23% 90D.
Outlook: Neutral-to-recovering, not decisively bullish. Need stronger volume for confirmation. Hold above $79,663.52 SuperTrend support key; break below increases downside pressure. Watch $82,466 25D MA as resistance.
Not financial advice. DYOR.
#BTC #Bitcoin #TechnicalAnalysise #writetoearn #writetoernBinance #write2earnonbinancesquare #BTC🔥🔥🔥🔥🔥 $BTC $BTC
76

·
--
₿ BTC at $80,376: What's Happening at This Level?
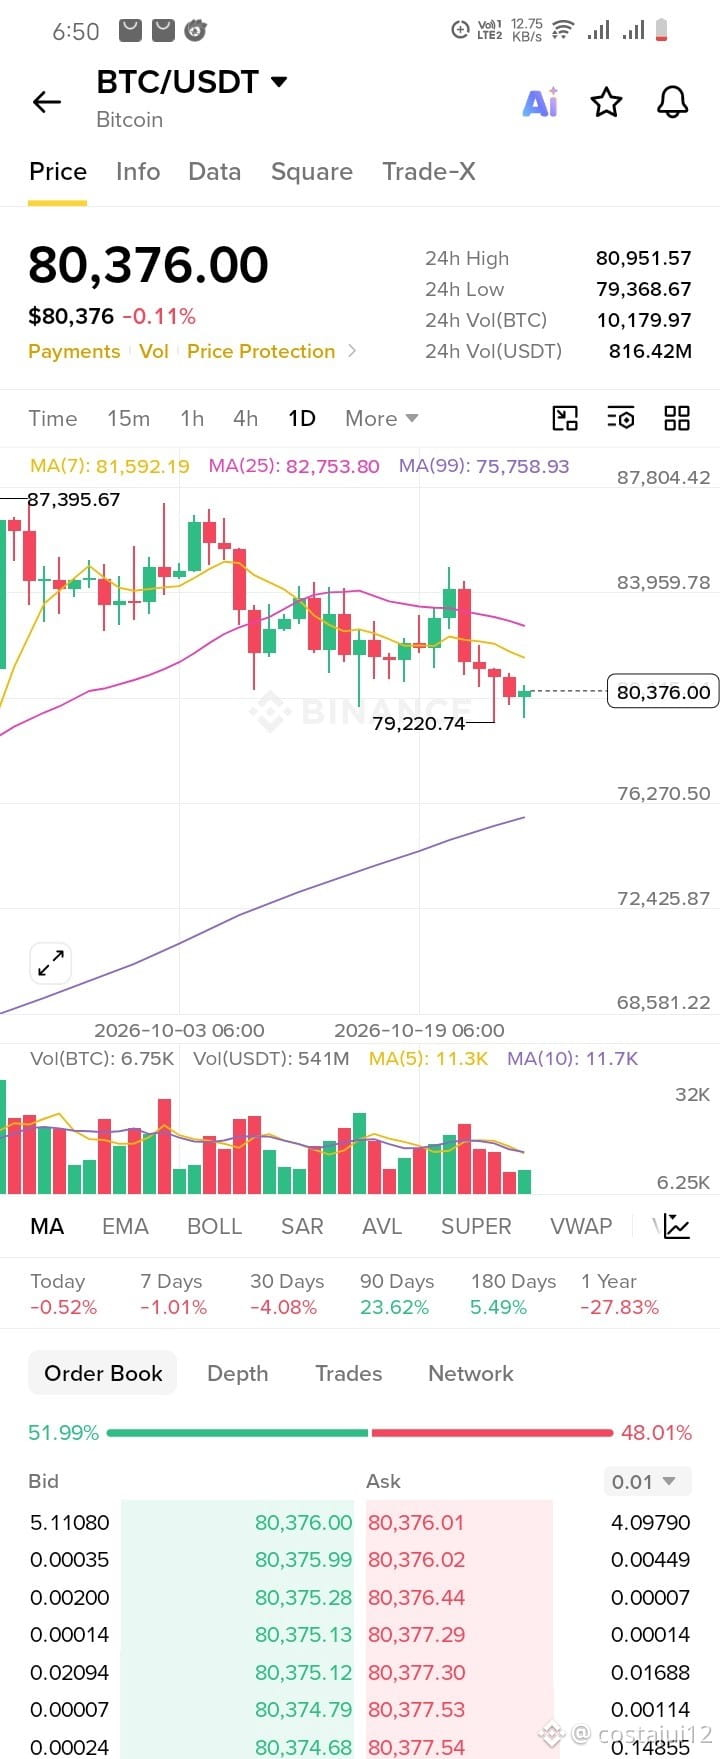
Bitcoin is trading at $80,376 right now, down 0.11% in 24 hours. Let's break down the chart:
📊 Price Range (24h)
High: $80,951
Low: $79,368
Volume: about 10,180 BTC (≈ $816M)
📉 Trend Analysis
On the daily chart, price is below MA(7) at $81,592 and MA(25) at $82,753, which means there is significant short-term pressure.
However, price is well above MA(99) at $75,758, so the larger trend is still intact.
Recent support zone: around $79,200.
Resistance: $81,500 – $82,700 (the MA line area).
⏳ Performance
7 Days: -1.01%
30 Days: -4.08%
90 Days: +23.62%
1 Year: -27.83%
⚖️ Order Book
Bid 51.99% vs Ask 48.01%. Buyers have a slight edge, but the gap is very small, so the market is currently undecided.
🎯 My View
If price holds the $79,200 support, a rebound is possible. If it breaks, keep an eye on the next support level. Reclaiming MA(7) could bring momentum back.
⚠️ Disclaimer: This is not financial advice, just personal analysis. Always do your own research (DYOR) and follow proper risk management before trading.
What's your take on BTC's next move? 🐂 or 🐻? Let me know in the comments 👇
#BTC #bitcoin #BinanceSquare #TechnicalAnalysise #writetoearn
$BTC $USDT $BNB
{spot}(BTCUSDT)
{spot}(BNBUSDT)
{future}(USDCUSDT)
₿ BTC at $80,376: What's Happening at This Level?
Bitcoin is trading at $80,376 right now, down 0.11% in 24 hours. Let's break down the chart:
📊 Price Range (24h)
High: $80,951
Low: $79,368
Volume: about 10,180 BTC (≈ $816M)
📉 Trend Analysis
On the daily chart, price is below MA(7) at $81,592 and MA(25) at $82,753, which means there is significant short-term pressure.
However, price is well above MA(99) at $75,758, so the larger trend is still intact.
Recent support zone: around $79,200.
Resistance: $81,500 – $82,700 (the MA line area).
⏳ Performance
7 Days: -1.01%
30 Days: -4.08%
90 Days: +23.62%
1 Year: -27.83%
⚖️ Order Book
Bid 51.99% vs Ask 48.01%. Buyers have a slight edge, but the gap is very small, so the market is currently undecided.
🎯 My View
If price holds the $79,200 support, a rebound is possible. If it breaks, keep an eye on the next support level. Reclaiming MA(7) could bring momentum back.
⚠️ Disclaimer: This is not financial advice, just personal analysis. Always do your own research (DYOR) and follow proper risk management before trading.
What's your take on BTC's next move? 🐂 or 🐻? Let me know in the comments 👇
#BTC #bitcoin #BinanceSquare #TechnicalAnalysise #writetoearn
$BTC $USDT $BNB
Bitcoin is trading at $80,376 right now, down 0.11% in 24 hours. Let's break down the chart:
📊 Price Range (24h)
High: $80,951
Low: $79,368
Volume: about 10,180 BTC (≈ $816M)
📉 Trend Analysis
On the daily chart, price is below MA(7) at $81,592 and MA(25) at $82,753, which means there is significant short-term pressure.
However, price is well above MA(99) at $75,758, so the larger trend is still intact.
Recent support zone: around $79,200.
Resistance: $81,500 – $82,700 (the MA line area).
⏳ Performance
7 Days: -1.01%
30 Days: -4.08%
90 Days: +23.62%
1 Year: -27.83%
⚖️ Order Book
Bid 51.99% vs Ask 48.01%. Buyers have a slight edge, but the gap is very small, so the market is currently undecided.
🎯 My View
If price holds the $79,200 support, a rebound is possible. If it breaks, keep an eye on the next support level. Reclaiming MA(7) could bring momentum back.
⚠️ Disclaimer: This is not financial advice, just personal analysis. Always do your own research (DYOR) and follow proper risk management before trading.
What's your take on BTC's next move? 🐂 or 🐻? Let me know in the comments 👇
#BTC #bitcoin #BinanceSquare #TechnicalAnalysise #writetoearn
$BTC $USDT $BNB
6
84
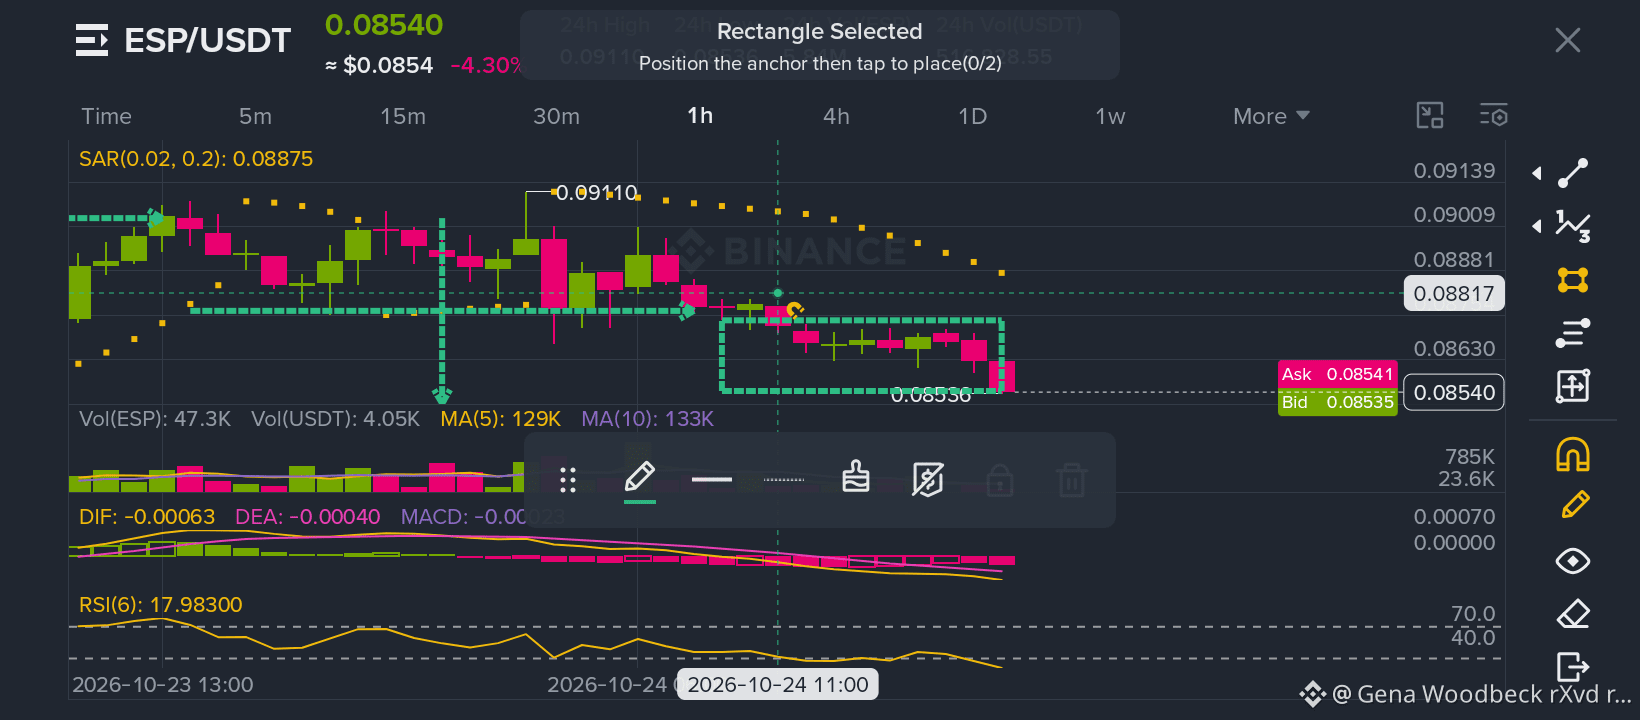
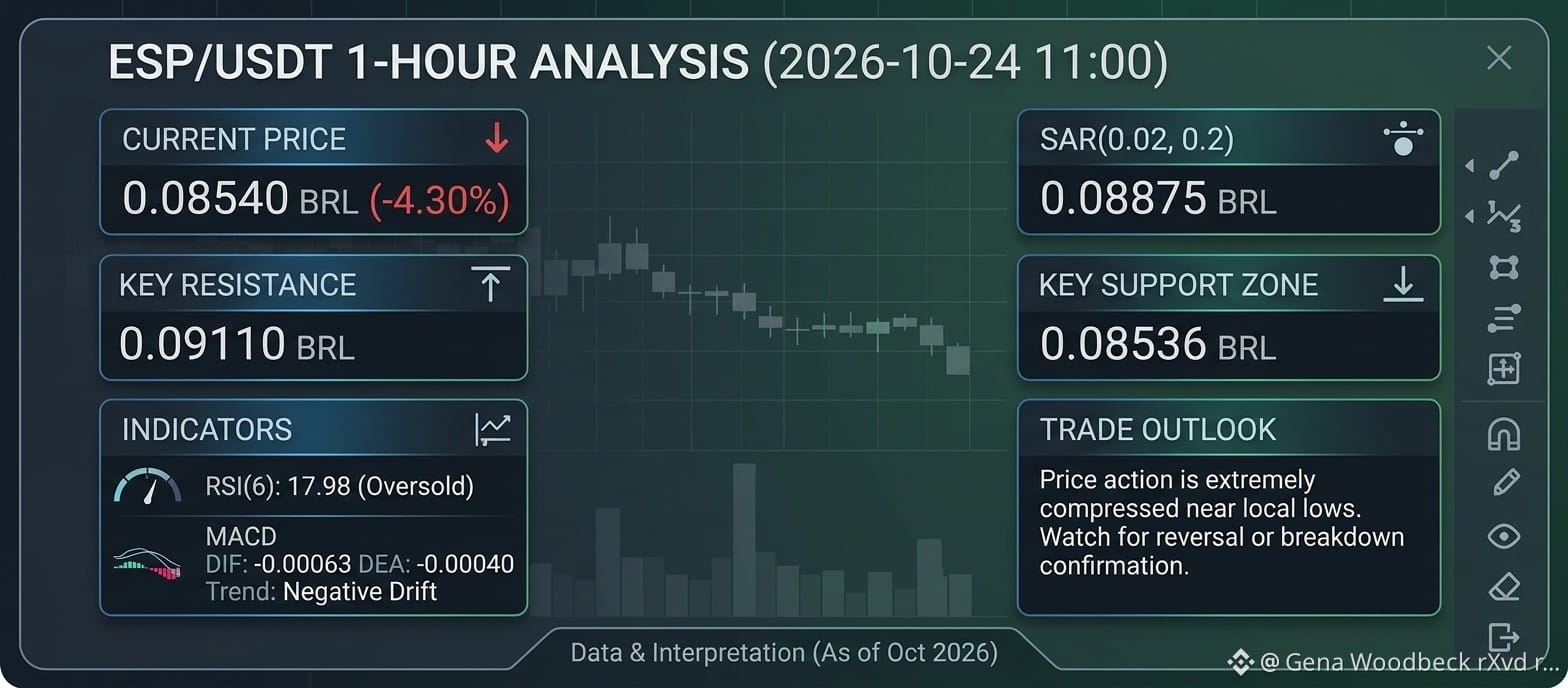
ESP/USDT 1-Hour Chart Update 📊 Price testing key support at 0.08536! RSI is highly oversold. Check out the clean technical indicators and market structure in the image below. 👇
#BinanceSquareTurkey #Write2Earn #ESPUSDT #CryptoTrading #TechnicalAnalysise #write2earnonbinancesquare #writetoearn #ESPUSDT $ESP
{spot}(ESPUSDT)
ESP/USDT 1-Hour Chart Update 📊 Price testing key support at 0.08536! RSI is highly oversold. Check out the clean technical indicators and market structure in the image below. 👇
#BinanceSquareTurkey #Write2Earn #ESPUSDT #CryptoTrading #TechnicalAnalysise #write2earnonbinancesquare #writetoearn #ESPUSDT $ESP
#BinanceSquareTurkey #Write2Earn #ESPUSDT #CryptoTrading #TechnicalAnalysise #write2earnonbinancesquare #writetoearn #ESPUSDT $ESP
106

·
--
📉 BINANCE TRADING | ETH/USDT
🐻 Plan Your Trade. Execute with Discipline.
Successful trading starts with a clear strategy and proper risk management.
📊 Trading Analysis:
- Trading Pair: ETH/USDT
- Direction: Short (Sell)
- Entry Price: 4,523 USDT
- Exit Price: 4,472 USDT
- Illustrative Profit: +1.13%
💡 Trading Tip: Never enter a trade based on emotions. Study price movements and establish your entry and exit levels before trading.
Trade with a plan, not with emotions.
#Binance #Ethereum #ETH #CryptoMarket #TradingStrategy #TechnicalAnalysise #FedWatch
📉 BINANCE TRADING | ETH/USDT
🐻 Plan Your Trade. Execute with Discipline.
Successful trading starts with a clear strategy and proper risk management.
📊 Trading Analysis:
- Trading Pair: ETH/USDT
- Direction: Short (Sell)
- Entry Price: 4,523 USDT
- Exit Price: 4,472 USDT
- Illustrative Profit: +1.13%
💡 Trading Tip: Never enter a trade based on emotions. Study price movements and establish your entry and exit levels before trading.
Trade with a plan, not with emotions.
#Binance #Ethereum #ETH #CryptoMarket #TradingStrategy #TechnicalAnalysise #FedWatch
🐻 Plan Your Trade. Execute with Discipline.
Successful trading starts with a clear strategy and proper risk management.
📊 Trading Analysis:
- Trading Pair: ETH/USDT
- Direction: Short (Sell)
- Entry Price: 4,523 USDT
- Exit Price: 4,472 USDT
- Illustrative Profit: +1.13%
💡 Trading Tip: Never enter a trade based on emotions. Study price movements and establish your entry and exit levels before trading.
Trade with a plan, not with emotions.
#Binance #Ethereum #ETH #CryptoMarket #TradingStrategy #TechnicalAnalysise #FedWatch
56

·
--
Article
MUBARAK (MUBARAK/USDT) Faces Strong Selling Pressure – Is a Recovery Coming?MUBARAK ($MUBARAK /USDT) Faces Strong Selling Pressure – Is a Recovery Coming?
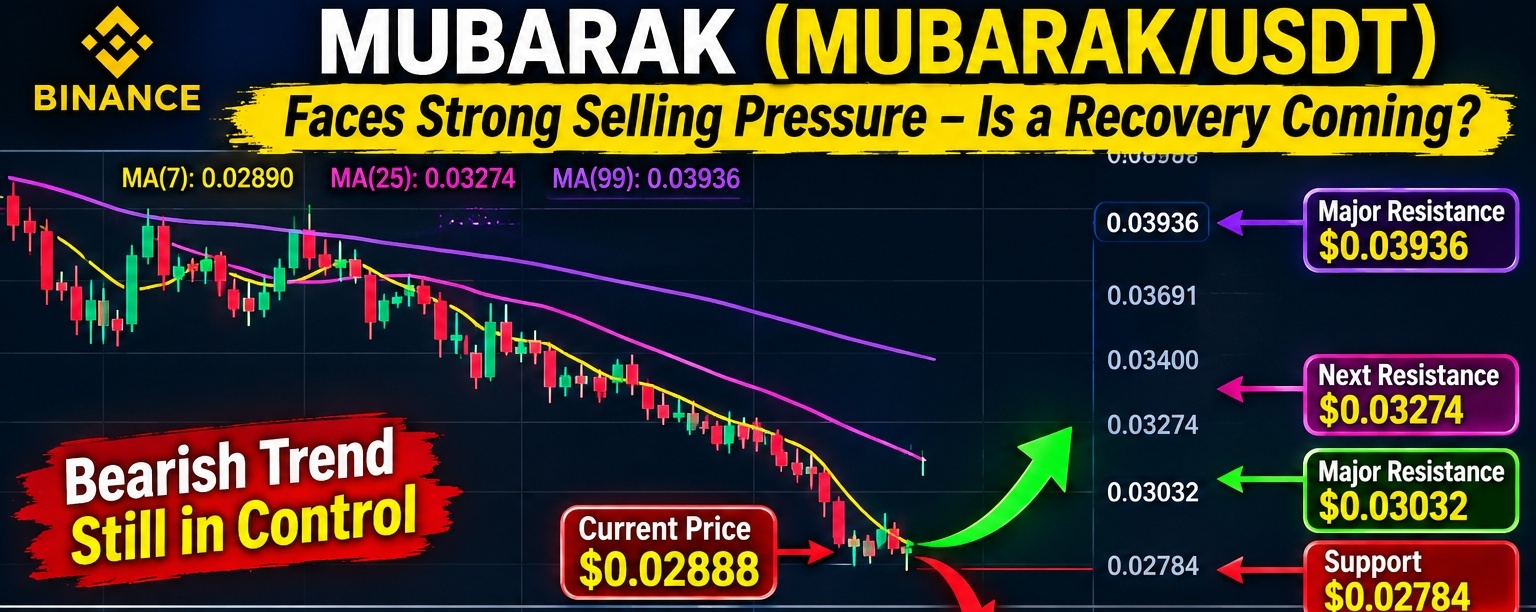
MUBARAK/USDT is currently trading around $0.02888, showing continued weakness on the 4-hour chart. The token has experienced significant selling pressure, and traders are closely watching whether buyers can defend the current support zone.
Market Analysis
The current chart shows a clear bearish trend. The price is trading below the MA(25) at $0.03274 and MA(99) at $0.03936, indicating that sellers remain in control of the broader trend.
The RSI(6) is around 26.54, suggesting that the market is in an oversold region. This could create an opportunity for a short-term recovery, but it does not guarantee a bullish reversal.
Important Price Levels
- Current Price: $0.02888
- Immediate Support: $0.02784
- Major Resistance: $0.03032
- Next Resistance: $0.03274
- Major Resistance: $0.03936
What Should Traders Watch?
If MUBARAK holds above $0.02784 and buying volume increases, a recovery toward $0.03032 could become possible.
However, if the price breaks below $0.02784 with strong selling volume, further downside pressure may follow.
Traders should wait for confirmation through candle patterns and trading volume rather than entering a position based only on the RSI.
{spot}(MUBARAKUSDT)
Final Thoughts
MUBARAK is currently facing a challenging market situation, but the oversold RSI makes the next price movement important to watch. A confirmed recovery could attract short-term buyers, while a breakdown below support could increase selling pressure.
Trade Smart: Watch support, resistance, volume, and confirmation before making any trading decision. Protect your capital and never risk more than you can afford to lose.
#MUBARAK #MUBARAKUSDT #Binance #CryptoAnalysis #Altcoins #TrendingTopic Strategy #TechnicalAnalysise
MUBARAK (MUBARAK/USDT) Faces Strong Selling Pressure – Is a Recovery Coming?
MUBARAK ($MUBARAK /USDT) Faces Strong Selling Pressure – Is a Recovery Coming?
MUBARAK/USDT is currently trading around $0.02888, showing continued weakness on the 4-hour chart. The token has experienced significant selling pressure, and traders are closely watching whether buyers can defend the current support zone.
Market Analysis
The current chart shows a clear bearish trend. The price is trading below the MA(25) at $0.03274 and MA(99) at $0.03936, indicating that sellers remain in control of the broader trend.
The RSI(6) is around 26.54, suggesting that the market is in an oversold region. This could create an opportunity for a short-term recovery, but it does not guarantee a bullish reversal.
Important Price Levels
- Current Price: $0.02888
- Immediate Support: $0.02784
- Major Resistance: $0.03032
- Next Resistance: $0.03274
- Major Resistance: $0.03936
What Should Traders Watch?
If MUBARAK holds above $0.02784 and buying volume increases, a recovery toward $0.03032 could become possible.
However, if the price breaks below $0.02784 with strong selling volume, further downside pressure may follow.
Traders should wait for confirmation through candle patterns and trading volume rather than entering a position based only on the RSI.
Final Thoughts
MUBARAK is currently facing a challenging market situation, but the oversold RSI makes the next price movement important to watch. A confirmed recovery could attract short-term buyers, while a breakdown below support could increase selling pressure.
Trade Smart: Watch support, resistance, volume, and confirmation before making any trading decision. Protect your capital and never risk more than you can afford to lose.
#MUBARAK #MUBARAKUSDT #Binance #CryptoAnalysis #Altcoins #TrendingTopic Strategy #TechnicalAnalysise
MUBARAK/USDT is currently trading around $0.02888, showing continued weakness on the 4-hour chart. The token has experienced significant selling pressure, and traders are closely watching whether buyers can defend the current support zone.
Market Analysis
The current chart shows a clear bearish trend. The price is trading below the MA(25) at $0.03274 and MA(99) at $0.03936, indicating that sellers remain in control of the broader trend.
The RSI(6) is around 26.54, suggesting that the market is in an oversold region. This could create an opportunity for a short-term recovery, but it does not guarantee a bullish reversal.
Important Price Levels
- Current Price: $0.02888
- Immediate Support: $0.02784
- Major Resistance: $0.03032
- Next Resistance: $0.03274
- Major Resistance: $0.03936
What Should Traders Watch?
If MUBARAK holds above $0.02784 and buying volume increases, a recovery toward $0.03032 could become possible.
However, if the price breaks below $0.02784 with strong selling volume, further downside pressure may follow.
Traders should wait for confirmation through candle patterns and trading volume rather than entering a position based only on the RSI.
Final Thoughts
MUBARAK is currently facing a challenging market situation, but the oversold RSI makes the next price movement important to watch. A confirmed recovery could attract short-term buyers, while a breakdown below support could increase selling pressure.
Trade Smart: Watch support, resistance, volume, and confirmation before making any trading decision. Protect your capital and never risk more than you can afford to lose.
#MUBARAK #MUBARAKUSDT #Binance #CryptoAnalysis #Altcoins #TrendingTopic Strategy #TechnicalAnalysise
1
459

·
--
Bearish
🚨 $ETH – Critical Price Zone! Will Bulls Recover or Bears Push Lower?
Ethereum is facing strong selling pressure after breaking below its $2,200–$2,240 base.
📉 Current Market Structure
- Previous High: $2,449.95
- Sell-Side Liquidity Sweep: $2,050.32
- Current Imbalance Zone: $2,150–$2,225
- Price remains below both EMAs.
🟡 Key Resistance & Supply
The $2,230–$2,245 zone represents the Order Block formed by the final bullish candles before the major drop.
A rejection from this area could put $2,050.32 back in focus.
🟢 What Could Change the Trend?
A confirmed close above $2,260 could signal a shift in market structure, reclaiming supply and breaking the lower-high sequence.
👀 Two Levels to Watch:
- $2,245 retest first?
- Or another liquidity sweep toward $2,050?
Which scenario do you think comes next?
📩 More market reads like this are shared daily in my group. Find the access link in my bio!
#ETH #Ethereum #altcoinseason #PriceAnalysis #TechnicalAnalysise
🚨 $ETH – Critical Price Zone! Will Bulls Recover or Bears Push Lower?
Ethereum is facing strong selling pressure after breaking below its $2,200–$2,240 base.
📉 Current Market Structure
- Previous High: $2,449.95
- Sell-Side Liquidity Sweep: $2,050.32
- Current Imbalance Zone: $2,150–$2,225
- Price remains below both EMAs.
🟡 Key Resistance & Supply
The $2,230–$2,245 zone represents the Order Block formed by the final bullish candles before the major drop.
A rejection from this area could put $2,050.32 back in focus.
🟢 What Could Change the Trend?
A confirmed close above $2,260 could signal a shift in market structure, reclaiming supply and breaking the lower-high sequence.
👀 Two Levels to Watch:
- $2,245 retest first?
- Or another liquidity sweep toward $2,050?
Which scenario do you think comes next?
📩 More market reads like this are shared daily in my group. Find the access link in my bio!
#ETH #Ethereum #altcoinseason #PriceAnalysis #TechnicalAnalysise
Ethereum is facing strong selling pressure after breaking below its $2,200–$2,240 base.
📉 Current Market Structure
- Previous High: $2,449.95
- Sell-Side Liquidity Sweep: $2,050.32
- Current Imbalance Zone: $2,150–$2,225
- Price remains below both EMAs.
🟡 Key Resistance & Supply
The $2,230–$2,245 zone represents the Order Block formed by the final bullish candles before the major drop.
A rejection from this area could put $2,050.32 back in focus.
🟢 What Could Change the Trend?
A confirmed close above $2,260 could signal a shift in market structure, reclaiming supply and breaking the lower-high sequence.
👀 Two Levels to Watch:
- $2,245 retest first?
- Or another liquidity sweep toward $2,050?
Which scenario do you think comes next?
📩 More market reads like this are shared daily in my group. Find the access link in my bio!
#ETH #Ethereum #altcoinseason #PriceAnalysis #TechnicalAnalysise

167
·
--
Bullish
📊 **JCT/USDT – 4H Technical Analysis**
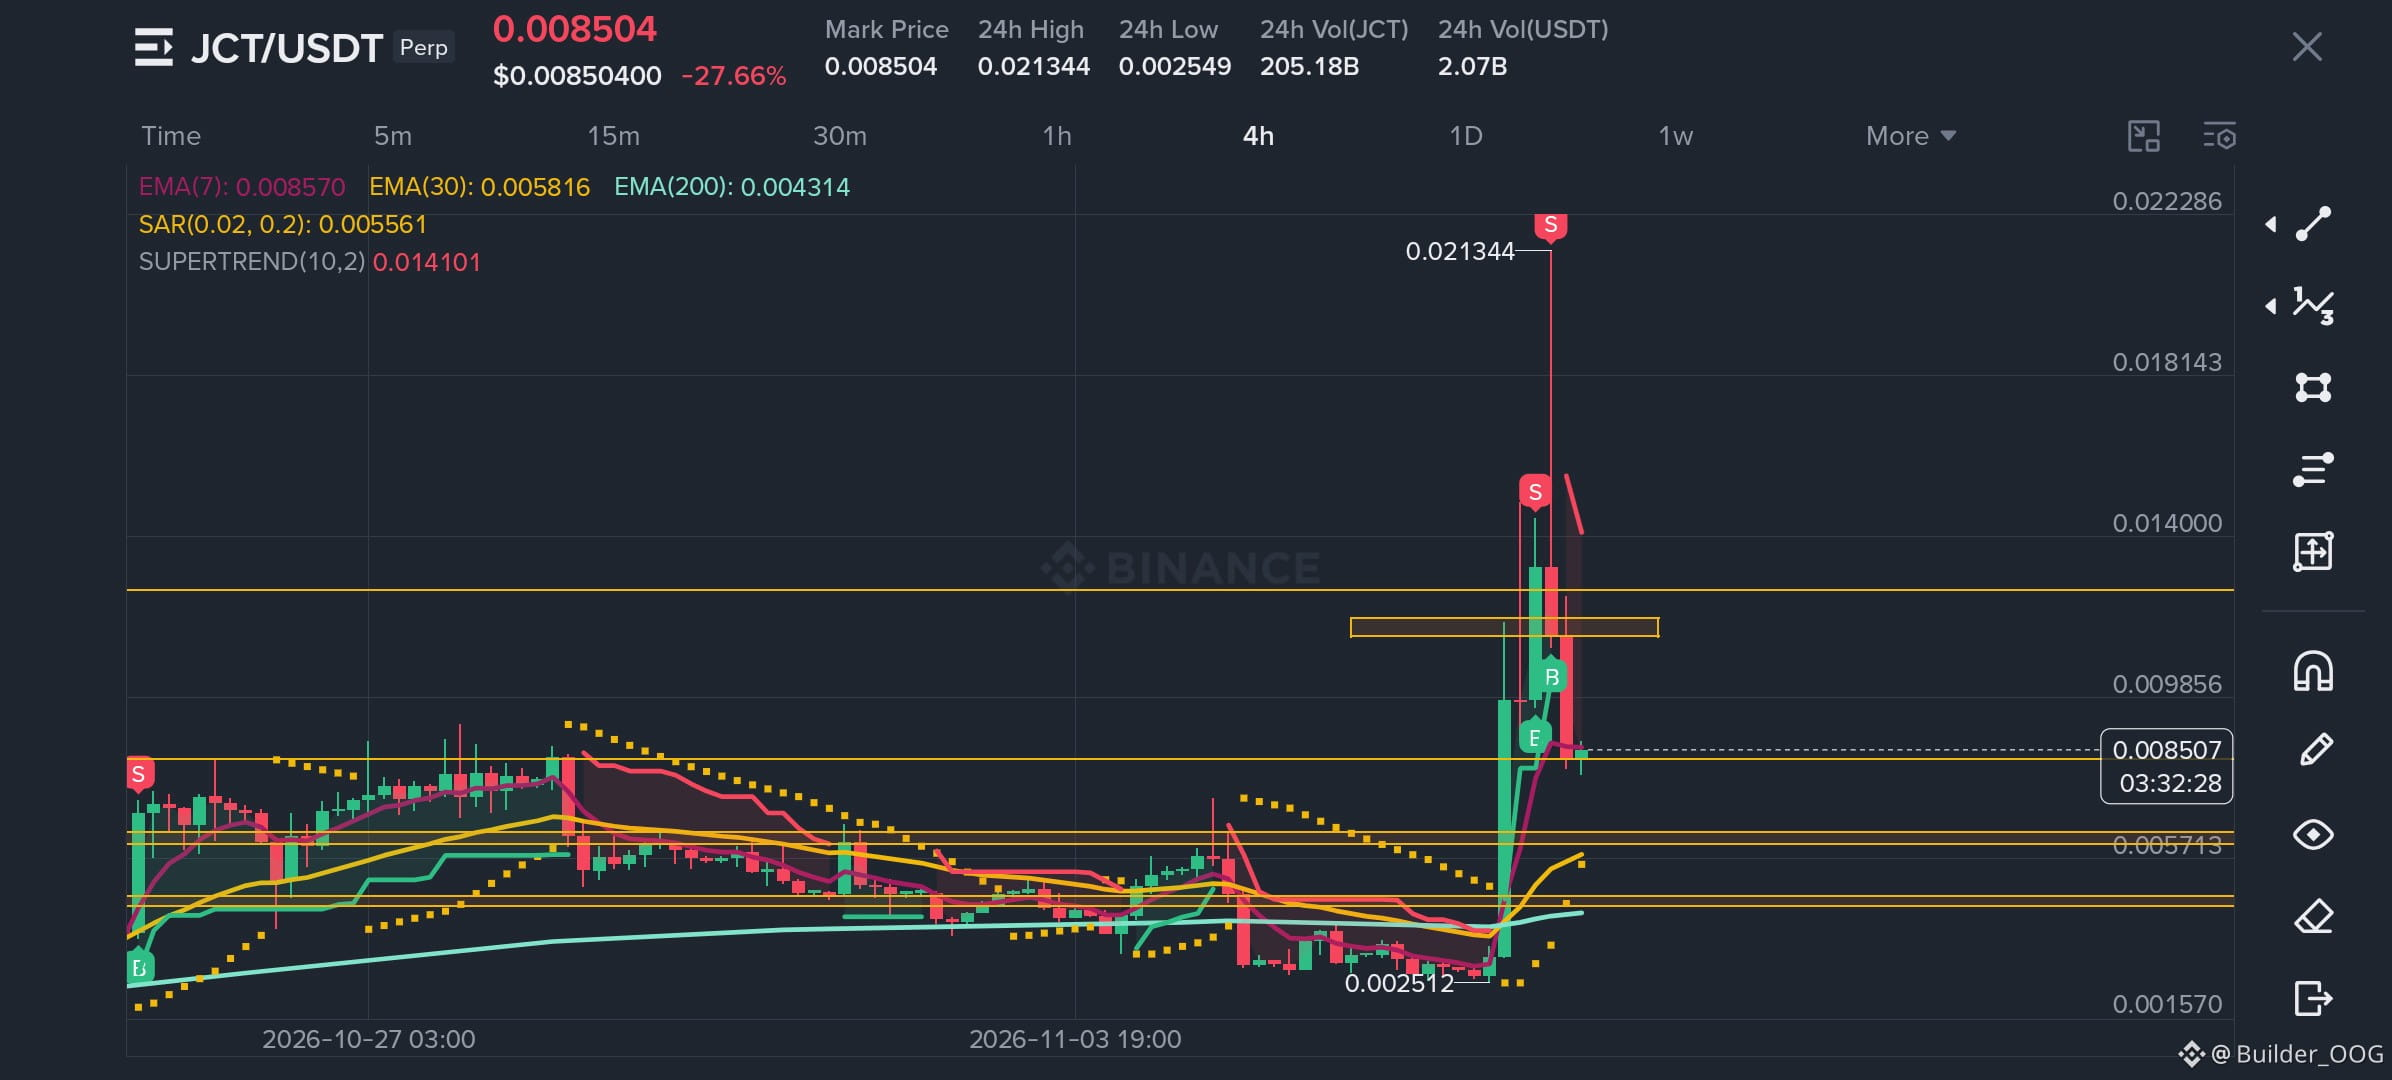
JCT is experiencing a strong correction after a massive pump, dropping approximately 27.66% in the last 24 hours.
**Current Price:** $0.008504
**Key Support Levels:**
- $0.0080 – Immediate support
- $0.0074 – Important support
- $0.0058 – Stronger support zone
- $0.0043 – Major EMA 200 support
**Key Resistance Levels:**
- $0.0105–$0.0112 – Immediate resistance
- $0.0125 – Next resistance
- $0.0141 – Major resistance
**Technical Outlook:**
Price is hovering around EMA 7, while EMA 30 and EMA 200 remain below the current price. However, the Supertrend is still bearish, indicating that selling pressure remains.
**My Observation:**
JCT needs to reclaim the $0.0105–$0.0112 resistance zone and hold above it to show signs of recovery. A breakdown below $0.0080 could lead to further downside toward $0.0074.
⚠️ **Strategy:** Wait for confirmation before making any decision. Avoid chasing the price during high volatility.
*Not financial advice. Always manage your risk.*
#JCT #JCTUSDT #CryptoAnalysisCryptoAnalysis #TechnicalAnalysise #Binance
My suggestion: Watch the 4H candle close around $0.0080 and the $0.0110 resistance zone. These levels are important for understanding the next move.
📊 **JCT/USDT – 4H Technical Analysis**
JCT is experiencing a strong correction after a massive pump, dropping approximately 27.66% in the last 24 hours.
**Current Price:** $0.008504
**Key Support Levels:**
- $0.0080 – Immediate support
- $0.0074 – Important support
- $0.0058 – Stronger support zone
- $0.0043 – Major EMA 200 support
**Key Resistance Levels:**
- $0.0105–$0.0112 – Immediate resistance
- $0.0125 – Next resistance
- $0.0141 – Major resistance
**Technical Outlook:**
Price is hovering around EMA 7, while EMA 30 and EMA 200 remain below the current price. However, the Supertrend is still bearish, indicating that selling pressure remains.
**My Observation:**
JCT needs to reclaim the $0.0105–$0.0112 resistance zone and hold above it to show signs of recovery. A breakdown below $0.0080 could lead to further downside toward $0.0074.
⚠️ **Strategy:** Wait for confirmation before making any decision. Avoid chasing the price during high volatility.
*Not financial advice. Always manage your risk.*
#JCT #JCTUSDT #CryptoAnalysisCryptoAnalysis #TechnicalAnalysise #Binance
My suggestion: Watch the 4H candle close around $0.0080 and the $0.0110 resistance zone. These levels are important for understanding the next move.
JCT is experiencing a strong correction after a massive pump, dropping approximately 27.66% in the last 24 hours.
**Current Price:** $0.008504
**Key Support Levels:**
- $0.0080 – Immediate support
- $0.0074 – Important support
- $0.0058 – Stronger support zone
- $0.0043 – Major EMA 200 support
**Key Resistance Levels:**
- $0.0105–$0.0112 – Immediate resistance
- $0.0125 – Next resistance
- $0.0141 – Major resistance
**Technical Outlook:**
Price is hovering around EMA 7, while EMA 30 and EMA 200 remain below the current price. However, the Supertrend is still bearish, indicating that selling pressure remains.
**My Observation:**
JCT needs to reclaim the $0.0105–$0.0112 resistance zone and hold above it to show signs of recovery. A breakdown below $0.0080 could lead to further downside toward $0.0074.
⚠️ **Strategy:** Wait for confirmation before making any decision. Avoid chasing the price during high volatility.
*Not financial advice. Always manage your risk.*
#JCT #JCTUSDT #CryptoAnalysisCryptoAnalysis #TechnicalAnalysise #Binance
My suggestion: Watch the 4H candle close around $0.0080 and the $0.0110 resistance zone. These levels are important for understanding the next move.
333

📈 WHAT IS MACD IN CRYPTO? LEARN TO IDENTIFY MARKET TRENDS!
Want to understand when market momentum is changing?
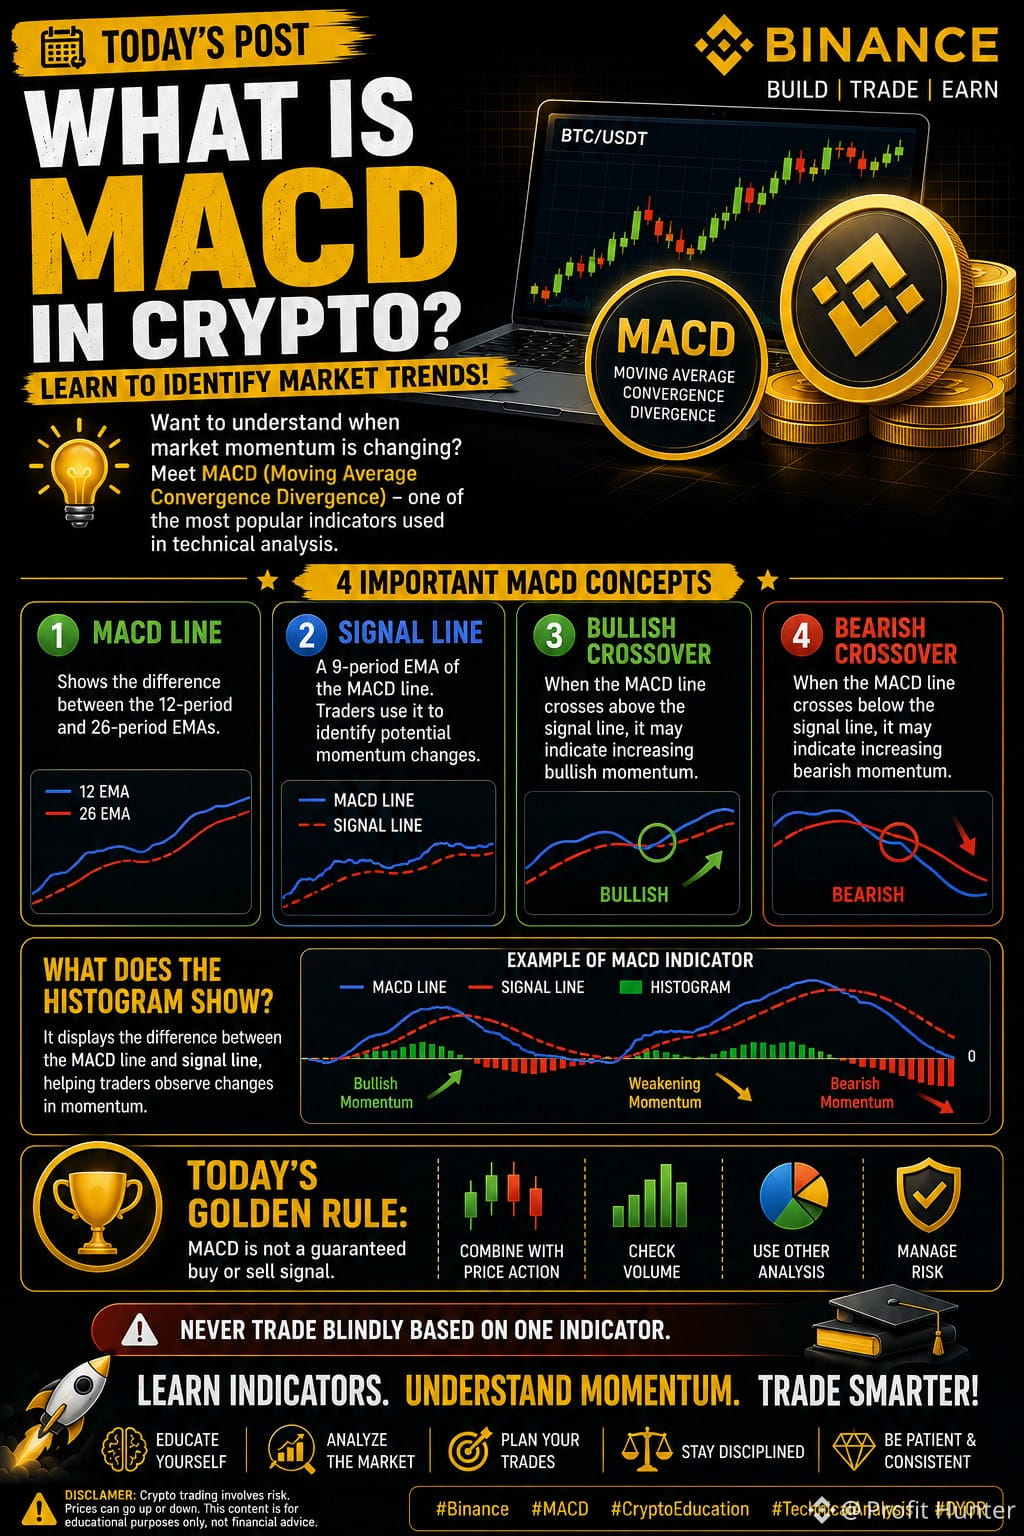
Meet MACD (Moving Average Convergence Divergence) — one of the most popular indicators used in technical analysis.
🔥 4 IMPORTANT MACD CONCEPTS:
🔹 1. MACD Line
Shows the difference between the 12-period and 26-period EMAs.
🔹 2. Signal Line
A 9-period EMA of the MACD line. Traders use it to identify potential momentum changes.
🔹 3. Bullish Crossover
When the MACD line crosses above the signal line, it may indicate increasing bullish momentum.
🔹 4. Bearish Crossover
When the MACD line crosses below the signal line, it may indicate increasing bearish momentum.
📊 WHAT DOES THE HISTOGRAM SHOW?
It displays the difference between the MACD line and signal line, helping traders observe changes in momentum.
💡 TODAY'S GOLDEN RULE:
MACD is not a guaranteed buy or sell signal. Always combine it with price action, volume, and other market analysis.
⚠️ Never trade blindly based on one indicator.
🚀 Learn Indicators. Understand Momentum. Trade Smarter!
#MACD #CryptoEducation #TechnicalAnalysise #tradingtips #learncrypto
📈 WHAT IS MACD IN CRYPTO? LEARN TO IDENTIFY MARKET TRENDS!
Want to understand when market momentum is changing?
Meet MACD (Moving Average Convergence Divergence) — one of the most popular indicators used in technical analysis.
🔥 4 IMPORTANT MACD CONCEPTS:
🔹 1. MACD Line
Shows the difference between the 12-period and 26-period EMAs.
🔹 2. Signal Line
A 9-period EMA of the MACD line. Traders use it to identify potential momentum changes.
🔹 3. Bullish Crossover
When the MACD line crosses above the signal line, it may indicate increasing bullish momentum.
🔹 4. Bearish Crossover
When the MACD line crosses below the signal line, it may indicate increasing bearish momentum.
📊 WHAT DOES THE HISTOGRAM SHOW?
It displays the difference between the MACD line and signal line, helping traders observe changes in momentum.
💡 TODAY'S GOLDEN RULE:
MACD is not a guaranteed buy or sell signal. Always combine it with price action, volume, and other market analysis.
⚠️ Never trade blindly based on one indicator.
🚀 Learn Indicators. Understand Momentum. Trade Smarter!
#MACD #CryptoEducation #TechnicalAnalysise #tradingtips #learncrypto
Want to understand when market momentum is changing?
Meet MACD (Moving Average Convergence Divergence) — one of the most popular indicators used in technical analysis.
🔥 4 IMPORTANT MACD CONCEPTS:
🔹 1. MACD Line
Shows the difference between the 12-period and 26-period EMAs.
🔹 2. Signal Line
A 9-period EMA of the MACD line. Traders use it to identify potential momentum changes.
🔹 3. Bullish Crossover
When the MACD line crosses above the signal line, it may indicate increasing bullish momentum.
🔹 4. Bearish Crossover
When the MACD line crosses below the signal line, it may indicate increasing bearish momentum.
📊 WHAT DOES THE HISTOGRAM SHOW?
It displays the difference between the MACD line and signal line, helping traders observe changes in momentum.
💡 TODAY'S GOLDEN RULE:
MACD is not a guaranteed buy or sell signal. Always combine it with price action, volume, and other market analysis.
⚠️ Never trade blindly based on one indicator.
🚀 Learn Indicators. Understand Momentum. Trade Smarter!
#MACD #CryptoEducation #TechnicalAnalysise #tradingtips #learncrypto
74

·
--
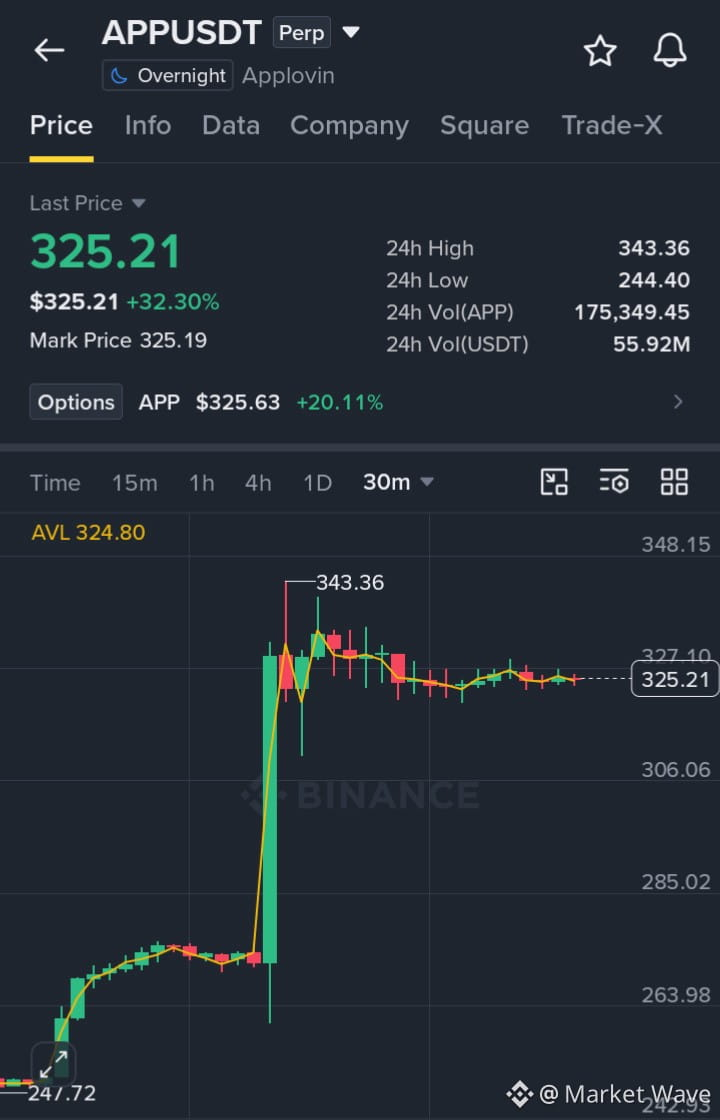
$APPUSDT BULLISH BREAKOUT SETUP $APP
ENTRY: 320.00 - 325.21
TP1: 335.00
TP2: 343.36
TP3: 355.00
SL: 305.00
#CryptoTrading #BinanceSquare #TechnicalAnalysise #AppLovin #TradingSignals
$APPUSDT BULLISH BREAKOUT SETUP $APP
ENTRY: 320.00 - 325.21
TP1: 335.00
TP2: 343.36
TP3: 355.00
SL: 305.00
#CryptoTrading #BinanceSquare #TechnicalAnalysise #AppLovin #TradingSignals
ENTRY: 320.00 - 325.21
TP1: 335.00
TP2: 343.36
TP3: 355.00
SL: 305.00
#CryptoTrading #BinanceSquare #TechnicalAnalysise #AppLovin #TradingSignals
176

·
--
Bearish
Hello Traders! 👋
What’s your outlook on GOLD?
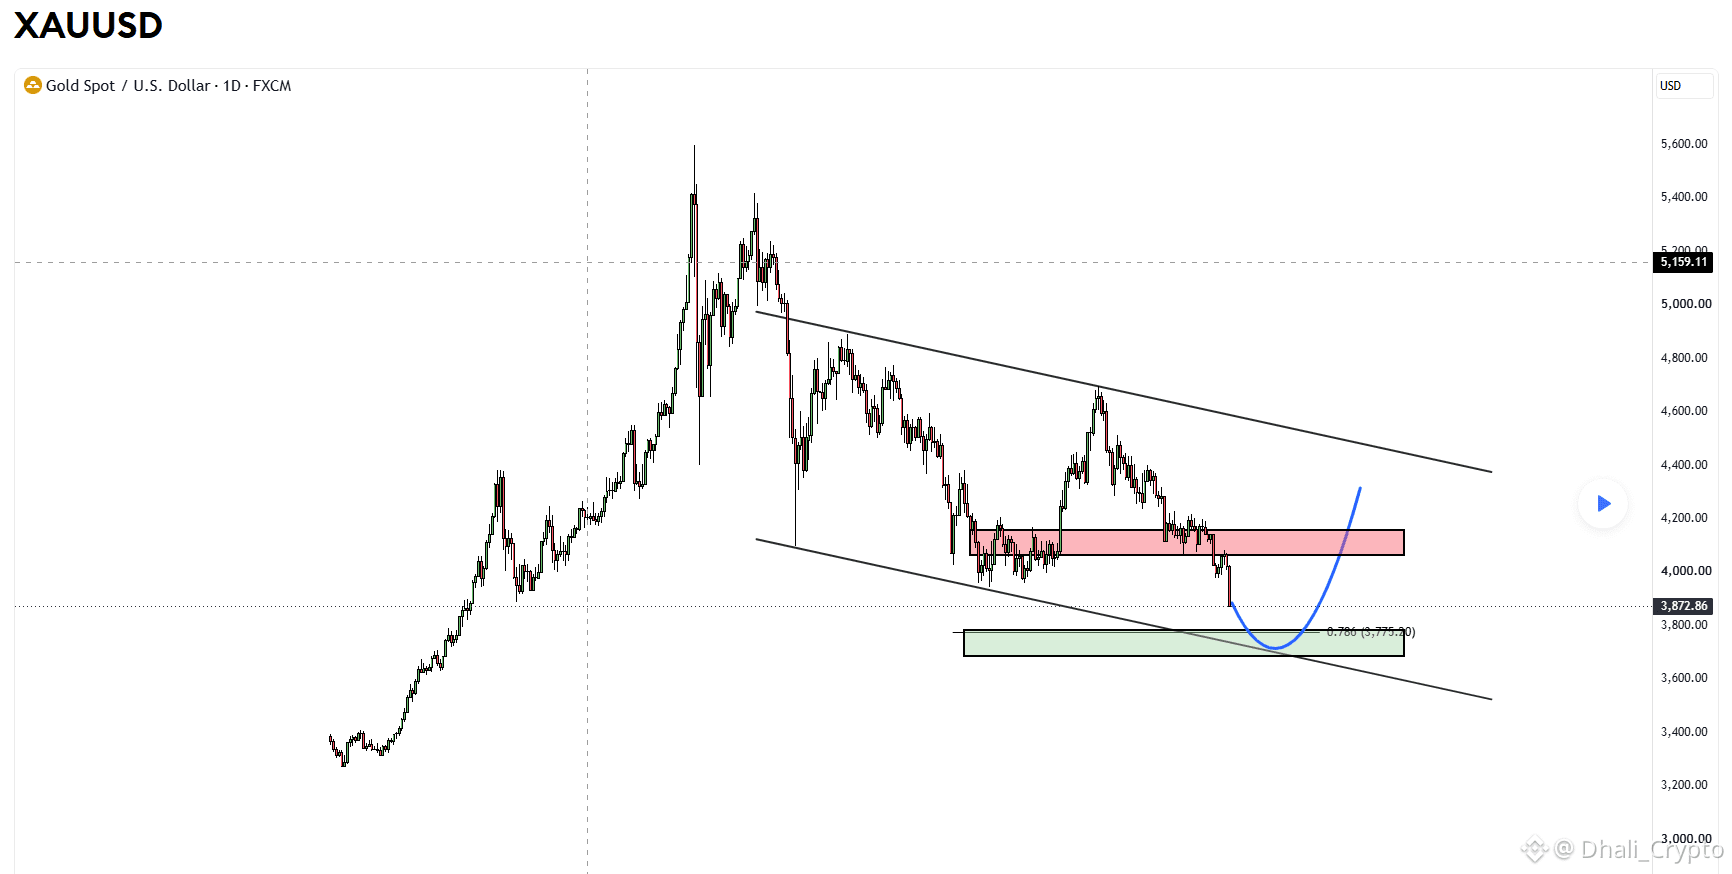
Gold continues to move within a well-defined descending channel, maintaining its broader bearish structure. Following the breakdown below the key psychological level of 4,000, price is now approaching the lower boundary of the channel.
This region holds significant technical importance as it aligns with the 0.786 Fibonacci retracement level around 3,775, creating a strong confluence zone. Given this alignment, buyers may step in around this area to defend support, potentially triggering a reversal and the beginning of a bullish recovery.
🔍 Key Resistance Zones
On the upside, the former support region between 4,000 and 4,200 is now expected to act as a major resistance barrier.
A sustained breakout above this zone could weaken the current bearish structure and potentially open the door for a move toward the upper boundary of the descending channel.
📅 Upcoming Market Catalysts
Next week’s US Nonfarm Payrolls (NFP) report, along with ongoing geopolitical developments, could play a significant role in determining Gold’s next major move.
📈 Overall Outlook
Gold is approaching a technically significant support confluence around the 3,775–3,700 region. Buyers may attempt to defend this area, potentially supporting a reversal and the start of a bullish rally.
However, the market’s reaction around the 4,000 and 4,200 resistance levels will be crucial. A confirmed breakout above this region could signal a shift in momentum and pave the way for a recovery toward the upper boundary of the descending channel.
What’s your view? Will Gold bounce from the 3,775–3,700 support zone, or continue its bearish trend?
If you found this analysis helpful, drop a like and share your thoughts in the comments! ❤️
$XAU
#GOLD_UPDATE #XAUUSD #GoldTrading #TechnicalAnalysise #PriceAction
Hello Traders! 👋
What’s your outlook on GOLD?
Gold continues to move within a well-defined descending channel, maintaining its broader bearish structure. Following the breakdown below the key psychological level of 4,000, price is now approaching the lower boundary of the channel.
This region holds significant technical importance as it aligns with the 0.786 Fibonacci retracement level around 3,775, creating a strong confluence zone. Given this alignment, buyers may step in around this area to defend support, potentially triggering a reversal and the beginning of a bullish recovery.
🔍 Key Resistance Zones
On the upside, the former support region between 4,000 and 4,200 is now expected to act as a major resistance barrier.
A sustained breakout above this zone could weaken the current bearish structure and potentially open the door for a move toward the upper boundary of the descending channel.
📅 Upcoming Market Catalysts
Next week’s US Nonfarm Payrolls (NFP) report, along with ongoing geopolitical developments, could play a significant role in determining Gold’s next major move.
📈 Overall Outlook
Gold is approaching a technically significant support confluence around the 3,775–3,700 region. Buyers may attempt to defend this area, potentially supporting a reversal and the start of a bullish rally.
However, the market’s reaction around the 4,000 and 4,200 resistance levels will be crucial. A confirmed breakout above this region could signal a shift in momentum and pave the way for a recovery toward the upper boundary of the descending channel.
What’s your view? Will Gold bounce from the 3,775–3,700 support zone, or continue its bearish trend?
If you found this analysis helpful, drop a like and share your thoughts in the comments! ❤️
$XAU
#GOLD_UPDATE #XAUUSD #GoldTrading #TechnicalAnalysise #PriceAction
What’s your outlook on GOLD?
Gold continues to move within a well-defined descending channel, maintaining its broader bearish structure. Following the breakdown below the key psychological level of 4,000, price is now approaching the lower boundary of the channel.
This region holds significant technical importance as it aligns with the 0.786 Fibonacci retracement level around 3,775, creating a strong confluence zone. Given this alignment, buyers may step in around this area to defend support, potentially triggering a reversal and the beginning of a bullish recovery.
🔍 Key Resistance Zones
On the upside, the former support region between 4,000 and 4,200 is now expected to act as a major resistance barrier.
A sustained breakout above this zone could weaken the current bearish structure and potentially open the door for a move toward the upper boundary of the descending channel.
📅 Upcoming Market Catalysts
Next week’s US Nonfarm Payrolls (NFP) report, along with ongoing geopolitical developments, could play a significant role in determining Gold’s next major move.
📈 Overall Outlook
Gold is approaching a technically significant support confluence around the 3,775–3,700 region. Buyers may attempt to defend this area, potentially supporting a reversal and the start of a bullish rally.
However, the market’s reaction around the 4,000 and 4,200 resistance levels will be crucial. A confirmed breakout above this region could signal a shift in momentum and pave the way for a recovery toward the upper boundary of the descending channel.
What’s your view? Will Gold bounce from the 3,775–3,700 support zone, or continue its bearish trend?
If you found this analysis helpful, drop a like and share your thoughts in the comments! ❤️
$XAU
#GOLD_UPDATE #XAUUSD #GoldTrading #TechnicalAnalysise #PriceAction
1
345

·
--
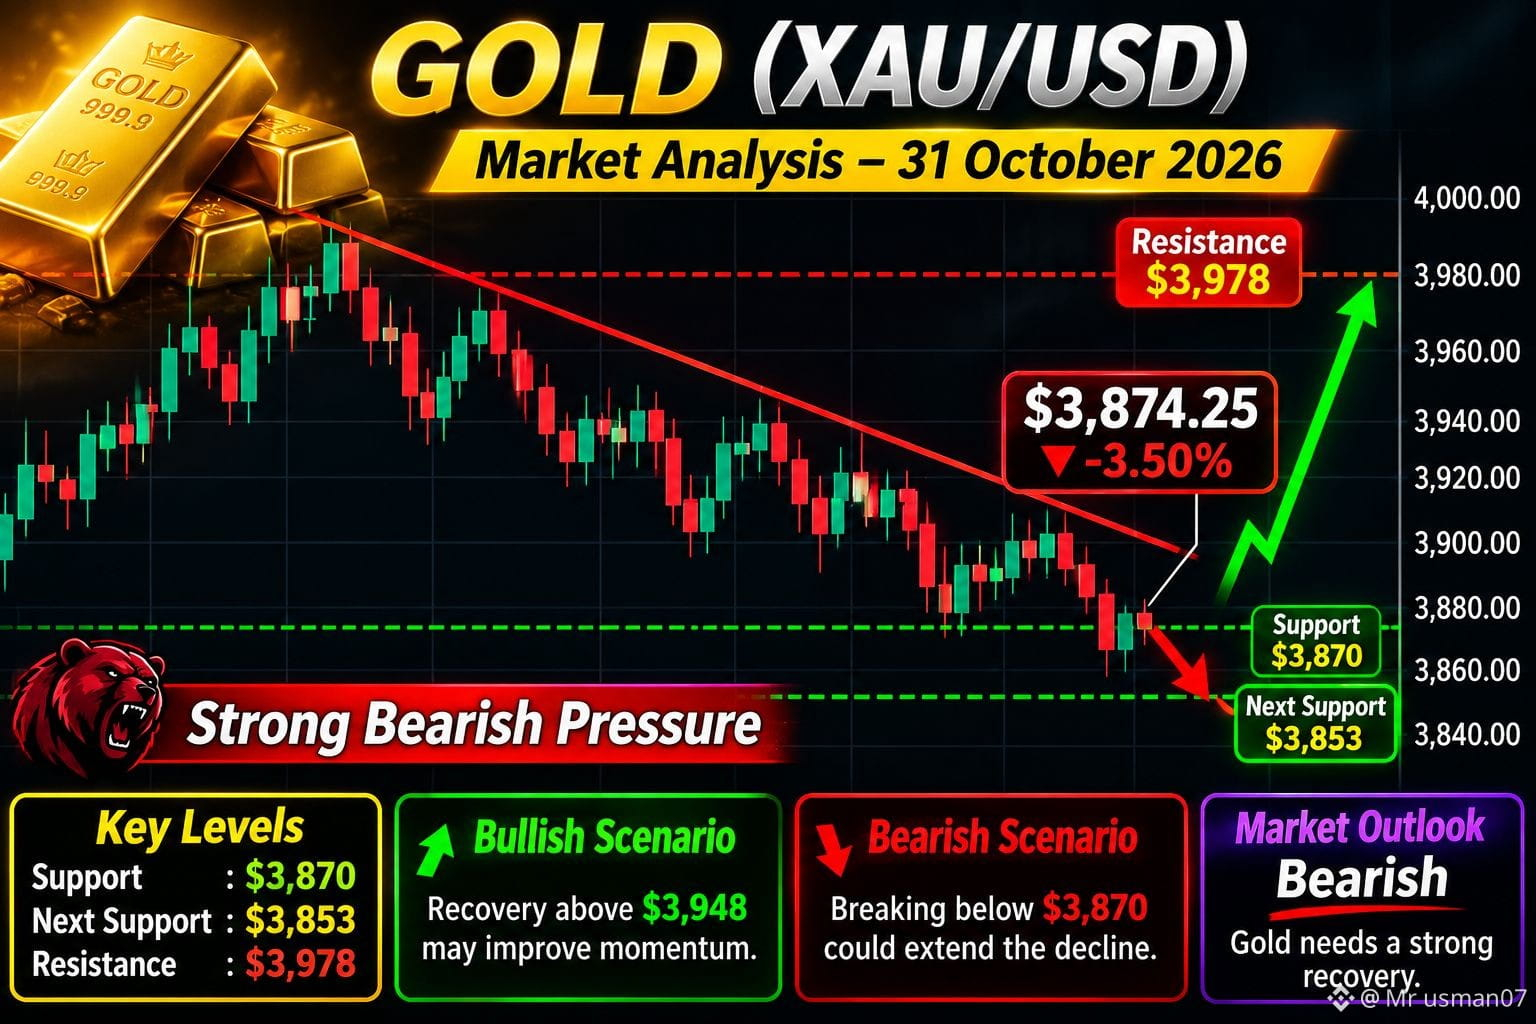
Gold is under bearish pressure.$XAU Watch the $3,870 support level closely. A breakdown could increase selling pressure.
$XAU #goldanalysis #ForexTradingCommunity #GoldMarkets #TechnicalAnalysise #CryptoNews #MarketAnalysis #blockchains
Gold is under bearish pressure.$XAU Watch the $3,870 support level closely. A breakdown could increase selling pressure.
$XAU #goldanalysis #ForexTradingCommunity #GoldMarkets #TechnicalAnalysise #CryptoNews #MarketAnalysis #blockchains
$XAU #goldanalysis #ForexTradingCommunity #GoldMarkets #TechnicalAnalysise #CryptoNews #MarketAnalysis #blockchains
213

·
--
$BNB – A Critical Moment for the Market.
$BNB remains one of the most influential assets in the cryptocurrency market, supported by its strong utility, extensive blockchain ecosystem, and growing on-chain activity. However, current market conditions are testing investor confidence and short-term price stability.
Recent developments surrounding Binance have triggered significant market volatility, putting additional selling pressure on $BNB. This makes the daily (1D) timeframe particularly important for identifying the next major market direction.
From a technical perspective, traders should closely monitor key support and resistance zones. A strong recovery above resistance, supported by increasing trading volume, could indicate renewed buying interest and open the door to a bullish reversal. On the other hand, continued weakness below support may extend bearish pressure and create further downside risks.
Beyond short-term price movements, BNB maintains important long-term fundamentals. Its role in transaction fees, staking, decentralized applications, and the wider BNB Chain ecosystem continues to provide real utility. Regular token burns also contribute to its long-term supply reduction mechanism.
Trading Outlook: The short-term bias remains cautious until buyers establish clear strength. Avoid emotional entries and wait for confirmation through volume and daily candle structure.
Final Verdict: BNB has strong ecosystem fundamentals, but market confidence and security developments will be critical drivers of its next major move. Patience and disciplined risk management are essential.
#bnb #TechnicalAnalysise #BNBChain #CryptoTradingPrediction #MarketOutlook
$BNB
{future}(BNBUSDT)
$BNB – A Critical Moment for the Market.
$BNB remains one of the most influential assets in the cryptocurrency market, supported by its strong utility, extensive blockchain ecosystem, and growing on-chain activity. However, current market conditions are testing investor confidence and short-term price stability.
Recent developments surrounding Binance have triggered significant market volatility, putting additional selling pressure on $BNB . This makes the daily (1D) timeframe particularly important for identifying the next major market direction.
From a technical perspective, traders should closely monitor key support and resistance zones. A strong recovery above resistance, supported by increasing trading volume, could indicate renewed buying interest and open the door to a bullish reversal. On the other hand, continued weakness below support may extend bearish pressure and create further downside risks.
Beyond short-term price movements, BNB maintains important long-term fundamentals. Its role in transaction fees, staking, decentralized applications, and the wider BNB Chain ecosystem continues to provide real utility. Regular token burns also contribute to its long-term supply reduction mechanism.
Trading Outlook: The short-term bias remains cautious until buyers establish clear strength. Avoid emotional entries and wait for confirmation through volume and daily candle structure.
Final Verdict: BNB has strong ecosystem fundamentals, but market confidence and security developments will be critical drivers of its next major move. Patience and disciplined risk management are essential.
#bnb #TechnicalAnalysise #BNBChain #CryptoTradingPrediction #MarketOutlook
$BNB
$BNB remains one of the most influential assets in the cryptocurrency market, supported by its strong utility, extensive blockchain ecosystem, and growing on-chain activity. However, current market conditions are testing investor confidence and short-term price stability.
Recent developments surrounding Binance have triggered significant market volatility, putting additional selling pressure on $BNB . This makes the daily (1D) timeframe particularly important for identifying the next major market direction.
From a technical perspective, traders should closely monitor key support and resistance zones. A strong recovery above resistance, supported by increasing trading volume, could indicate renewed buying interest and open the door to a bullish reversal. On the other hand, continued weakness below support may extend bearish pressure and create further downside risks.
Beyond short-term price movements, BNB maintains important long-term fundamentals. Its role in transaction fees, staking, decentralized applications, and the wider BNB Chain ecosystem continues to provide real utility. Regular token burns also contribute to its long-term supply reduction mechanism.
Trading Outlook: The short-term bias remains cautious until buyers establish clear strength. Avoid emotional entries and wait for confirmation through volume and daily candle structure.
Final Verdict: BNB has strong ecosystem fundamentals, but market confidence and security developments will be critical drivers of its next major move. Patience and disciplined risk management are essential.
#bnb #TechnicalAnalysise #BNBChain #CryptoTradingPrediction #MarketOutlook
$BNB
1
93

#TechnicalAnalysise Market plunges, down $73,000
#TechnicalAnalysise Market plunges, down $73,000
83
Log in to explore more content
Join global crypto users on Binance Square
⚡️ Get latest and useful information about crypto.
💬 Trusted by the world’s largest crypto exchange.
👍 Discover real insights from verified creators.
Email / Phone number
Trending Topics
1
#BTCReboundsAbove$60KAmidWhaleDipBuying
81,456 views
368 Discussing
2
#SolanaSets2027RoadmapToDoubleComputeCapacity
66,241 views
1,075 Discussing
3
#CaliforniaNvidiaProbeExaminesPotentialCriminalViolations
17,858 views
149 Discussing
4
#BlackRockLaunchesHKDollarDigitalLiquidityFund
54,757 views
809 Discussing
5
#NvidiaLoses$2.7TrillionInMonthAndAHalf
79,559 views
319 Discussing
6
#GlobalStocksFaceLongestLosingStreakSince2023
580,802 views
3,536 Discussing
7
#BlackRockIBITPostsRecord$541MSingleDayOutflow
97,715 views
186 Discussing
8
#AnthropicPlungesTowardIPOPriceonDay2
322,964 views
2,375 Discussing
9
#TwentyOneCapitalAdds172.25BTC
173,239 views
1,685 Discussing
10
#HKBillWouldExcludeTokenizedDepositsFromVirtualAssets
18,747 views
109 Discussing