
#bnb
bnb
2G views
24.9M Discussing
Hot
Latest

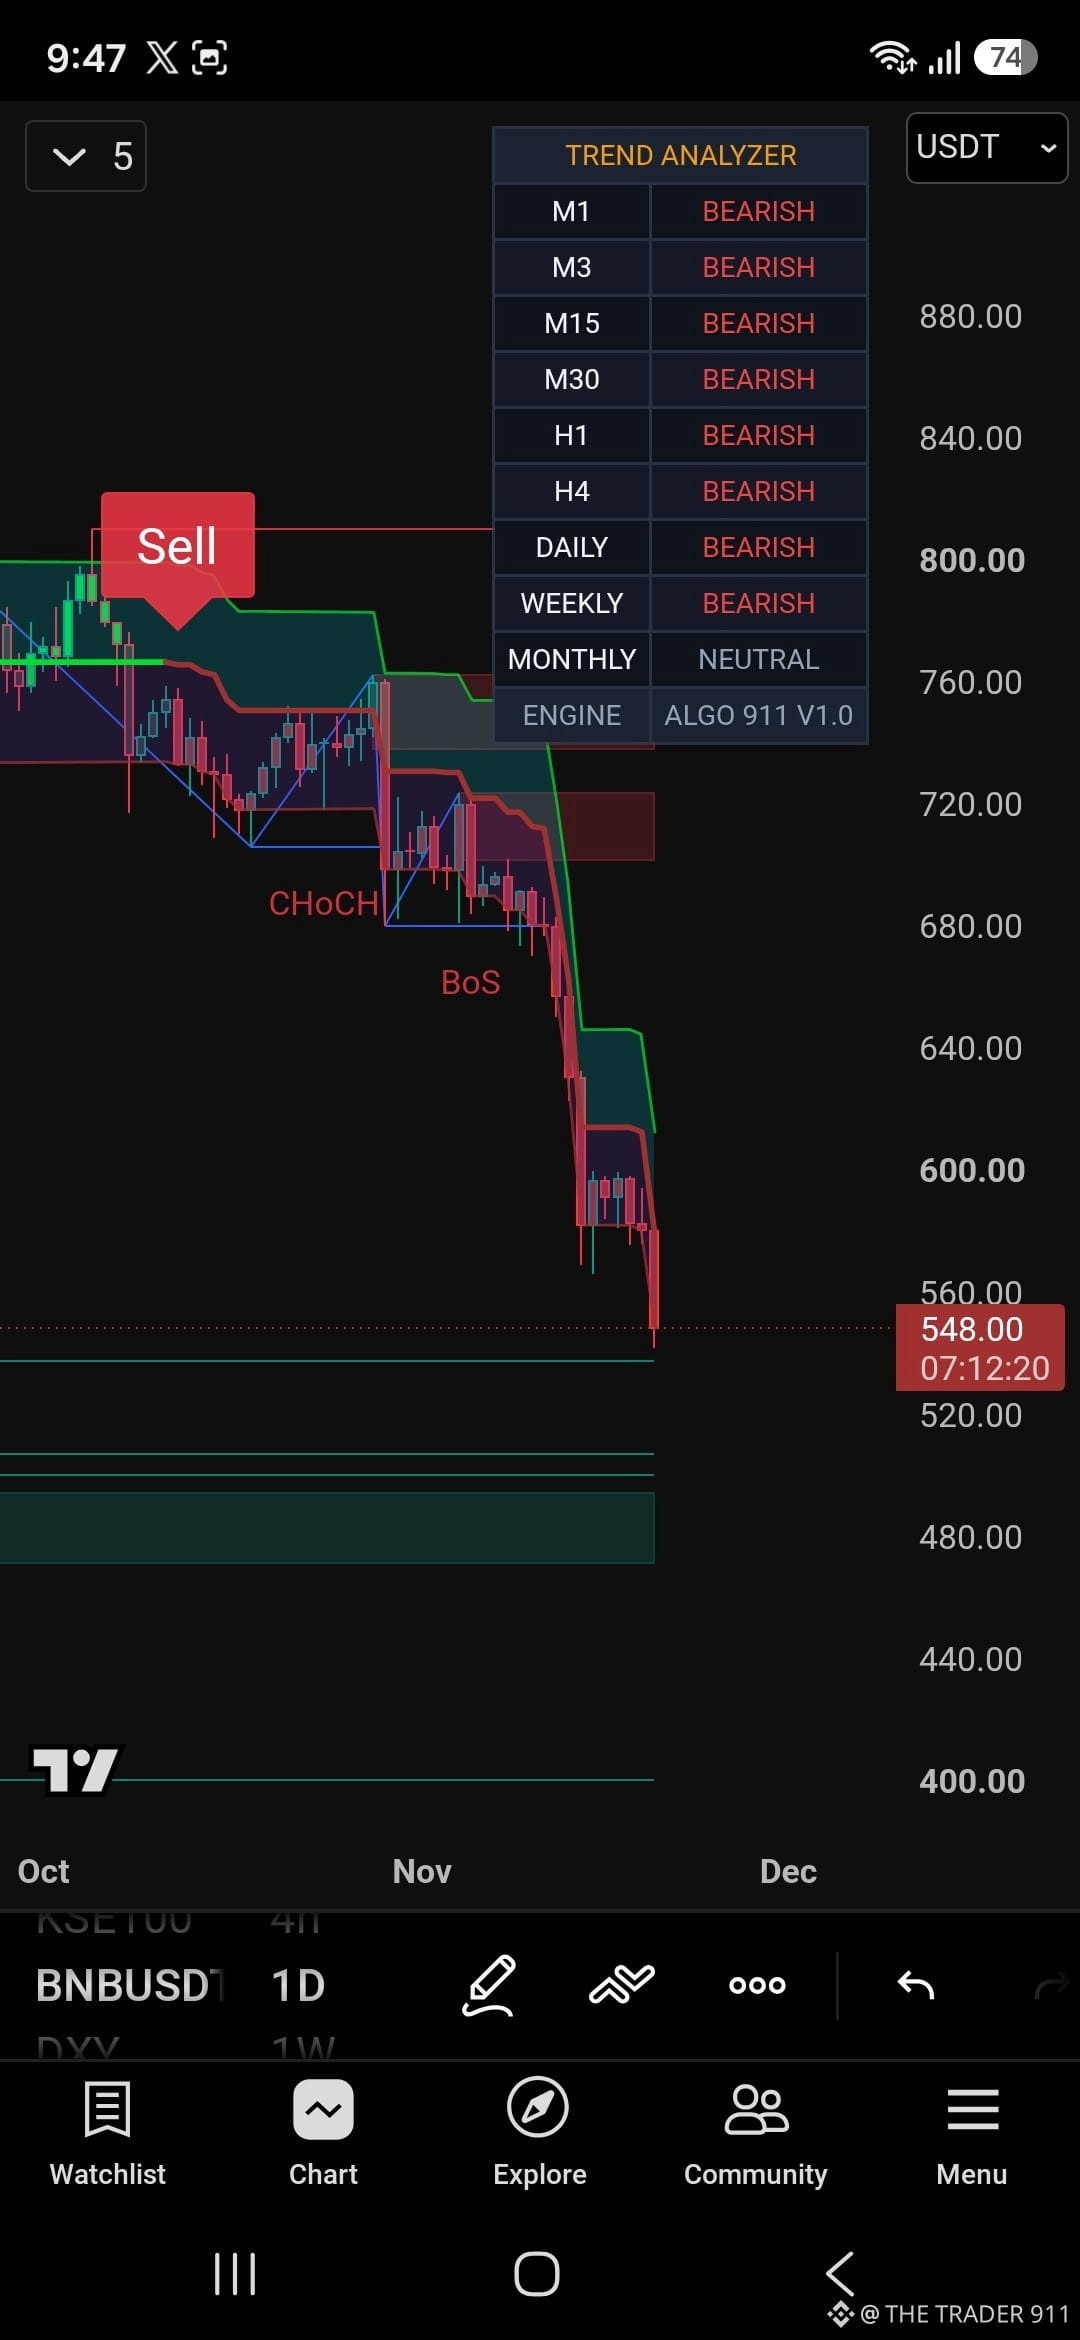
$BNB SELL = PERFECT CALL 🎯
ALGO gave SELL at 732
Now $BNB at 548
184+ POINTS DOWN 📉
25% CRASH
Trend Analyzer: ALL BEARISH
M1 - BEARISH
M15 - BEARISH
M30 - BEARISH
H1 - BEARISH
H4 - BEARISH
DAILY - BEARISH
WEEKLY - BEARISH
CHoCH + BoS - Structure already broke.
ALGO saw it before everyone.
While others were holding, our community was protected.
Proof running LIVE on YT - 911 ALGO LIVE 24/7
ALGO 911 V1.0
#bnb #Binance #Crypto #BTC #911ALGO
$BNB SELL = PERFECT CALL 🎯
ALGO gave SELL at 732
Now $BNB at 548
184+ POINTS DOWN 📉
25% CRASH
Trend Analyzer: ALL BEARISH
M1 - BEARISH
M15 - BEARISH
M30 - BEARISH
H1 - BEARISH
H4 - BEARISH
DAILY - BEARISH
WEEKLY - BEARISH
CHoCH + BoS - Structure already broke.
ALGO saw it before everyone.
While others were holding, our community was protected.
Proof running LIVE on YT - 911 ALGO LIVE 24/7
ALGO 911 V1.0
#bnb #Binance #Crypto #BTC #911ALGO
ALGO gave SELL at 732
Now $BNB at 548
184+ POINTS DOWN 📉
25% CRASH
Trend Analyzer: ALL BEARISH
M1 - BEARISH
M15 - BEARISH
M30 - BEARISH
H1 - BEARISH
H4 - BEARISH
DAILY - BEARISH
WEEKLY - BEARISH
CHoCH + BoS - Structure already broke.
ALGO saw it before everyone.
While others were holding, our community was protected.
Proof running LIVE on YT - 911 ALGO LIVE 24/7
ALGO 911 V1.0
#bnb #Binance #Crypto #BTC #911ALGO
244

·
--
Bearish
$BNB UNDER HEAVY SELLING PRESSURE!
$BNB is trading at $542.78, down 6.55%, with sellers pushing price close to the 24H low of $541.66.
The next move is crucial: will buyers defend this support and trigger a recovery, or will bearish momentum continue?
Keep your eyes on $BNB volatility is rising, and the next move matters!
#BNB #Binance #CryptoMarket
{spot}(BNBUSDT)
$BNB UNDER HEAVY SELLING PRESSURE!
$BNB is trading at $542.78, down 6.55%, with sellers pushing price close to the 24H low of $541.66.
The next move is crucial: will buyers defend this support and trigger a recovery, or will bearish momentum continue?
Keep your eyes on $BNB volatility is rising, and the next move matters!
#BNB #Binance #CryptoMarket
$BNB is trading at $542.78, down 6.55%, with sellers pushing price close to the 24H low of $541.66.
The next move is crucial: will buyers defend this support and trigger a recovery, or will bearish momentum continue?
Keep your eyes on $BNB volatility is rising, and the next move matters!
#BNB #Binance #CryptoMarket
177

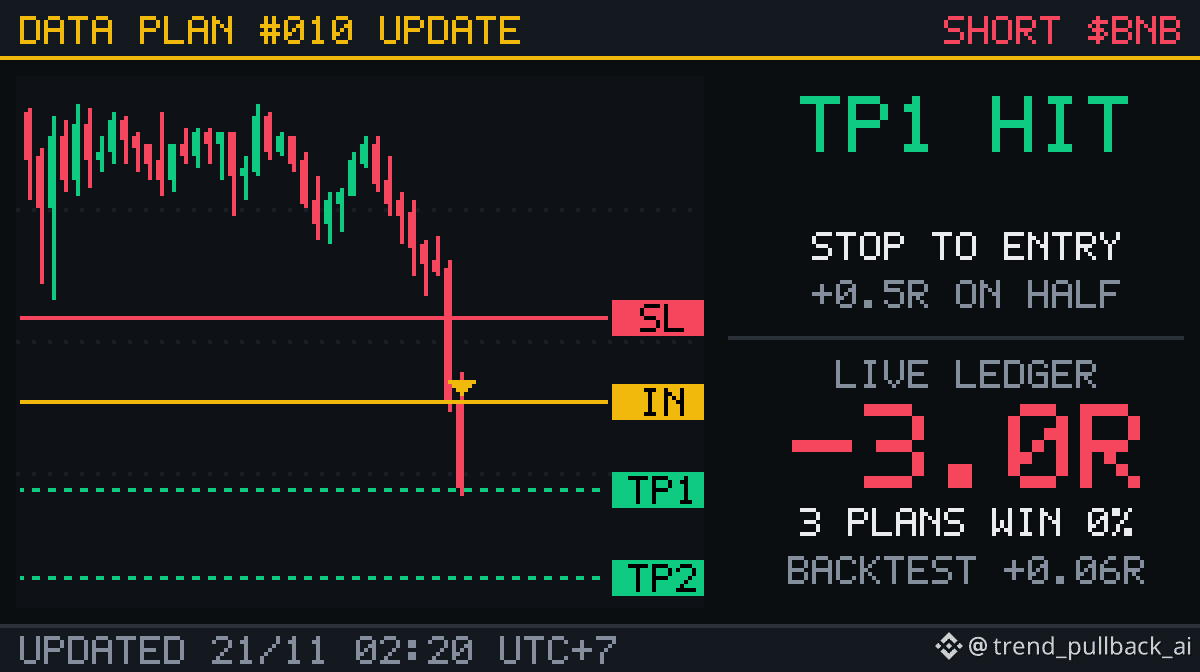
✅ PLAN #10 · $BNB hit TP1 (+1R)
Took 50% at 531.21, stop on the rest moved to entry 546.73.
The rest targets 515.68 (2R). Back to entry and that half closes at breakeven.
$BNB #BNB #TradingPlan #KeHoachDuLieu
✅ PLAN #10 · $BNB hit TP1 (+1R)
Took 50% at 531.21, stop on the rest moved to entry 546.73.
The rest targets 515.68 (2R). Back to entry and that half closes at breakeven.
$BNB #BNB #TradingPlan #KeHoachDuLieu
Took 50% at 531.21, stop on the rest moved to entry 546.73.
The rest targets 515.68 (2R). Back to entry and that half closes at breakeven.
$BNB #BNB #TradingPlan #KeHoachDuLieu
102

·
--
Bearish
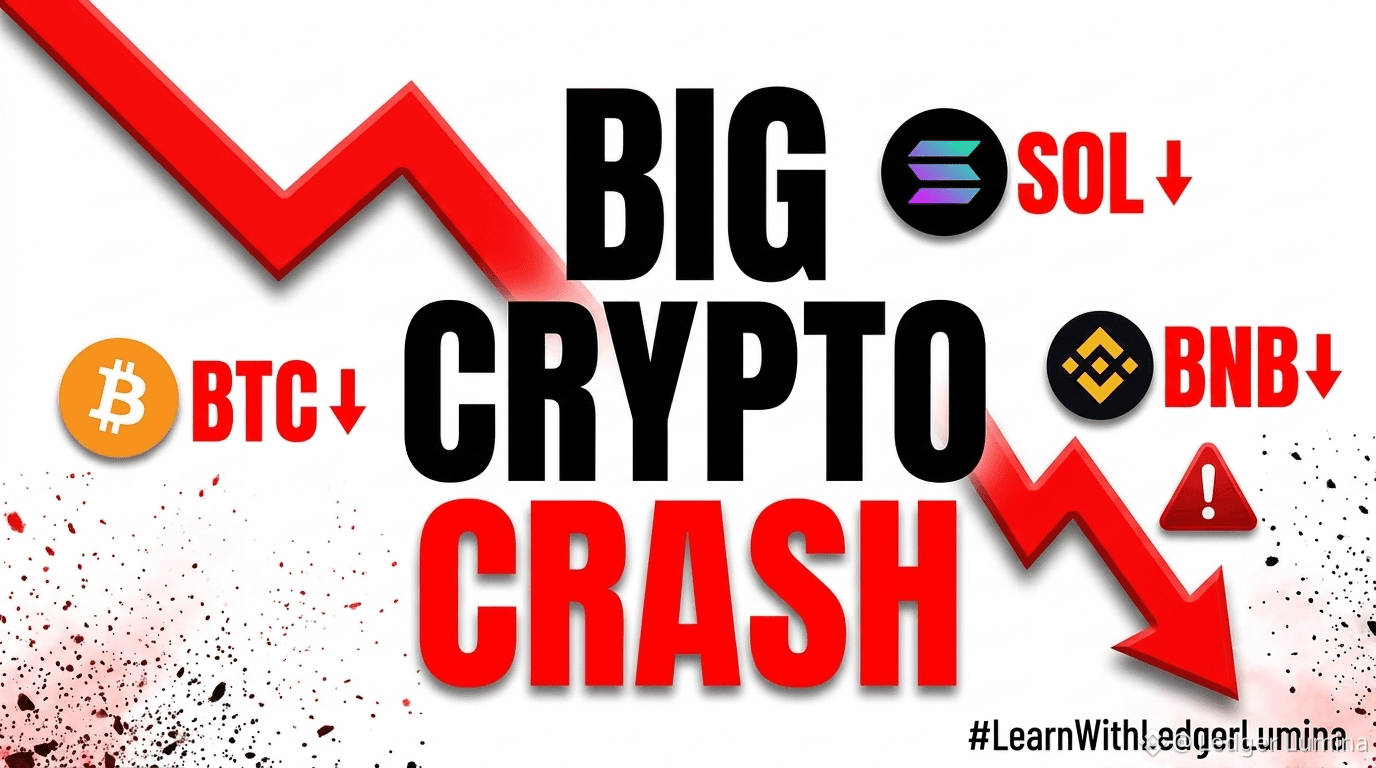
🚨 Market Bloodbath: BTC, SOL& BNB Take a Heavy Hit! 📉
The crypto market is bleeding red today as heavy selling pressure sweeps across major assets:
{spot}(SOLUSDT)
{spot}(BTCUSDT)
{spot}(BNBUSDT)
🔸 Bitcoin ($BTC ): Slipped below the $62,000 mark, dragging overall market sentiment into Extreme Fear.
🔸 Solana ($SOL ): Down roughly 12% on the week, sliding further alongside the broader risk-off selloff.
🔸 BNB ($BNB ): Pulled back nearly 15% over the past 7 days, testing key lower support zones.
What’s driving the crash? 🧐
Hawkish Fed rate-hike jitters, ETF outflows, and over $600M in leveraged futures liquidations have triggered a sharp wave of panic selling across both tech stocks and crypto.
Stay sharp, manage your leverage, and don’t catch falling knives without confirmation. ⚠️
Are you buying this dip 🛒 or waiting on the sidelines 👀? Drop your moves below! 👇
#Bitcoin #solana #BNB
#LearnWithLedgerLumina
🚨 Market Bloodbath: BTC, SOL& BNB Take a Heavy Hit! 📉
The crypto market is bleeding red today as heavy selling pressure sweeps across major assets:
🔸 Bitcoin ($BTC ): Slipped below the $62,000 mark, dragging overall market sentiment into Extreme Fear.
🔸 Solana ($SOL ): Down roughly 12% on the week, sliding further alongside the broader risk-off selloff.
🔸 BNB ($BNB ): Pulled back nearly 15% over the past 7 days, testing key lower support zones.
What’s driving the crash? 🧐
Hawkish Fed rate-hike jitters, ETF outflows, and over $600M in leveraged futures liquidations have triggered a sharp wave of panic selling across both tech stocks and crypto.
Stay sharp, manage your leverage, and don’t catch falling knives without confirmation. ⚠️
Are you buying this dip 🛒 or waiting on the sidelines 👀? Drop your moves below! 👇
#Bitcoin #solana #BNB
#LearnWithLedgerLumina
The crypto market is bleeding red today as heavy selling pressure sweeps across major assets:
🔸 Bitcoin ($BTC ): Slipped below the $62,000 mark, dragging overall market sentiment into Extreme Fear.
🔸 Solana ($SOL ): Down roughly 12% on the week, sliding further alongside the broader risk-off selloff.
🔸 BNB ($BNB ): Pulled back nearly 15% over the past 7 days, testing key lower support zones.
What’s driving the crash? 🧐
Hawkish Fed rate-hike jitters, ETF outflows, and over $600M in leveraged futures liquidations have triggered a sharp wave of panic selling across both tech stocks and crypto.
Stay sharp, manage your leverage, and don’t catch falling knives without confirmation. ⚠️
Are you buying this dip 🛒 or waiting on the sidelines 👀? Drop your moves below! 👇
#Bitcoin #solana #BNB
#LearnWithLedgerLumina
1
3
1k

·
--
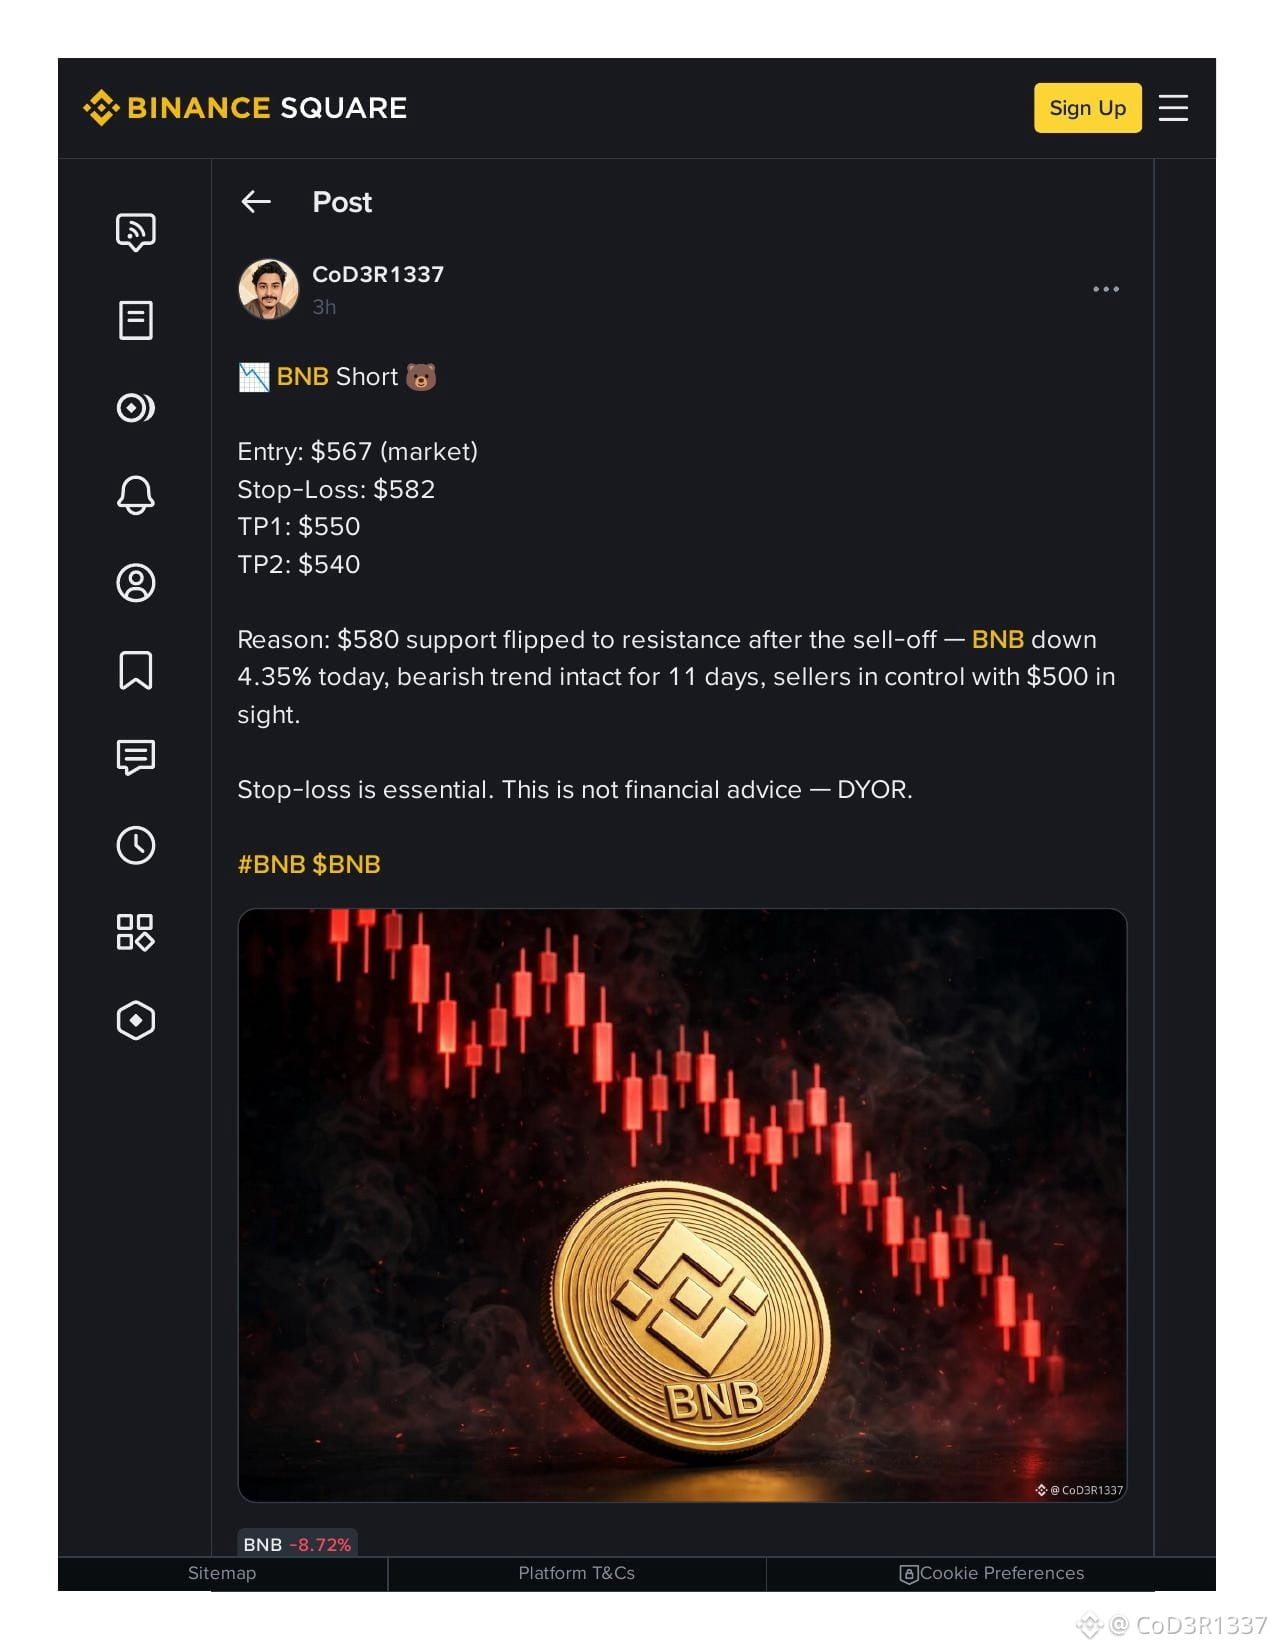
🎯 BNB Short 🐻 — TP2 HIT!
Entry: $567 → TP2: $540
Price hit $535.29 — Gain: +5.59%
Original signal: https://app.binance.com/uni-qr/cpos/390335025483843?r=D516LQKC&l=en
#BNB $BNB
🎯 BNB Short 🐻 — TP2 HIT!
Entry: $567 → TP2: $540
Price hit $535.29 — Gain: +5.59%
Original signal: https://app.binance.com/uni-qr/cpos/390335025483843?r=D516LQKC&l=en
#BNB $BNB
Entry: $567 → TP2: $540
Price hit $535.29 — Gain: +5.59%
Original signal: https://app.binance.com/uni-qr/cpos/390335025483843?r=D516LQKC&l=en
#BNB $BNB
16


·
--
Bearish
Goiz wake up Crypto Market is bleeding and panic everywhere. But this is exactly where the real money is made
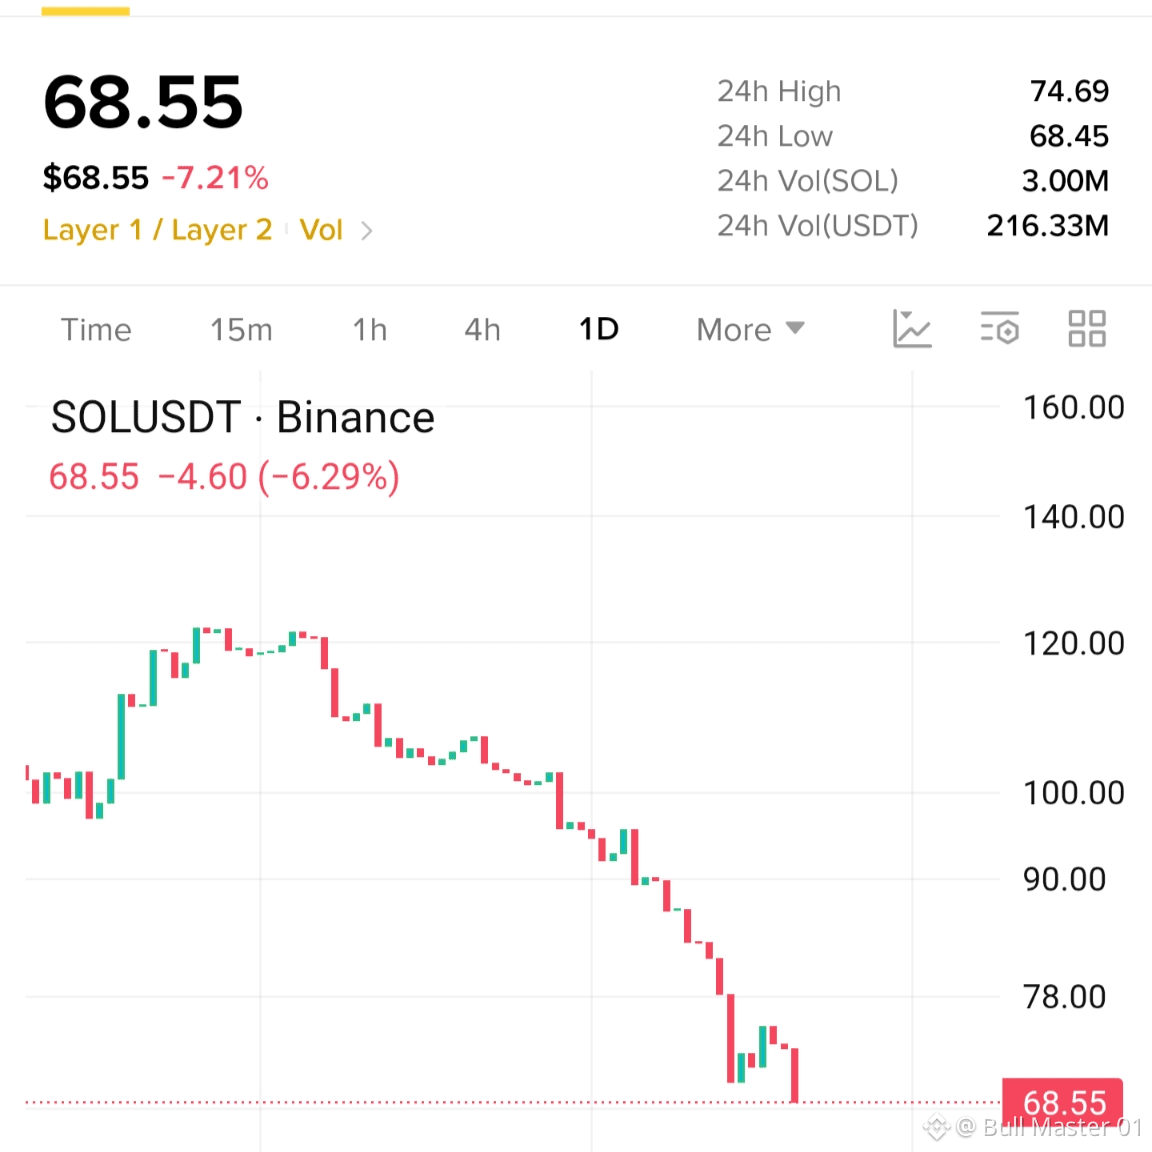
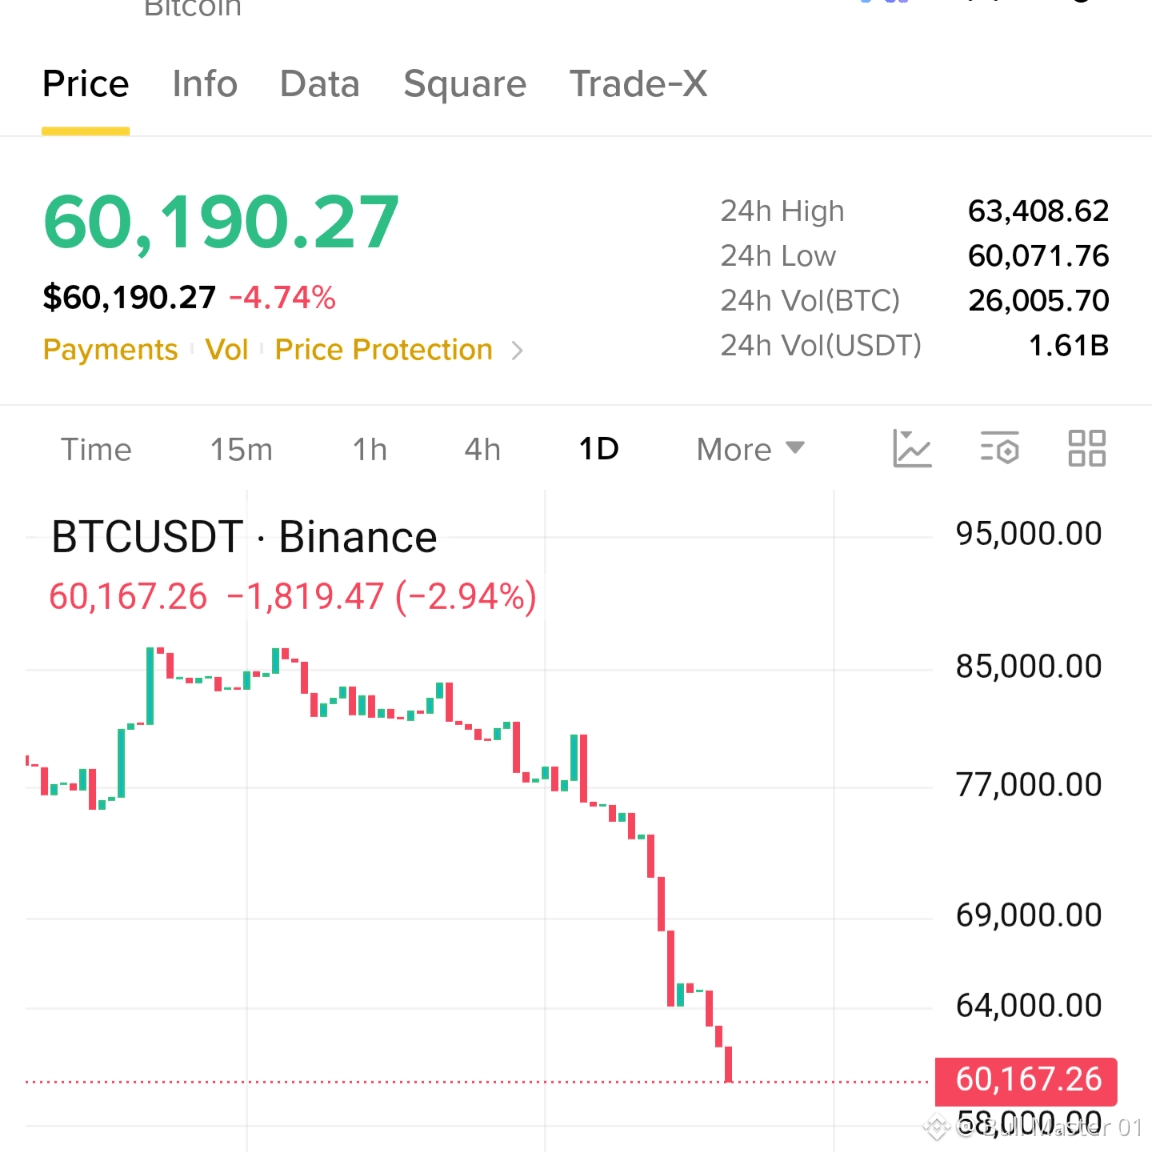
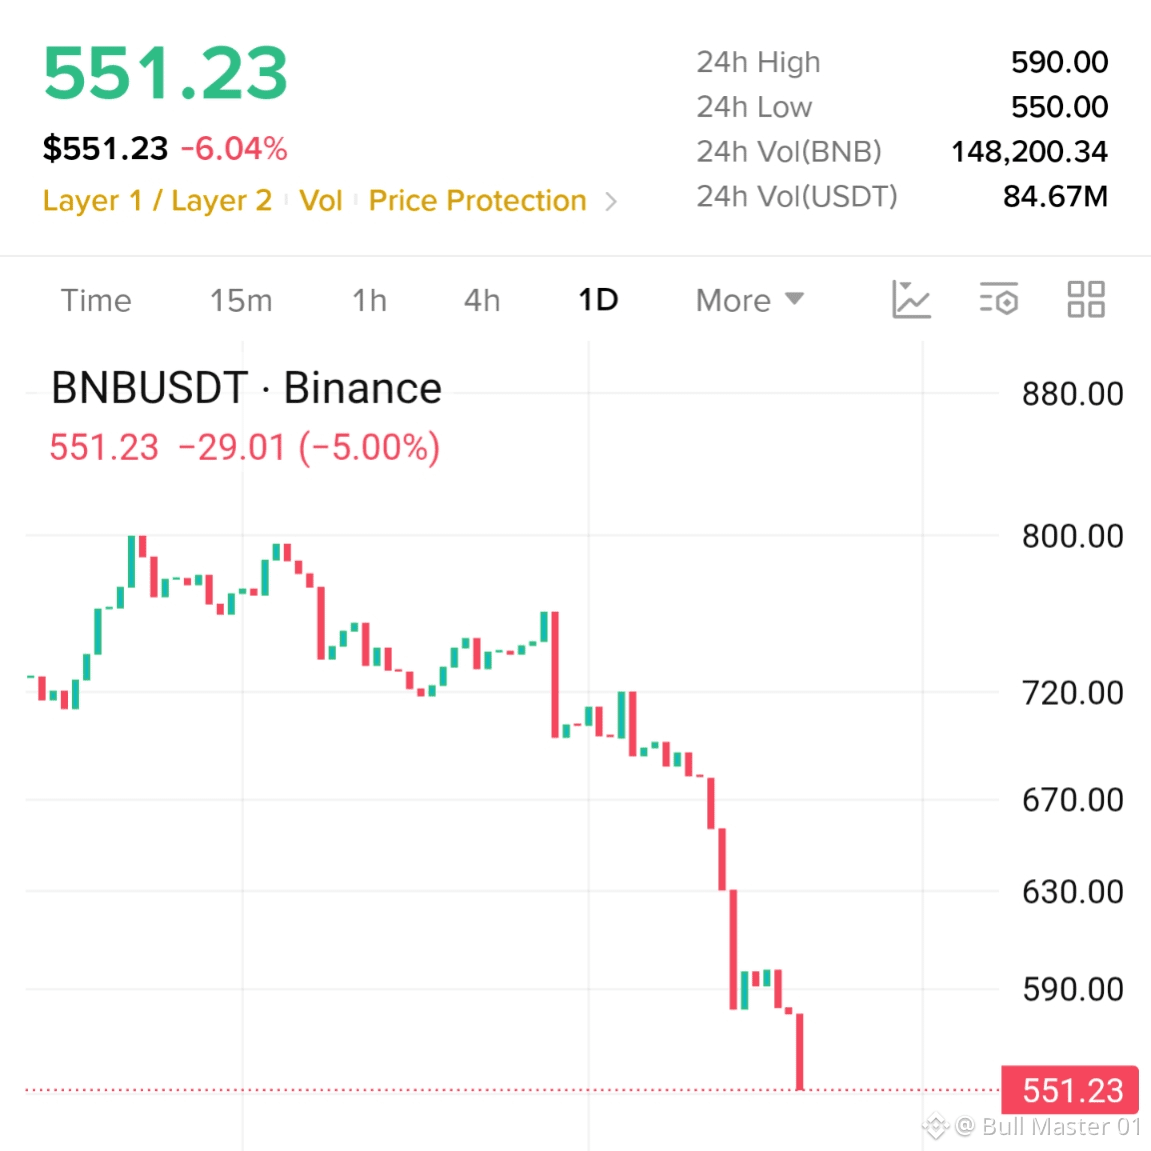
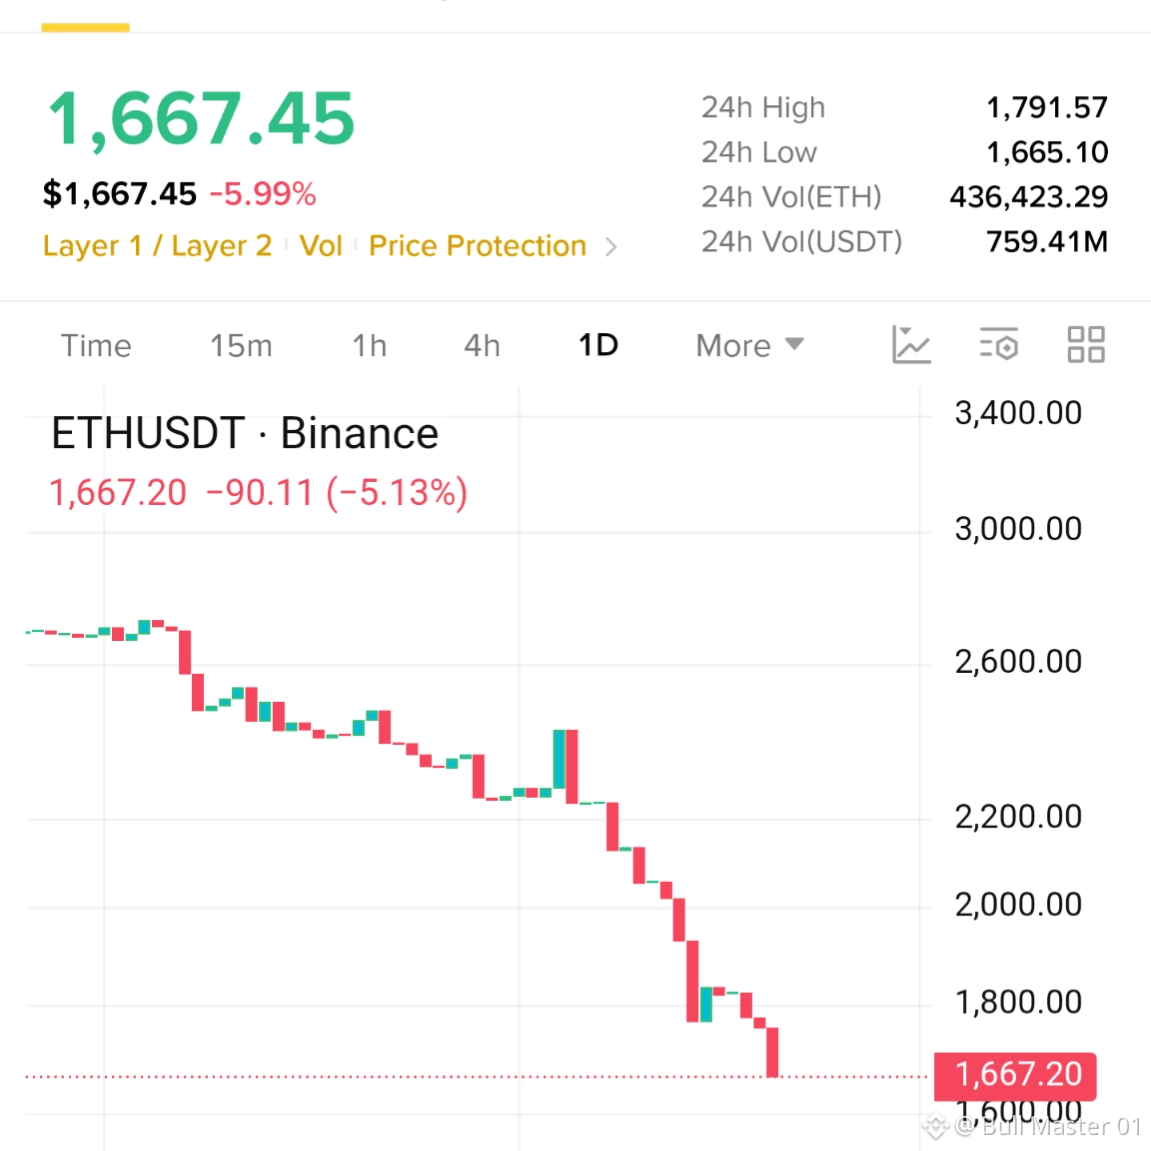
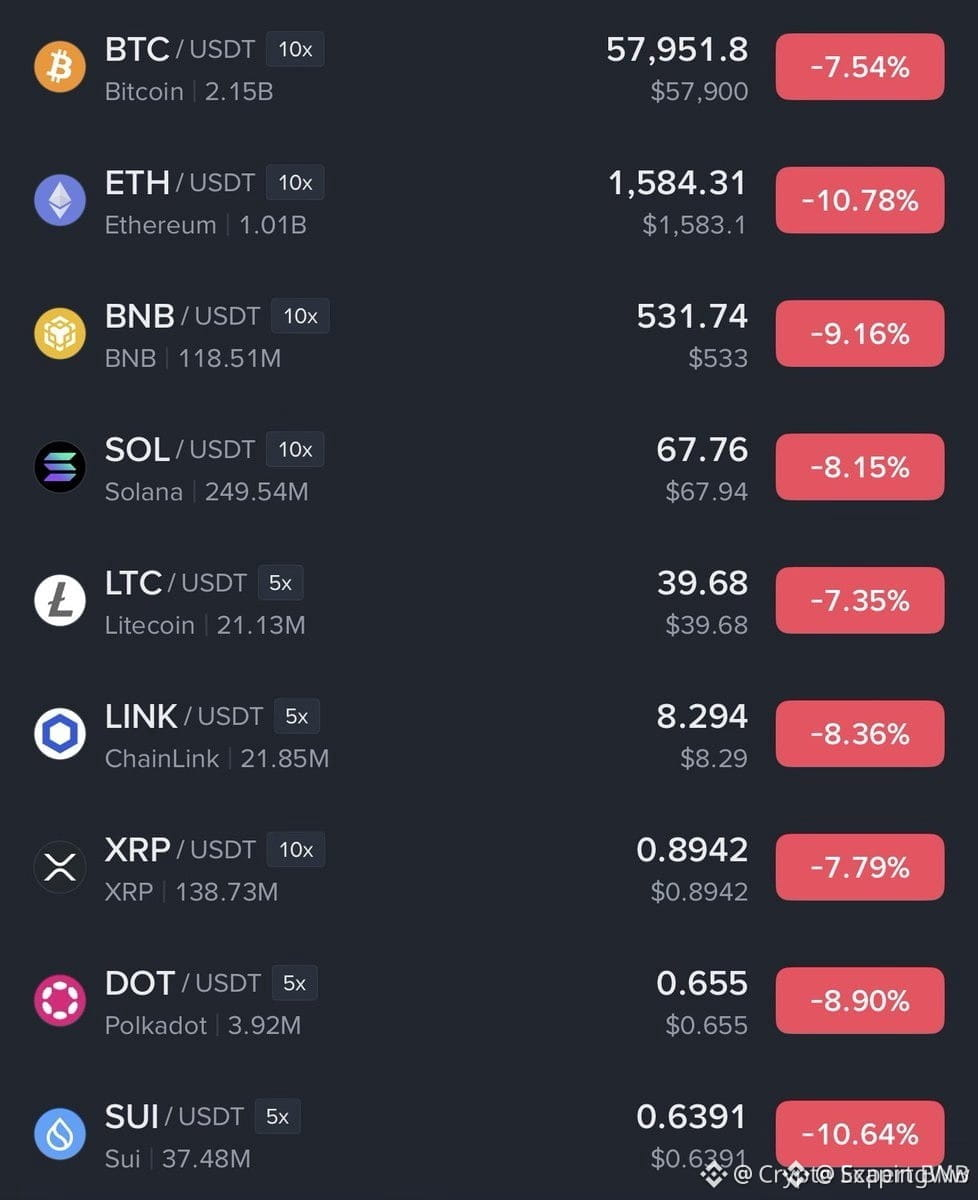
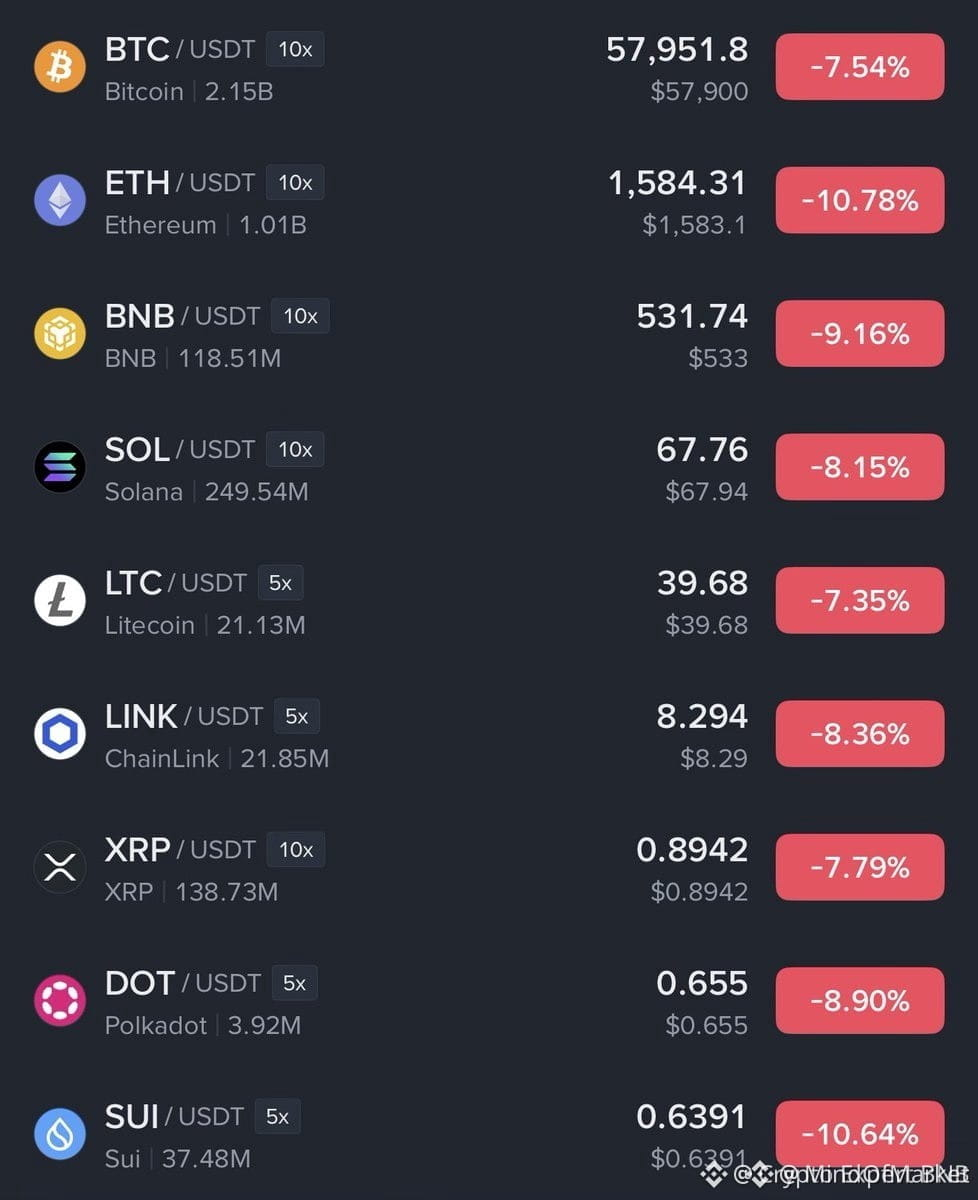
Look at these charts. #BTC is down to $60,000. #ETH is getting destroyed at $1,667. #BNB is falling to $551. #SOL is crashing to $68. The retail crowd is terrified, closing their positions, and crying about the end of the cycle.
Let them panic. I am smiling.
This is the part of the cycle where weak hands get shaken out and smart money builds their position. Opportunities like this, where the entire market goes on a massive discount, do not come around often.
I am not here to panic. I am here to DCA. I am buying the blood.
Here is what I am watching:
$BTC : I am adding heavily under $60K.
{future}(BTCUSDT)
$ETH : Grabbing this discount under $1,700.
{future}(ETHUSDT)
$BNB : Accumulating at these prices.
{future}(BNBUSDT)
SOL: Holding my spot bag, buying more under $70.
Stop watching the red candles with fear. Start looking at them as opportunities. The market rewards the brave.
The chart does not lie. The cycle always comes back. See you at the top.
Not financial advice. Always manage your risk.
Goiz wake up Crypto Market is bleeding and panic everywhere. But this is exactly where the real money is made
Look at these charts. #BTC is down to $60,000. #ETH is getting destroyed at $1,667. #BNB is falling to $551. #SOL is crashing to $68. The retail crowd is terrified, closing their positions, and crying about the end of the cycle.
Let them panic. I am smiling.
This is the part of the cycle where weak hands get shaken out and smart money builds their position. Opportunities like this, where the entire market goes on a massive discount, do not come around often.
I am not here to panic. I am here to DCA. I am buying the blood.
Here is what I am watching:
$BTC : I am adding heavily under $60K.
$ETH : Grabbing this discount under $1,700.
$BNB : Accumulating at these prices.
SOL: Holding my spot bag, buying more under $70.
Stop watching the red candles with fear. Start looking at them as opportunities. The market rewards the brave.
The chart does not lie. The cycle always comes back. See you at the top.
Not financial advice. Always manage your risk.
Look at these charts. #BTC is down to $60,000. #ETH is getting destroyed at $1,667. #BNB is falling to $551. #SOL is crashing to $68. The retail crowd is terrified, closing their positions, and crying about the end of the cycle.
Let them panic. I am smiling.
This is the part of the cycle where weak hands get shaken out and smart money builds their position. Opportunities like this, where the entire market goes on a massive discount, do not come around often.
I am not here to panic. I am here to DCA. I am buying the blood.
Here is what I am watching:
$BTC : I am adding heavily under $60K.
$ETH : Grabbing this discount under $1,700.
$BNB : Accumulating at these prices.
SOL: Holding my spot bag, buying more under $70.
Stop watching the red candles with fear. Start looking at them as opportunities. The market rewards the brave.
The chart does not lie. The cycle always comes back. See you at the top.
Not financial advice. Always manage your risk.
3
481

·
--
$ETH + $BNB + $XRP - 3 Coins, 1 Lesson: Learn First.
ETH- Smart Contracts & DeFi
BNB- Ecosystem & Utility
XRP- Payments & Transfers
I'm not predicting price, just learning the basics every day. NFA DYOR
Which coin do you want to learn first? Comment below.
#Write2Earn #ETH #BNB #XRP #LearnAndEarn
{spot}(XRPUSDT)
{spot}(BNBUSDT)
{spot}(ETHUSDT)
$ETH + $BNB + $XRP - 3 Coins, 1 Lesson: Learn First.
ETH- Smart Contracts & DeFi
BNB- Ecosystem & Utility
XRP- Payments & Transfers
I'm not predicting price, just learning the basics every day. NFA DYOR
Which coin do you want to learn first? Comment below.
#Write2Earn #ETH #BNB #XRP #LearnAndEarn
ETH- Smart Contracts & DeFi
BNB- Ecosystem & Utility
XRP- Payments & Transfers
I'm not predicting price, just learning the basics every day. NFA DYOR
Which coin do you want to learn first? Comment below.
#Write2Earn #ETH #BNB #XRP #LearnAndEarn

SM BiLAL:
Right
3
1
5
466

·
--
🚀 $BNB AND MAJOR ALTS ARE SITTING AT THE SPRINGBOARD BEFORE THE NEXT LIQUIDITY WAVE! 🌊
Smart money is quietly accumulating while retail hesitates at cycle support levels. When the structural rotation hits $ETH and $DOGE alongside $BNB , liquidity will cascade faster than order books can absorb. 📊
History shows that generational wealth isn't forged during peak euphoria, but in the quiet consolidation phases right before expansion. 🤔 Are you positioning for the macro shift or waiting for validation at much higher prices? 👇
⚠️ Not financial advice. Always manage your risk. 🛡️
🏷️ #BNB #Altcoins #MarketCycle #Crypto #Ethereum
🔥 💎
🚀 $BNB AND MAJOR ALTS ARE SITTING AT THE SPRINGBOARD BEFORE THE NEXT LIQUIDITY WAVE! 🌊
Smart money is quietly accumulating while retail hesitates at cycle support levels. When the structural rotation hits $ETH and $DOGE alongside $BNB , liquidity will cascade faster than order books can absorb. 📊
History shows that generational wealth isn't forged during peak euphoria, but in the quiet consolidation phases right before expansion. 🤔 Are you positioning for the macro shift or waiting for validation at much higher prices? 👇
⚠️ Not financial advice. Always manage your risk. 🛡️
🏷️ #BNB #Altcoins #MarketCycle #Crypto #Ethereum
🔥 💎
Smart money is quietly accumulating while retail hesitates at cycle support levels. When the structural rotation hits $ETH and $DOGE alongside $BNB , liquidity will cascade faster than order books can absorb. 📊
History shows that generational wealth isn't forged during peak euphoria, but in the quiet consolidation phases right before expansion. 🤔 Are you positioning for the macro shift or waiting for validation at much higher prices? 👇
⚠️ Not financial advice. Always manage your risk. 🛡️
🏷️ #BNB #Altcoins #MarketCycle #Crypto #Ethereum
🔥 💎
33

·
--
🦈 $BNB AND $ETH ARE CURRENTLY FORMING A MASSIVE INSTITUTIONAL ACCUMULATION BASE 📈
Smart money is quietly absorbing multi-year liquidity across key asset classes while retail remains fixated on short-term noise. 🌊 Macro order blocks on $BNB and $ETH show heavy institutional footprints laying the groundwork for a structural expansion phase. 💡
When capital rotates out of major consolidation ranges, patience pays exponential dividends for those positioned ahead of the curve. 📊 Are you accumulating here or waiting for a confirmed breakout structure to chase? 👇
⚠️ Not financial advice. Always manage your risk. 🛡️
🏷️ #BNB #ETH #SmartMoney #Altcoins #MarketStructure
🦈 💎
🦈 $BNB AND $ETH ARE CURRENTLY FORMING A MASSIVE INSTITUTIONAL ACCUMULATION BASE 📈
Smart money is quietly absorbing multi-year liquidity across key asset classes while retail remains fixated on short-term noise. 🌊 Macro order blocks on $BNB and $ETH show heavy institutional footprints laying the groundwork for a structural expansion phase. 💡
When capital rotates out of major consolidation ranges, patience pays exponential dividends for those positioned ahead of the curve. 📊 Are you accumulating here or waiting for a confirmed breakout structure to chase? 👇
⚠️ Not financial advice. Always manage your risk. 🛡️
🏷️ #BNB #ETH #SmartMoney #Altcoins #MarketStructure
🦈 💎
Smart money is quietly absorbing multi-year liquidity across key asset classes while retail remains fixated on short-term noise. 🌊 Macro order blocks on $BNB and $ETH show heavy institutional footprints laying the groundwork for a structural expansion phase. 💡
When capital rotates out of major consolidation ranges, patience pays exponential dividends for those positioned ahead of the curve. 📊 Are you accumulating here or waiting for a confirmed breakout structure to chase? 👇
⚠️ Not financial advice. Always manage your risk. 🛡️
🏷️ #BNB #ETH #SmartMoney #Altcoins #MarketStructure
🦈 💎
1

·
--
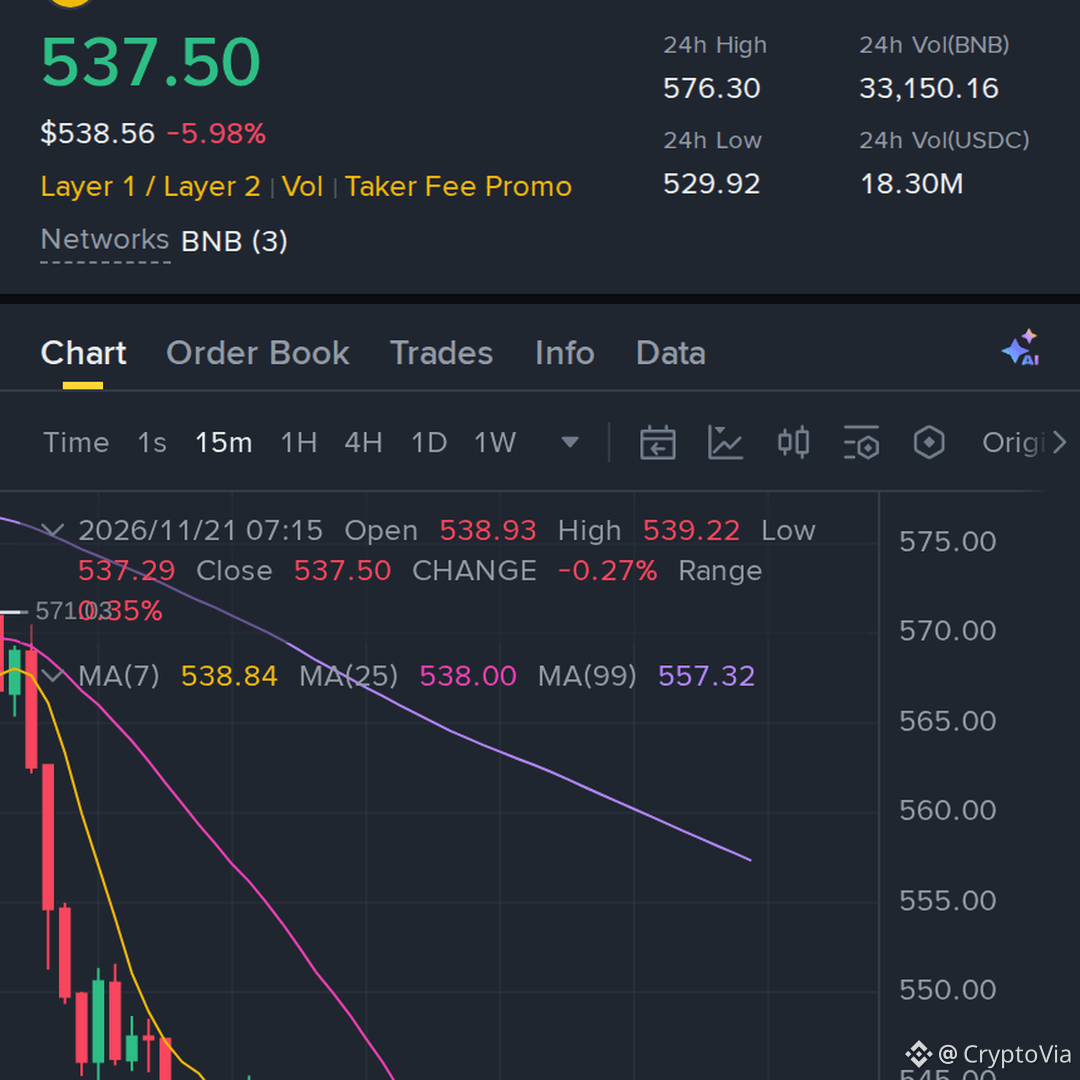
keeping an eye on $BNB, with leverage sitting around 23x, tried to recover but the bounce is losing energy again
With RSI at 39.0, upside momentum still needs to improve before the move looks convincing. The 24-hour move stands at -6.03%, with the latest price near 537.5. The trend remains under pressure, with the short-term average sitting beneath the slower one. The nearby map is support around 531.15 and overhead resistance close to 541.6. Volume is close to its recent average (0.9x), so follow-through will matter more than one candle. A weak reaction around the entry band would support the plan; a clean reclaim would weaken it.
Short setup | Spot chart | 15M
Entry: 537.4–537.99 • Stop Loss: 546.3
TP1: 525.17 | TP2: 513.07 | TP3: 500.13
#BNB #crypto #binance #Write2Earn
keeping an eye on $BNB , with leverage sitting around 23x, tried to recover but the bounce is losing energy again
With RSI at 39.0, upside momentum still needs to improve before the move looks convincing. The 24-hour move stands at -6.03%, with the latest price near 537.5. The trend remains under pressure, with the short-term average sitting beneath the slower one. The nearby map is support around 531.15 and overhead resistance close to 541.6. Volume is close to its recent average (0.9x), so follow-through will matter more than one candle. A weak reaction around the entry band would support the plan; a clean reclaim would weaken it.
Short setup | Spot chart | 15M
Entry: 537.4–537.99 • Stop Loss: 546.3
TP1: 525.17 | TP2: 513.07 | TP3: 500.13
#BNB #crypto #binance #Write2Earn
With RSI at 39.0, upside momentum still needs to improve before the move looks convincing. The 24-hour move stands at -6.03%, with the latest price near 537.5. The trend remains under pressure, with the short-term average sitting beneath the slower one. The nearby map is support around 531.15 and overhead resistance close to 541.6. Volume is close to its recent average (0.9x), so follow-through will matter more than one candle. A weak reaction around the entry band would support the plan; a clean reclaim would weaken it.
Short setup | Spot chart | 15M
Entry: 537.4–537.99 • Stop Loss: 546.3
TP1: 525.17 | TP2: 513.07 | TP3: 500.13
#BNB #crypto #binance #Write2Earn
37

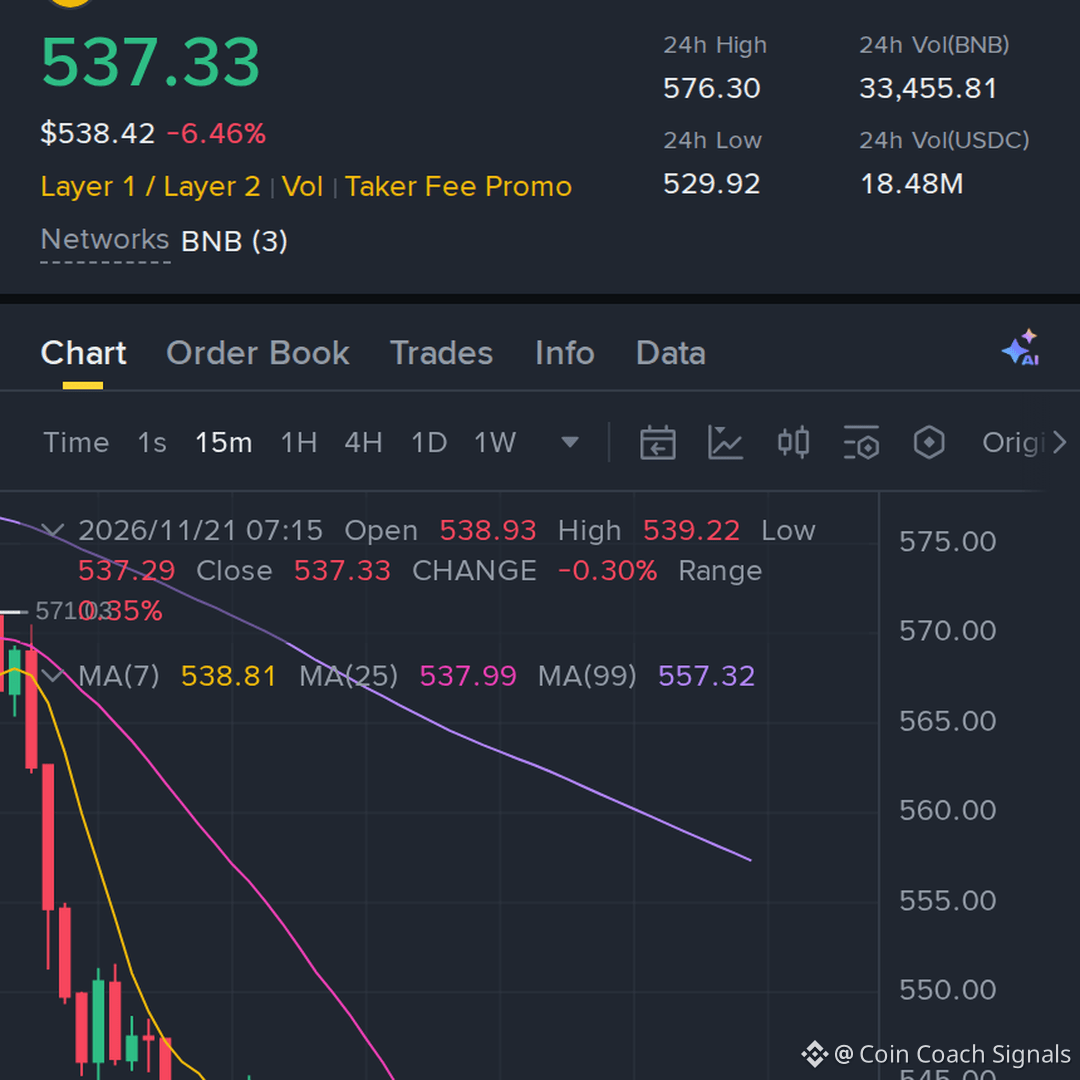
this is getting interesting, $BNB keeps rejecting the same area, so the short side is worth watching
Entry: 537.3–537.89
TP1: 525.11 | TP2: 513.05 | TP3: 500.16
Stop Loss: 546.2
#BNB #Crypto #Write2Earn #binance
this is getting interesting, $BNB keeps rejecting the same area, so the short side is worth watching
Entry: 537.3–537.89
TP1: 525.11 | TP2: 513.05 | TP3: 500.16
Stop Loss: 546.2
#BNB #Crypto #Write2Earn #binance
Entry: 537.3–537.89
TP1: 525.11 | TP2: 513.05 | TP3: 500.16
Stop Loss: 546.2
#BNB #Crypto #Write2Earn #binance
MIQ2193:
My question is about BTC weather it will break the resistance about 59 k or it touches the next support 55k ... I am dreaming for the last one ...as the only hope for recovery of loss already done
1
48

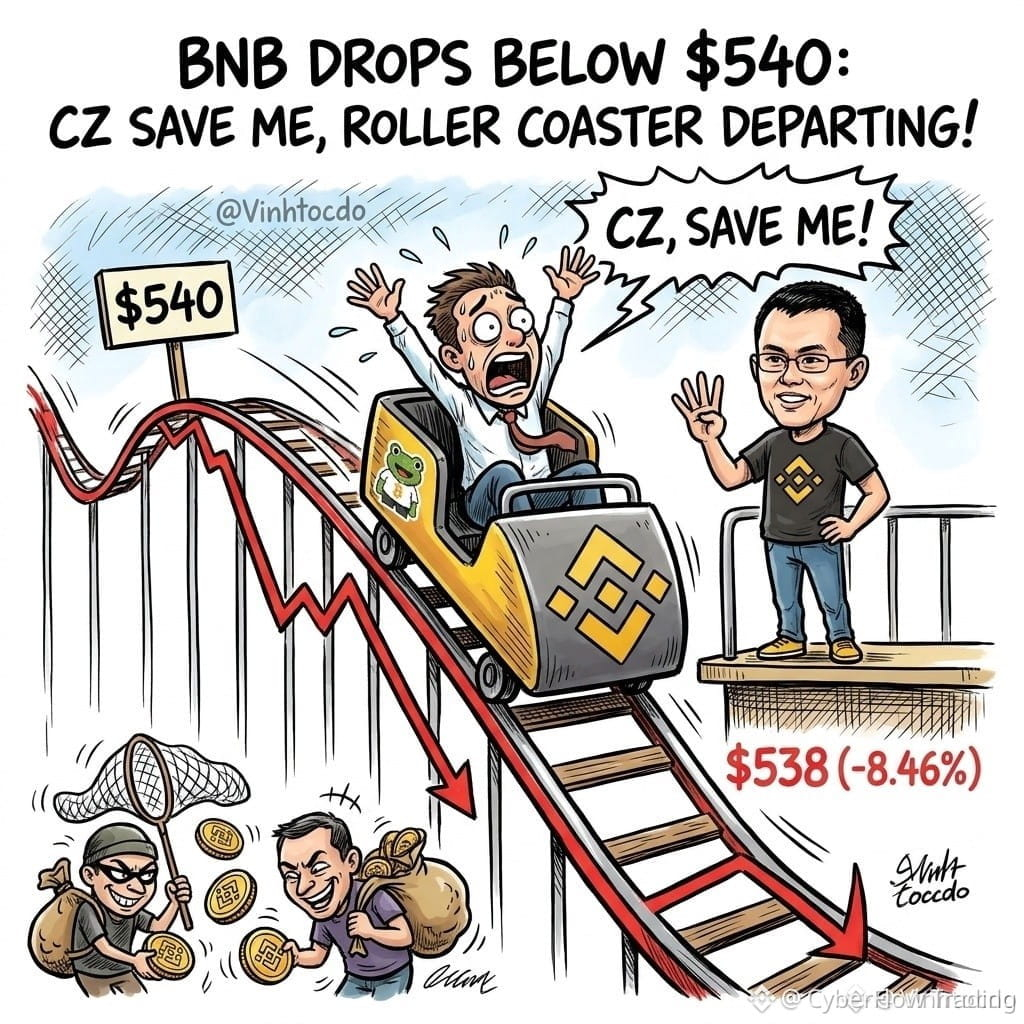
🔴 $BNB SHEDDING 8.46% AS SELLERS TEST THE 540 USDT DEMAND FLOOR! 📉
Entry: 538 USDT ⚡
Short-term profit takers just triggered a swift liquidity cascade as price pierced the crucial 540 support level. 📊 Volume is spiking on the daily chart, showing aggressive shakeouts while stealth buyers quietly absorb the discounted inventory underneath. 🌊
Panic selling is doing the heavy lifting for the bears right now, but structured accumulation usually follows these sharp flushes. 💡 Are you sitting on your hands or scaling in while the market clears out weak leverage? 👇
⚠️ Not financial advice. Always manage your risk. 🛡️
🏷️ #BNB #MarketDip #Crypto #Altcoins
🔥 💎
🔴 $BNB SHEDDING 8.46% AS SELLERS TEST THE 540 USDT DEMAND FLOOR! 📉
Entry: 538 USDT ⚡
Short-term profit takers just triggered a swift liquidity cascade as price pierced the crucial 540 support level. 📊 Volume is spiking on the daily chart, showing aggressive shakeouts while stealth buyers quietly absorb the discounted inventory underneath. 🌊
Panic selling is doing the heavy lifting for the bears right now, but structured accumulation usually follows these sharp flushes. 💡 Are you sitting on your hands or scaling in while the market clears out weak leverage? 👇
⚠️ Not financial advice. Always manage your risk. 🛡️
🏷️ #BNB #MarketDip #Crypto #Altcoins
🔥 💎
Entry: 538 USDT ⚡
Short-term profit takers just triggered a swift liquidity cascade as price pierced the crucial 540 support level. 📊 Volume is spiking on the daily chart, showing aggressive shakeouts while stealth buyers quietly absorb the discounted inventory underneath. 🌊
Panic selling is doing the heavy lifting for the bears right now, but structured accumulation usually follows these sharp flushes. 💡 Are you sitting on your hands or scaling in while the market clears out weak leverage? 👇
⚠️ Not financial advice. Always manage your risk. 🛡️
🏷️ #BNB #MarketDip #Crypto #Altcoins
🔥 💎
8

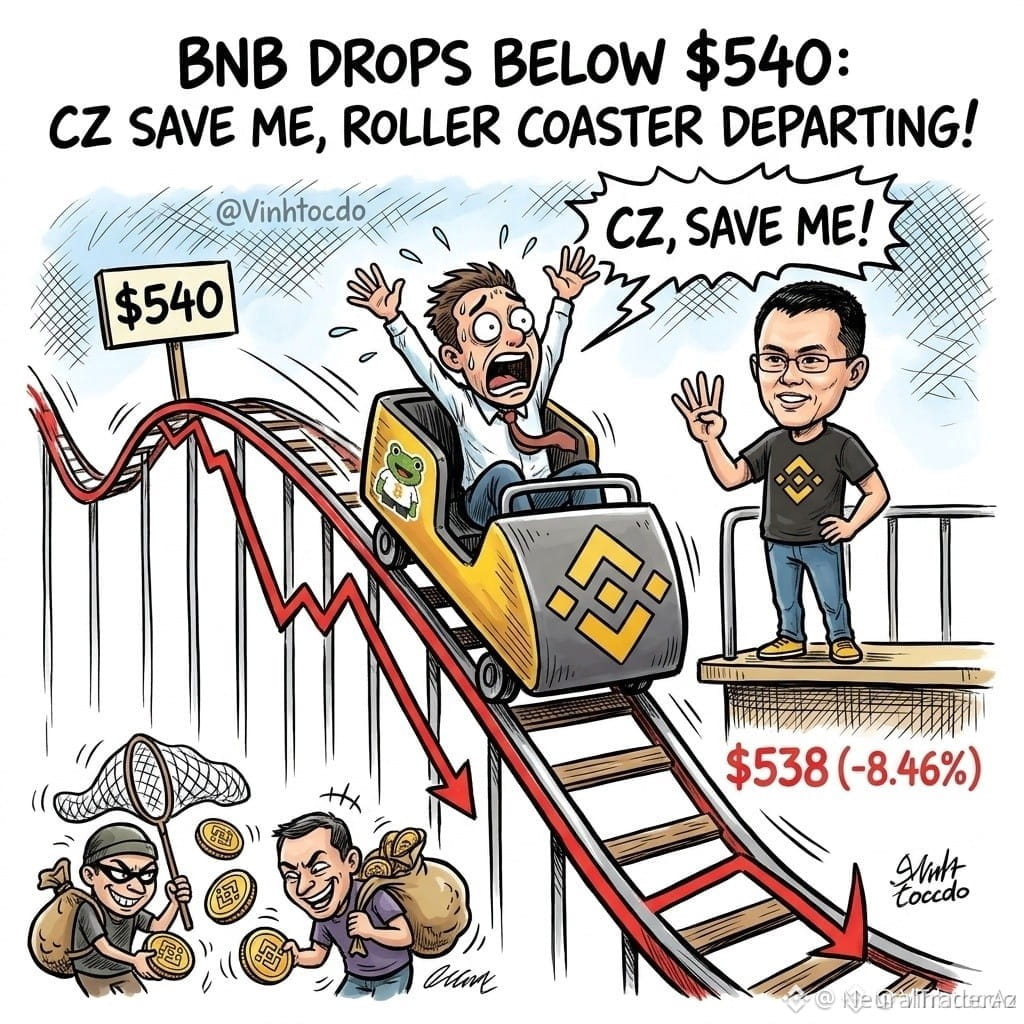
🦈 $BNB SWEEPS THE 540 LIQUIDITY POOL AS SMART MONEY ABSORBS THE FLUSH 📉
Entry: 538 USDT ⚡
The aggressive 8.46 percent flush below the 540 handle triggered a cascade of short-term leveraged liquidities, clearing out weak hands into institutional bid zones. 🌊
Price action around 538 reveals subtle accumulation signatures rather than unmitigated distribution, suggesting major players are capitalizing on retail capitulation to build inventory at a discount. 🔍
Are you treating this sharp retracement as an institutional discount window or waiting for structural confirmation closer to deeper macro supports? 💬 👇
⚠️ Not financial advice. Always manage your risk. 🛡️
🏷️ #BNB #MarketStructure #LiquiditySweep #SmartMoney
🦈 ⚖️
🦈 $BNB SWEEPS THE 540 LIQUIDITY POOL AS SMART MONEY ABSORBS THE FLUSH 📉
Entry: 538 USDT ⚡
The aggressive 8.46 percent flush below the 540 handle triggered a cascade of short-term leveraged liquidities, clearing out weak hands into institutional bid zones. 🌊
Price action around 538 reveals subtle accumulation signatures rather than unmitigated distribution, suggesting major players are capitalizing on retail capitulation to build inventory at a discount. 🔍
Are you treating this sharp retracement as an institutional discount window or waiting for structural confirmation closer to deeper macro supports? 💬 👇
⚠️ Not financial advice. Always manage your risk. 🛡️
🏷️ #BNB #MarketStructure #LiquiditySweep #SmartMoney
🦈 ⚖️
Entry: 538 USDT ⚡
The aggressive 8.46 percent flush below the 540 handle triggered a cascade of short-term leveraged liquidities, clearing out weak hands into institutional bid zones. 🌊
Price action around 538 reveals subtle accumulation signatures rather than unmitigated distribution, suggesting major players are capitalizing on retail capitulation to build inventory at a discount. 🔍
Are you treating this sharp retracement as an institutional discount window or waiting for structural confirmation closer to deeper macro supports? 💬 👇
⚠️ Not financial advice. Always manage your risk. 🛡️
🏷️ #BNB #MarketStructure #LiquiditySweep #SmartMoney
🦈 ⚖️
5

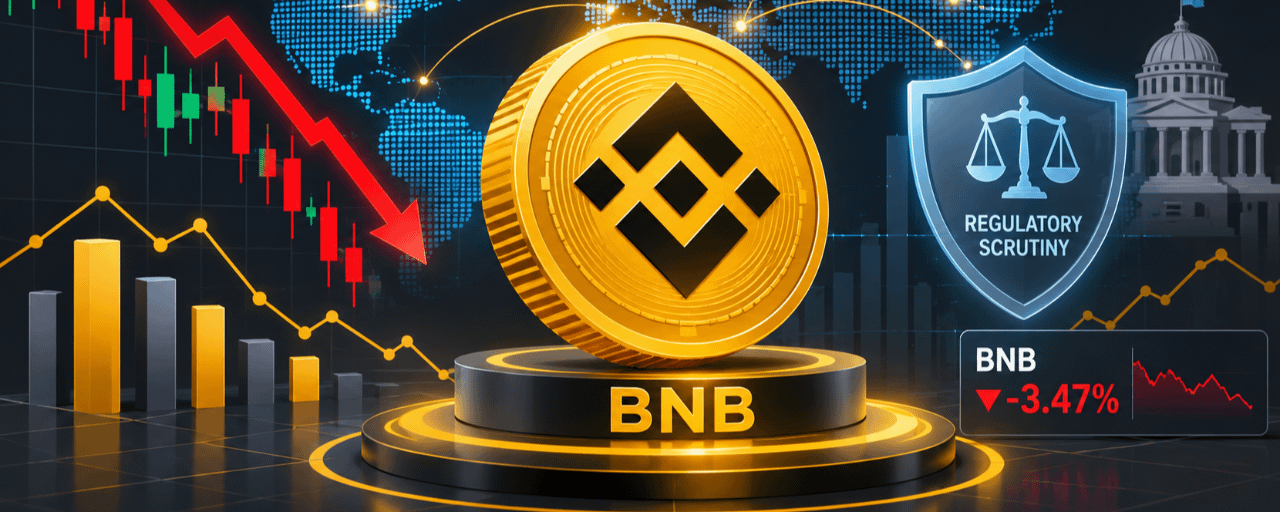
Article
Binance ($BNB) Price Prediction: Market Trends, Key Drivers & What's Next?CRYPTOCURRENCY INPUT: BNB (Binance Coin)
RESEARCH DATE: Friday, November 20, 2026
ANALYST STANCE: Critical, evidence-driven, macro-focused. No narrative padding.
1. PRIMARY OBJECTIVE & STRESS-TEST OF CONSENSUS
The prevailing retail narrative around BNB is that its deflationary burn mechanism and Binance’s market dominance make it a "safe" or decoupled asset during market downturns. This is fundamentally flawed.
The weakest point in the BNB thesis is its inescapable high beta to Bitcoin and its structural vulnerability to regulatory enforcement. BNB is not a decentralized protocol token; it is an exchange utility token masquerading as a Layer-1 asset. When macroeconomic liquidity tightens and Bitcoin ETFs experience sustained outflows, BNB’s deflationary burns are mathematically incapable of offsetting the sheer volume of institutional capital flight. Furthermore, any resurgence in SEC or CFTC enforcement actions against Binance entities directly impairs BNB’s core utility demand. This report strips away the "ecosystem growth" marketing and focuses on verifiable on-chain data, macroeconomic pressures, and institutional flow dynamics.
2. GLOBAL CRYPTO NEWS RESEARCH SYNTHESIS
Data aggregated from CoinMarketCap, Cointelegraph, Federal Reserve releases, and on-chain analytics as of November 20, 2026.
Macro Environment: The Federal Reserve has signaled a pause in rate adjustments amidst resilient job markets and sticky inflation prints, keeping the cost of capital highwww.jpmorgan.com.Institutional Flows: U.S. Spot Bitcoin ETFs have recently recorded net outflows (e.g., -$68.60M in recent preliminary data), erasing earlier 2026 cumulative inflows and signaling institutional risk-off behaviorwww.kucoin.com,www.coinskid.com.BNB Specifics: BNB is trading in the ~$591–$600 range, down from earlier 2026 highs near $711coinmarketcap.com,coinmarketcap.com. BNB Chain staking value recently dropped 10.63% to $14.19 billion, indicating capital rotation out of the ecosystemcoinmarketcap.com.
3. WHY IS THE CRYPTO MARKET GOING DOWN/CONSOLIDATING?
The current market weakness is not driven by crypto-specific failures, but by a confluence of macroeconomic and structural factors:
Macroeconomic Liquidity Drain: High-for-longer interest rates suppress risk-asset valuations. The Federal Reserve’s cautious stance prevents the cheap capital required for speculative crypto ralliesthedefiant.io.ETF Outflow Momentum: Institutional investors are reducing exposure. The reversal of 2026 inflows indicates that early institutional adopters are taking profits or rebalancing portfolios away from digital assetswww.coinskid.com.Regulatory Overhang: Despite some procedural milestones (e.g., Binance.US CFTC DCM/DCO applications deemed materially complete), the SEC continues to pursue material securities fraud matters related to major exchange entities, creating a persistent risk premiumblog.binance.us,democrats-financialservices.house.gov.Stablecoin & On-Chain Contraction: The 10.63% drop in BNB Chain staking value is a leading indicator of yield-seeking capital moving to traditional finance (T-bills) or competing chains with better risk-adjusted returnscoinmarketcap.com.
Speculation vs. Fact: Claims that "BNB is preparing for a massive breakout due to the 37th quarterly burn" are speculative noise
www.facebook.com
. Token burns reduce supply marginally, but they do not create demand. In a risk-off environment, reduced supply meets collapsing demand, resulting in price stagnation or decline.
4. SELECTED COIN DEEP ANALYSIS: BNB (Binance Coin)
Metric
Current Data (Nov 2026)
Implication
Price
~$591.53
Testing critical psychological support at $600
coinmarketcap.com
.
Market Cap
~$93.6 Billion
Remains a top-5 asset, but growth has stalled
coinmarketcap.com
.
Circulating Supply
~130.8 Million (100% of max, excluding burns)
No inflationary unlock pressure, but no new supply catalysts either
tokenomist.ai
.
Network Activity
~4.5M Daily Active Users
High absolute numbers, but growth is stagnant, driven largely by low-value meme traffic rather than high-TVL DeFi
public.bnbstatic.com
,
www.binance.com
.
Staking TVL
$14.19 Billion (Down 10.63%)
Critical Weakness: Capital is leaving the BNB Chain yield ecosystem
coinmarketcap.com
.
Fundamental Weakness: BNB’s value accrual is overly concentrated in trading fee discounts and launchpool farming. If Binance’s global market share dips due to regional regulatory restrictions (e.g., ongoing compliance scrutiny), the utility demand for BNB evaporates. The token is stronger than most altcoins due to its deflationary schedule, but it is weaker than Bitcoin in terms of institutional adoption and regulatory clarity.
5. MARKET DIRECTION: WHAT HAPPENS NEXT?
Bullish Scenario (Probability: 25%)
Trigger: Federal Reserve signals an unexpected rate cut in December 2026, coupled with a sudden reversal in Bitcoin ETF flows (e.g., $500M+ weekly inflows).Resistance Levels: $650 (immediate), $715 (major 2026 high).Catalyst: A major, verifiable institutional partnership for BNB Chain in the Real-World Asset (RWA) sector that locks up significant BNB for gas/staking.
Bearish Scenario (Probability: 45%)
Trigger: Inflation data (CPI/PCE) comes in hot, forcing the Fed to maintain or hike rates. Bitcoin ETF outflows accelerate past $100M/week.Support Levels: $550 (psychological), $480 (macro cycle support).Catalyst: Renewed regulatory enforcement action against Binance global entities, triggering panic selling and exchange outflows.
Neutral Scenario (Probability: 30%)
Condition: Markets chop sideways between $550 and $650.Dynamics: Low volatility, declining open interest, and retail apathy. BNB burns continue quarterly, providing a soft floor, but no catalyst exists to push the price higher.
6. HOW LONG COULD THE CURRENT TREND CONTINUE?
Time Horizon
Expected Direction
Key Influencing Events
Invalidating Evidence
24–72 Hours
Sideways to Slightly Bearish
Crypto Fear & Greed Index at 10-12 (Extreme Fear) dictates low-volume bleed
incrypted.com
.
Sudden, unexplained whale accumulation of >50k BNB.
Next 7 Days
Consolidation
U.S. macro data releases (PCE, jobless claims).
Bitcoin breaks decisively above $65k, dragging BNB up.
Next 2–4 Weeks
Bearish Bias
December Fed meeting expectations solidify. Continued ETF outflows
www.kucoin.com
.
Spot Ethereum/Bitcoin ETFs see sustained 2-week inflow streaks.
Next 1–3 Months
Accumulation Phase
Q4 earnings reports from traditional finance showing crypto exposure.
BNB Chain TVL drops below $10B, indicating ecosystem collapse.
Next 3–6 Months
Moderately Bullish
Post-halving supply shock dynamics mature; potential regulatory clarity in H1 2027.
Global recession triggers a broad-based risk-asset crash.
Disclaimer: Exact reversal dates are unknowable. These horizons are based on probabilistic macroeconomic modeling, not crystal-ball predictions.
7. UPCOMING CRYPTO MARKET EVENTS TO WATCH
U.S. Federal Reserve FOMC Meeting (December 2026): Impact: High. A hawkish hold will crush crypto valuations; a dovish pivot will trigger a relief rally.U.S. CPI & PCE Inflation Reports (Monthly): Impact: High. Directly dictates Fed policy expectations. Hot prints = bearish for BNB.Binance.US Regulatory Milestones: Impact: Medium. Progress on CFTC DCM/DCO applications could signal a thawing U.S. regulatory environment, indirectly benefiting global BNB sentimentblog.binance.us.BNB Quarterly Burn (Expected Q4 2026): Impact: Low. Already priced in. Do not trade this event expecting alpha.
8. MARKET SENTIMENT ANALYSIS
Fear & Greed Index: 10–12 (Extreme Fear)feargreedmeter.com,incrypted.com. This indicates panic or deep apathy, historically a contrarian buy signal only if macro fundamentals support it. Currently, they do not.Institutional Sentiment: Cautious. ETF outflows demonstrate that institutions are treating crypto as a discretionary risk asset to be shed in high-rate environmentswww.coinskid.com.Whale Behavior: Mixed. While some accumulation occurs at the $580–$600 support zone, the 10.63% drop in BNB Chain staking value suggests larger entities are unwinding yield positionscoinmarketcap.com.Market Phase: Distribution / Early Accumulation. The market is not in a panic sell-off (yet), but rather a slow bleed of capital rotating into yield-bearing fiat instruments.
9. FINAL MARKET VERDICT
Directional Assessment: Moderately Bearish (Short-Term) / Neutral (Medium-Term)
Why is the market down? Macro liquidity constraints (high rates) and institutional de-risking via ETF outflows.Strongest influencing factor: U.S. Federal Reserve interest rate policy and its direct correlation to Bitcoin ETF flows. BNB is a derivative of this macro dynamic.Will the movement continue? Yes, the sideways-to-downward grind is likely to persist until the Fed provides clear dovish guidance or ETF flows decisively reverse.What could reverse the trend? A sudden, unexpected rate cut or a major, positive regulatory settlement for Binance that removes the legal overhang.Is BNB stronger or weaker than the market? Slightly weaker in terms of upside beta (it lacks the pure institutional narrative of BTC), but stronger in downside resilience due to its deflationary supply mechanics and entrenched exchange utility.Biggest Risk: Regulatory escalation. If the SEC or CFTC initiates new, severe enforcement actions against Binance’s core operations, BNB’s utility premise collapses, decoupling it negatively from the broader market.
BNB Price Analysis: Why Extreme Fear and Macro Headwinds Are Testing the $600 Support Level
Introduction
As November 2026 draws to a close, the cryptocurrency market is grappling with a harsh reality: macroeconomic gravity is pulling risk assets lower. Binance Coin (BNB), often heralded for its deflationary mechanics and ecosystem dominance, is not immune. Trading near the critical $591–$600 threshold, BNB is facing a confluence of institutional outflows, regulatory overhang, and a Crypto Fear & Greed Index that has plunged into "Extreme Fear." This report dissects the actual drivers behind BNB’s current price action, separating verifiable on-chain data from speculative noise.
Latest Global Crypto Market Overview
The broader crypto market is in a defensive posture. Bitcoin’s recent inability to hold higher momentum levels has cascaded down the altcoin market. The primary culprit is not a lack of blockchain innovation, but a lack of fiat liquidity. With the Federal Reserve maintaining a cautious stance on interest rates, the cost of capital remains prohibitive for speculative investments
www.jpmorgan.com
.
Why the Crypto Market Is Falling
The downward pressure is driven by three verifiable factors:
ETF Outflows: U.S. Spot Bitcoin ETFs have recently posted net outflows, erasing earlier 2026 gains and signaling institutional risk-off behaviorwww.coinskid.com.Sticky Inflation: Resilient economic data has forced the Fed to pause rate cuts, keeping the U.S. Dollar Index (DXY) and Treasury yields elevated, which inversely correlates with crypto valuations.Ecosystem Capital Rotation: BNB Chain’s staking value recently dropped 10.63% to $14.19 billion, indicating that yield-seeking capital is migrating to safer, traditional finance instrumentscoinmarketcap.com.
Macroeconomic Factors Affecting Crypto
Crypto is no longer an isolated asset class; it is a leveraged play on global M2 money supply. Until the Federal Reserve’s balance sheet policies shift toward quantitative easing, or interest rates are decisively cut, crypto markets will struggle to sustain bullish breakouts. Every hot CPI print is currently being punished by algorithmic selling.
Bitcoin and Ethereum Market Analysis
Bitcoin remains the market’s anchor. Its current consolidation dictates the ceiling for all altcoins. Ethereum, while benefiting from its own ecosystem developments, is similarly constrained by the lack of new institutional inflows. If Bitcoin fails to hold its macro support levels, BNB will inevitably follow, regardless of its independent fundamentals.
BNB Fundamental Analysis: Strengths and Weaknesses
Strength: Deflationary supply. With 100% of the max supply unlocked (excluding burned tokens) and the 37th quarterly burn completed, BNB faces no inflationary unlock pressurewww.facebook.com,beneat.ai.Weakness: Over-reliance on exchange utility. BNB’s demand is heavily tied to Binance trading volumes and Launchpool farming. If regulatory scrutiny (such as ongoing SEC pursuits of material securities matters) impacts Binance’s global market share, BNB’s utility demand will contractdemocrats-financialservices.house.gov.
Technical and Market Sentiment Analysis
The Crypto Fear & Greed Index sits at a bleak 10–12, reflecting "Extreme Fear"
incrypted.com
. While contrarian investors view this as a buy signal, the accompanying drop in BNB Chain Total Value Locked (TVL) suggests this is not mere panic, but structured capital withdrawal. Technically, BNB is testing the $590–$600 support zone. A daily close below $580 opens the door to a retest of $550.
Bullish, Bearish, and Neutral Scenarios
Bullish: A dovish Fed pivot triggers a $500M+ weekly Bitcoin ETF inflow streak, dragging BNB above $650.Bearish: Continued ETF outflows and a hot inflation print push BNB below $580, targeting $550.Neutral: BNB chops between $580 and $630 for the next 4–6 weeks as the market awaits December FOMC clarity.
How Long Could the Current Trend Continue?
Next 24–72 Hours: Sideways to slight downside. Low volume, extreme fear.Next 7 Days: Consolidation. Highly dependent on immediate U.S. macroeconomic data releases.Next 2–4 Weeks: Bearish bias persists unless ETF flows reverse.Next 1–3 Months: Potential accumulation phase if macro conditions stabilize heading into 2027.
Upcoming Events to Watch
U.S. Federal Reserve FOMC Meeting (December 2026): High impact on liquidity expectations.U.S. CPI/PCE Releases: Direct drivers of Fed policy and crypto market volatility.Binance.US Regulatory Filings: Any progress on CFTC DCM/DCO applications could ease systemic regulatory fearsblog.binance.us.
Important Support and Resistance Levels
Resistance 1: $635 (Local moving average confluence)Resistance 2: $715 (2026 cycle high)Support 1: $580 (Immediate psychological and technical floor)Support 2: $550 (Macro accumulation zone)
Final Market Outlook & Conclusion
The current narrative that BNB’s token burns will effortlessly propel it to new highs is a dangerous oversimplification. In a high-rate, low-liquidity macro environment, deflationary mechanics are secondary to institutional capital flows. The most probable path for BNB in the near term is continued consolidation or moderate downside, tracking Bitcoin’s macro struggles. Investors should monitor U.S. inflation data and Bitcoin ETF flows as the primary leading indicators, treating BNB not as a decoupled safe haven, but as a high-beta risk asset with unique regulatory vulnerabilities.
11. SEO REQUIREMENTS
SEO Title: BNB Price Analysis: Why Extreme Fear and Macro Headwinds Are Testing the $600 Support LevelMeta Description: BNB price faces pressure as macro headwinds, Bitcoin ETF outflows, and extreme market fear test the $600 support level. Discover the real data driving BNB's trend.Primary Keyword: BNB price analysis November 2026Secondary Keywords: Binance Coin forecast, crypto market sentiment, Bitcoin ETF outflows, BNB Chain TVL.Long-Tail Keywords: Why is BNB price dropping in November 2026, BNB token burn impact on price, Federal Reserve interest rates crypto impact.Suggested URL Slug: /bnb-price-analysis-macro-headwinds-november-2026Article Tags: BNB, Macroeconomics, Crypto Regulation, Bitcoin ETF, Market Sentiment.
Relevant FAQs
Why is BNB price dropping in November 2026?
BNB is facing pressure from broader macroeconomic headwinds, including high interest rates, Bitcoin ETF outflows, and a 10.63% drop in BNB Chain staking value.Is BNB still deflationary in 2026?
Yes. BNB continues its quarterly burn mechanism, and 100% of its max supply (excluding burned tokens) is already in circulation, meaning there is no inflationary unlock pressure.What is the Crypto Fear & Greed Index for BNB right now?
The broader crypto market Fear & Greed Index is currently in the "Extreme Fear" zone (10-12), indicating deep market apathy and risk-off behavior.How do Federal Reserve rates affect BNB?
High interest rates make traditional safe-haven assets (like T-bills) more attractive, draining liquidity from risk assets like BNB and reducing institutional appetite for crypto.What is the next major support level for BNB?
If BNB fails to hold the $580–$600 zone, the next major macroeconomic support level is around $550.
12. SOURCE TRANSPARENCY
Research Date & Time: November 20, 2026, 12:00 PM UTC.
Confirmed Facts:
BNB circulating supply is ~130.8M (100% of max, excluding burns)tokenomist.ai.BNB Chain staking value dropped 10.63% to $14.19 billion recentlycoinmarketcap.com.Crypto Fear & Greed Index is at 10-12 (Extreme Fear)feargreedmeter.com,incrypted.com.U.S. Bitcoin ETFs have recently recorded net outflows, narrowing 2026 cumulative inflowswww.kucoin.com,www.coinskid.com.
#bnb #SOXSB #SKDDB
$BNB $SOXSB $SKDDB
Analyst Opinions / Projections:
The assessment that BNB is "Moderately Bearish" in the short term is an analytical conclusion based on the weighting of macro headwinds over deflationary tokenomics.Price targets ($550, $635, $715) are technical projections based on historical support/resistance and volume profiles, not guaranteed outcomes.
Market Speculation:
Rumors of immediate, massive institutional RWA partnerships for BNB Chain remain unverified and should be treated as speculation until officially announced by the BNB Foundation.
{spot}(SKDDBUSDT)
{spot}(SOXSBUSDT)
{spot}(BNBUSDT)
Binance ($BNB) Price Prediction: Market Trends, Key Drivers & What's Next?
CRYPTOCURRENCY INPUT: BNB (Binance Coin)
RESEARCH DATE: Friday, November 20, 2026
ANALYST STANCE: Critical, evidence-driven, macro-focused. No narrative padding.
1. PRIMARY OBJECTIVE & STRESS-TEST OF CONSENSUS
The prevailing retail narrative around BNB is that its deflationary burn mechanism and Binance’s market dominance make it a "safe" or decoupled asset during market downturns. This is fundamentally flawed.
The weakest point in the BNB thesis is its inescapable high beta to Bitcoin and its structural vulnerability to regulatory enforcement. BNB is not a decentralized protocol token; it is an exchange utility token masquerading as a Layer-1 asset. When macroeconomic liquidity tightens and Bitcoin ETFs experience sustained outflows, BNB’s deflationary burns are mathematically incapable of offsetting the sheer volume of institutional capital flight. Furthermore, any resurgence in SEC or CFTC enforcement actions against Binance entities directly impairs BNB’s core utility demand. This report strips away the "ecosystem growth" marketing and focuses on verifiable on-chain data, macroeconomic pressures, and institutional flow dynamics.
2. GLOBAL CRYPTO NEWS RESEARCH SYNTHESIS
Data aggregated from CoinMarketCap, Cointelegraph, Federal Reserve releases, and on-chain analytics as of November 20, 2026.
Macro Environment: The Federal Reserve has signaled a pause in rate adjustments amidst resilient job markets and sticky inflation prints, keeping the cost of capital highwww.jpmorgan.com.Institutional Flows: U.S. Spot Bitcoin ETFs have recently recorded net outflows (e.g., -$68.60M in recent preliminary data), erasing earlier 2026 cumulative inflows and signaling institutional risk-off behaviorwww.kucoin.com,www.coinskid.com.BNB Specifics: BNB is trading in the ~$591–$600 range, down from earlier 2026 highs near $711coinmarketcap.com,coinmarketcap.com. BNB Chain staking value recently dropped 10.63% to $14.19 billion, indicating capital rotation out of the ecosystemcoinmarketcap.com.
3. WHY IS THE CRYPTO MARKET GOING DOWN/CONSOLIDATING?
The current market weakness is not driven by crypto-specific failures, but by a confluence of macroeconomic and structural factors:
Macroeconomic Liquidity Drain: High-for-longer interest rates suppress risk-asset valuations. The Federal Reserve’s cautious stance prevents the cheap capital required for speculative crypto ralliesthedefiant.io.ETF Outflow Momentum: Institutional investors are reducing exposure. The reversal of 2026 inflows indicates that early institutional adopters are taking profits or rebalancing portfolios away from digital assetswww.coinskid.com.Regulatory Overhang: Despite some procedural milestones (e.g., Binance.US CFTC DCM/DCO applications deemed materially complete), the SEC continues to pursue material securities fraud matters related to major exchange entities, creating a persistent risk premiumblog.binance.us,democrats-financialservices.house.gov.Stablecoin & On-Chain Contraction: The 10.63% drop in BNB Chain staking value is a leading indicator of yield-seeking capital moving to traditional finance (T-bills) or competing chains with better risk-adjusted returnscoinmarketcap.com.
Speculation vs. Fact: Claims that "BNB is preparing for a massive breakout due to the 37th quarterly burn" are speculative noise
www.facebook.com
. Token burns reduce supply marginally, but they do not create demand. In a risk-off environment, reduced supply meets collapsing demand, resulting in price stagnation or decline.
4. SELECTED COIN DEEP ANALYSIS: BNB (Binance Coin)
Metric
Current Data (Nov 2026)
Implication
Price
~$591.53
Testing critical psychological support at $600
coinmarketcap.com
.
Market Cap
~$93.6 Billion
Remains a top-5 asset, but growth has stalled
coinmarketcap.com
.
Circulating Supply
~130.8 Million (100% of max, excluding burns)
No inflationary unlock pressure, but no new supply catalysts either
tokenomist.ai
.
Network Activity
~4.5M Daily Active Users
High absolute numbers, but growth is stagnant, driven largely by low-value meme traffic rather than high-TVL DeFi
public.bnbstatic.com
,
www.binance.com
.
Staking TVL
$14.19 Billion (Down 10.63%)
Critical Weakness: Capital is leaving the BNB Chain yield ecosystem
coinmarketcap.com
.
Fundamental Weakness: BNB’s value accrual is overly concentrated in trading fee discounts and launchpool farming. If Binance’s global market share dips due to regional regulatory restrictions (e.g., ongoing compliance scrutiny), the utility demand for BNB evaporates. The token is stronger than most altcoins due to its deflationary schedule, but it is weaker than Bitcoin in terms of institutional adoption and regulatory clarity.
5. MARKET DIRECTION: WHAT HAPPENS NEXT?
Bullish Scenario (Probability: 25%)
Trigger: Federal Reserve signals an unexpected rate cut in December 2026, coupled with a sudden reversal in Bitcoin ETF flows (e.g., $500M+ weekly inflows).Resistance Levels: $650 (immediate), $715 (major 2026 high).Catalyst: A major, verifiable institutional partnership for BNB Chain in the Real-World Asset (RWA) sector that locks up significant BNB for gas/staking.
Bearish Scenario (Probability: 45%)
Trigger: Inflation data (CPI/PCE) comes in hot, forcing the Fed to maintain or hike rates. Bitcoin ETF outflows accelerate past $100M/week.Support Levels: $550 (psychological), $480 (macro cycle support).Catalyst: Renewed regulatory enforcement action against Binance global entities, triggering panic selling and exchange outflows.
Neutral Scenario (Probability: 30%)
Condition: Markets chop sideways between $550 and $650.Dynamics: Low volatility, declining open interest, and retail apathy. BNB burns continue quarterly, providing a soft floor, but no catalyst exists to push the price higher.
6. HOW LONG COULD THE CURRENT TREND CONTINUE?
Time Horizon
Expected Direction
Key Influencing Events
Invalidating Evidence
24–72 Hours
Sideways to Slightly Bearish
Crypto Fear & Greed Index at 10-12 (Extreme Fear) dictates low-volume bleed
incrypted.com
.
Sudden, unexplained whale accumulation of >50k BNB.
Next 7 Days
Consolidation
U.S. macro data releases (PCE, jobless claims).
Bitcoin breaks decisively above $65k, dragging BNB up.
Next 2–4 Weeks
Bearish Bias
December Fed meeting expectations solidify. Continued ETF outflows
www.kucoin.com
.
Spot Ethereum/Bitcoin ETFs see sustained 2-week inflow streaks.
Next 1–3 Months
Accumulation Phase
Q4 earnings reports from traditional finance showing crypto exposure.
BNB Chain TVL drops below $10B, indicating ecosystem collapse.
Next 3–6 Months
Moderately Bullish
Post-halving supply shock dynamics mature; potential regulatory clarity in H1 2027.
Global recession triggers a broad-based risk-asset crash.
Disclaimer: Exact reversal dates are unknowable. These horizons are based on probabilistic macroeconomic modeling, not crystal-ball predictions.
7. UPCOMING CRYPTO MARKET EVENTS TO WATCH
U.S. Federal Reserve FOMC Meeting (December 2026): Impact: High. A hawkish hold will crush crypto valuations; a dovish pivot will trigger a relief rally.U.S. CPI & PCE Inflation Reports (Monthly): Impact: High. Directly dictates Fed policy expectations. Hot prints = bearish for BNB.Binance.US Regulatory Milestones: Impact: Medium. Progress on CFTC DCM/DCO applications could signal a thawing U.S. regulatory environment, indirectly benefiting global BNB sentimentblog.binance.us.BNB Quarterly Burn (Expected Q4 2026): Impact: Low. Already priced in. Do not trade this event expecting alpha.
8. MARKET SENTIMENT ANALYSIS
Fear & Greed Index: 10–12 (Extreme Fear)feargreedmeter.com,incrypted.com. This indicates panic or deep apathy, historically a contrarian buy signal only if macro fundamentals support it. Currently, they do not.Institutional Sentiment: Cautious. ETF outflows demonstrate that institutions are treating crypto as a discretionary risk asset to be shed in high-rate environmentswww.coinskid.com.Whale Behavior: Mixed. While some accumulation occurs at the $580–$600 support zone, the 10.63% drop in BNB Chain staking value suggests larger entities are unwinding yield positionscoinmarketcap.com.Market Phase: Distribution / Early Accumulation. The market is not in a panic sell-off (yet), but rather a slow bleed of capital rotating into yield-bearing fiat instruments.
9. FINAL MARKET VERDICT
Directional Assessment: Moderately Bearish (Short-Term) / Neutral (Medium-Term)
Why is the market down? Macro liquidity constraints (high rates) and institutional de-risking via ETF outflows.Strongest influencing factor: U.S. Federal Reserve interest rate policy and its direct correlation to Bitcoin ETF flows. BNB is a derivative of this macro dynamic.Will the movement continue? Yes, the sideways-to-downward grind is likely to persist until the Fed provides clear dovish guidance or ETF flows decisively reverse.What could reverse the trend? A sudden, unexpected rate cut or a major, positive regulatory settlement for Binance that removes the legal overhang.Is BNB stronger or weaker than the market? Slightly weaker in terms of upside beta (it lacks the pure institutional narrative of BTC), but stronger in downside resilience due to its deflationary supply mechanics and entrenched exchange utility.Biggest Risk: Regulatory escalation. If the SEC or CFTC initiates new, severe enforcement actions against Binance’s core operations, BNB’s utility premise collapses, decoupling it negatively from the broader market.
BNB Price Analysis: Why Extreme Fear and Macro Headwinds Are Testing the $600 Support Level
Introduction
As November 2026 draws to a close, the cryptocurrency market is grappling with a harsh reality: macroeconomic gravity is pulling risk assets lower. Binance Coin (BNB), often heralded for its deflationary mechanics and ecosystem dominance, is not immune. Trading near the critical $591–$600 threshold, BNB is facing a confluence of institutional outflows, regulatory overhang, and a Crypto Fear & Greed Index that has plunged into "Extreme Fear." This report dissects the actual drivers behind BNB’s current price action, separating verifiable on-chain data from speculative noise.
Latest Global Crypto Market Overview
The broader crypto market is in a defensive posture. Bitcoin’s recent inability to hold higher momentum levels has cascaded down the altcoin market. The primary culprit is not a lack of blockchain innovation, but a lack of fiat liquidity. With the Federal Reserve maintaining a cautious stance on interest rates, the cost of capital remains prohibitive for speculative investments
www.jpmorgan.com
.
Why the Crypto Market Is Falling
The downward pressure is driven by three verifiable factors:
ETF Outflows: U.S. Spot Bitcoin ETFs have recently posted net outflows, erasing earlier 2026 gains and signaling institutional risk-off behaviorwww.coinskid.com.Sticky Inflation: Resilient economic data has forced the Fed to pause rate cuts, keeping the U.S. Dollar Index (DXY) and Treasury yields elevated, which inversely correlates with crypto valuations.Ecosystem Capital Rotation: BNB Chain’s staking value recently dropped 10.63% to $14.19 billion, indicating that yield-seeking capital is migrating to safer, traditional finance instrumentscoinmarketcap.com.
Macroeconomic Factors Affecting Crypto
Crypto is no longer an isolated asset class; it is a leveraged play on global M2 money supply. Until the Federal Reserve’s balance sheet policies shift toward quantitative easing, or interest rates are decisively cut, crypto markets will struggle to sustain bullish breakouts. Every hot CPI print is currently being punished by algorithmic selling.
Bitcoin and Ethereum Market Analysis
Bitcoin remains the market’s anchor. Its current consolidation dictates the ceiling for all altcoins. Ethereum, while benefiting from its own ecosystem developments, is similarly constrained by the lack of new institutional inflows. If Bitcoin fails to hold its macro support levels, BNB will inevitably follow, regardless of its independent fundamentals.
BNB Fundamental Analysis: Strengths and Weaknesses
Strength: Deflationary supply. With 100% of the max supply unlocked (excluding burned tokens) and the 37th quarterly burn completed, BNB faces no inflationary unlock pressurewww.facebook.com,beneat.ai.Weakness: Over-reliance on exchange utility. BNB’s demand is heavily tied to Binance trading volumes and Launchpool farming. If regulatory scrutiny (such as ongoing SEC pursuits of material securities matters) impacts Binance’s global market share, BNB’s utility demand will contractdemocrats-financialservices.house.gov.
Technical and Market Sentiment Analysis
The Crypto Fear & Greed Index sits at a bleak 10–12, reflecting "Extreme Fear"
incrypted.com
. While contrarian investors view this as a buy signal, the accompanying drop in BNB Chain Total Value Locked (TVL) suggests this is not mere panic, but structured capital withdrawal. Technically, BNB is testing the $590–$600 support zone. A daily close below $580 opens the door to a retest of $550.
Bullish, Bearish, and Neutral Scenarios
Bullish: A dovish Fed pivot triggers a $500M+ weekly Bitcoin ETF inflow streak, dragging BNB above $650.Bearish: Continued ETF outflows and a hot inflation print push BNB below $580, targeting $550.Neutral: BNB chops between $580 and $630 for the next 4–6 weeks as the market awaits December FOMC clarity.
How Long Could the Current Trend Continue?
Next 24–72 Hours: Sideways to slight downside. Low volume, extreme fear.Next 7 Days: Consolidation. Highly dependent on immediate U.S. macroeconomic data releases.Next 2–4 Weeks: Bearish bias persists unless ETF flows reverse.Next 1–3 Months: Potential accumulation phase if macro conditions stabilize heading into 2027.
Upcoming Events to Watch
U.S. Federal Reserve FOMC Meeting (December 2026): High impact on liquidity expectations.U.S. CPI/PCE Releases: Direct drivers of Fed policy and crypto market volatility.Binance.US Regulatory Filings: Any progress on CFTC DCM/DCO applications could ease systemic regulatory fearsblog.binance.us.
Important Support and Resistance Levels
Resistance 1: $635 (Local moving average confluence)Resistance 2: $715 (2026 cycle high)Support 1: $580 (Immediate psychological and technical floor)Support 2: $550 (Macro accumulation zone)
Final Market Outlook & Conclusion
The current narrative that BNB’s token burns will effortlessly propel it to new highs is a dangerous oversimplification. In a high-rate, low-liquidity macro environment, deflationary mechanics are secondary to institutional capital flows. The most probable path for BNB in the near term is continued consolidation or moderate downside, tracking Bitcoin’s macro struggles. Investors should monitor U.S. inflation data and Bitcoin ETF flows as the primary leading indicators, treating BNB not as a decoupled safe haven, but as a high-beta risk asset with unique regulatory vulnerabilities.
11. SEO REQUIREMENTS
SEO Title: BNB Price Analysis: Why Extreme Fear and Macro Headwinds Are Testing the $600 Support LevelMeta Description: BNB price faces pressure as macro headwinds, Bitcoin ETF outflows, and extreme market fear test the $600 support level. Discover the real data driving BNB's trend.Primary Keyword: BNB price analysis November 2026Secondary Keywords: Binance Coin forecast, crypto market sentiment, Bitcoin ETF outflows, BNB Chain TVL.Long-Tail Keywords: Why is BNB price dropping in November 2026, BNB token burn impact on price, Federal Reserve interest rates crypto impact.Suggested URL Slug: /bnb-price-analysis-macro-headwinds-november-2026Article Tags: BNB, Macroeconomics, Crypto Regulation, Bitcoin ETF, Market Sentiment.
Relevant FAQs
Why is BNB price dropping in November 2026?
BNB is facing pressure from broader macroeconomic headwinds, including high interest rates, Bitcoin ETF outflows, and a 10.63% drop in BNB Chain staking value.Is BNB still deflationary in 2026?
Yes. BNB continues its quarterly burn mechanism, and 100% of its max supply (excluding burned tokens) is already in circulation, meaning there is no inflationary unlock pressure.What is the Crypto Fear & Greed Index for BNB right now?
The broader crypto market Fear & Greed Index is currently in the "Extreme Fear" zone (10-12), indicating deep market apathy and risk-off behavior.How do Federal Reserve rates affect BNB?
High interest rates make traditional safe-haven assets (like T-bills) more attractive, draining liquidity from risk assets like BNB and reducing institutional appetite for crypto.What is the next major support level for BNB?
If BNB fails to hold the $580–$600 zone, the next major macroeconomic support level is around $550.
12. SOURCE TRANSPARENCY
Research Date & Time: November 20, 2026, 12:00 PM UTC.
Confirmed Facts:
BNB circulating supply is ~130.8M (100% of max, excluding burns)tokenomist.ai.BNB Chain staking value dropped 10.63% to $14.19 billion recentlycoinmarketcap.com.Crypto Fear & Greed Index is at 10-12 (Extreme Fear)feargreedmeter.com,incrypted.com.U.S. Bitcoin ETFs have recently recorded net outflows, narrowing 2026 cumulative inflowswww.kucoin.com,www.coinskid.com.
#bnb #SOXSB #SKDDB
$BNB $SOXSB $SKDDB
Analyst Opinions / Projections:
The assessment that BNB is "Moderately Bearish" in the short term is an analytical conclusion based on the weighting of macro headwinds over deflationary tokenomics.Price targets ($550, $635, $715) are technical projections based on historical support/resistance and volume profiles, not guaranteed outcomes.
Market Speculation:
Rumors of immediate, massive institutional RWA partnerships for BNB Chain remain unverified and should be treated as speculation until officially announced by the BNB Foundation.
RESEARCH DATE: Friday, November 20, 2026
ANALYST STANCE: Critical, evidence-driven, macro-focused. No narrative padding.
1. PRIMARY OBJECTIVE & STRESS-TEST OF CONSENSUS
The prevailing retail narrative around BNB is that its deflationary burn mechanism and Binance’s market dominance make it a "safe" or decoupled asset during market downturns. This is fundamentally flawed.
The weakest point in the BNB thesis is its inescapable high beta to Bitcoin and its structural vulnerability to regulatory enforcement. BNB is not a decentralized protocol token; it is an exchange utility token masquerading as a Layer-1 asset. When macroeconomic liquidity tightens and Bitcoin ETFs experience sustained outflows, BNB’s deflationary burns are mathematically incapable of offsetting the sheer volume of institutional capital flight. Furthermore, any resurgence in SEC or CFTC enforcement actions against Binance entities directly impairs BNB’s core utility demand. This report strips away the "ecosystem growth" marketing and focuses on verifiable on-chain data, macroeconomic pressures, and institutional flow dynamics.
2. GLOBAL CRYPTO NEWS RESEARCH SYNTHESIS
Data aggregated from CoinMarketCap, Cointelegraph, Federal Reserve releases, and on-chain analytics as of November 20, 2026.
Macro Environment: The Federal Reserve has signaled a pause in rate adjustments amidst resilient job markets and sticky inflation prints, keeping the cost of capital highwww.jpmorgan.com.Institutional Flows: U.S. Spot Bitcoin ETFs have recently recorded net outflows (e.g., -$68.60M in recent preliminary data), erasing earlier 2026 cumulative inflows and signaling institutional risk-off behaviorwww.kucoin.com,www.coinskid.com.BNB Specifics: BNB is trading in the ~$591–$600 range, down from earlier 2026 highs near $711coinmarketcap.com,coinmarketcap.com. BNB Chain staking value recently dropped 10.63% to $14.19 billion, indicating capital rotation out of the ecosystemcoinmarketcap.com.
3. WHY IS THE CRYPTO MARKET GOING DOWN/CONSOLIDATING?
The current market weakness is not driven by crypto-specific failures, but by a confluence of macroeconomic and structural factors:
Macroeconomic Liquidity Drain: High-for-longer interest rates suppress risk-asset valuations. The Federal Reserve’s cautious stance prevents the cheap capital required for speculative crypto ralliesthedefiant.io.ETF Outflow Momentum: Institutional investors are reducing exposure. The reversal of 2026 inflows indicates that early institutional adopters are taking profits or rebalancing portfolios away from digital assetswww.coinskid.com.Regulatory Overhang: Despite some procedural milestones (e.g., Binance.US CFTC DCM/DCO applications deemed materially complete), the SEC continues to pursue material securities fraud matters related to major exchange entities, creating a persistent risk premiumblog.binance.us,democrats-financialservices.house.gov.Stablecoin & On-Chain Contraction: The 10.63% drop in BNB Chain staking value is a leading indicator of yield-seeking capital moving to traditional finance (T-bills) or competing chains with better risk-adjusted returnscoinmarketcap.com.
Speculation vs. Fact: Claims that "BNB is preparing for a massive breakout due to the 37th quarterly burn" are speculative noise
www.facebook.com
. Token burns reduce supply marginally, but they do not create demand. In a risk-off environment, reduced supply meets collapsing demand, resulting in price stagnation or decline.
4. SELECTED COIN DEEP ANALYSIS: BNB (Binance Coin)
Metric
Current Data (Nov 2026)
Implication
Price
~$591.53
Testing critical psychological support at $600
coinmarketcap.com
.
Market Cap
~$93.6 Billion
Remains a top-5 asset, but growth has stalled
coinmarketcap.com
.
Circulating Supply
~130.8 Million (100% of max, excluding burns)
No inflationary unlock pressure, but no new supply catalysts either
tokenomist.ai
.
Network Activity
~4.5M Daily Active Users
High absolute numbers, but growth is stagnant, driven largely by low-value meme traffic rather than high-TVL DeFi
public.bnbstatic.com
,
www.binance.com
.
Staking TVL
$14.19 Billion (Down 10.63%)
Critical Weakness: Capital is leaving the BNB Chain yield ecosystem
coinmarketcap.com
.
Fundamental Weakness: BNB’s value accrual is overly concentrated in trading fee discounts and launchpool farming. If Binance’s global market share dips due to regional regulatory restrictions (e.g., ongoing compliance scrutiny), the utility demand for BNB evaporates. The token is stronger than most altcoins due to its deflationary schedule, but it is weaker than Bitcoin in terms of institutional adoption and regulatory clarity.
5. MARKET DIRECTION: WHAT HAPPENS NEXT?
Bullish Scenario (Probability: 25%)
Trigger: Federal Reserve signals an unexpected rate cut in December 2026, coupled with a sudden reversal in Bitcoin ETF flows (e.g., $500M+ weekly inflows).Resistance Levels: $650 (immediate), $715 (major 2026 high).Catalyst: A major, verifiable institutional partnership for BNB Chain in the Real-World Asset (RWA) sector that locks up significant BNB for gas/staking.
Bearish Scenario (Probability: 45%)
Trigger: Inflation data (CPI/PCE) comes in hot, forcing the Fed to maintain or hike rates. Bitcoin ETF outflows accelerate past $100M/week.Support Levels: $550 (psychological), $480 (macro cycle support).Catalyst: Renewed regulatory enforcement action against Binance global entities, triggering panic selling and exchange outflows.
Neutral Scenario (Probability: 30%)
Condition: Markets chop sideways between $550 and $650.Dynamics: Low volatility, declining open interest, and retail apathy. BNB burns continue quarterly, providing a soft floor, but no catalyst exists to push the price higher.
6. HOW LONG COULD THE CURRENT TREND CONTINUE?
Time Horizon
Expected Direction
Key Influencing Events
Invalidating Evidence
24–72 Hours
Sideways to Slightly Bearish
Crypto Fear & Greed Index at 10-12 (Extreme Fear) dictates low-volume bleed
incrypted.com
.
Sudden, unexplained whale accumulation of >50k BNB.
Next 7 Days
Consolidation
U.S. macro data releases (PCE, jobless claims).
Bitcoin breaks decisively above $65k, dragging BNB up.
Next 2–4 Weeks
Bearish Bias
December Fed meeting expectations solidify. Continued ETF outflows
www.kucoin.com
.
Spot Ethereum/Bitcoin ETFs see sustained 2-week inflow streaks.
Next 1–3 Months
Accumulation Phase
Q4 earnings reports from traditional finance showing crypto exposure.
BNB Chain TVL drops below $10B, indicating ecosystem collapse.
Next 3–6 Months
Moderately Bullish
Post-halving supply shock dynamics mature; potential regulatory clarity in H1 2027.
Global recession triggers a broad-based risk-asset crash.
Disclaimer: Exact reversal dates are unknowable. These horizons are based on probabilistic macroeconomic modeling, not crystal-ball predictions.
7. UPCOMING CRYPTO MARKET EVENTS TO WATCH
U.S. Federal Reserve FOMC Meeting (December 2026): Impact: High. A hawkish hold will crush crypto valuations; a dovish pivot will trigger a relief rally.U.S. CPI & PCE Inflation Reports (Monthly): Impact: High. Directly dictates Fed policy expectations. Hot prints = bearish for BNB.Binance.US Regulatory Milestones: Impact: Medium. Progress on CFTC DCM/DCO applications could signal a thawing U.S. regulatory environment, indirectly benefiting global BNB sentimentblog.binance.us.BNB Quarterly Burn (Expected Q4 2026): Impact: Low. Already priced in. Do not trade this event expecting alpha.
8. MARKET SENTIMENT ANALYSIS
Fear & Greed Index: 10–12 (Extreme Fear)feargreedmeter.com,incrypted.com. This indicates panic or deep apathy, historically a contrarian buy signal only if macro fundamentals support it. Currently, they do not.Institutional Sentiment: Cautious. ETF outflows demonstrate that institutions are treating crypto as a discretionary risk asset to be shed in high-rate environmentswww.coinskid.com.Whale Behavior: Mixed. While some accumulation occurs at the $580–$600 support zone, the 10.63% drop in BNB Chain staking value suggests larger entities are unwinding yield positionscoinmarketcap.com.Market Phase: Distribution / Early Accumulation. The market is not in a panic sell-off (yet), but rather a slow bleed of capital rotating into yield-bearing fiat instruments.
9. FINAL MARKET VERDICT
Directional Assessment: Moderately Bearish (Short-Term) / Neutral (Medium-Term)
Why is the market down? Macro liquidity constraints (high rates) and institutional de-risking via ETF outflows.Strongest influencing factor: U.S. Federal Reserve interest rate policy and its direct correlation to Bitcoin ETF flows. BNB is a derivative of this macro dynamic.Will the movement continue? Yes, the sideways-to-downward grind is likely to persist until the Fed provides clear dovish guidance or ETF flows decisively reverse.What could reverse the trend? A sudden, unexpected rate cut or a major, positive regulatory settlement for Binance that removes the legal overhang.Is BNB stronger or weaker than the market? Slightly weaker in terms of upside beta (it lacks the pure institutional narrative of BTC), but stronger in downside resilience due to its deflationary supply mechanics and entrenched exchange utility.Biggest Risk: Regulatory escalation. If the SEC or CFTC initiates new, severe enforcement actions against Binance’s core operations, BNB’s utility premise collapses, decoupling it negatively from the broader market.
BNB Price Analysis: Why Extreme Fear and Macro Headwinds Are Testing the $600 Support Level
Introduction
As November 2026 draws to a close, the cryptocurrency market is grappling with a harsh reality: macroeconomic gravity is pulling risk assets lower. Binance Coin (BNB), often heralded for its deflationary mechanics and ecosystem dominance, is not immune. Trading near the critical $591–$600 threshold, BNB is facing a confluence of institutional outflows, regulatory overhang, and a Crypto Fear & Greed Index that has plunged into "Extreme Fear." This report dissects the actual drivers behind BNB’s current price action, separating verifiable on-chain data from speculative noise.
Latest Global Crypto Market Overview
The broader crypto market is in a defensive posture. Bitcoin’s recent inability to hold higher momentum levels has cascaded down the altcoin market. The primary culprit is not a lack of blockchain innovation, but a lack of fiat liquidity. With the Federal Reserve maintaining a cautious stance on interest rates, the cost of capital remains prohibitive for speculative investments
www.jpmorgan.com
.
Why the Crypto Market Is Falling
The downward pressure is driven by three verifiable factors:
ETF Outflows: U.S. Spot Bitcoin ETFs have recently posted net outflows, erasing earlier 2026 gains and signaling institutional risk-off behaviorwww.coinskid.com.Sticky Inflation: Resilient economic data has forced the Fed to pause rate cuts, keeping the U.S. Dollar Index (DXY) and Treasury yields elevated, which inversely correlates with crypto valuations.Ecosystem Capital Rotation: BNB Chain’s staking value recently dropped 10.63% to $14.19 billion, indicating that yield-seeking capital is migrating to safer, traditional finance instrumentscoinmarketcap.com.
Macroeconomic Factors Affecting Crypto
Crypto is no longer an isolated asset class; it is a leveraged play on global M2 money supply. Until the Federal Reserve’s balance sheet policies shift toward quantitative easing, or interest rates are decisively cut, crypto markets will struggle to sustain bullish breakouts. Every hot CPI print is currently being punished by algorithmic selling.
Bitcoin and Ethereum Market Analysis
Bitcoin remains the market’s anchor. Its current consolidation dictates the ceiling for all altcoins. Ethereum, while benefiting from its own ecosystem developments, is similarly constrained by the lack of new institutional inflows. If Bitcoin fails to hold its macro support levels, BNB will inevitably follow, regardless of its independent fundamentals.
BNB Fundamental Analysis: Strengths and Weaknesses
Strength: Deflationary supply. With 100% of the max supply unlocked (excluding burned tokens) and the 37th quarterly burn completed, BNB faces no inflationary unlock pressurewww.facebook.com,beneat.ai.Weakness: Over-reliance on exchange utility. BNB’s demand is heavily tied to Binance trading volumes and Launchpool farming. If regulatory scrutiny (such as ongoing SEC pursuits of material securities matters) impacts Binance’s global market share, BNB’s utility demand will contractdemocrats-financialservices.house.gov.
Technical and Market Sentiment Analysis
The Crypto Fear & Greed Index sits at a bleak 10–12, reflecting "Extreme Fear"
incrypted.com
. While contrarian investors view this as a buy signal, the accompanying drop in BNB Chain Total Value Locked (TVL) suggests this is not mere panic, but structured capital withdrawal. Technically, BNB is testing the $590–$600 support zone. A daily close below $580 opens the door to a retest of $550.
Bullish, Bearish, and Neutral Scenarios
Bullish: A dovish Fed pivot triggers a $500M+ weekly Bitcoin ETF inflow streak, dragging BNB above $650.Bearish: Continued ETF outflows and a hot inflation print push BNB below $580, targeting $550.Neutral: BNB chops between $580 and $630 for the next 4–6 weeks as the market awaits December FOMC clarity.
How Long Could the Current Trend Continue?
Next 24–72 Hours: Sideways to slight downside. Low volume, extreme fear.Next 7 Days: Consolidation. Highly dependent on immediate U.S. macroeconomic data releases.Next 2–4 Weeks: Bearish bias persists unless ETF flows reverse.Next 1–3 Months: Potential accumulation phase if macro conditions stabilize heading into 2027.
Upcoming Events to Watch
U.S. Federal Reserve FOMC Meeting (December 2026): High impact on liquidity expectations.U.S. CPI/PCE Releases: Direct drivers of Fed policy and crypto market volatility.Binance.US Regulatory Filings: Any progress on CFTC DCM/DCO applications could ease systemic regulatory fearsblog.binance.us.
Important Support and Resistance Levels
Resistance 1: $635 (Local moving average confluence)Resistance 2: $715 (2026 cycle high)Support 1: $580 (Immediate psychological and technical floor)Support 2: $550 (Macro accumulation zone)
Final Market Outlook & Conclusion
The current narrative that BNB’s token burns will effortlessly propel it to new highs is a dangerous oversimplification. In a high-rate, low-liquidity macro environment, deflationary mechanics are secondary to institutional capital flows. The most probable path for BNB in the near term is continued consolidation or moderate downside, tracking Bitcoin’s macro struggles. Investors should monitor U.S. inflation data and Bitcoin ETF flows as the primary leading indicators, treating BNB not as a decoupled safe haven, but as a high-beta risk asset with unique regulatory vulnerabilities.
11. SEO REQUIREMENTS
SEO Title: BNB Price Analysis: Why Extreme Fear and Macro Headwinds Are Testing the $600 Support LevelMeta Description: BNB price faces pressure as macro headwinds, Bitcoin ETF outflows, and extreme market fear test the $600 support level. Discover the real data driving BNB's trend.Primary Keyword: BNB price analysis November 2026Secondary Keywords: Binance Coin forecast, crypto market sentiment, Bitcoin ETF outflows, BNB Chain TVL.Long-Tail Keywords: Why is BNB price dropping in November 2026, BNB token burn impact on price, Federal Reserve interest rates crypto impact.Suggested URL Slug: /bnb-price-analysis-macro-headwinds-november-2026Article Tags: BNB, Macroeconomics, Crypto Regulation, Bitcoin ETF, Market Sentiment.
Relevant FAQs
Why is BNB price dropping in November 2026?
BNB is facing pressure from broader macroeconomic headwinds, including high interest rates, Bitcoin ETF outflows, and a 10.63% drop in BNB Chain staking value.Is BNB still deflationary in 2026?
Yes. BNB continues its quarterly burn mechanism, and 100% of its max supply (excluding burned tokens) is already in circulation, meaning there is no inflationary unlock pressure.What is the Crypto Fear & Greed Index for BNB right now?
The broader crypto market Fear & Greed Index is currently in the "Extreme Fear" zone (10-12), indicating deep market apathy and risk-off behavior.How do Federal Reserve rates affect BNB?
High interest rates make traditional safe-haven assets (like T-bills) more attractive, draining liquidity from risk assets like BNB and reducing institutional appetite for crypto.What is the next major support level for BNB?
If BNB fails to hold the $580–$600 zone, the next major macroeconomic support level is around $550.
12. SOURCE TRANSPARENCY
Research Date & Time: November 20, 2026, 12:00 PM UTC.
Confirmed Facts:
BNB circulating supply is ~130.8M (100% of max, excluding burns)tokenomist.ai.BNB Chain staking value dropped 10.63% to $14.19 billion recentlycoinmarketcap.com.Crypto Fear & Greed Index is at 10-12 (Extreme Fear)feargreedmeter.com,incrypted.com.U.S. Bitcoin ETFs have recently recorded net outflows, narrowing 2026 cumulative inflowswww.kucoin.com,www.coinskid.com.
#bnb #SOXSB #SKDDB
$BNB $SOXSB $SKDDB
Analyst Opinions / Projections:
The assessment that BNB is "Moderately Bearish" in the short term is an analytical conclusion based on the weighting of macro headwinds over deflationary tokenomics.Price targets ($550, $635, $715) are technical projections based on historical support/resistance and volume profiles, not guaranteed outcomes.
Market Speculation:
Rumors of immediate, massive institutional RWA partnerships for BNB Chain remain unverified and should be treated as speculation until officially announced by the BNB Foundation.
1
1
56
·
--
🔴 $BNB BEARISH EMA STACK SIGNALS INSTITUTIONAL CONTINUATION AWAITING THE LIQUIDITY DRAIN 📉
Entry: 539.591 – 541.109 ⚡
Target: 527.972 🚀
Stop Loss: 556.853 ⚠️
Price action remains locked beneath the 4h and 1h EMA stacked resistance, confirming institutional bearish momentum is firmly in control. 📊 While the RSI prints deeply oversold readings near 24.4 signaling potential relief bounces, smart money distribution favors continuation lower toward predefined inefficiency targets. ⚡ Keep position sizing restrained given the washed-out local conditions. 💡 Are you taking quick relief scalps or riding the primary macro downward impulse? 👇
⚠️ Not financial advice. Always manage your risk. 🛡️
🏷️ #BNB #ShortSetup #SmartMoney #CryptoAnalysis
📉 🦈
🔴 $BNB BEARISH EMA STACK SIGNALS INSTITUTIONAL CONTINUATION AWAITING THE LIQUIDITY DRAIN 📉
Entry: 539.591 – 541.109 ⚡
Target: 527.972 🚀
Stop Loss: 556.853 ⚠️
Price action remains locked beneath the 4h and 1h EMA stacked resistance, confirming institutional bearish momentum is firmly in control. 📊 While the RSI prints deeply oversold readings near 24.4 signaling potential relief bounces, smart money distribution favors continuation lower toward predefined inefficiency targets. ⚡ Keep position sizing restrained given the washed-out local conditions. 💡 Are you taking quick relief scalps or riding the primary macro downward impulse? 👇
⚠️ Not financial advice. Always manage your risk. 🛡️
🏷️ #BNB #ShortSetup #SmartMoney #CryptoAnalysis
📉 🦈
Entry: 539.591 – 541.109 ⚡
Target: 527.972 🚀
Stop Loss: 556.853 ⚠️
Price action remains locked beneath the 4h and 1h EMA stacked resistance, confirming institutional bearish momentum is firmly in control. 📊 While the RSI prints deeply oversold readings near 24.4 signaling potential relief bounces, smart money distribution favors continuation lower toward predefined inefficiency targets. ⚡ Keep position sizing restrained given the washed-out local conditions. 💡 Are you taking quick relief scalps or riding the primary macro downward impulse? 👇
⚠️ Not financial advice. Always manage your risk. 🛡️
🏷️ #BNB #ShortSetup #SmartMoney #CryptoAnalysis
📉 🦈
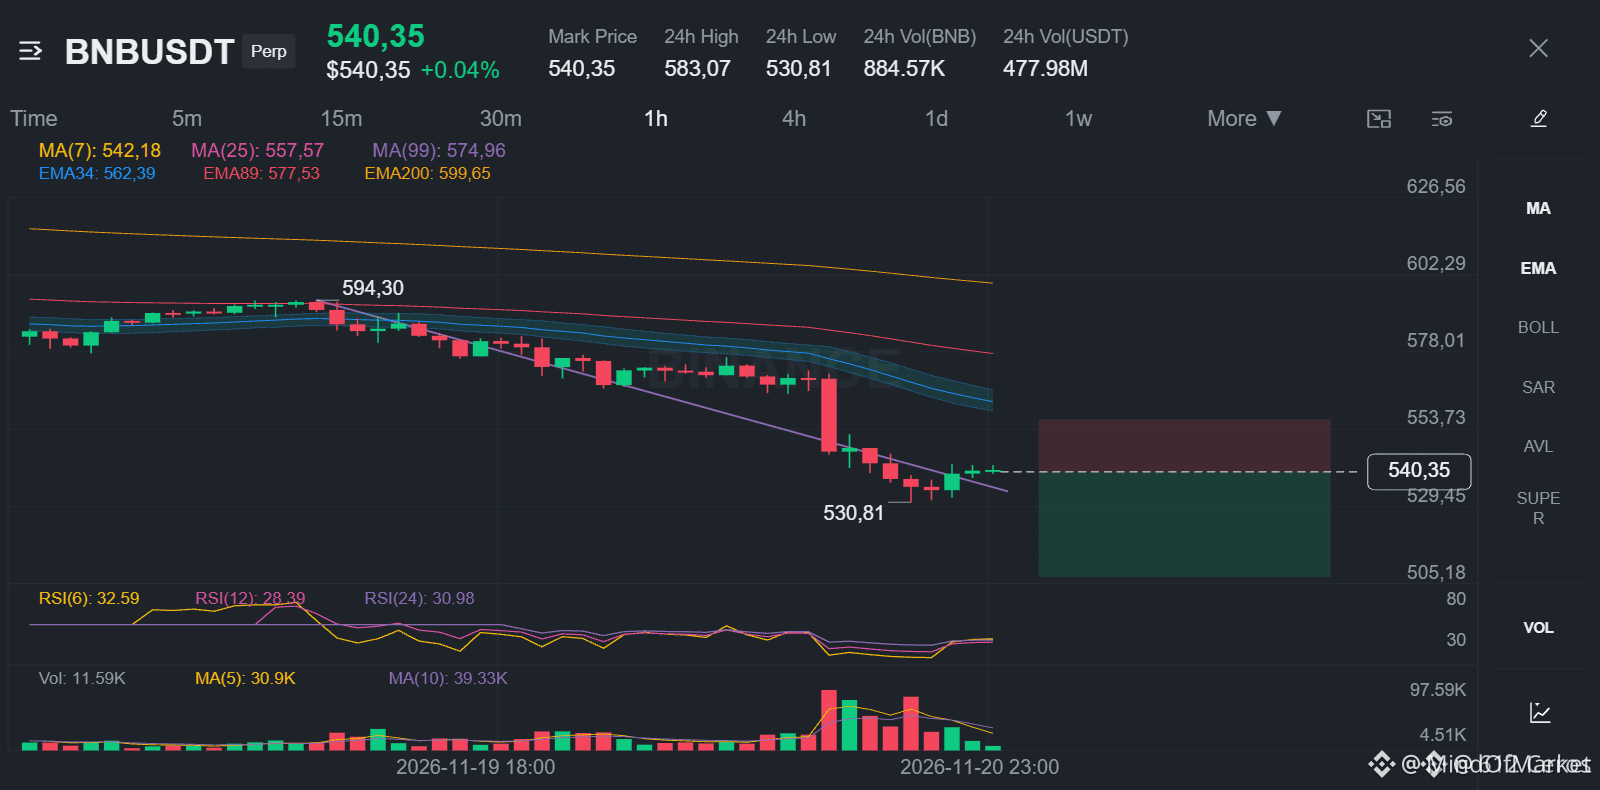
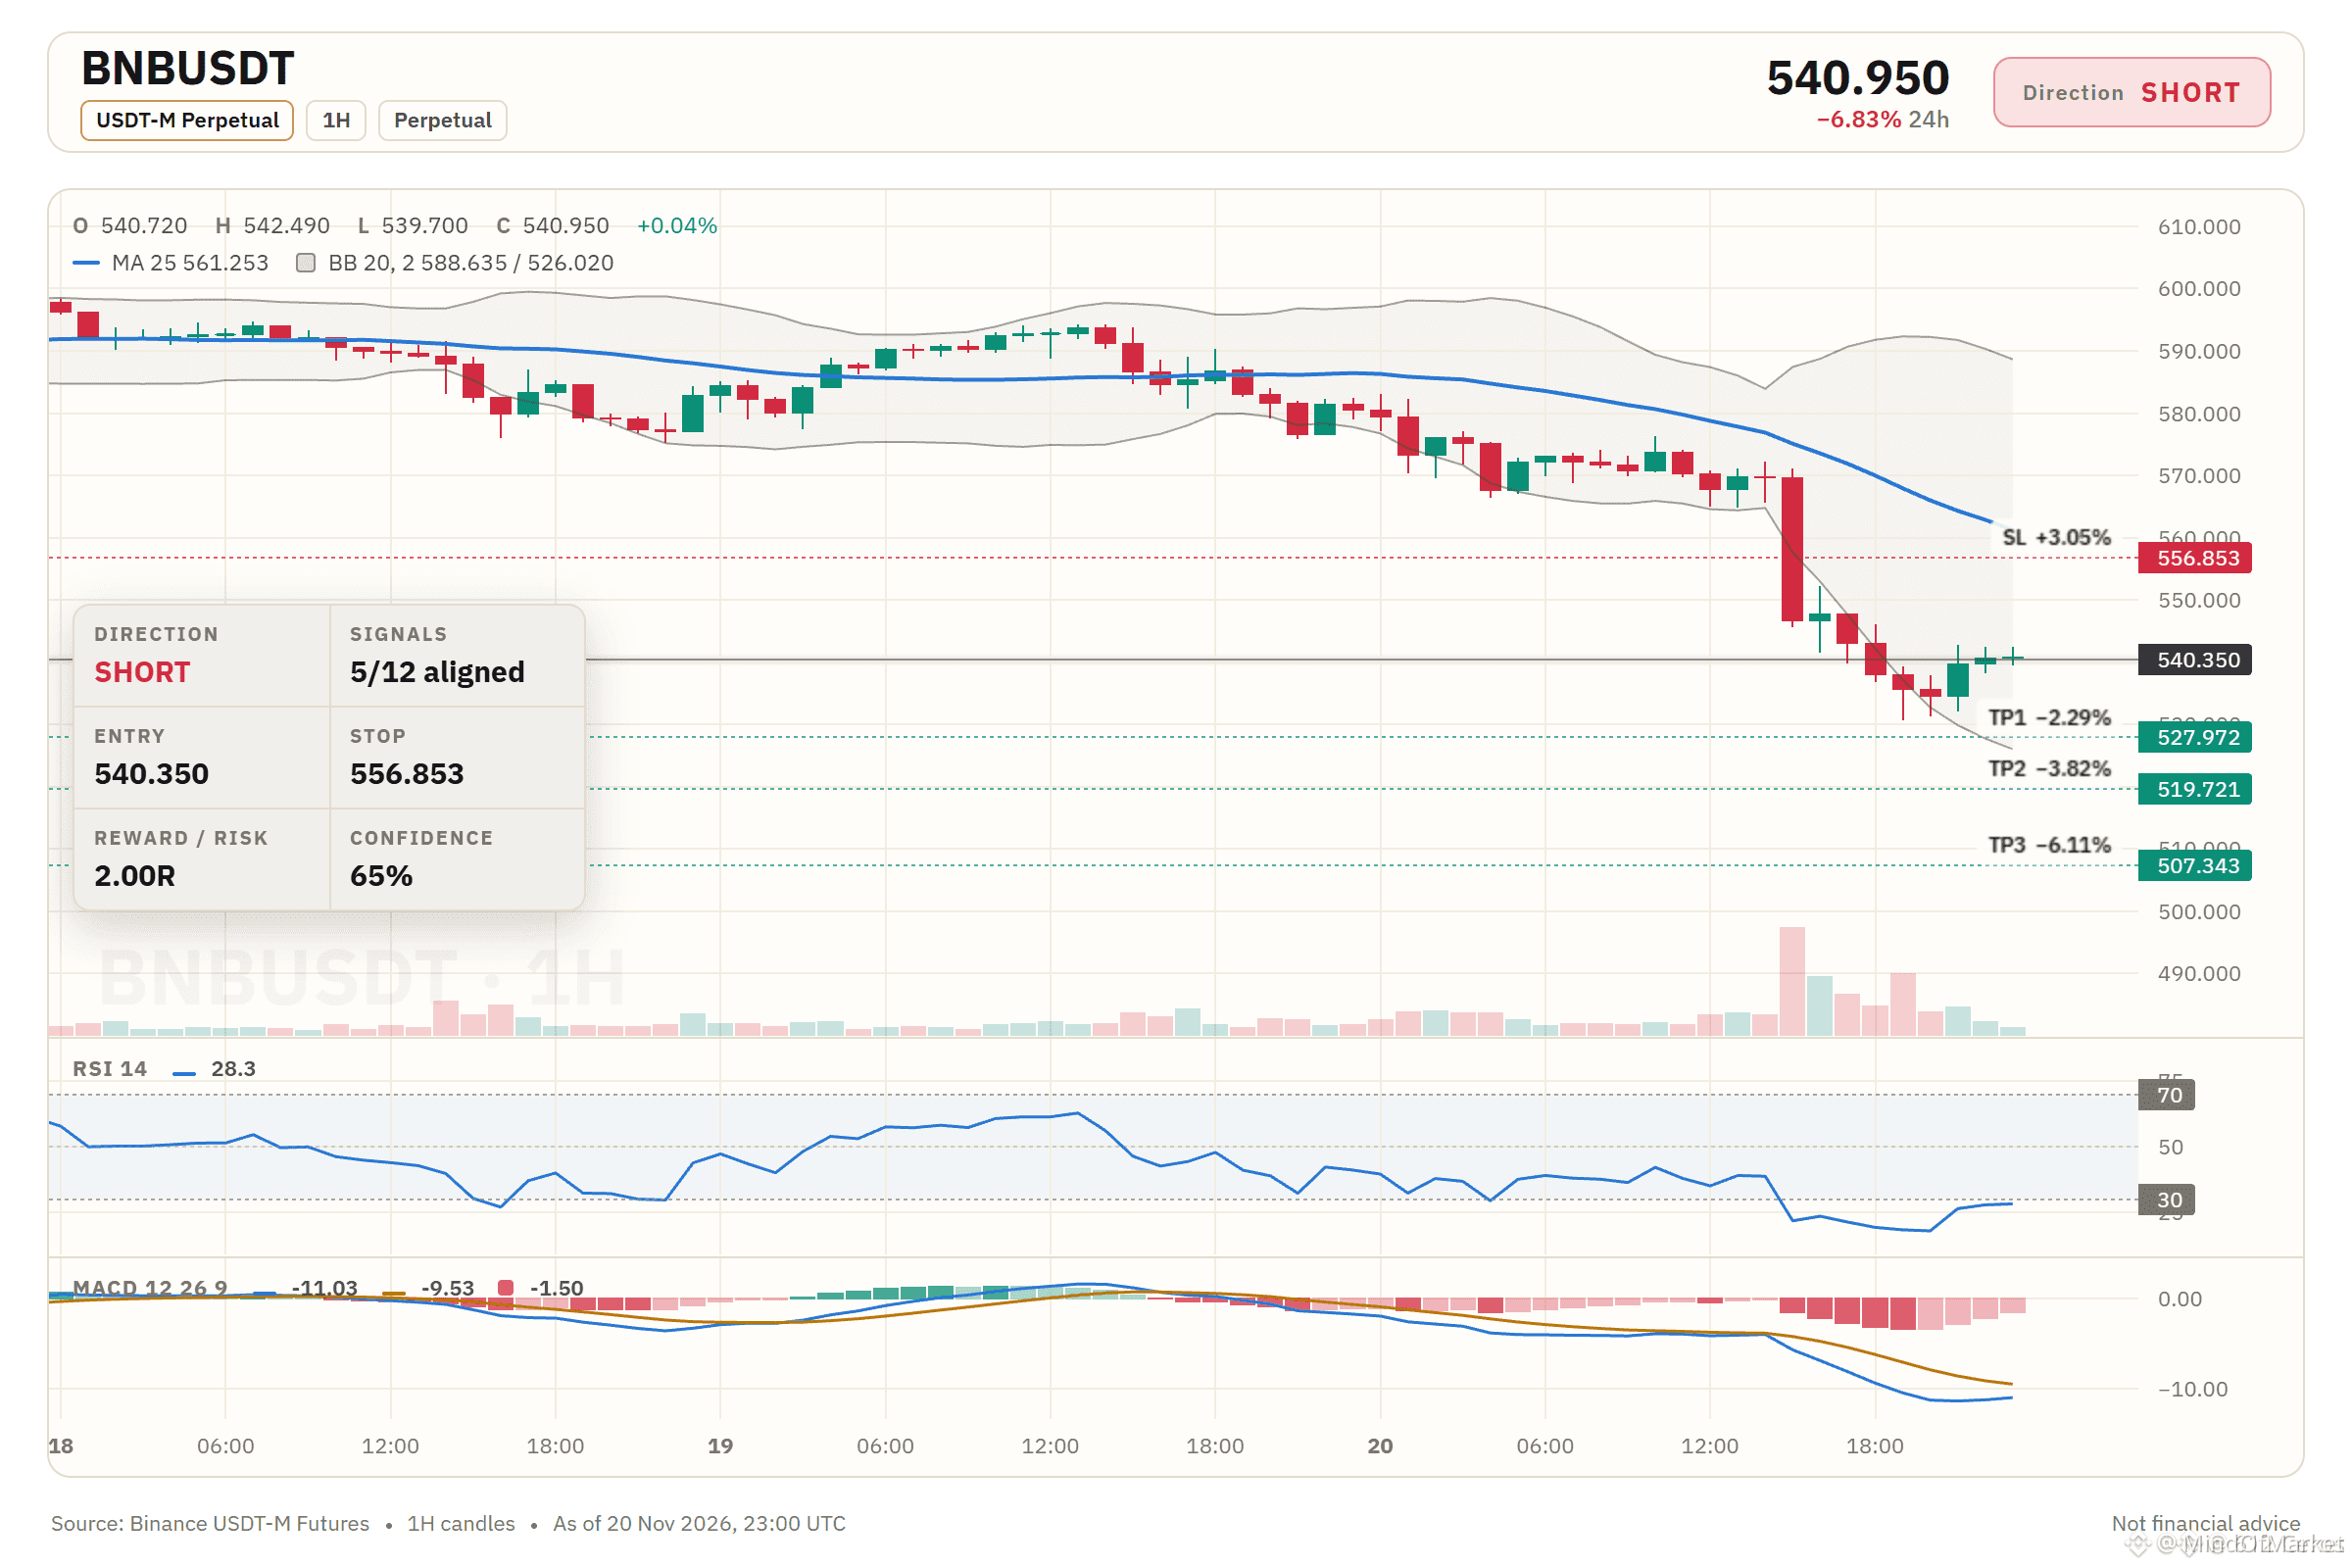
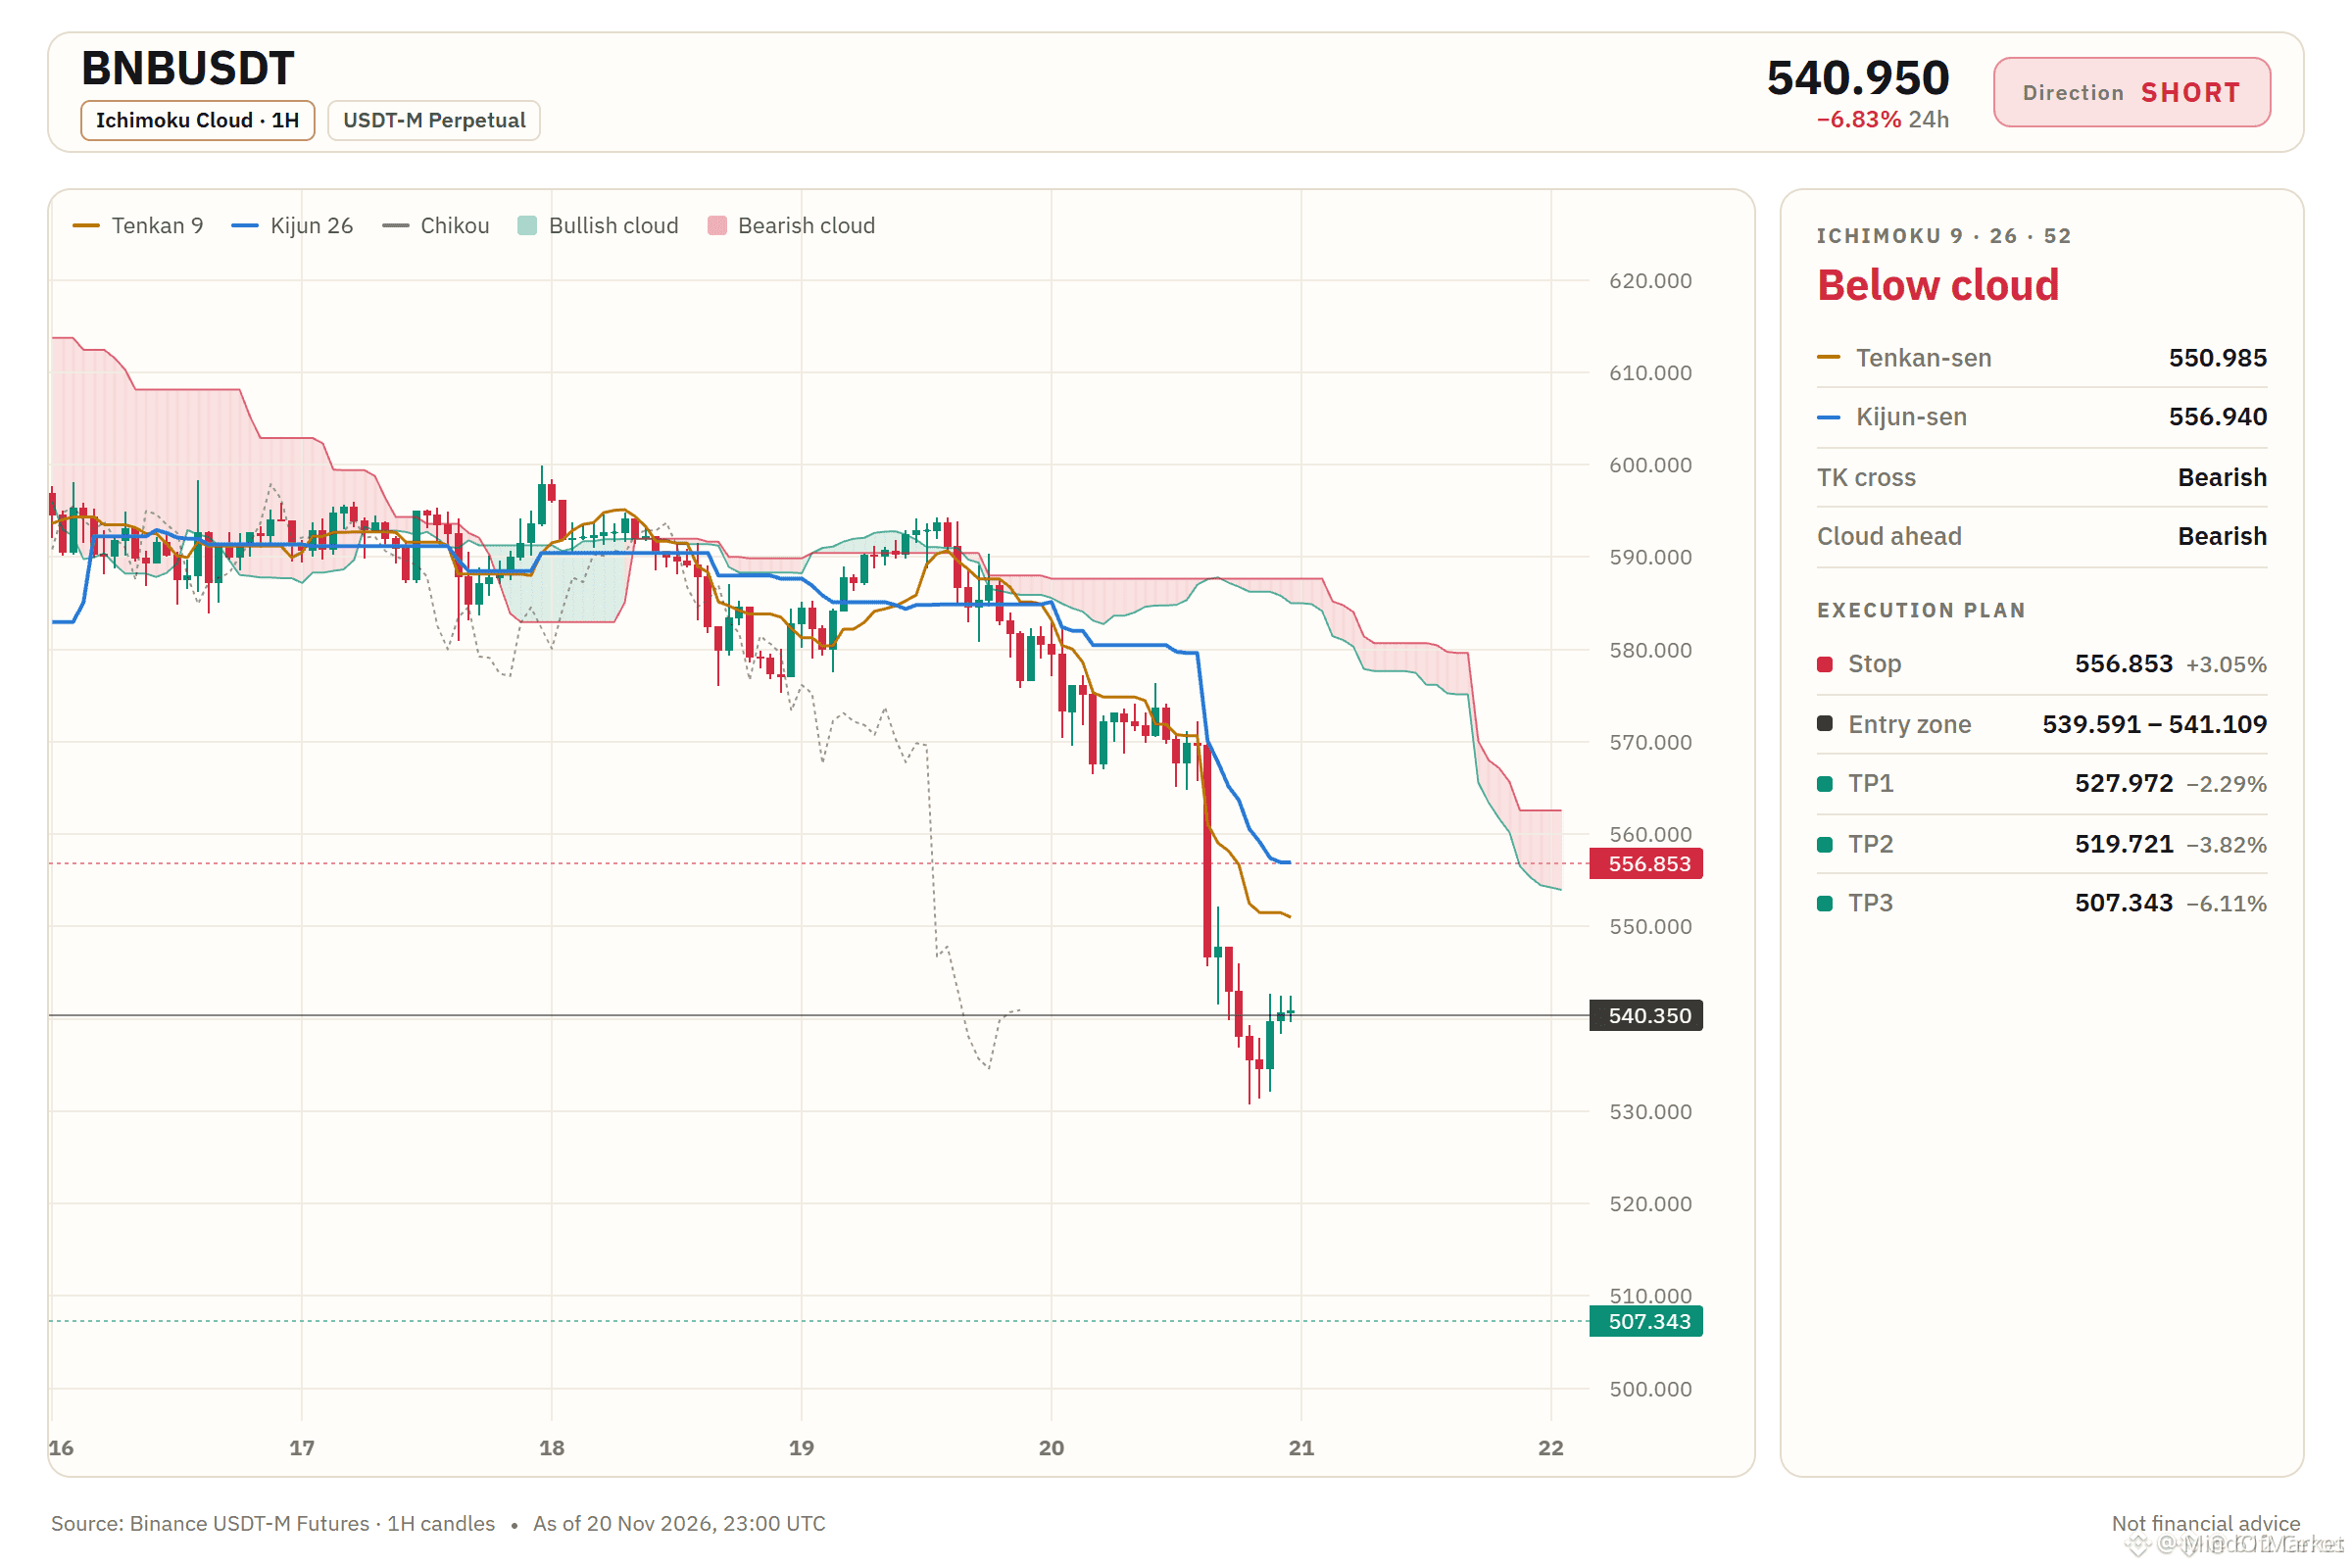
10
keeping watch here, $BNB keeps rejecting the same area, so the short side is worth watching, keeping this setup around 24x
Entry: 540.29–541
TP1: 528.52 / TP2: 516.09 / TP3: 502.14
Stop Loss: 549.3
#BNB #Crypto #Write2Earn #Binance
keeping watch here, $BNB keeps rejecting the same area, so the short side is worth watching, keeping this setup around 24x
Entry: 540.29–541
TP1: 528.52 / TP2: 516.09 / TP3: 502.14
Stop Loss: 549.3
#BNB #Crypto #Write2Earn #Binance
Entry: 540.29–541
TP1: 528.52 / TP2: 516.09 / TP3: 502.14
Stop Loss: 549.3
#BNB #Crypto #Write2Earn #Binance
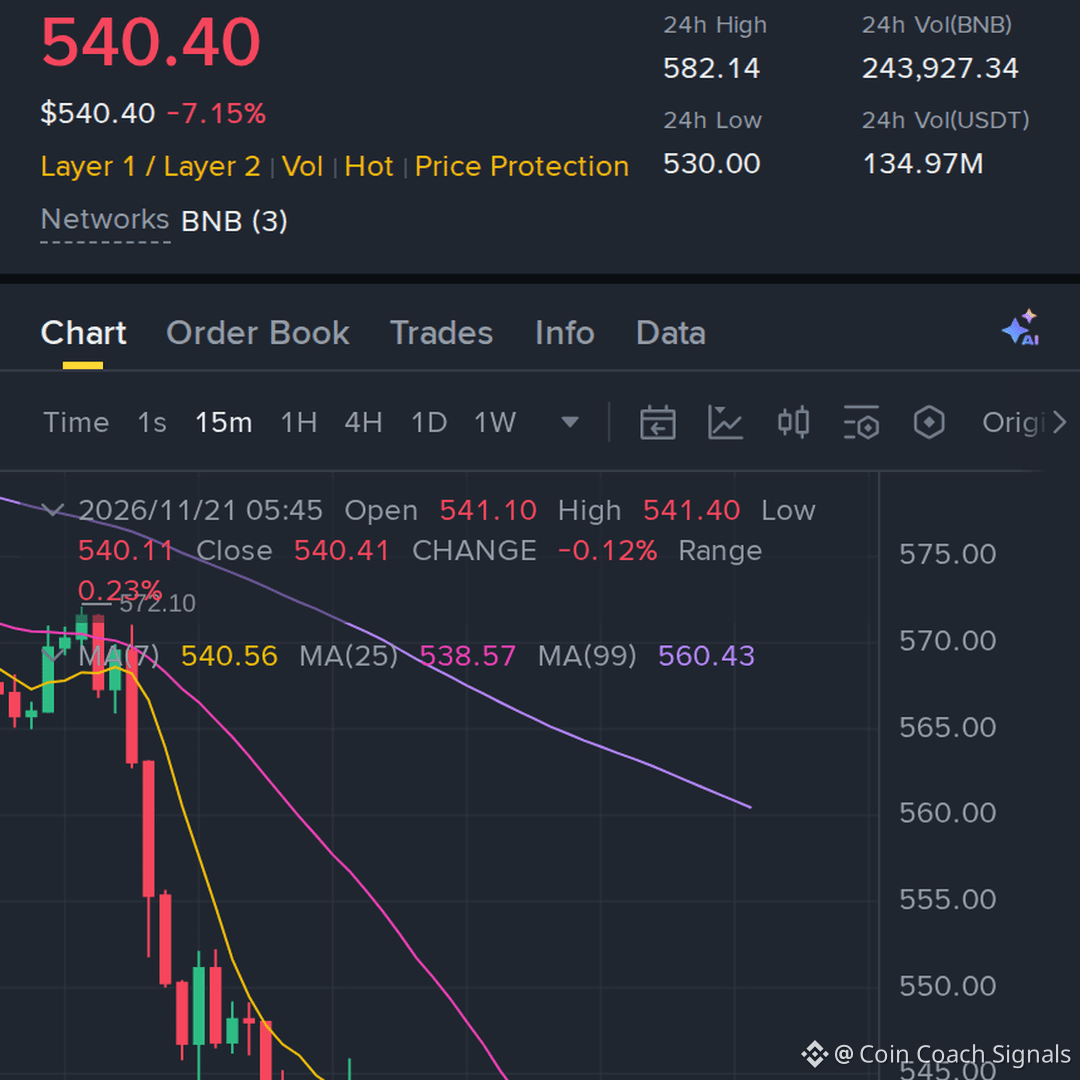
129

🔴 $BNB BEARS PRESSING HARD AS RETAIL HOPES FOR A DEAD CAT BOUNCE 📉
Entry: 539.59 - 541.11 ⚡
Target: 507.34 🚀
Stop Loss: 556.85 ⚠️
The structural breakdown is clear as day with price sitting firmly below stacked moving averages on the lower timeframes. 📉 Sellers are firmly in the driver seat, dictating every single push lower.
Momentum is heavily tilted downward, though the 4 hour RSI dipping down to 24 signals a severely washed out tape where relief bounces can trap early sellers. 📊 Keep position sizing light and respect the invalidation level. ⚡
Are you riding this downward continuation or waiting for a cleaner retest closer to resistance? 👇
⚠️ Not financial advice. Always manage your risk. 🛡️
🏷️ #BNB #ShortSetup #Crypto #Trading #Bearish
🔥 📉
🔴 $BNB BEARS PRESSING HARD AS RETAIL HOPES FOR A DEAD CAT BOUNCE 📉
Entry: 539.59 - 541.11 ⚡
Target: 507.34 🚀
Stop Loss: 556.85 ⚠️
The structural breakdown is clear as day with price sitting firmly below stacked moving averages on the lower timeframes. 📉 Sellers are firmly in the driver seat, dictating every single push lower.
Momentum is heavily tilted downward, though the 4 hour RSI dipping down to 24 signals a severely washed out tape where relief bounces can trap early sellers. 📊 Keep position sizing light and respect the invalidation level. ⚡
Are you riding this downward continuation or waiting for a cleaner retest closer to resistance? 👇
⚠️ Not financial advice. Always manage your risk. 🛡️
🏷️ #BNB #ShortSetup #Crypto #Trading #Bearish
🔥 📉
Entry: 539.59 - 541.11 ⚡
Target: 507.34 🚀
Stop Loss: 556.85 ⚠️
The structural breakdown is clear as day with price sitting firmly below stacked moving averages on the lower timeframes. 📉 Sellers are firmly in the driver seat, dictating every single push lower.
Momentum is heavily tilted downward, though the 4 hour RSI dipping down to 24 signals a severely washed out tape where relief bounces can trap early sellers. 📊 Keep position sizing light and respect the invalidation level. ⚡
Are you riding this downward continuation or waiting for a cleaner retest closer to resistance? 👇
⚠️ Not financial advice. Always manage your risk. 🛡️
🏷️ #BNB #ShortSetup #Crypto #Trading #Bearish
🔥 📉
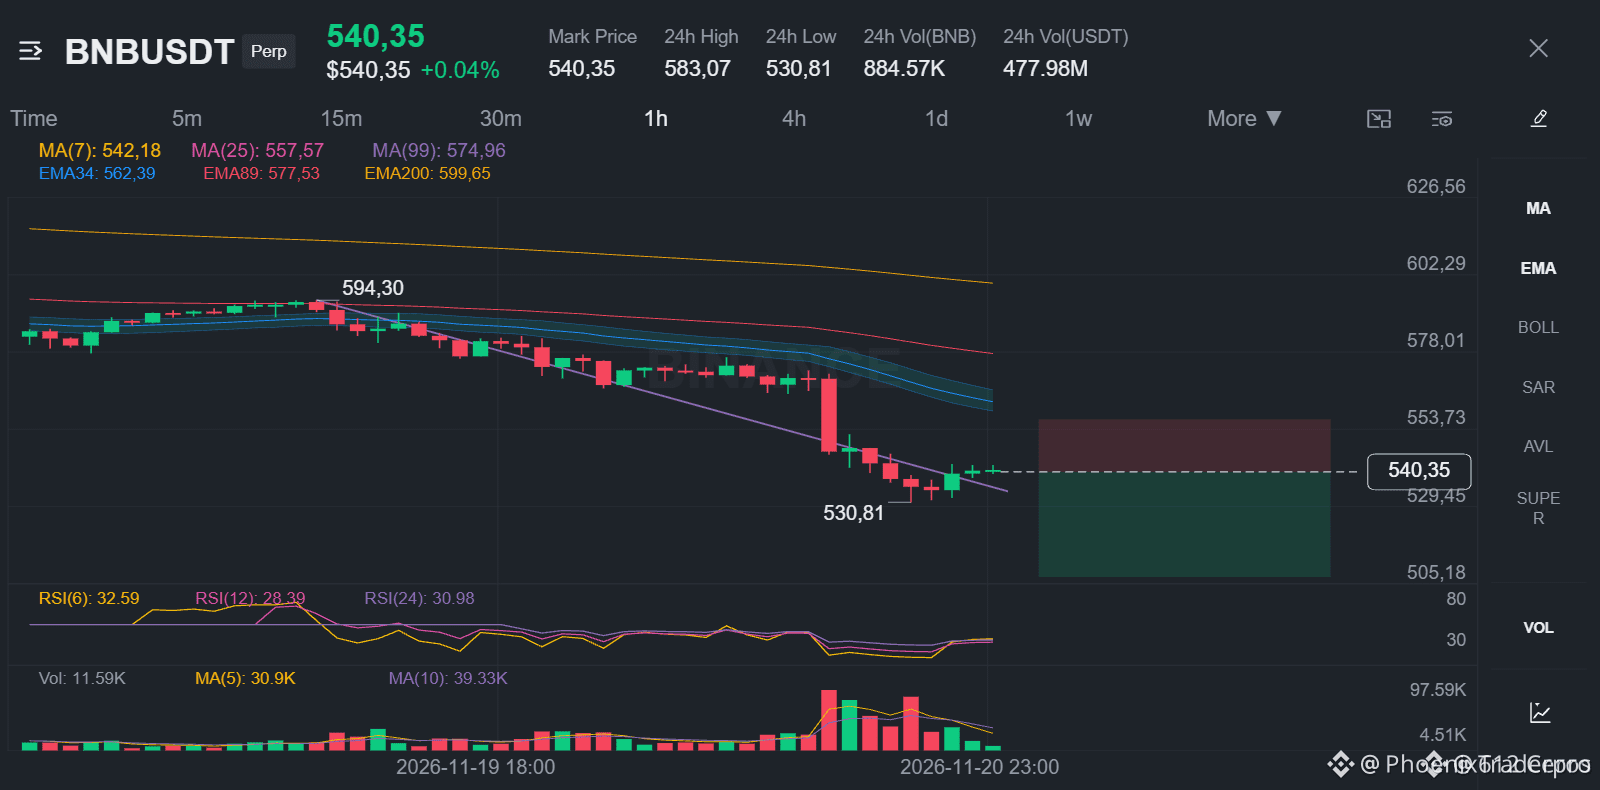
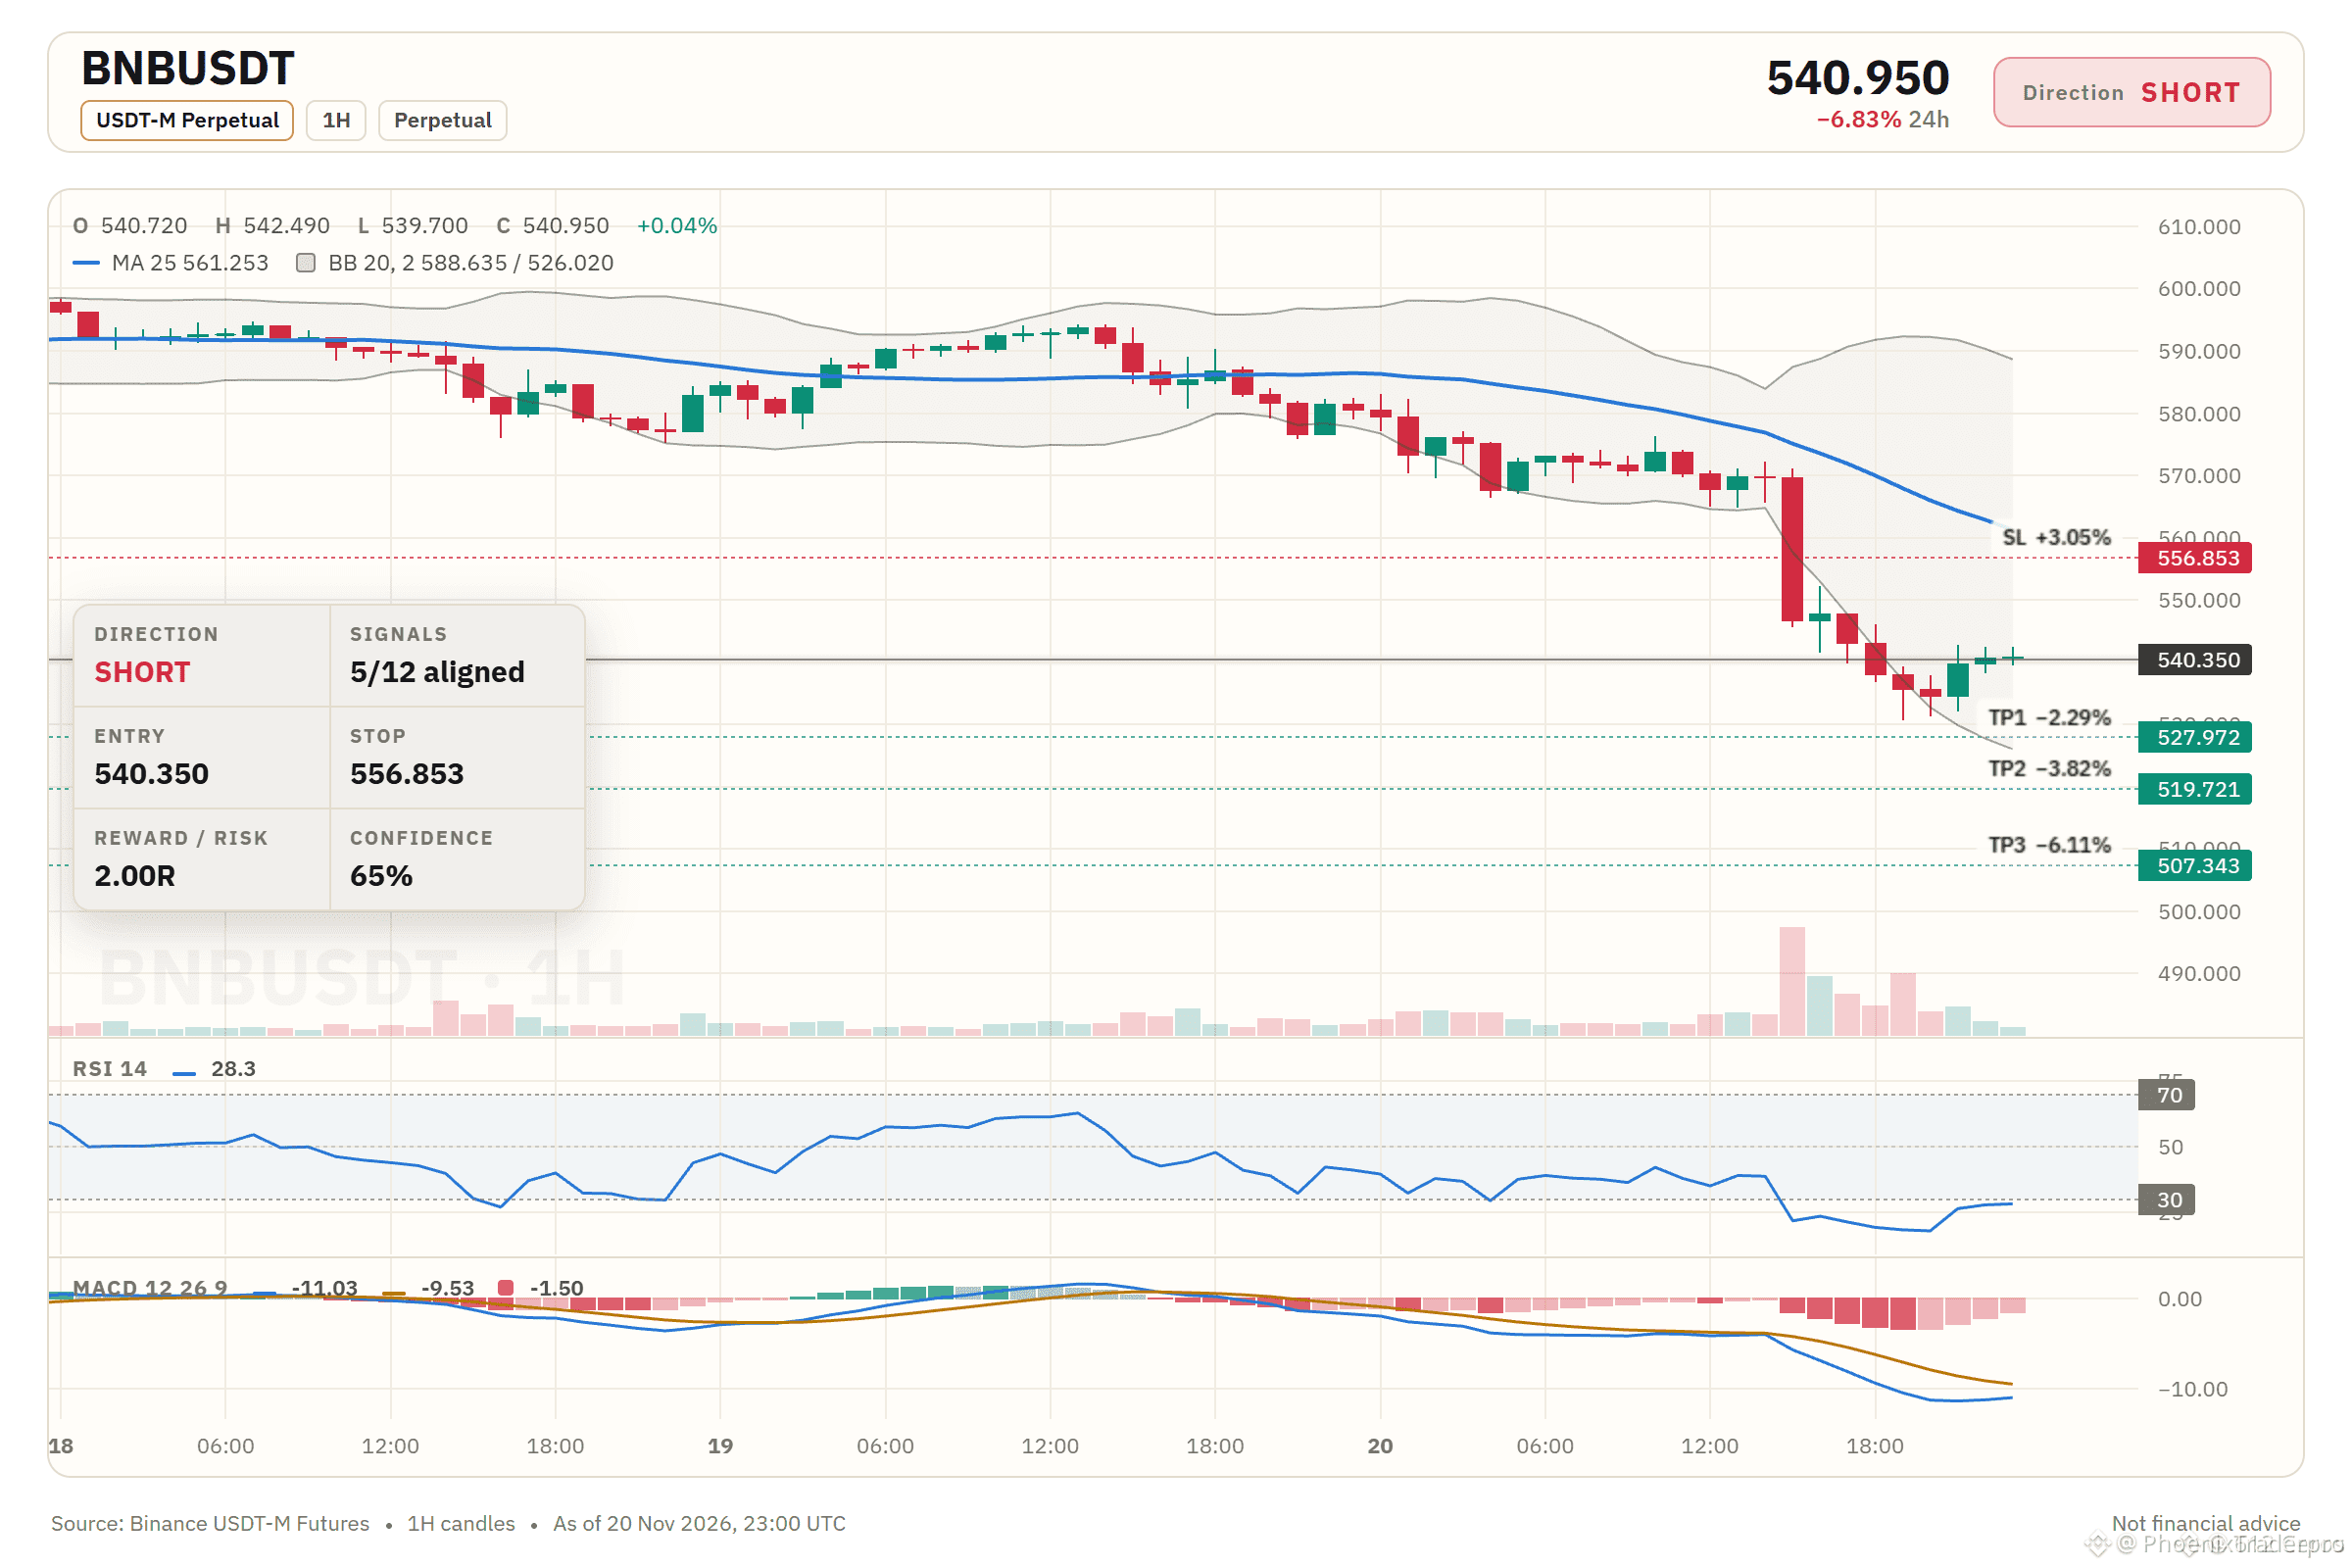
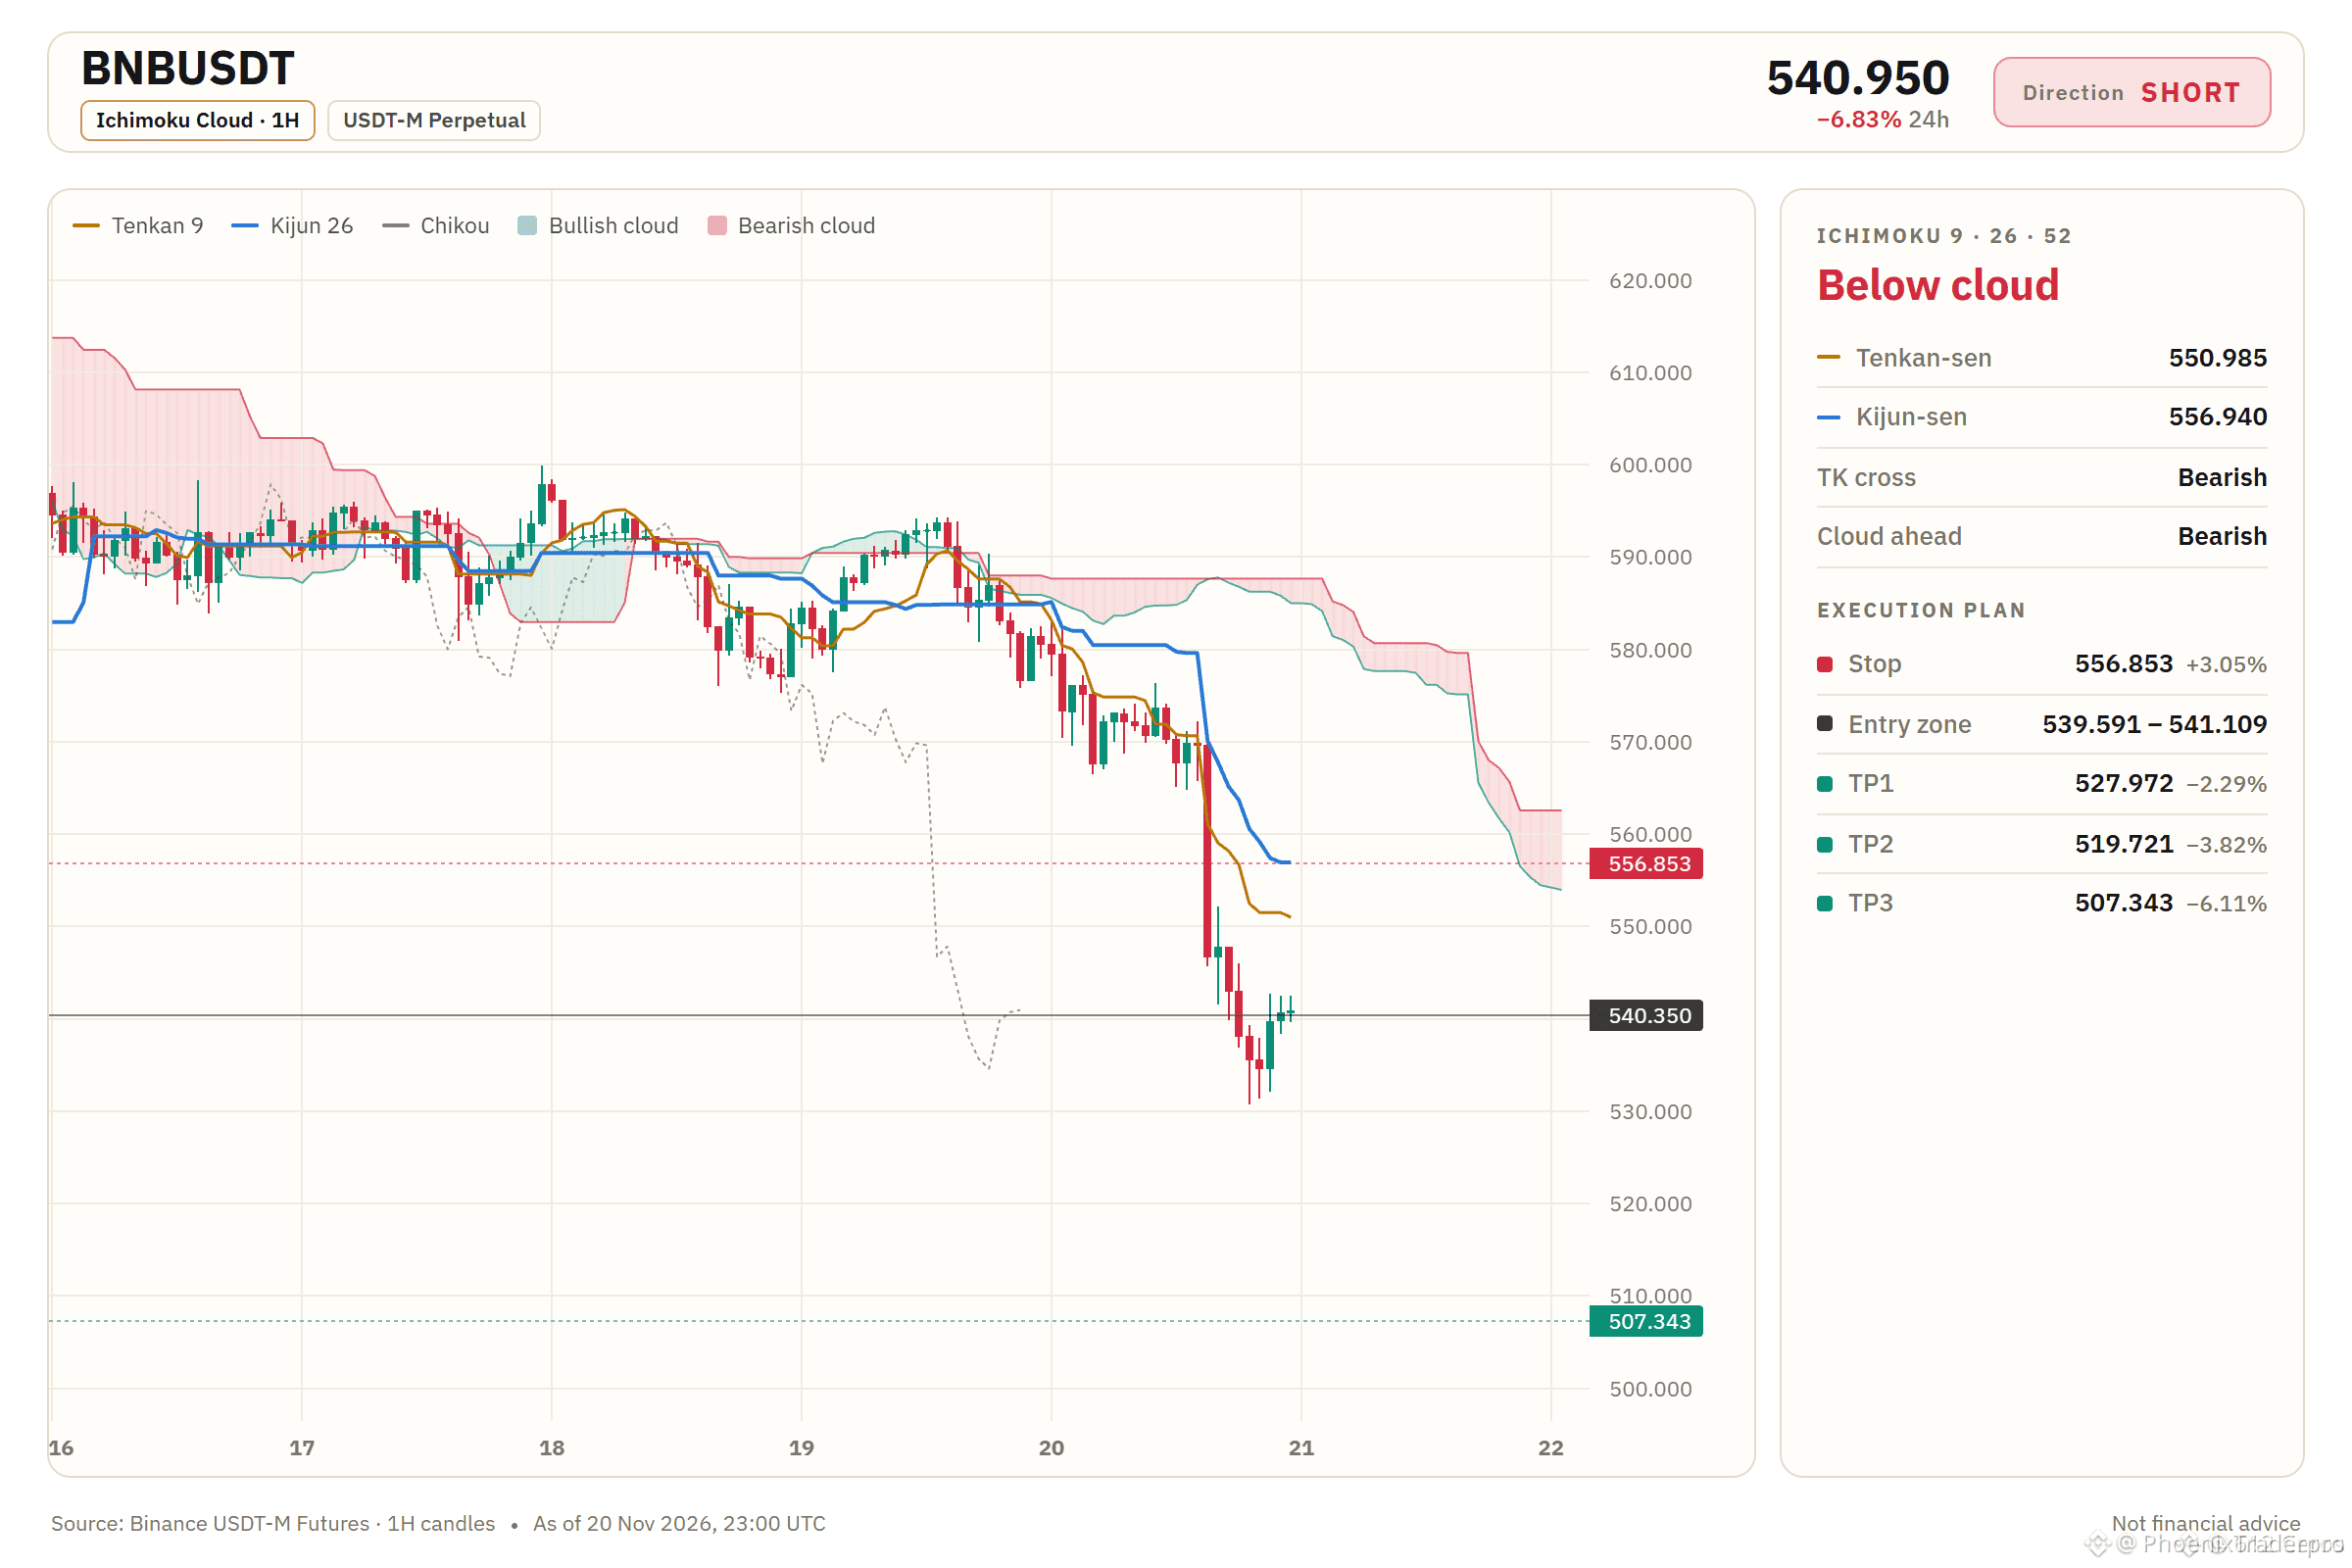
37

price action on $BNB, keeps rejecting the same area, so the short side is worth watching, keeping this one around 29x
Entry: 539.63–540.63
TP1: 527.99 | TP2: 517.57 | TP3: 504.96
Stop Loss: 548.77
#BNB #Write2Earn #Crypto #Binance
price action on $BNB , keeps rejecting the same area, so the short side is worth watching, keeping this one around 29x
Entry: 539.63–540.63
TP1: 527.99 | TP2: 517.57 | TP3: 504.96
Stop Loss: 548.77
#BNB #Write2Earn #Crypto #Binance
Entry: 539.63–540.63
TP1: 527.99 | TP2: 517.57 | TP3: 504.96
Stop Loss: 548.77
#BNB #Write2Earn #Crypto #Binance
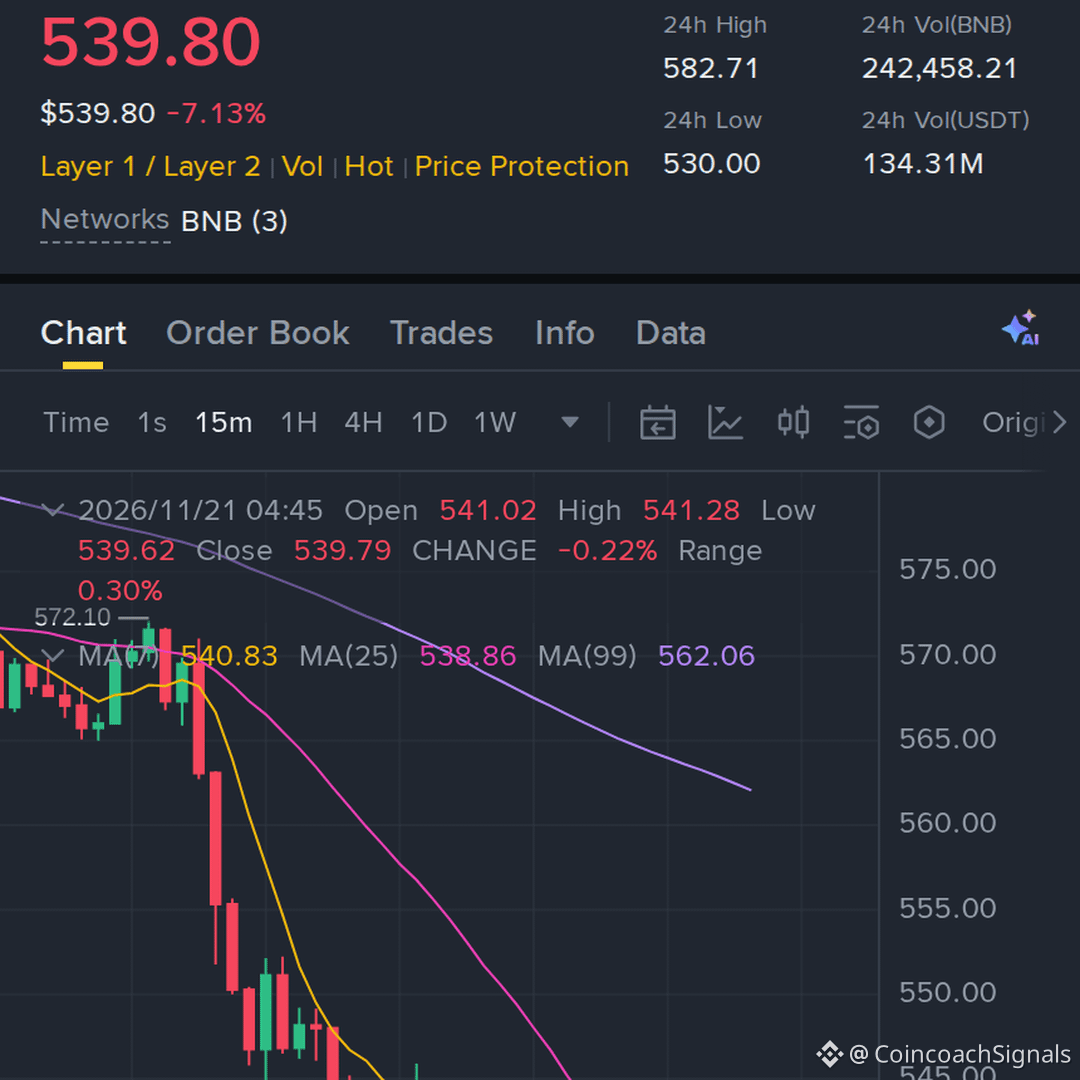
18
·
--
🔴 $BNB STUCK BELOW STACKED EMAS AS SELLERS PRESSURE THE TREND 📉
Entry: 540.148 – 542.292 ⚡
Target: 521.150 / 507.771 / 487.701 🎯
Stop Loss: 567.979 ⚠️
The four-hour and one-hour charts reveal a decisive bearish stack with price pinned beneath the major moving averages. 📊 Momentum favors the downside here, though caution is warranted since the RSI has drifted deep into oversold territory. ⚡
Keep position sizing light given the exhausted local momentum and potential for sharp counter-trend relief bounces. 🔍 Are you looking to scale into this short breakdown or waiting for a cleaner retest? 👇
⚠️ Not financial advice. Always manage your risk. 🛡️
🏷️ #BNB #ShortSetup #Bearish #Crypto
📉 ⚠️
🔴 $BNB STUCK BELOW STACKED EMAS AS SELLERS PRESSURE THE TREND 📉
Entry: 540.148 – 542.292 ⚡
Target: 521.150 / 507.771 / 487.701 🎯
Stop Loss: 567.979 ⚠️
The four-hour and one-hour charts reveal a decisive bearish stack with price pinned beneath the major moving averages. 📊 Momentum favors the downside here, though caution is warranted since the RSI has drifted deep into oversold territory. ⚡
Keep position sizing light given the exhausted local momentum and potential for sharp counter-trend relief bounces. 🔍 Are you looking to scale into this short breakdown or waiting for a cleaner retest? 👇
⚠️ Not financial advice. Always manage your risk. 🛡️
🏷️ #BNB #ShortSetup #Bearish #Crypto
📉 ⚠️
Entry: 540.148 – 542.292 ⚡
Target: 521.150 / 507.771 / 487.701 🎯
Stop Loss: 567.979 ⚠️
The four-hour and one-hour charts reveal a decisive bearish stack with price pinned beneath the major moving averages. 📊 Momentum favors the downside here, though caution is warranted since the RSI has drifted deep into oversold territory. ⚡
Keep position sizing light given the exhausted local momentum and potential for sharp counter-trend relief bounces. 🔍 Are you looking to scale into this short breakdown or waiting for a cleaner retest? 👇
⚠️ Not financial advice. Always manage your risk. 🛡️
🏷️ #BNB #ShortSetup #Bearish #Crypto
📉 ⚠️
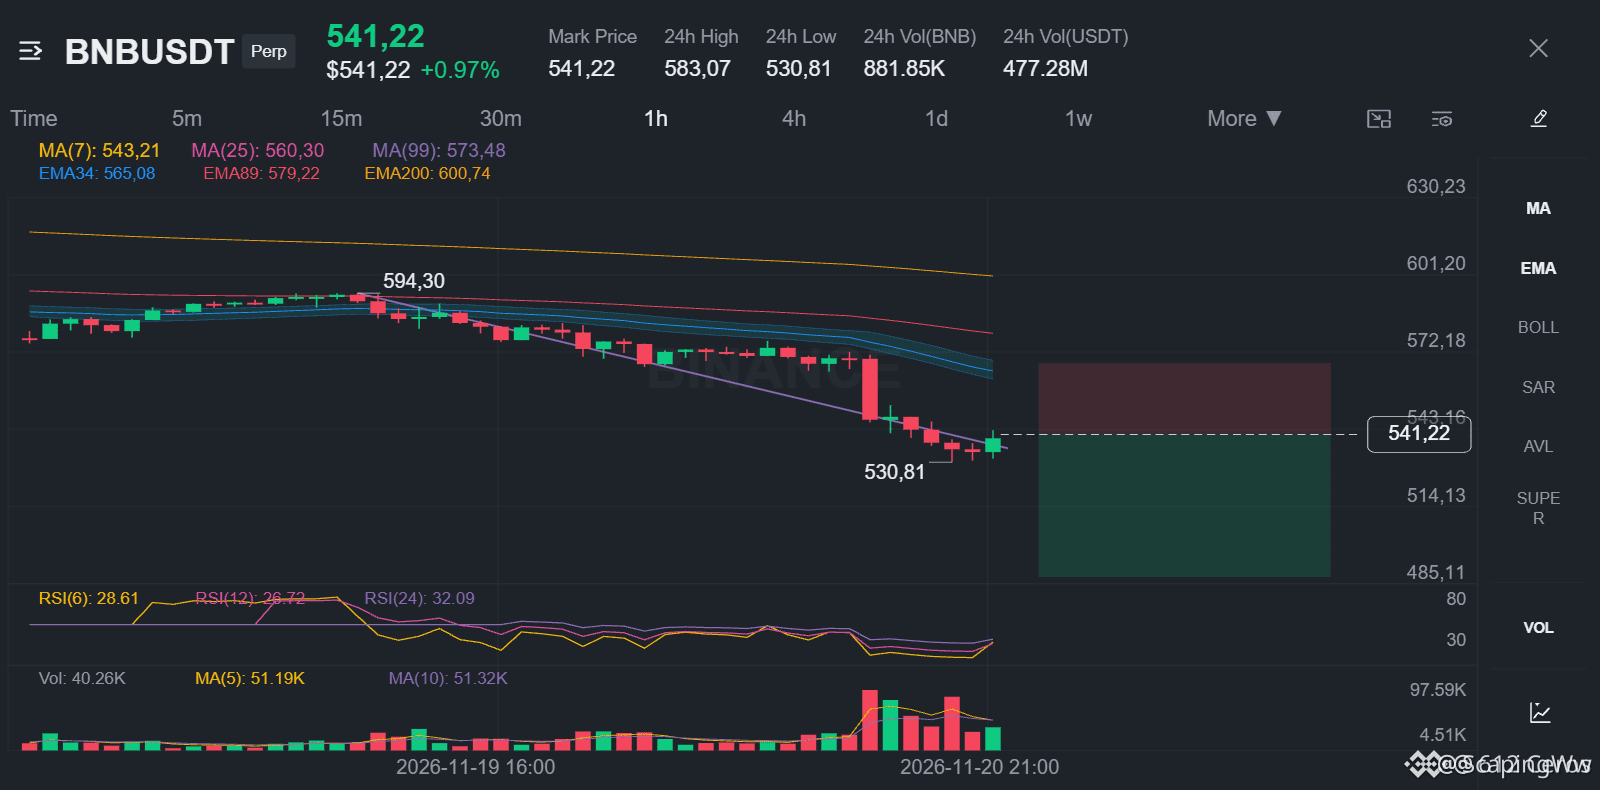
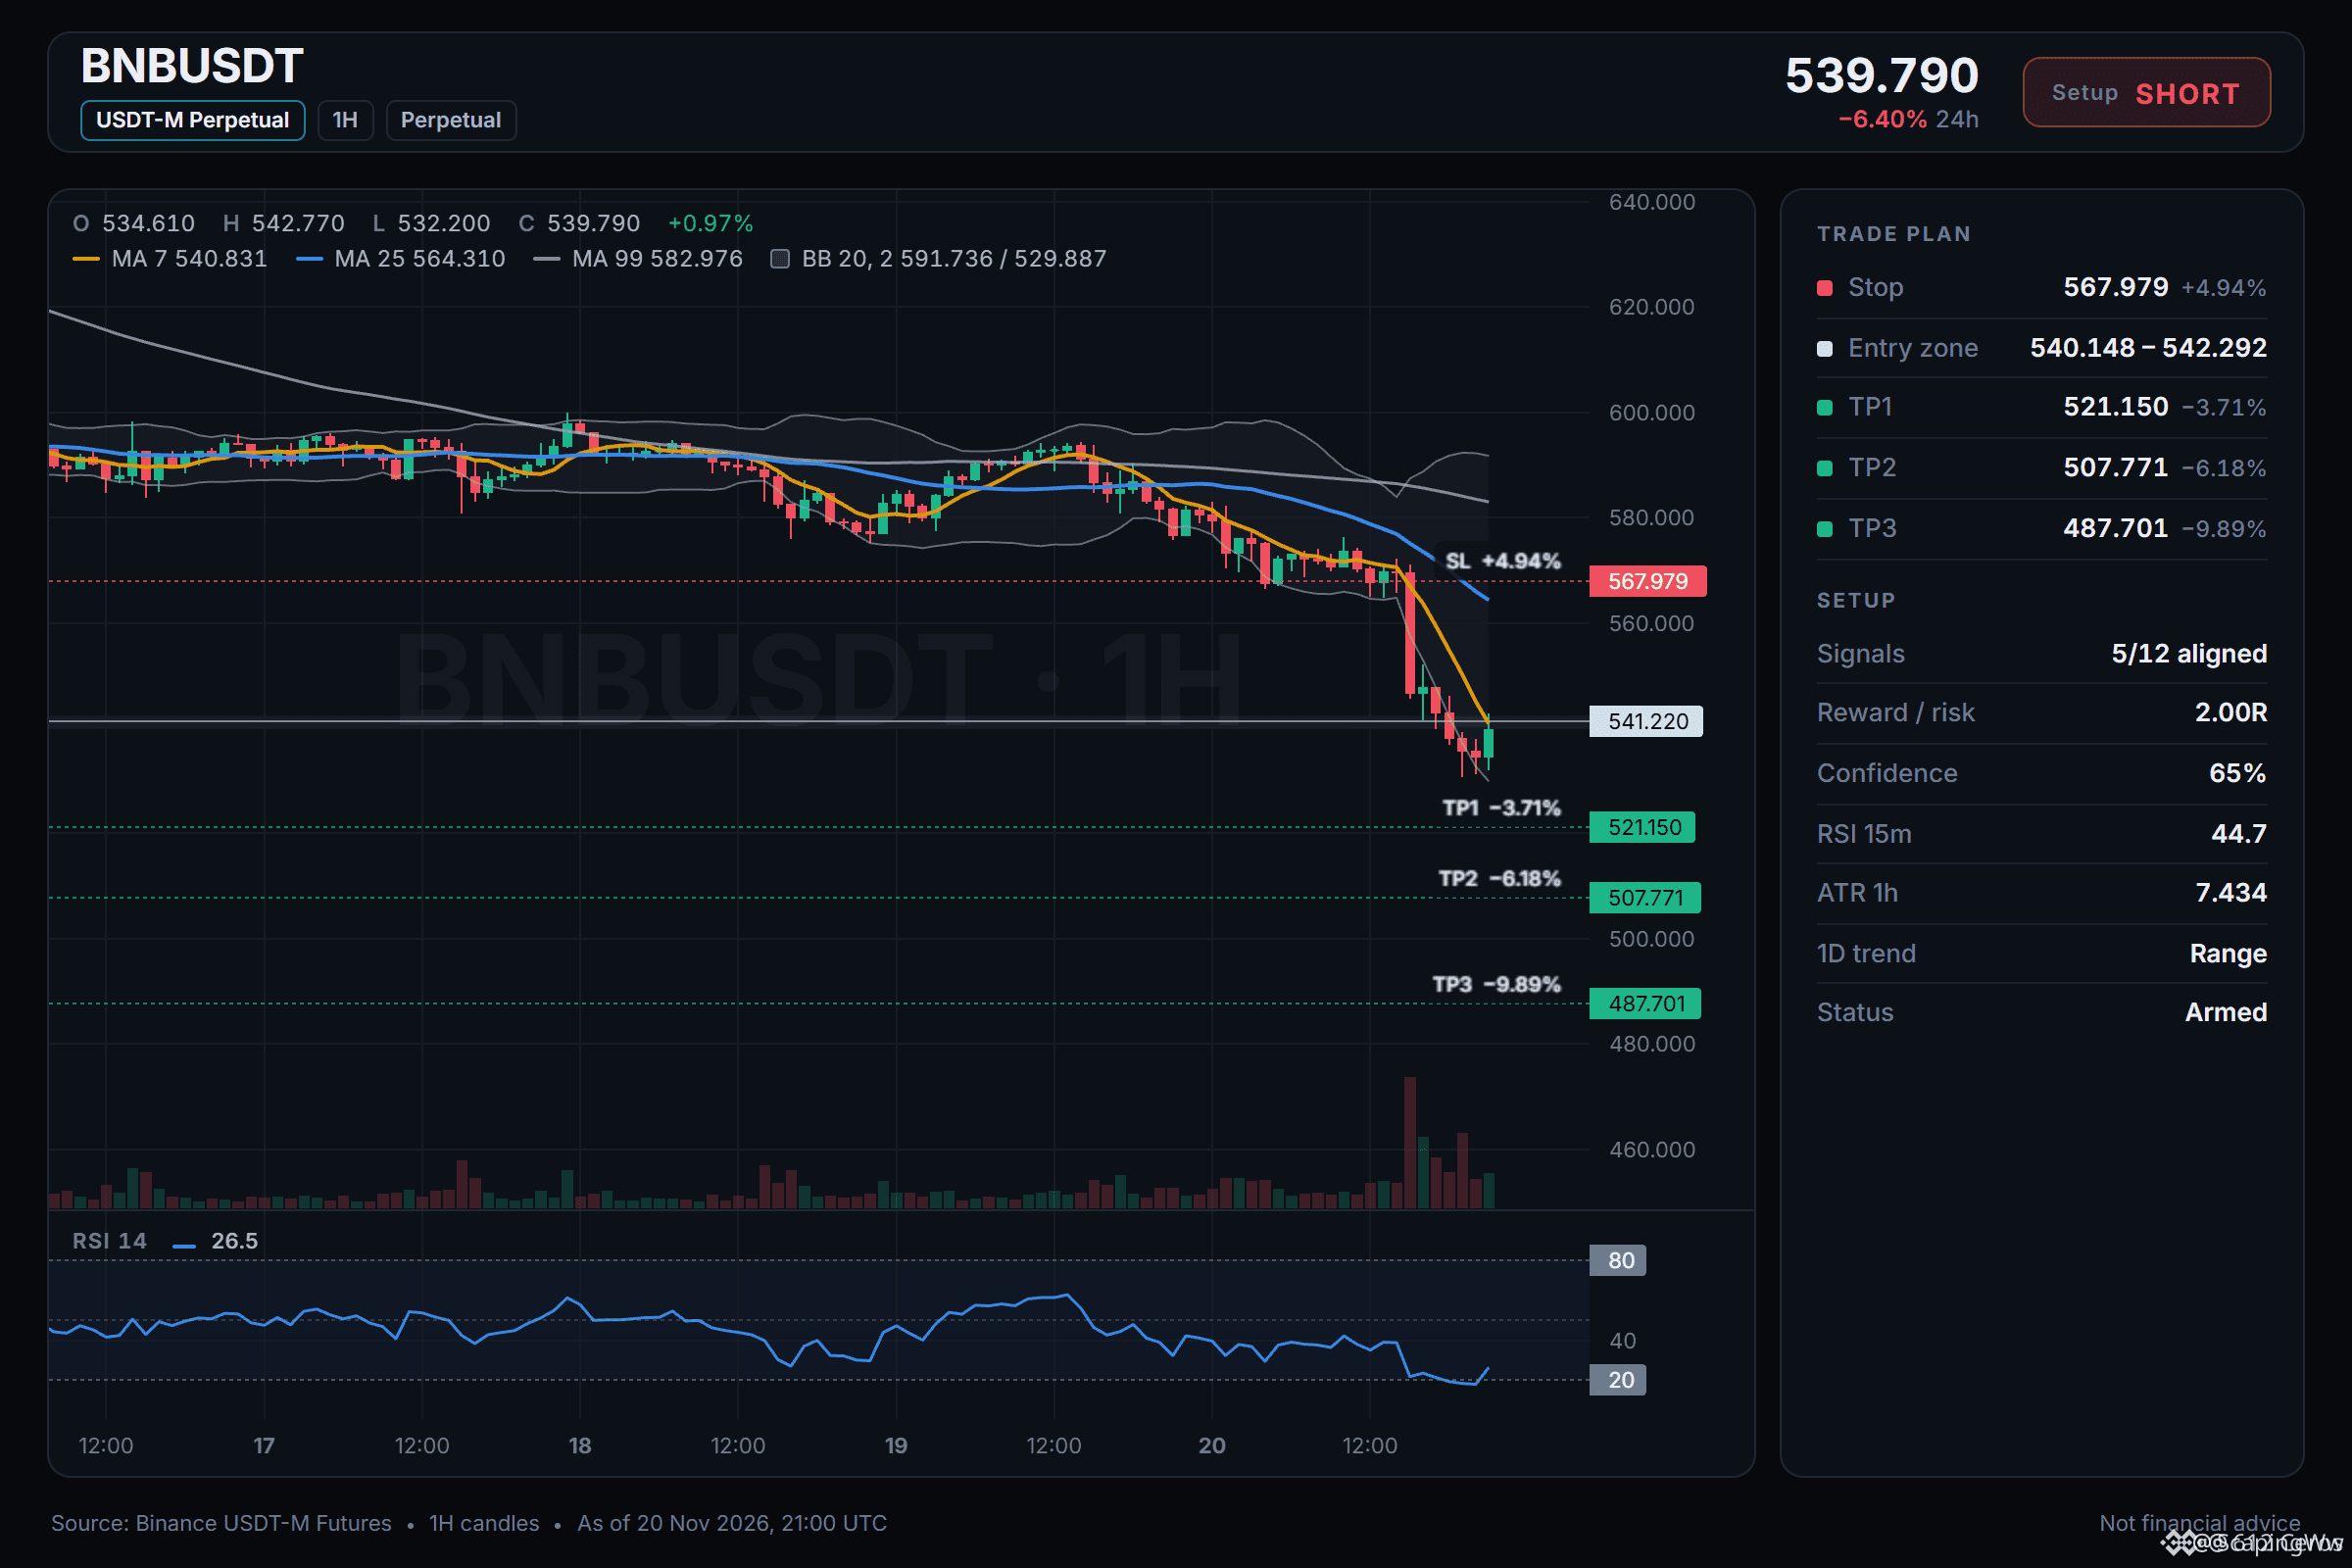
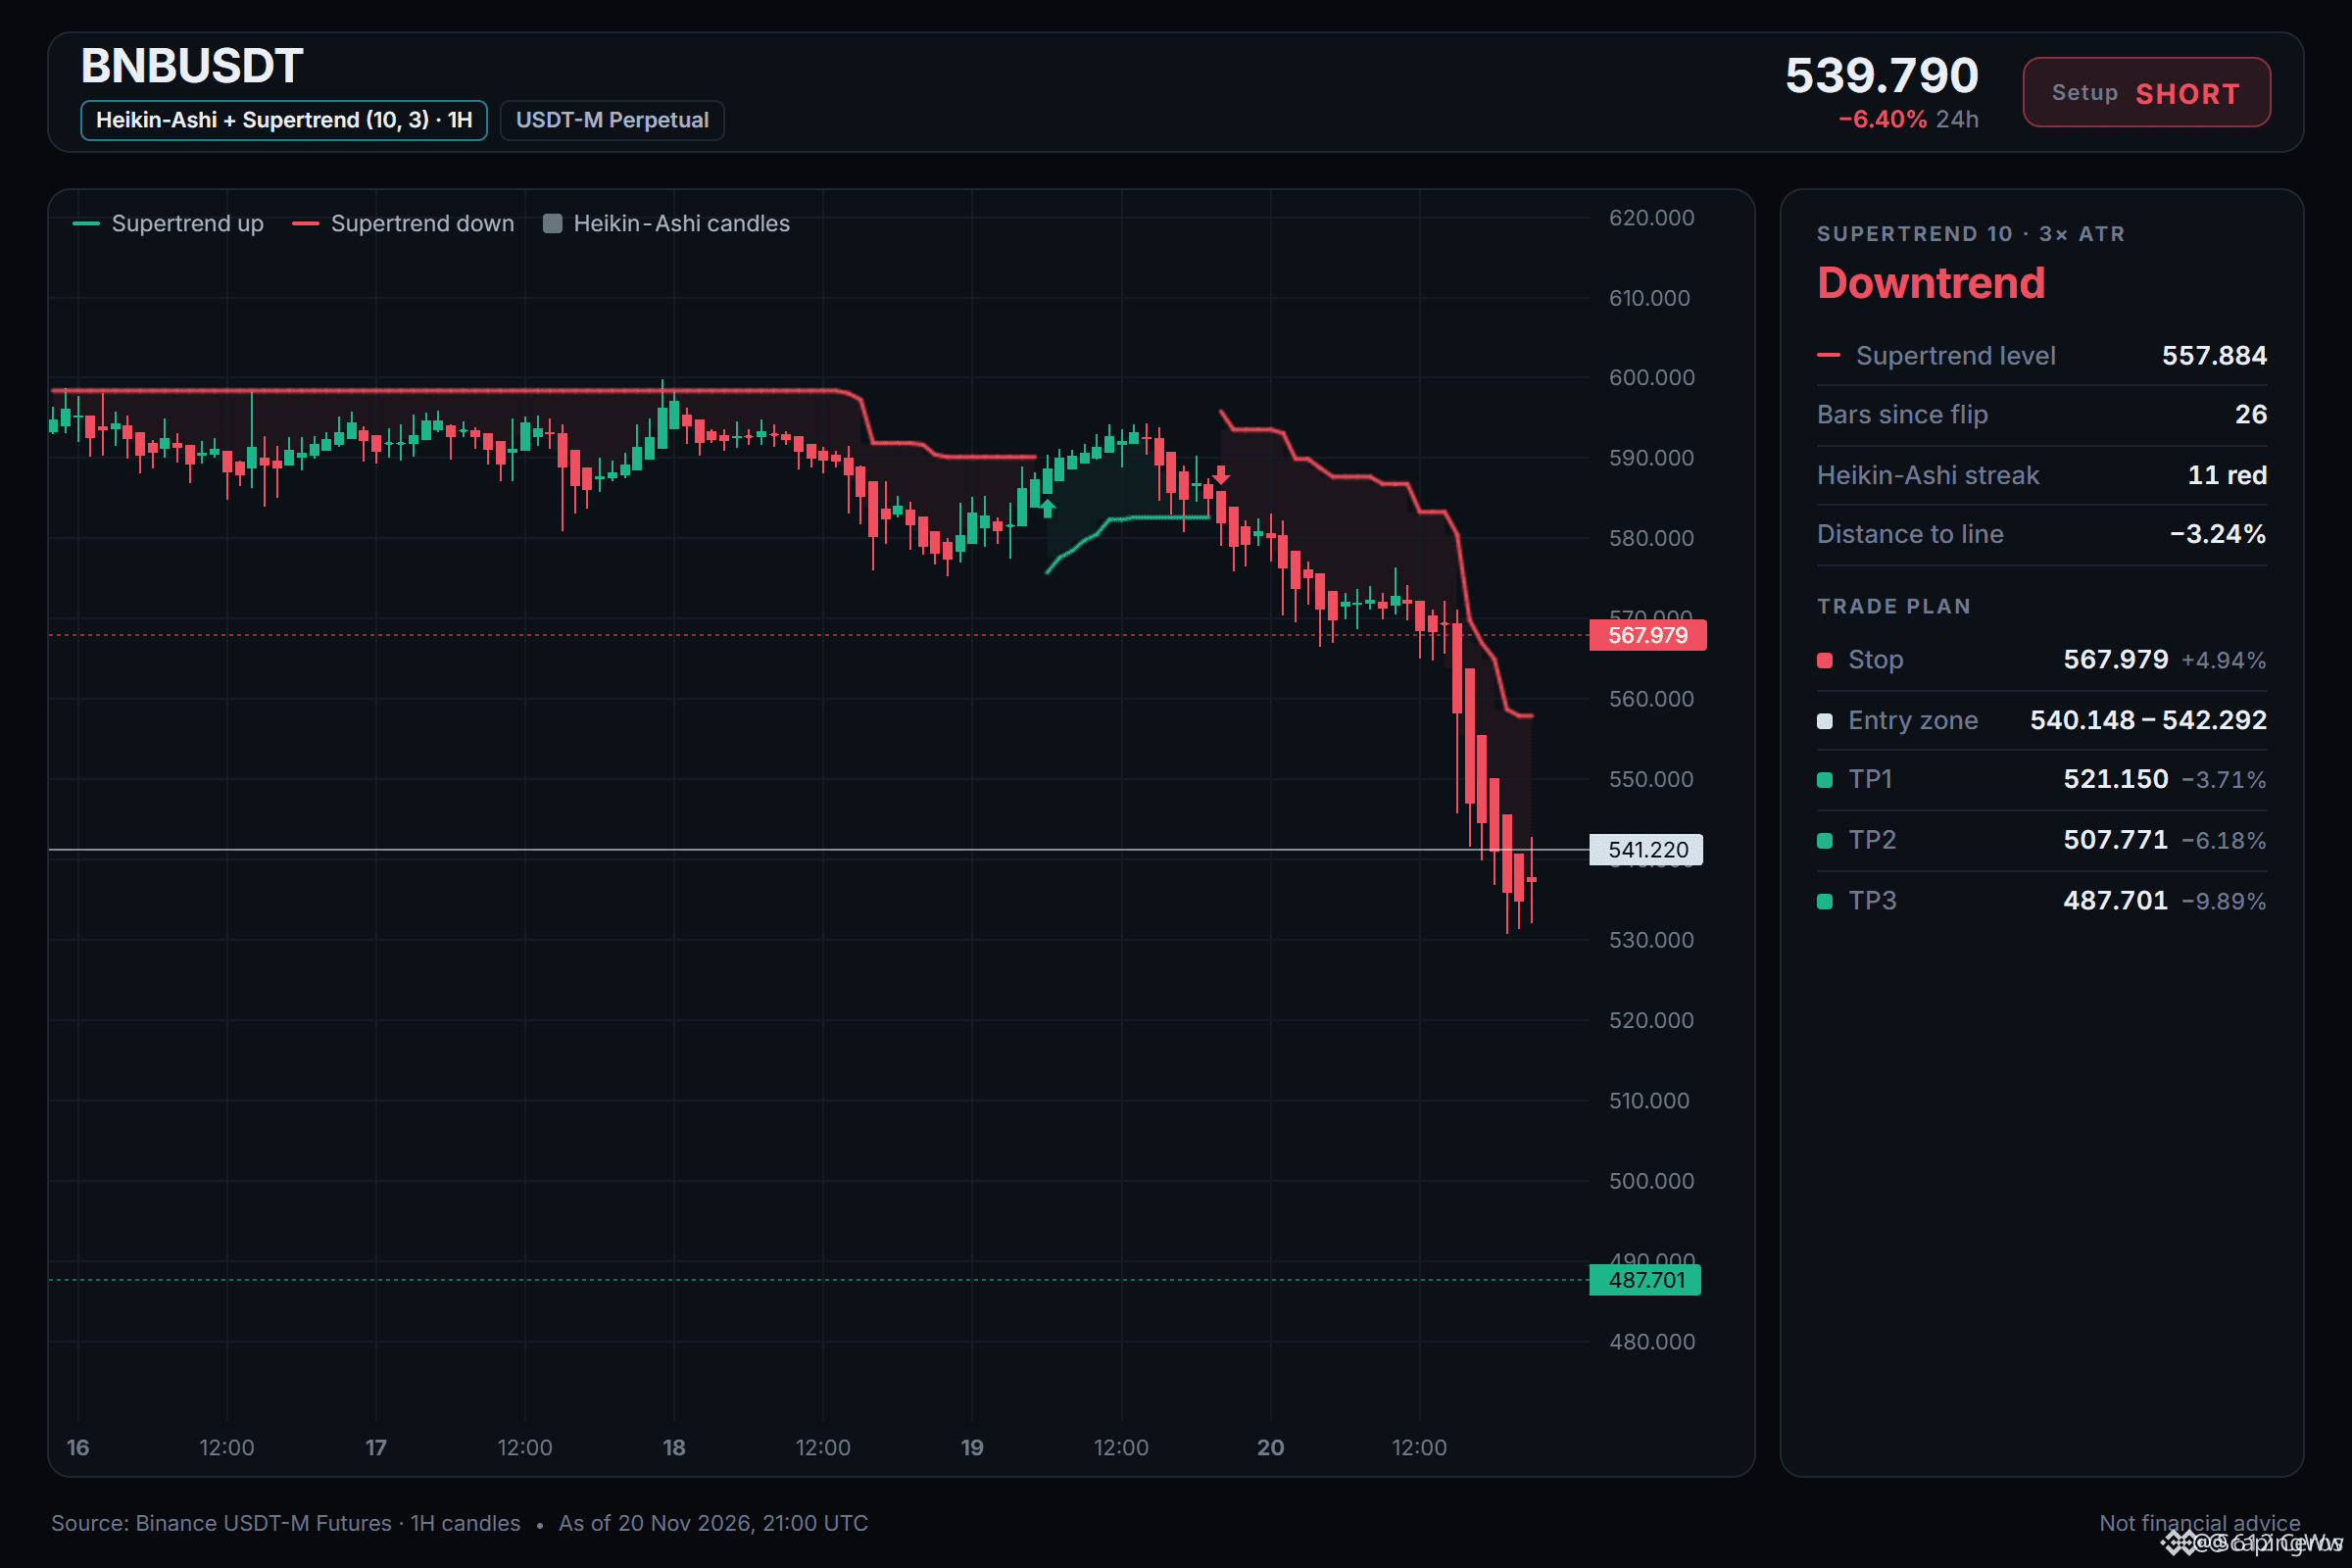
3

BEARISH STRUCTURE CONFIRMED AS $BNB REJECTS BELOW KEY EMA RESISTANCE 📉 🔴
Entry: 565.42 ⚡
Target: 556.93 🚀
Stop Loss: 578.19 ⚠️
Price action on $BNB continues to print lower highs beneath a heavy bearish stack on the higher timeframes. Both the 50 and 200 exponential moving averages are acting as an impenetrable ceiling, rejecting every weak relief attempt. 📊 Institutional order flow remains skewed toward distribution as sellers maintain absolute control over the mid-range. 📉
The current liquidity profile points toward a steady downward migration as market participants rebalance inefficiencies below. 🔍 Are you positioning for this continuation leg down or waiting for a deeper sweep? 💬
⚠️ Not financial advice. Always manage your risk. 🛡️
🏷️ #BNB #ShortSetup #PriceAction #Crypto
📉 🦈
BEARISH STRUCTURE CONFIRMED AS $BNB REJECTS BELOW KEY EMA RESISTANCE 📉 🔴
Entry: 565.42 ⚡
Target: 556.93 🚀
Stop Loss: 578.19 ⚠️
Price action on $BNB continues to print lower highs beneath a heavy bearish stack on the higher timeframes. Both the 50 and 200 exponential moving averages are acting as an impenetrable ceiling, rejecting every weak relief attempt. 📊 Institutional order flow remains skewed toward distribution as sellers maintain absolute control over the mid-range. 📉
The current liquidity profile points toward a steady downward migration as market participants rebalance inefficiencies below. 🔍 Are you positioning for this continuation leg down or waiting for a deeper sweep? 💬
⚠️ Not financial advice. Always manage your risk. 🛡️
🏷️ #BNB #ShortSetup #PriceAction #Crypto
📉 🦈
Entry: 565.42 ⚡
Target: 556.93 🚀
Stop Loss: 578.19 ⚠️
Price action on $BNB continues to print lower highs beneath a heavy bearish stack on the higher timeframes. Both the 50 and 200 exponential moving averages are acting as an impenetrable ceiling, rejecting every weak relief attempt. 📊 Institutional order flow remains skewed toward distribution as sellers maintain absolute control over the mid-range. 📉
The current liquidity profile points toward a steady downward migration as market participants rebalance inefficiencies below. 🔍 Are you positioning for this continuation leg down or waiting for a deeper sweep? 💬
⚠️ Not financial advice. Always manage your risk. 🛡️
🏷️ #BNB #ShortSetup #PriceAction #Crypto
📉 🦈
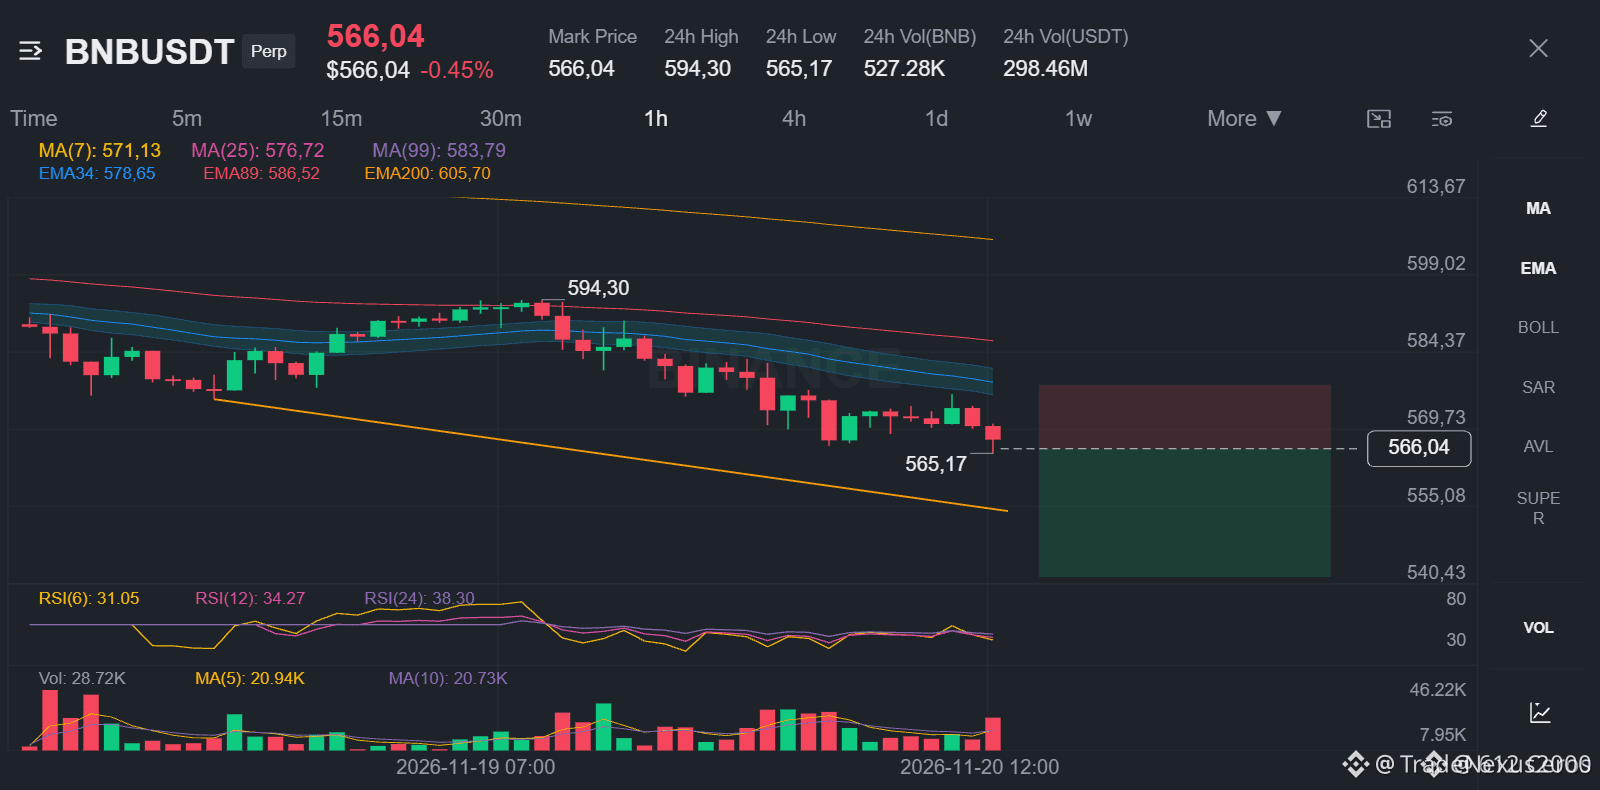
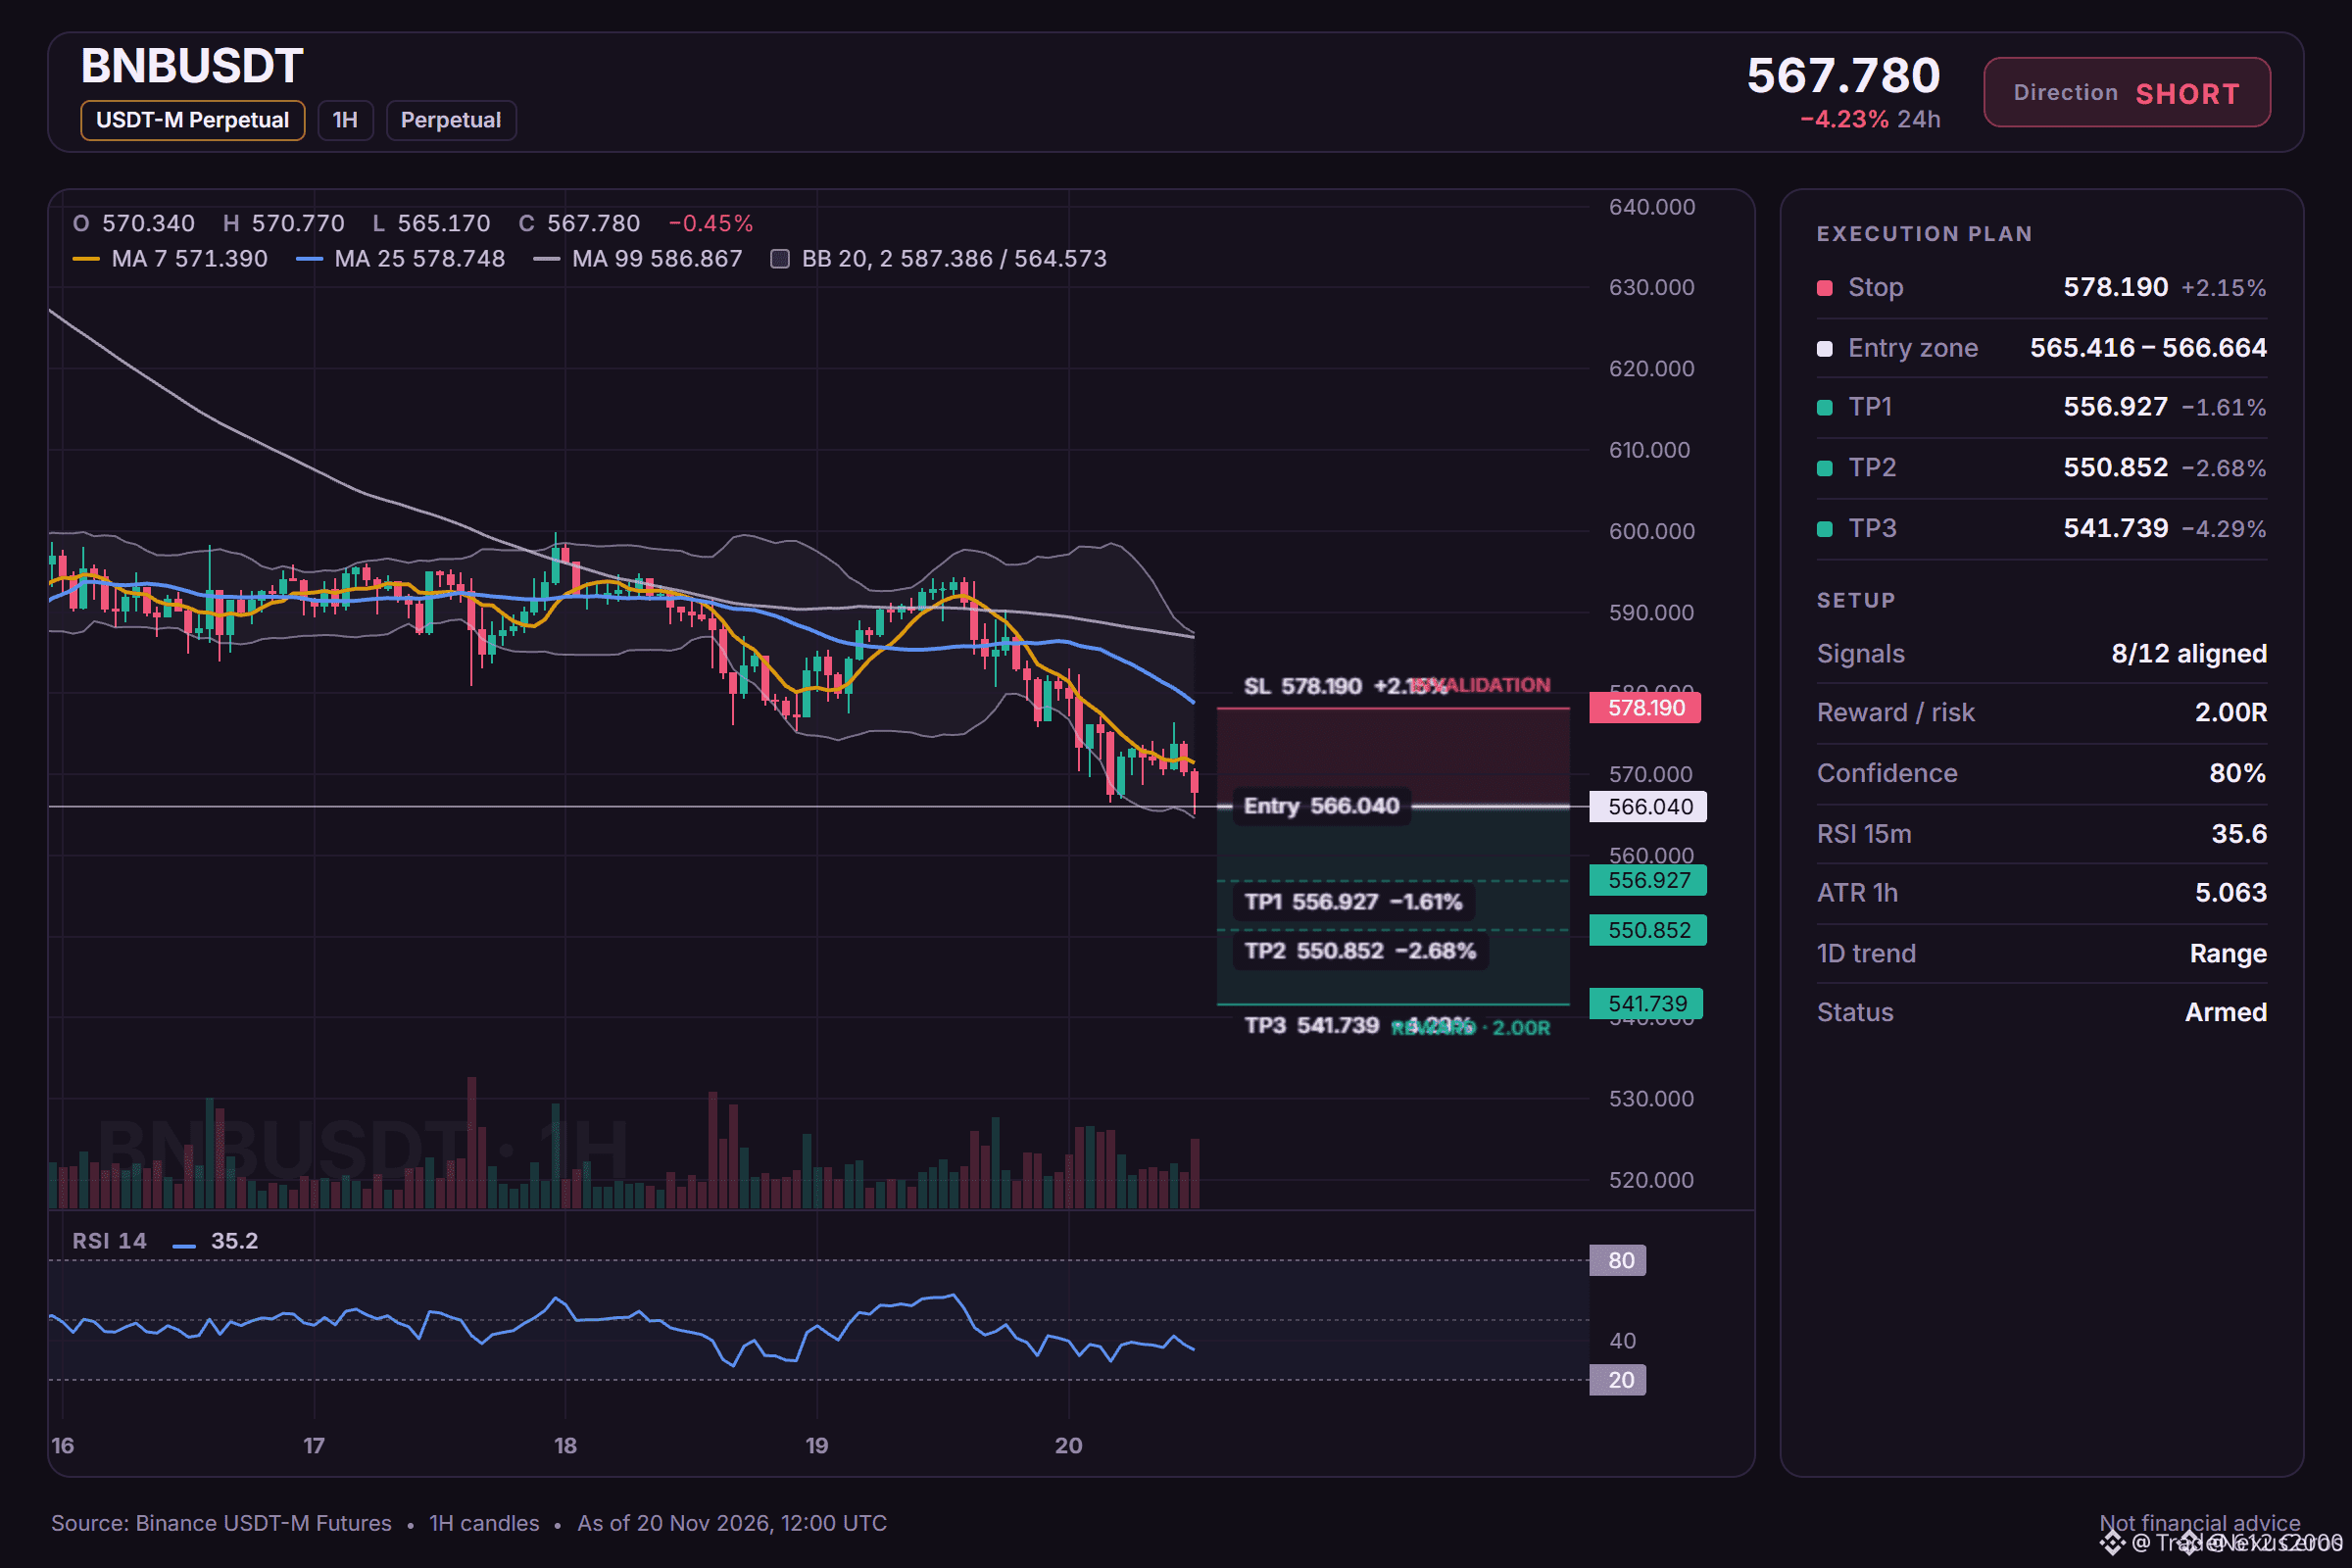
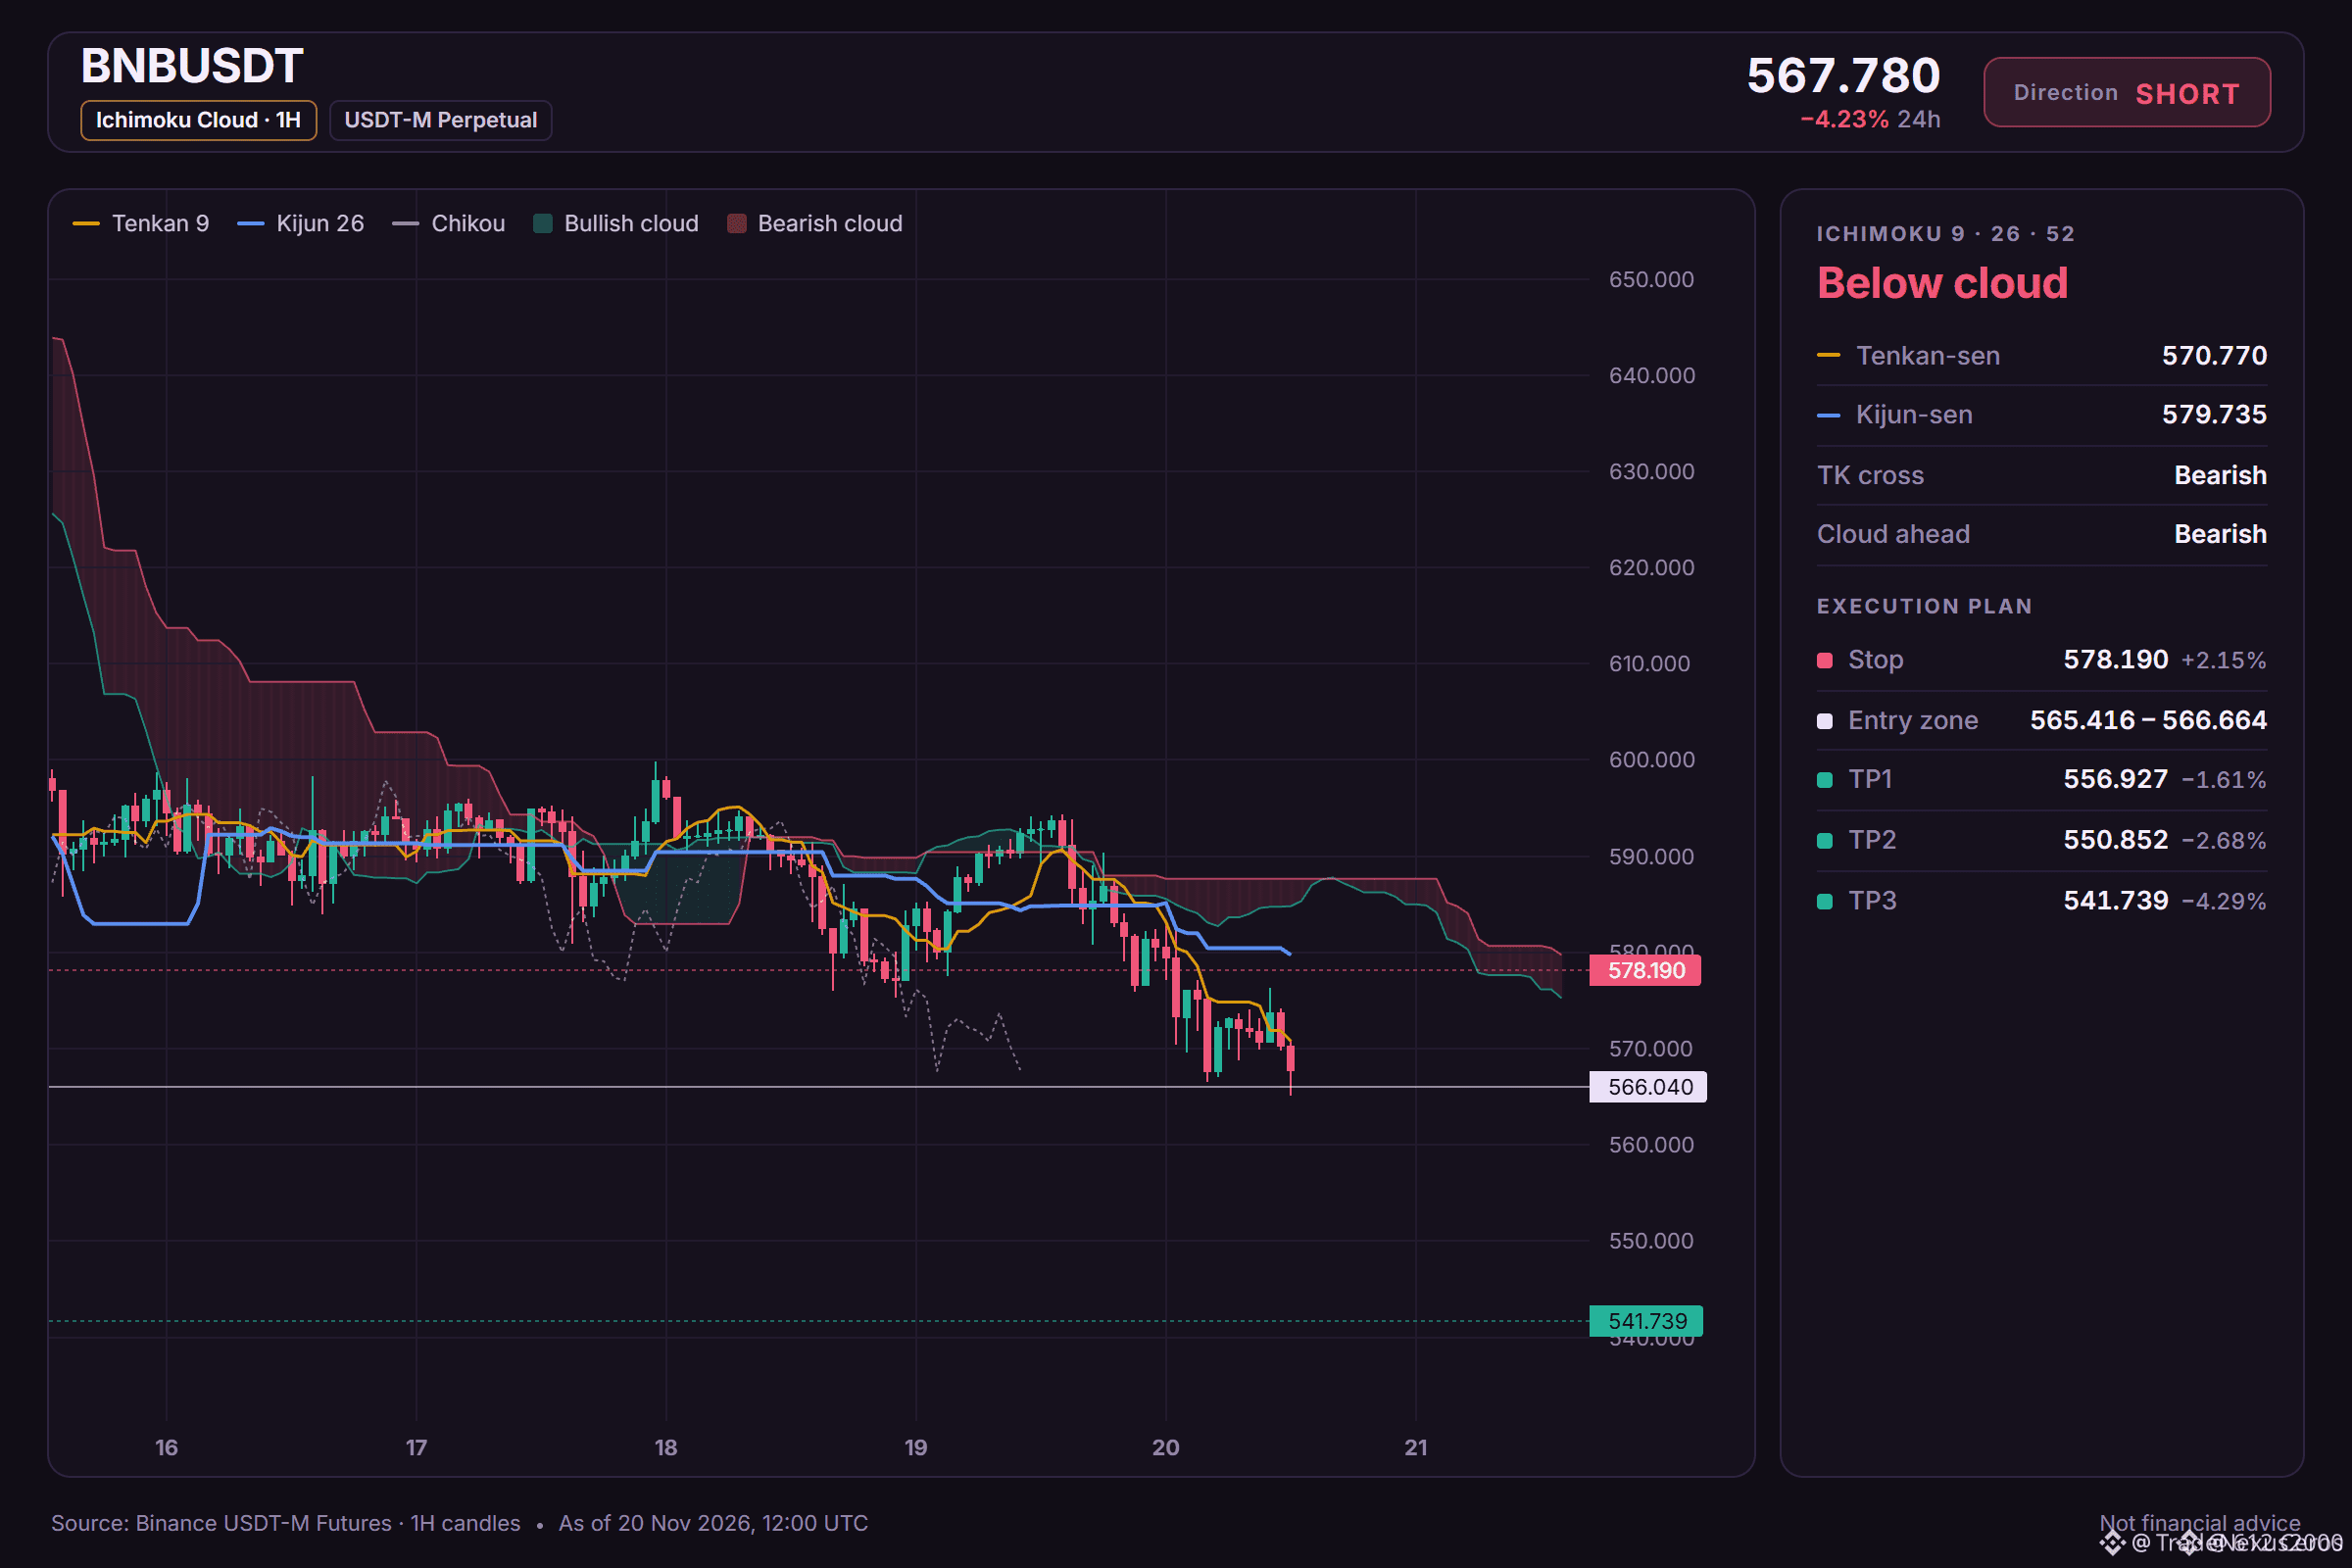
5
Log in to explore more content
Join global crypto users on Binance Square
⚡️ Get latest and useful information about crypto.
💬 Trusted by the world’s largest crypto exchange.
👍 Discover real insights from verified creators.
Email / Phone number
Trending Topics
1
#CanBTCReboundAfterFallingBelow60K?
154,321 views
652 Discussing
2
#GlobalStocksFaceLongestLosingStreakSince2023
63,227 views
580 Discussing
3
#AnthropicPlungesTowardIPOPriceonDay2
24,532 views
257 Discussing
4
#BNBDropsBelow540USDTWith8.46%DailyDecline
1,502 views
34 Discussing
5
#BitMineFaces$10.1BUnrealizedETHLoss
0 views
0 Discussing
6
#StrategyReports$35BNetReserves
0 views
0 Discussing
7
#MorganStanleyEndsAnthropicStockSupportAfterOneDay
869 views
20 Discussing
8
#CryptoBilisAttackerMoves25000ETHToTornadoCash
1,014 views
29 Discussing
9
#FirstRealTimeDividendPaidInDigitalDollars
105 views
6 Discussing
10
#GaoTengBitcoinETFListsOnHKEX
40,350 views
407 Discussing