
#dash
dash
9.7M views
36,164 Discussing
Hot
Latest

·
--
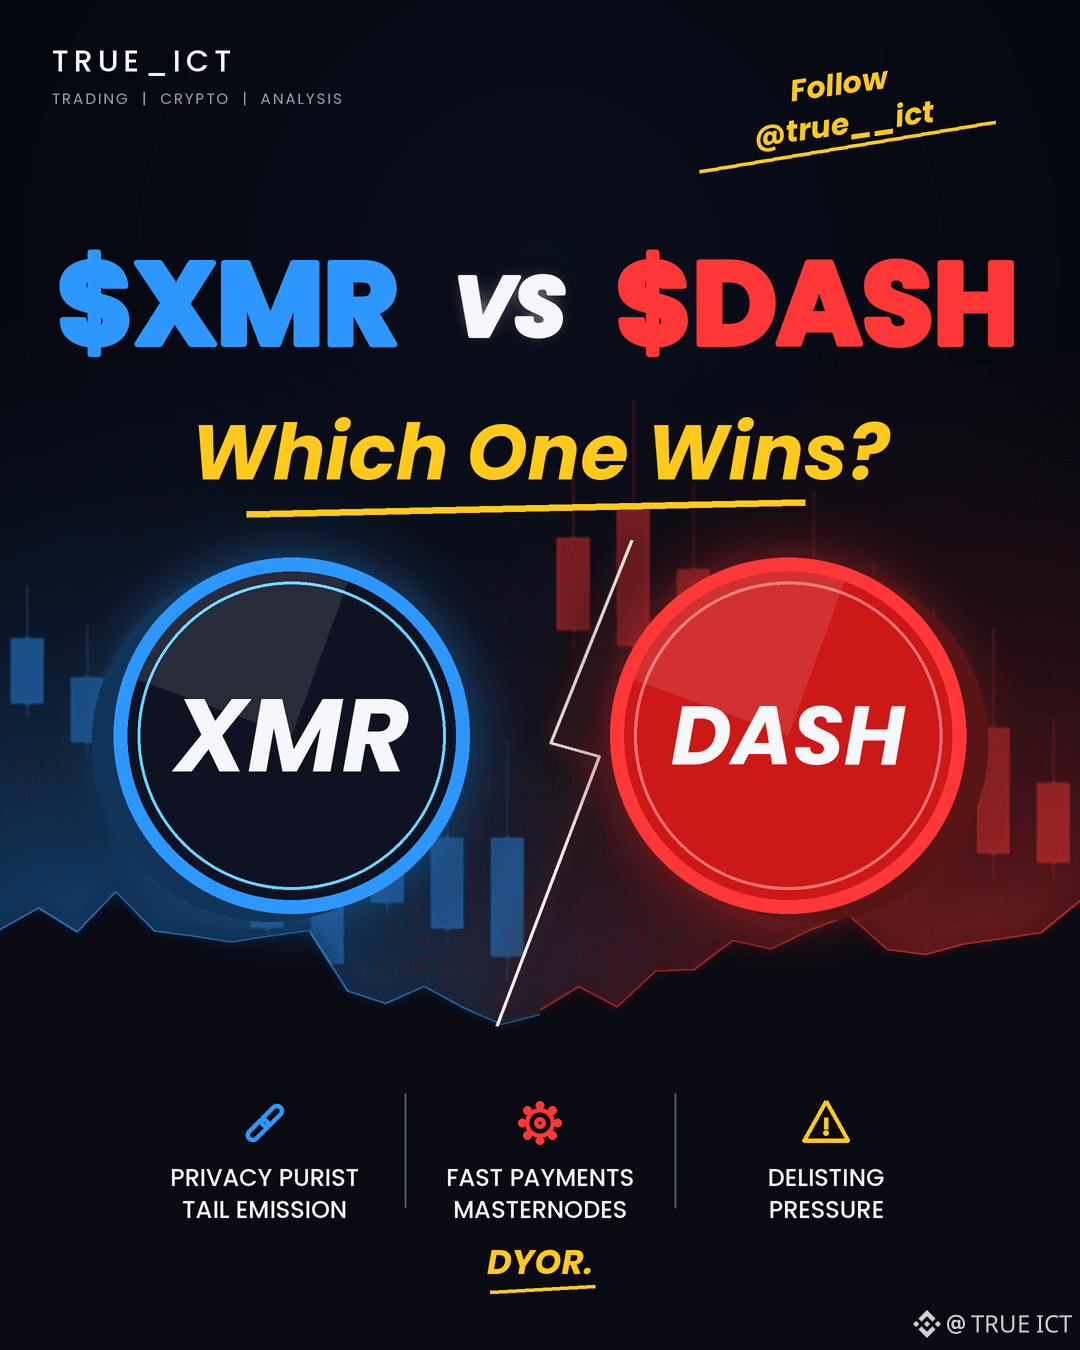
⚔️ $XMR vs $DASH: which one wins?
🔹 $XMR: private by default, with no hard supply cap thanks to tail emission.
🔹 $DASH: a payments-focused coin with masternodes, capped near 18.9M.
📊 XMR is the privacy purist pick. DASH leans on fast payments.
⚠️ Both face delisting pressure on regulated exchanges.
$XMR or $DASH? 👇
Not financial advice. DYOR.
#XMR #DASH #Binance
⚔️ $XMR vs $DASH : which one wins?
🔹 $XMR : private by default, with no hard supply cap thanks to tail emission.
🔹 $DASH : a payments-focused coin with masternodes, capped near 18.9M.
📊 XMR is the privacy purist pick. DASH leans on fast payments.
⚠️ Both face delisting pressure on regulated exchanges.
$XMR or $DASH ? 👇
Not financial advice. DYOR.
#XMR #DASH #Binance
🔹 $XMR : private by default, with no hard supply cap thanks to tail emission.
🔹 $DASH : a payments-focused coin with masternodes, capped near 18.9M.
📊 XMR is the privacy purist pick. DASH leans on fast payments.
⚠️ Both face delisting pressure on regulated exchanges.
$XMR or $DASH ? 👇
Not financial advice. DYOR.
#XMR #DASH #Binance
帅尒ふ:
zec 比不过现在又开始比 xmr 了,哈哈,xmr 也比你垃圾 dash 多 20 倍啊,也是 1 比 20🤪
1
2
1.6k

$DASH is trading near $48, and its long-term chart is catching attention with several major resistance levels ahead.
🎯 Bullish Targets:
$147.69
$284.98
$477.57
📈 The final target represents nearly 10X potential, but a breakout above $147 remains a key level to watch.
Could $DASH make a comeback? 👀
#DASH #DashCrypto #Altcoins #CryptoTrading #CryptoMarket
$DASH is trading near $48, and its long-term chart is catching attention with several major resistance levels ahead.
🎯 Bullish Targets:
$147.69
$284.98
$477.57
📈 The final target represents nearly 10X potential, but a breakout above $147 remains a key level to watch.
Could $DASH make a comeback? 👀
#DASH #DashCrypto #Altcoins #CryptoTrading #CryptoMarket
🎯 Bullish Targets:
$147.69
$284.98
$477.57
📈 The final target represents nearly 10X potential, but a breakout above $147 remains a key level to watch.
Could $DASH make a comeback? 👀
#DASH #DashCrypto #Altcoins #CryptoTrading #CryptoMarket

KryptoMann:
бред сумашедшего
2
1
947


DASH, BMT and JUP: Volatility Rises as Traders Reassess Key Crypto NarrativesThe latest Binance spot market data shows a risk sensitive session for DASH, BMT and JUP. Each token is trading below its 24 hour opening price, but the market context behind each move is different. DASH is tied to the digital payments narrative, BMT represents blockchain data visualization infrastructure, and JUP remains closely connected to Solana DeFi activity.
The common signal is elevated volatility. Price movement alone does not confirm a sustained trend, but it does show that traders are actively repricing these assets as liquidity, sentiment and sector rotation shift across the crypto market.
DASH is currently trading at $32.19, compared with a 24 hour opening price of $35.81, a change of -10.11%. It reached a high of $35.97 and a low of $30.72, creating a 17.09% trading range.
DASH is one of the longer established crypto assets in the payments segment. Its market behavior can be influenced by broader demand for digital payment tokens, privacy related discussion, liquidity conditions and speculative interest in legacy altcoins. The move below the session open shows that sellers have been more active during this window, but the range also confirms that there is meaningful two way participation.
For DASH, the key market question is whether trading activity can stabilize after this decline. A market that holds its lower range with healthy liquidity may indicate that participants are absorbing supply. In contrast, continuing weakness accompanied by fading liquidity would keep volatility risk elevated. Traders following DASH should also monitor broader altcoin sentiment because legacy payment assets often react sharply when market appetite shifts between Bitcoin, large cap altcoins and higher beta sectors.
BMT, the token associated with Bubblemaps, is trading at $0.02013, down -11.09% from its 24 hour open of $0.02264. The session high was $0.02300, while the low reached $0.01899. Its 21.12% range is the widest among the three assets in percentage terms, highlighting a highly active market environment.
Bubblemaps operates in a different category from most consumer facing crypto projects. Its focus on visualizing blockchain wallet relationships and token distribution gives it exposure to the on chain transparency and research narrative. When market participants become more focused on token concentration, wallet movements, liquidity behavior and ecosystem due diligence, tools that make blockchain data easier to interpret can receive greater attention.
However, BMT’s latest session also demonstrates the risks associated with smaller and more momentum driven assets. A wide range can draw attention because it reflects strong participation, yet it can also increase slippage and reversal risk. Sustained demand would need to be supported by continued volume and credible interest in the project’s data infrastructure role. Without that follow through, fast moves may remain primarily liquidity driven.
JUP is currently trading at $0.2107, down -6.89% from its 24 hour opening price of $0.2263. The token traded as high as $0.2356 and as low as $0.2065, resulting in a 14.09% session range.
Jupiter is a major decentralized trading and liquidity aggregation protocol within the Solana ecosystem. Its performance is often influenced by Solana network activity, decentralized exchange volumes, memecoin liquidity, user growth and the broader appetite for DeFi tokens. Compared with DASH and BMT, JUP has a more direct relationship with the pace of on chain trading activity.
The current pullback suggests that sellers have gained control during the session, but the presence of active volume shows that the market remains engaged. For JUP, participants may focus on whether Solana DeFi activity remains resilient and whether demand returns as the token approaches its session low. Ecosystem growth can support long term relevance, but token prices can still experience sharp short term moves when broader risk appetite weakens.
The larger message from DASH, BMT and JUP is that crypto volatility remains sector specific. DASH reflects the payment coin segment, BMT reflects blockchain analytics infrastructure, and JUP reflects Solana DeFi. These are distinct exposures with different catalysts, liquidity profiles and risk characteristics.
Market participants should focus on trading volume, session range, liquidity depth and broader sector conditions rather than reacting only to headline percentage moves. Sharp declines can increase attention, but they can also amplify emotional trading and execution risk. Independent research, clear risk limits and an understanding of each project’s role remain essential in volatile markets.
#DASH #BMT #JUP #CryptoMarket #DeFi
$DASH
{spot}(DASHUSDT)
$BMT
{spot}(BMTUSDT)
$JUP
{spot}(JUPUSDT)
DASH, BMT and JUP: Volatility Rises as Traders Reassess Key Crypto Narratives
The latest Binance spot market data shows a risk sensitive session for DASH, BMT and JUP. Each token is trading below its 24 hour opening price, but the market context behind each move is different. DASH is tied to the digital payments narrative, BMT represents blockchain data visualization infrastructure, and JUP remains closely connected to Solana DeFi activity.
The common signal is elevated volatility. Price movement alone does not confirm a sustained trend, but it does show that traders are actively repricing these assets as liquidity, sentiment and sector rotation shift across the crypto market.
DASH is currently trading at $32.19, compared with a 24 hour opening price of $35.81, a change of -10.11%. It reached a high of $35.97 and a low of $30.72, creating a 17.09% trading range.
DASH is one of the longer established crypto assets in the payments segment. Its market behavior can be influenced by broader demand for digital payment tokens, privacy related discussion, liquidity conditions and speculative interest in legacy altcoins. The move below the session open shows that sellers have been more active during this window, but the range also confirms that there is meaningful two way participation.
For DASH, the key market question is whether trading activity can stabilize after this decline. A market that holds its lower range with healthy liquidity may indicate that participants are absorbing supply. In contrast, continuing weakness accompanied by fading liquidity would keep volatility risk elevated. Traders following DASH should also monitor broader altcoin sentiment because legacy payment assets often react sharply when market appetite shifts between Bitcoin, large cap altcoins and higher beta sectors.
BMT, the token associated with Bubblemaps, is trading at $0.02013, down -11.09% from its 24 hour open of $0.02264. The session high was $0.02300, while the low reached $0.01899. Its 21.12% range is the widest among the three assets in percentage terms, highlighting a highly active market environment.
Bubblemaps operates in a different category from most consumer facing crypto projects. Its focus on visualizing blockchain wallet relationships and token distribution gives it exposure to the on chain transparency and research narrative. When market participants become more focused on token concentration, wallet movements, liquidity behavior and ecosystem due diligence, tools that make blockchain data easier to interpret can receive greater attention.
However, BMT’s latest session also demonstrates the risks associated with smaller and more momentum driven assets. A wide range can draw attention because it reflects strong participation, yet it can also increase slippage and reversal risk. Sustained demand would need to be supported by continued volume and credible interest in the project’s data infrastructure role. Without that follow through, fast moves may remain primarily liquidity driven.
JUP is currently trading at $0.2107, down -6.89% from its 24 hour opening price of $0.2263. The token traded as high as $0.2356 and as low as $0.2065, resulting in a 14.09% session range.
Jupiter is a major decentralized trading and liquidity aggregation protocol within the Solana ecosystem. Its performance is often influenced by Solana network activity, decentralized exchange volumes, memecoin liquidity, user growth and the broader appetite for DeFi tokens. Compared with DASH and BMT, JUP has a more direct relationship with the pace of on chain trading activity.
The current pullback suggests that sellers have gained control during the session, but the presence of active volume shows that the market remains engaged. For JUP, participants may focus on whether Solana DeFi activity remains resilient and whether demand returns as the token approaches its session low. Ecosystem growth can support long term relevance, but token prices can still experience sharp short term moves when broader risk appetite weakens.
The larger message from DASH, BMT and JUP is that crypto volatility remains sector specific. DASH reflects the payment coin segment, BMT reflects blockchain analytics infrastructure, and JUP reflects Solana DeFi. These are distinct exposures with different catalysts, liquidity profiles and risk characteristics.
Market participants should focus on trading volume, session range, liquidity depth and broader sector conditions rather than reacting only to headline percentage moves. Sharp declines can increase attention, but they can also amplify emotional trading and execution risk. Independent research, clear risk limits and an understanding of each project’s role remain essential in volatile markets.
#DASH #BMT #JUP #CryptoMarket #DeFi
$DASH
$BMT
$JUP
The common signal is elevated volatility. Price movement alone does not confirm a sustained trend, but it does show that traders are actively repricing these assets as liquidity, sentiment and sector rotation shift across the crypto market.
DASH is currently trading at $32.19, compared with a 24 hour opening price of $35.81, a change of -10.11%. It reached a high of $35.97 and a low of $30.72, creating a 17.09% trading range.
DASH is one of the longer established crypto assets in the payments segment. Its market behavior can be influenced by broader demand for digital payment tokens, privacy related discussion, liquidity conditions and speculative interest in legacy altcoins. The move below the session open shows that sellers have been more active during this window, but the range also confirms that there is meaningful two way participation.
For DASH, the key market question is whether trading activity can stabilize after this decline. A market that holds its lower range with healthy liquidity may indicate that participants are absorbing supply. In contrast, continuing weakness accompanied by fading liquidity would keep volatility risk elevated. Traders following DASH should also monitor broader altcoin sentiment because legacy payment assets often react sharply when market appetite shifts between Bitcoin, large cap altcoins and higher beta sectors.
BMT, the token associated with Bubblemaps, is trading at $0.02013, down -11.09% from its 24 hour open of $0.02264. The session high was $0.02300, while the low reached $0.01899. Its 21.12% range is the widest among the three assets in percentage terms, highlighting a highly active market environment.
Bubblemaps operates in a different category from most consumer facing crypto projects. Its focus on visualizing blockchain wallet relationships and token distribution gives it exposure to the on chain transparency and research narrative. When market participants become more focused on token concentration, wallet movements, liquidity behavior and ecosystem due diligence, tools that make blockchain data easier to interpret can receive greater attention.
However, BMT’s latest session also demonstrates the risks associated with smaller and more momentum driven assets. A wide range can draw attention because it reflects strong participation, yet it can also increase slippage and reversal risk. Sustained demand would need to be supported by continued volume and credible interest in the project’s data infrastructure role. Without that follow through, fast moves may remain primarily liquidity driven.
JUP is currently trading at $0.2107, down -6.89% from its 24 hour opening price of $0.2263. The token traded as high as $0.2356 and as low as $0.2065, resulting in a 14.09% session range.
Jupiter is a major decentralized trading and liquidity aggregation protocol within the Solana ecosystem. Its performance is often influenced by Solana network activity, decentralized exchange volumes, memecoin liquidity, user growth and the broader appetite for DeFi tokens. Compared with DASH and BMT, JUP has a more direct relationship with the pace of on chain trading activity.
The current pullback suggests that sellers have gained control during the session, but the presence of active volume shows that the market remains engaged. For JUP, participants may focus on whether Solana DeFi activity remains resilient and whether demand returns as the token approaches its session low. Ecosystem growth can support long term relevance, but token prices can still experience sharp short term moves when broader risk appetite weakens.
The larger message from DASH, BMT and JUP is that crypto volatility remains sector specific. DASH reflects the payment coin segment, BMT reflects blockchain analytics infrastructure, and JUP reflects Solana DeFi. These are distinct exposures with different catalysts, liquidity profiles and risk characteristics.
Market participants should focus on trading volume, session range, liquidity depth and broader sector conditions rather than reacting only to headline percentage moves. Sharp declines can increase attention, but they can also amplify emotional trading and execution risk. Independent research, clear risk limits and an understanding of each project’s role remain essential in volatile markets.
#DASH #BMT #JUP #CryptoMarket #DeFi
$DASH
$BMT
$JUP
5


·
--
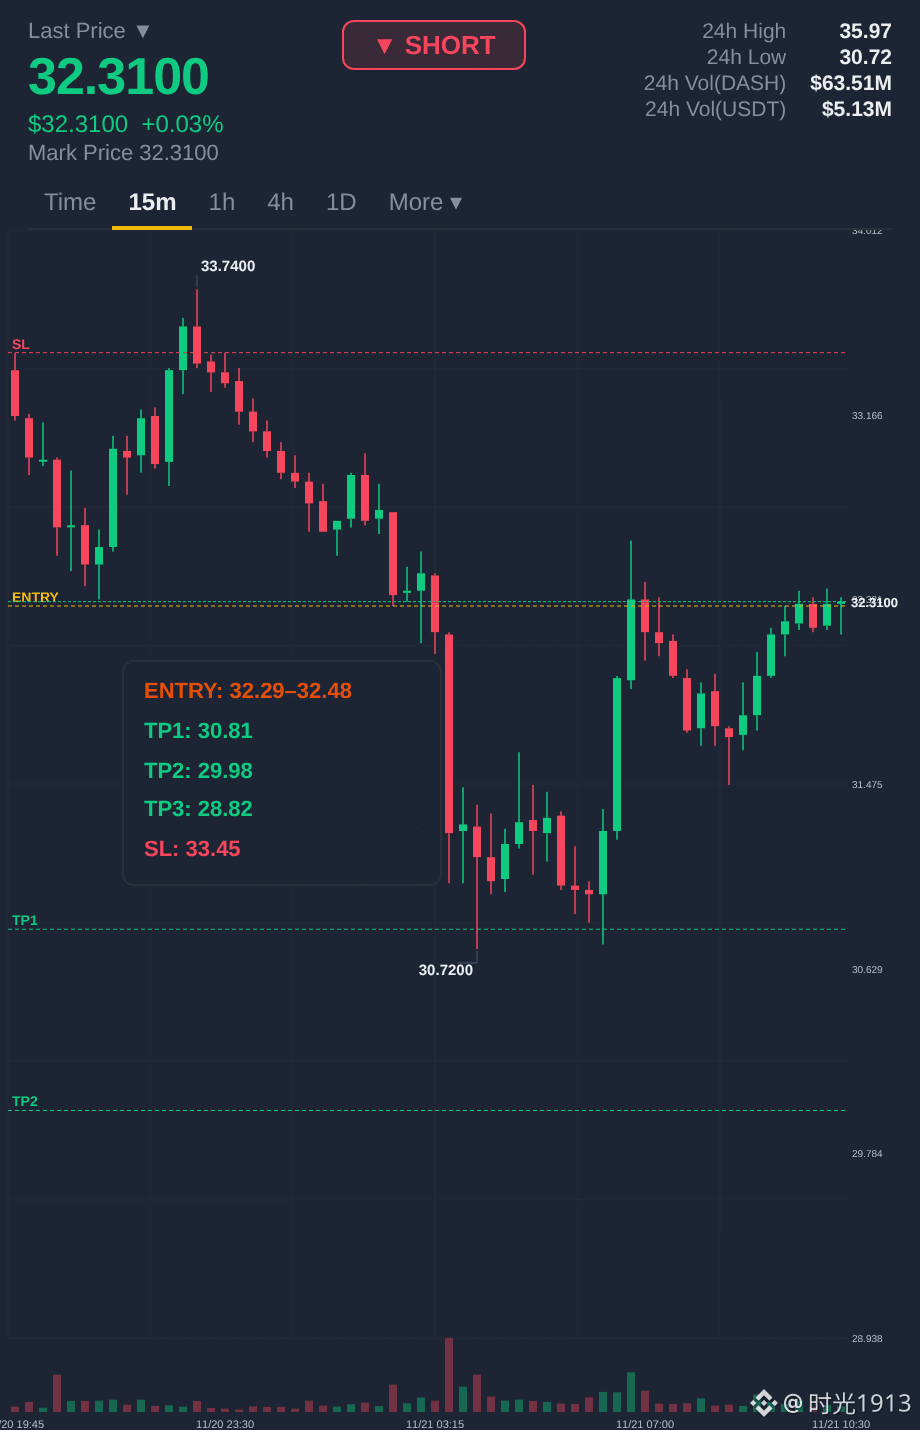
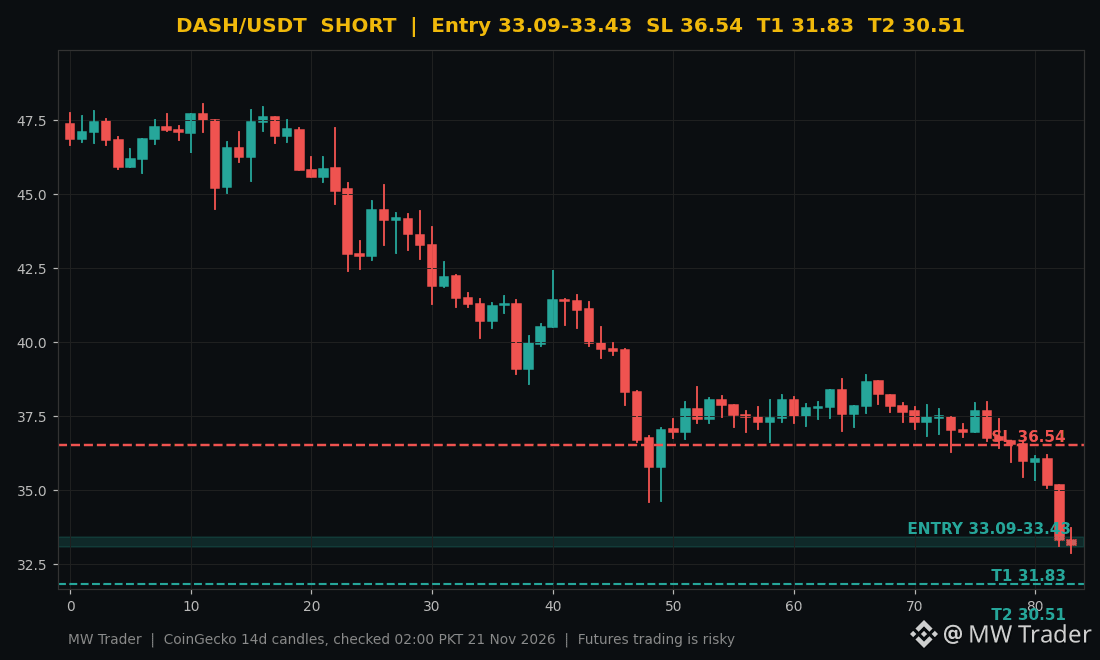
$DASH #DASH 📉 Dash is down 10.46 percent today and I am shorting the bounce.
Direction: SHORT 🔴
Entry zone: 33.09 to 33.43
Stop loss: 36.54
Target 1: 31.83
Target 2: 30.51
Dash is trading near $33.16 after losing 10.46 percent in 24 hours, according to CoinGecko, and the live price sits right inside my entry zone of 33.09 to 33.43. The coin fell from a 24 hour high of $36.64 to a low of $32.86 while Bitcoin broke below $60,000, and older coins like Dash tend to follow Bitcoin lower with little resistance in a risk off market. My plan is short the zone, stop above $36.54, take the first profit at $31.83, with $30.51 as the second target. 📉
Would you short DASH here, or wait for a bounce back toward $36.54 first? 🤔
Futures trading is risky, trade small, manage risk, do your own research. ⚠️
Follow for more trades.
#Dash #Crypto #FuturesTrading #TradingSignals
$DASH #DASH 📉 Dash is down 10.46 percent today and I am shorting the bounce.
Direction: SHORT 🔴
Entry zone: 33.09 to 33.43
Stop loss: 36.54
Target 1: 31.83
Target 2: 30.51
Dash is trading near $33.16 after losing 10.46 percent in 24 hours, according to CoinGecko, and the live price sits right inside my entry zone of 33.09 to 33.43. The coin fell from a 24 hour high of $36.64 to a low of $32.86 while Bitcoin broke below $60,000, and older coins like Dash tend to follow Bitcoin lower with little resistance in a risk off market. My plan is short the zone, stop above $36.54, take the first profit at $31.83, with $30.51 as the second target. 📉
Would you short DASH here, or wait for a bounce back toward $36.54 first? 🤔
Futures trading is risky, trade small, manage risk, do your own research. ⚠️
Follow for more trades.
#Dash #Crypto #FuturesTrading #TradingSignals
Direction: SHORT 🔴
Entry zone: 33.09 to 33.43
Stop loss: 36.54
Target 1: 31.83
Target 2: 30.51
Dash is trading near $33.16 after losing 10.46 percent in 24 hours, according to CoinGecko, and the live price sits right inside my entry zone of 33.09 to 33.43. The coin fell from a 24 hour high of $36.64 to a low of $32.86 while Bitcoin broke below $60,000, and older coins like Dash tend to follow Bitcoin lower with little resistance in a risk off market. My plan is short the zone, stop above $36.54, take the first profit at $31.83, with $30.51 as the second target. 📉
Would you short DASH here, or wait for a bounce back toward $36.54 first? 🤔
Futures trading is risky, trade small, manage risk, do your own research. ⚠️
Follow for more trades.
#Dash #Crypto #FuturesTrading #TradingSignals
10
DASH DROPS OVER 10%: SELLERS PRESS THE ADVANTAGE AS PRICE SITS RIGHT AT THE 24H LOW 📉🔥🚨
$DASH | DASH/USDT
💰 Price: 32.41
📉 24H Change: -10.12%
📊 24H High: 36.71
📉 24H Low: 32.35
💵 24H Volume (USDT): 3.71M
🪙 24H Volume (DASH): 108,040.11
⚠️ Market Breakdown (1H Timeframe):
Dash has been sliding steadily from the 37.47 area, with every bounce failing to build lasting momentum 🧨
🔻 A clear pattern of lower highs and lower lows has defined the trend for hours
🔻 A brief sideways phase near 35 – 35.50 gave way to another leg down
🔻 One large bearish candle near 34.30 accelerated the drop, and the latest red candle is closing right at the 24H low near 32.35 🧲
📉 Moving Averages Tell the Story:
📌 MA(7): 33.01
📌 MA(25): 35.02
📌 MA(99): 36.96
❌ Price is trading below all three major MAs
❌ All of them are sloping downward
❌ The MA(7) is falling steeply and has capped every recovery attempt 🐻
📊 Volume Insight:
🔴 Volume spiked heavily on the breakdown candle
💥 This points to aggressive selling and likely forced liquidations
🔴 Volume has faded on the latest candles, but the bounce attempt was weak and failed to hold
⚠️ Expect volatility to stay elevated
🧠 What This Means:
This move wasn’t random ❌
A steady downtrend followed by a high-volume breakdown usually signals trend continuation, with a leverage flush adding pressure.
🔹 Short-term trend: Bearish
🔹 Momentum: Weak, no confirmed reversal yet
🔹 Market sentiment: Fearful 😨
🎯 Key Levels to Watch:
🟢 Support: 32.09 – 32.35 zone
🔴 Resistance: 33.01 – 35.02 zone
📌 A reclaim of 33.01 (MA7) would be the first sign of relief
📌 A clean break below 32.35 could open the door to deeper downside ⬇️
💡 Final Take:
DASH is in a high-risk, high-volatility phase where patience beats prediction. Wait for confirmation, keep your position size under control, and always protect your capital with a stop-loss. 🧘🛡️
Discipline will always outlast impulse 💎
#Dash #DASH #DASHUSDT #CryptoAnalysis #CryptoTrading
$DASH
{spot}(DASHUSDT)
DASH DROPS OVER 10%: SELLERS PRESS THE ADVANTAGE AS PRICE SITS RIGHT AT THE 24H LOW 📉🔥
🚨
$DASH | DASH/USDT
💰 Price: 32.41
📉 24H Change: -10.12%
📊 24H High: 36.71
📉 24H Low: 32.35
💵 24H Volume (USDT): 3.71M
🪙 24H Volume (DASH): 108,040.11
⚠️ Market Breakdown (1H Timeframe):
Dash has been sliding steadily from the 37.47 area, with every bounce failing to build lasting momentum 🧨
🔻 A clear pattern of lower highs and lower lows has defined the trend for hours
🔻 A brief sideways phase near 35 – 35.50 gave way to another leg down
🔻 One large bearish candle near 34.30 accelerated the drop, and the latest red candle is closing right at the 24H low near 32.35 🧲
📉 Moving Averages Tell the Story:
📌 MA(7): 33.01
📌 MA(25): 35.02
📌 MA(99): 36.96
❌ Price is trading below all three major MAs
❌ All of them are sloping downward
❌ The MA(7) is falling steeply and has capped every recovery attempt 🐻
📊 Volume Insight:
🔴 Volume spiked heavily on the breakdown candle
💥 This points to aggressive selling and likely forced liquidations
🔴 Volume has faded on the latest candles, but the bounce attempt was weak and failed to hold
⚠️ Expect volatility to stay elevated
🧠 What This Means:
This move wasn’t random ❌
A steady downtrend followed by a high-volume breakdown usually signals trend continuation, with a leverage flush adding pressure.
🔹 Short-term trend: Bearish
🔹 Momentum: Weak, no confirmed reversal yet
🔹 Market sentiment: Fearful 😨
🎯 Key Levels to Watch:
🟢 Support: 32.09 – 32.35 zone
🔴 Resistance: 33.01 – 35.02 zone
📌 A reclaim of 33.01 (MA7) would be the first sign of relief
📌 A clean break below 32.35 could open the door to deeper downside ⬇️
💡 Final Take:
DASH is in a high-risk, high-volatility phase where patience beats prediction. Wait for confirmation, keep your position size under control, and always protect your capital with a stop-loss. 🧘🛡️
Discipline will always outlast impulse 💎
#Dash #DASH #DASHUSDT #CryptoAnalysis #CryptoTrading
$DASH
$DASH | DASH/USDT
💰 Price: 32.41
📉 24H Change: -10.12%
📊 24H High: 36.71
📉 24H Low: 32.35
💵 24H Volume (USDT): 3.71M
🪙 24H Volume (DASH): 108,040.11
⚠️ Market Breakdown (1H Timeframe):
Dash has been sliding steadily from the 37.47 area, with every bounce failing to build lasting momentum 🧨
🔻 A clear pattern of lower highs and lower lows has defined the trend for hours
🔻 A brief sideways phase near 35 – 35.50 gave way to another leg down
🔻 One large bearish candle near 34.30 accelerated the drop, and the latest red candle is closing right at the 24H low near 32.35 🧲
📉 Moving Averages Tell the Story:
📌 MA(7): 33.01
📌 MA(25): 35.02
📌 MA(99): 36.96
❌ Price is trading below all three major MAs
❌ All of them are sloping downward
❌ The MA(7) is falling steeply and has capped every recovery attempt 🐻
📊 Volume Insight:
🔴 Volume spiked heavily on the breakdown candle
💥 This points to aggressive selling and likely forced liquidations
🔴 Volume has faded on the latest candles, but the bounce attempt was weak and failed to hold
⚠️ Expect volatility to stay elevated
🧠 What This Means:
This move wasn’t random ❌
A steady downtrend followed by a high-volume breakdown usually signals trend continuation, with a leverage flush adding pressure.
🔹 Short-term trend: Bearish
🔹 Momentum: Weak, no confirmed reversal yet
🔹 Market sentiment: Fearful 😨
🎯 Key Levels to Watch:
🟢 Support: 32.09 – 32.35 zone
🔴 Resistance: 33.01 – 35.02 zone
📌 A reclaim of 33.01 (MA7) would be the first sign of relief
📌 A clean break below 32.35 could open the door to deeper downside ⬇️
💡 Final Take:
DASH is in a high-risk, high-volatility phase where patience beats prediction. Wait for confirmation, keep your position size under control, and always protect your capital with a stop-loss. 🧘🛡️
Discipline will always outlast impulse 💎
#Dash #DASH #DASHUSDT #CryptoAnalysis #CryptoTrading
$DASH
1
23


·
--
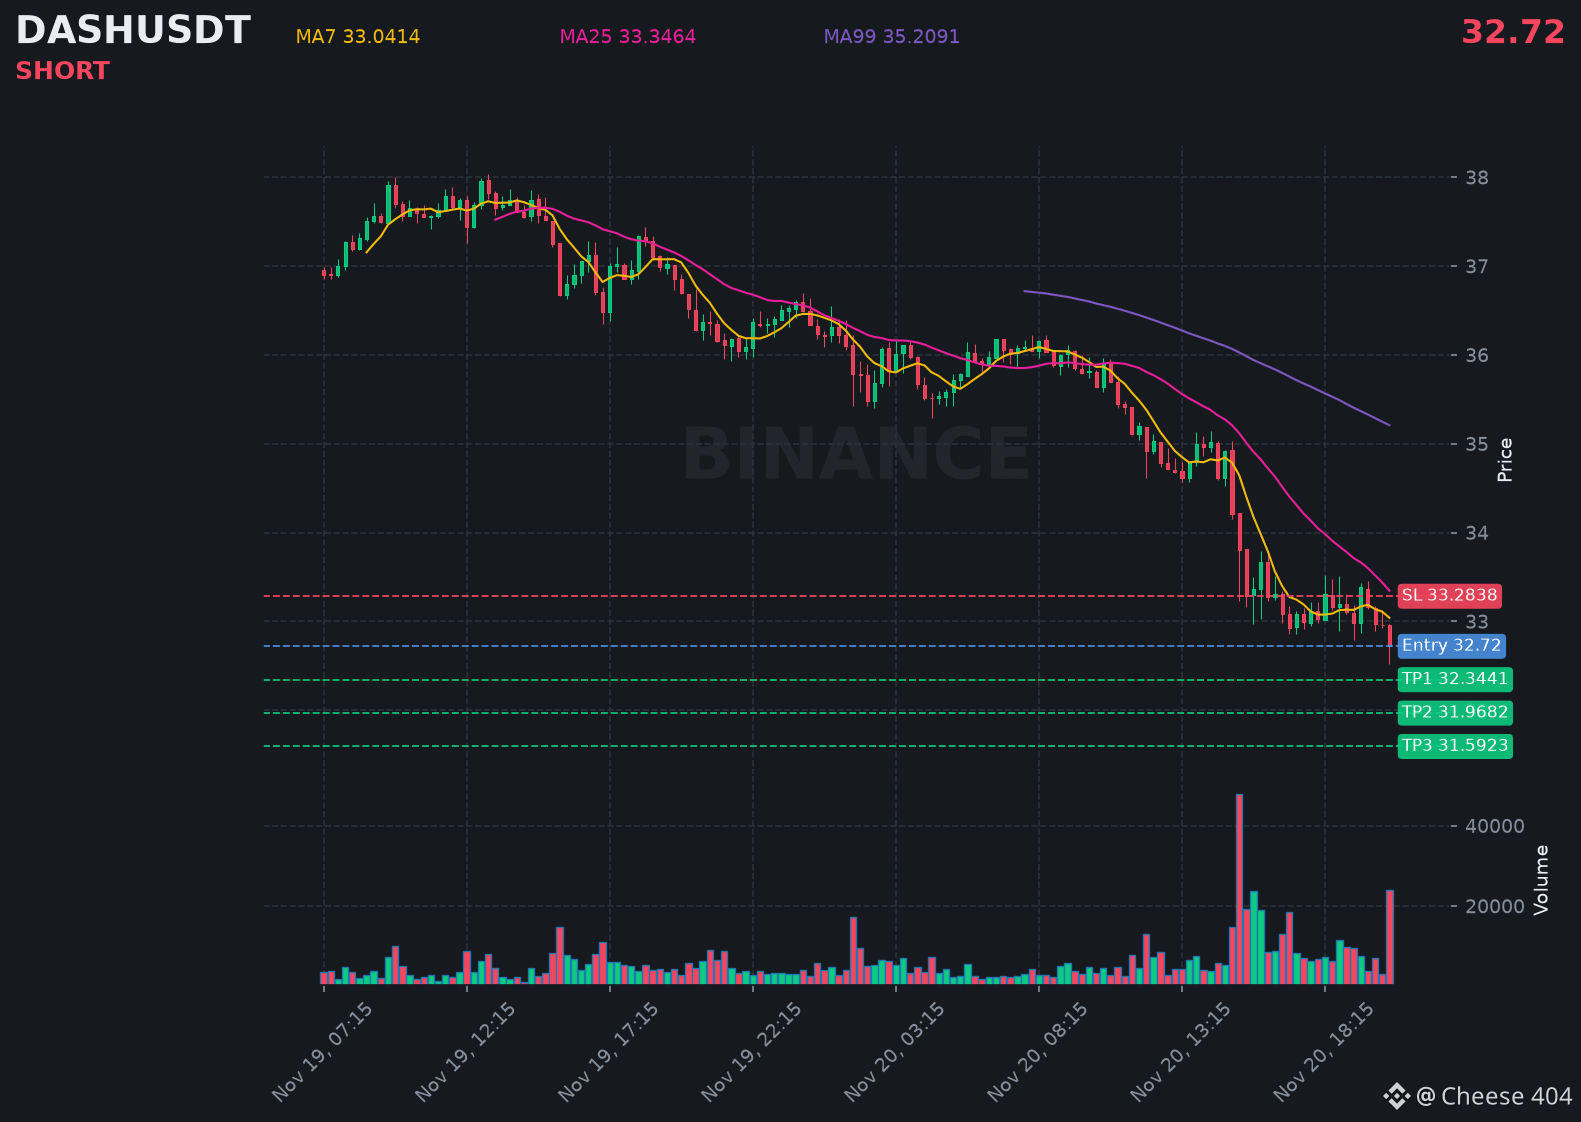
$DASH just printed a strong bearish candle, signaling more downside pressure building right now.
📍 @ 32.72 | Volume: 0.78M USD
RSI 34 | EMA20: 33.3056 USD
📈 Trade Plan:
📈 Entry: 32.6072 – 32.8328
🛑 Stop Loss: 33.2838
🎯 TP1: 32.3441
🎯 TP2: 31.9682
🎯 TP3: 31.5923
Waiting for confirmation, then riding the downtrend.
👉 $DASH 👈 Catch it
#DASH
$DASH just printed a strong bearish candle, signaling more downside pressure building right now.
📍 @ 32.72 | Volume: 0.78M USD
RSI 34 | EMA20: 33.3056 USD
📈 Trade Plan:
📈 Entry: 32.6072 – 32.8328
🛑 Stop Loss: 33.2838
🎯 TP1: 32.3441
🎯 TP2: 31.9682
🎯 TP3: 31.5923
Waiting for confirmation, then riding the downtrend.
👉 $DASH 👈 Catch it
#DASH
📍 @ 32.72 | Volume: 0.78M USD
RSI 34 | EMA20: 33.3056 USD
📈 Trade Plan:
📈 Entry: 32.6072 – 32.8328
🛑 Stop Loss: 33.2838
🎯 TP1: 32.3441
🎯 TP2: 31.9682
🎯 TP3: 31.5923
Waiting for confirmation, then riding the downtrend.
👉 $DASH 👈 Catch it
#DASH
155
·
--
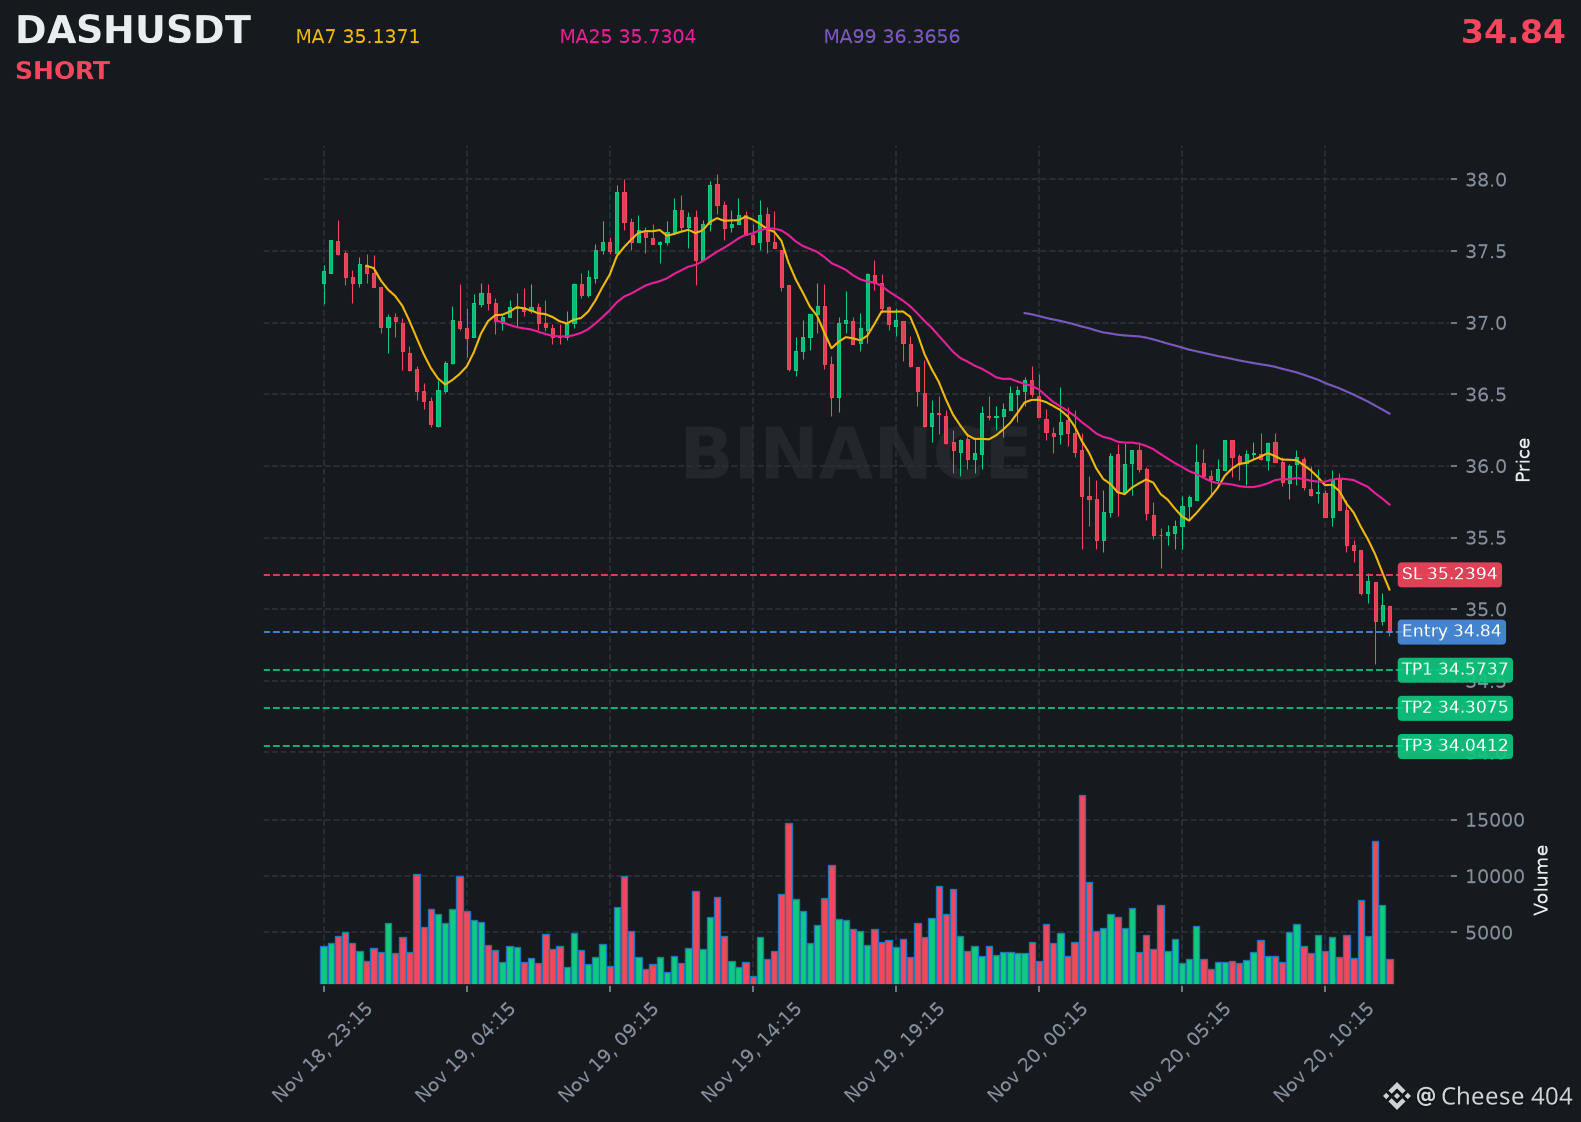
$DASH is struggling below resistance, hinting at another leg down in the coming hours.
📍 @ 34.84 | Volume: 0.09M USD
RSI 30 | EMA20: 35.4947 USD
📈 Trade Plan:
📈 Entry: 34.7601 – 34.9199
🛑 Stop Loss: 35.2394
🎯 TP1: 34.5737
🎯 TP2: 34.3075
🎯 TP3: 34.0412
Waiting for confirmation, then riding the downtrend.
👉 $DASH 👈 Catch it
#DASH
$DASH is struggling below resistance, hinting at another leg down in the coming hours.
📍 @ 34.84 | Volume: 0.09M USD
RSI 30 | EMA20: 35.4947 USD
📈 Trade Plan:
📈 Entry: 34.7601 – 34.9199
🛑 Stop Loss: 35.2394
🎯 TP1: 34.5737
🎯 TP2: 34.3075
🎯 TP3: 34.0412
Waiting for confirmation, then riding the downtrend.
👉 $DASH 👈 Catch it
#DASH
📍 @ 34.84 | Volume: 0.09M USD
RSI 30 | EMA20: 35.4947 USD
📈 Trade Plan:
📈 Entry: 34.7601 – 34.9199
🛑 Stop Loss: 35.2394
🎯 TP1: 34.5737
🎯 TP2: 34.3075
🎯 TP3: 34.0412
Waiting for confirmation, then riding the downtrend.
👉 $DASH 👈 Catch it
#DASH
158
DASH, EIGEN and SYRUP Market Analysis: Oversold Conditions Meet a Crucial Test of Demand
DASH, EIGEN and SYRUP are drawing attention for very different reasons, yet their current market structures share one important theme: all three assets are navigating heavy recent selling pressure while traders watch for evidence of stabilization.
DASH represents the payments focused crypto segment, EIGEN remains connected to Ethereum restaking infrastructure, and SYRUP reflects growing interest in decentralized credit and real world asset related DeFi. Their latest market data shows that short term moves are mixed, but the broader trend remains fragile. In this environment, confirmation through volume, capital flow and trend recovery matters far more than a single intraday candle.
DASH: Payment Token Faces Continued Downside Momentum
DASH is trading near $36.76, down 2.03% from its 24 hour opening price. During the current session, DASH reached a high of $38.09 and a low of $36.29, showing that sellers remain active near the upper end of the intraday range.
The broader performance remains under pressure. DASH is down 12.35% over 7 days and 26.99% over 30 days. Its 6 period RSI stands at 29.94, placing the asset in oversold territory. This suggests that the recent decline has become stretched, but an oversold reading alone does not confirm that the trend has reversed.
The technical structure remains bearish. DASH trades below its 7 day moving average of $37.91, 25 day moving average of $44.76 and 99 day moving average of $49.49. The MACD remains bearish after a death cross 19 daily candles ago, while SuperTrend continues to indicate a downtrend.
DASH is currently 6.92% above its 7 day low of $34.38 and 14.17% below its 7 day high of $42.83. Daily volume is running at 0.85 times its 7 day average, while large order flow has shown a small net outflow. This points to cautious participation. For the DASH market structure to improve, traders will likely look for more sustained volume and evidence that the recent low area can hold during volatile sessions.
EIGEN: Restaking Narrative Faces Its Strongest Momentum Challenge
EIGEN is trading around $0.1253, down 1.42% from its 24 hour opening level. The token traded between $0.1240 and $0.1448 during the current session, highlighting sharp volatility as the market tested both sides of the range.
EIGEN has fallen 21.05% over 7 days and 47.24% over 30 days. The current price is only 1.70% above the 7 day low of $0.1232 and 50.02% below the 30 day high of $0.2507. This reflects a market that remains close to its recent downside range despite temporary intraday rebounds.
Its RSI is at 16.79, a deeply oversold reading. This means downside momentum has been unusually strong, and volatility can remain elevated when price trades near fresh range lows. The MACD is still bearish following a death cross 49 daily candles ago. EIGEN also trades below its 7 day, 25 day and 99 day moving averages, while SuperTrend remains pointed lower.
One important detail is volume. EIGEN volume is 1.59 times its 7 day average, showing that participation has increased during the latest session. However, large order flow remains negative, with a net outflow of 547,857.92 EIGEN. This combination indicates active trading, but it does not yet demonstrate that buyers have regained control.
For EIGEN, the key market signal is whether stronger volume can begin supporting price stability rather than accelerating volatility. The underlying restaking narrative remains important to the Ethereum ecosystem, but price action currently shows that traders are demanding clearer evidence of renewed demand.
SYRUP: Positive Capital Flow Brings a More Constructive Short Term Signal
SYRUP is trading near $0.0982, up 1.97% from its 24 hour opening level. It traded between $0.0928 and $0.1082 during the session, producing a wide range that reflects active interest near recent lows.
Despite the positive intraday move, SYRUP remains down 25.55% over 7 days and 49.72% over 30 days. Its price is only 5.82% above the 7 day and 30 day low of $0.0928, while it remains 53.19% below the 30 day high of $0.2098. This means SYRUP is still operating inside a weak broader structure.
The RSI is 25.20, keeping SYRUP in oversold territory. The MACD remains bearish after a death cross 42 daily candles ago, and price remains below its 7 day, 25 day and 99 day moving averages. SuperTrend also continues to indicate a downtrend.
However, SYRUP stands apart because of its latest capital flow. Large order activity shows a net inflow of 571,168.4 SYRUP, with a net inflow rate of 8.41%. Daily volume is also 1.10 times the 7 day average. This suggests that buying interest has appeared during the latest session, although it is too early to treat one period of positive flow as a confirmed reversal.
SYRUP’s next phase will depend on whether this inflow continues and whether price can maintain stability after its recent rebound. If participation fades quickly, the broader bearish trend may remain dominant. If demand remains consistent, traders may begin to reassess whether downside momentum is losing strength.
Market Perspective
DASH, EIGEN and SYRUP are all technically oversold, but each asset is showing a different market dynamic. DASH remains pressured by weak momentum and modest outflows. EIGEN has elevated volume but still faces meaningful selling pressure. SYRUP has shown the strongest short term capital flow signal, yet its broader trend remains bearish.
The current market favors disciplined analysis over emotional reactions. Oversold readings can create sharp rebounds, but they can also persist while a downtrend continues. Monitoring volume, capital flow, moving average recovery and the ability to hold above recent lows can provide a clearer picture of whether sentiment is truly shifting.
#Dash #EigenLayer #SYRUP #CryptoMarket #AltcoinAnalysis
$DASH
{spot}(DASHUSDT)
$EIGEN
{spot}(EIGENUSDT)
$SYRUP
{spot}(SYRUPUSDT)
DASH, EIGEN and SYRUP Market Analysis: Oversold Conditions Meet a Crucial Test of Demand
DASH, EIGEN and SYRUP are drawing attention for very different reasons, yet their current market structures share one important theme: all three assets are navigating heavy recent selling pressure while traders watch for evidence of stabilization.
DASH represents the payments focused crypto segment, EIGEN remains connected to Ethereum restaking infrastructure, and SYRUP reflects growing interest in decentralized credit and real world asset related DeFi. Their latest market data shows that short term moves are mixed, but the broader trend remains fragile. In this environment, confirmation through volume, capital flow and trend recovery matters far more than a single intraday candle.
DASH: Payment Token Faces Continued Downside Momentum
DASH is trading near $36.76, down 2.03% from its 24 hour opening price. During the current session, DASH reached a high of $38.09 and a low of $36.29, showing that sellers remain active near the upper end of the intraday range.
The broader performance remains under pressure. DASH is down 12.35% over 7 days and 26.99% over 30 days. Its 6 period RSI stands at 29.94, placing the asset in oversold territory. This suggests that the recent decline has become stretched, but an oversold reading alone does not confirm that the trend has reversed.
The technical structure remains bearish. DASH trades below its 7 day moving average of $37.91, 25 day moving average of $44.76 and 99 day moving average of $49.49. The MACD remains bearish after a death cross 19 daily candles ago, while SuperTrend continues to indicate a downtrend.
DASH is currently 6.92% above its 7 day low of $34.38 and 14.17% below its 7 day high of $42.83. Daily volume is running at 0.85 times its 7 day average, while large order flow has shown a small net outflow. This points to cautious participation. For the DASH market structure to improve, traders will likely look for more sustained volume and evidence that the recent low area can hold during volatile sessions.
EIGEN: Restaking Narrative Faces Its Strongest Momentum Challenge
EIGEN is trading around $0.1253, down 1.42% from its 24 hour opening level. The token traded between $0.1240 and $0.1448 during the current session, highlighting sharp volatility as the market tested both sides of the range.
EIGEN has fallen 21.05% over 7 days and 47.24% over 30 days. The current price is only 1.70% above the 7 day low of $0.1232 and 50.02% below the 30 day high of $0.2507. This reflects a market that remains close to its recent downside range despite temporary intraday rebounds.
Its RSI is at 16.79, a deeply oversold reading. This means downside momentum has been unusually strong, and volatility can remain elevated when price trades near fresh range lows. The MACD is still bearish following a death cross 49 daily candles ago. EIGEN also trades below its 7 day, 25 day and 99 day moving averages, while SuperTrend remains pointed lower.
One important detail is volume. EIGEN volume is 1.59 times its 7 day average, showing that participation has increased during the latest session. However, large order flow remains negative, with a net outflow of 547,857.92 EIGEN. This combination indicates active trading, but it does not yet demonstrate that buyers have regained control.
For EIGEN, the key market signal is whether stronger volume can begin supporting price stability rather than accelerating volatility. The underlying restaking narrative remains important to the Ethereum ecosystem, but price action currently shows that traders are demanding clearer evidence of renewed demand.
SYRUP: Positive Capital Flow Brings a More Constructive Short Term Signal
SYRUP is trading near $0.0982, up 1.97% from its 24 hour opening level. It traded between $0.0928 and $0.1082 during the session, producing a wide range that reflects active interest near recent lows.
Despite the positive intraday move, SYRUP remains down 25.55% over 7 days and 49.72% over 30 days. Its price is only 5.82% above the 7 day and 30 day low of $0.0928, while it remains 53.19% below the 30 day high of $0.2098. This means SYRUP is still operating inside a weak broader structure.
The RSI is 25.20, keeping SYRUP in oversold territory. The MACD remains bearish after a death cross 42 daily candles ago, and price remains below its 7 day, 25 day and 99 day moving averages. SuperTrend also continues to indicate a downtrend.
However, SYRUP stands apart because of its latest capital flow. Large order activity shows a net inflow of 571,168.4 SYRUP, with a net inflow rate of 8.41%. Daily volume is also 1.10 times the 7 day average. This suggests that buying interest has appeared during the latest session, although it is too early to treat one period of positive flow as a confirmed reversal.
SYRUP’s next phase will depend on whether this inflow continues and whether price can maintain stability after its recent rebound. If participation fades quickly, the broader bearish trend may remain dominant. If demand remains consistent, traders may begin to reassess whether downside momentum is losing strength.
Market Perspective
DASH, EIGEN and SYRUP are all technically oversold, but each asset is showing a different market dynamic. DASH remains pressured by weak momentum and modest outflows. EIGEN has elevated volume but still faces meaningful selling pressure. SYRUP has shown the strongest short term capital flow signal, yet its broader trend remains bearish.
The current market favors disciplined analysis over emotional reactions. Oversold readings can create sharp rebounds, but they can also persist while a downtrend continues. Monitoring volume, capital flow, moving average recovery and the ability to hold above recent lows can provide a clearer picture of whether sentiment is truly shifting.
#Dash #EigenLayer #SYRUP #CryptoMarket #AltcoinAnalysis
$DASH
$EIGEN
$SYRUP
DASH represents the payments focused crypto segment, EIGEN remains connected to Ethereum restaking infrastructure, and SYRUP reflects growing interest in decentralized credit and real world asset related DeFi. Their latest market data shows that short term moves are mixed, but the broader trend remains fragile. In this environment, confirmation through volume, capital flow and trend recovery matters far more than a single intraday candle.
DASH: Payment Token Faces Continued Downside Momentum
DASH is trading near $36.76, down 2.03% from its 24 hour opening price. During the current session, DASH reached a high of $38.09 and a low of $36.29, showing that sellers remain active near the upper end of the intraday range.
The broader performance remains under pressure. DASH is down 12.35% over 7 days and 26.99% over 30 days. Its 6 period RSI stands at 29.94, placing the asset in oversold territory. This suggests that the recent decline has become stretched, but an oversold reading alone does not confirm that the trend has reversed.
The technical structure remains bearish. DASH trades below its 7 day moving average of $37.91, 25 day moving average of $44.76 and 99 day moving average of $49.49. The MACD remains bearish after a death cross 19 daily candles ago, while SuperTrend continues to indicate a downtrend.
DASH is currently 6.92% above its 7 day low of $34.38 and 14.17% below its 7 day high of $42.83. Daily volume is running at 0.85 times its 7 day average, while large order flow has shown a small net outflow. This points to cautious participation. For the DASH market structure to improve, traders will likely look for more sustained volume and evidence that the recent low area can hold during volatile sessions.
EIGEN: Restaking Narrative Faces Its Strongest Momentum Challenge
EIGEN is trading around $0.1253, down 1.42% from its 24 hour opening level. The token traded between $0.1240 and $0.1448 during the current session, highlighting sharp volatility as the market tested both sides of the range.
EIGEN has fallen 21.05% over 7 days and 47.24% over 30 days. The current price is only 1.70% above the 7 day low of $0.1232 and 50.02% below the 30 day high of $0.2507. This reflects a market that remains close to its recent downside range despite temporary intraday rebounds.
Its RSI is at 16.79, a deeply oversold reading. This means downside momentum has been unusually strong, and volatility can remain elevated when price trades near fresh range lows. The MACD is still bearish following a death cross 49 daily candles ago. EIGEN also trades below its 7 day, 25 day and 99 day moving averages, while SuperTrend remains pointed lower.
One important detail is volume. EIGEN volume is 1.59 times its 7 day average, showing that participation has increased during the latest session. However, large order flow remains negative, with a net outflow of 547,857.92 EIGEN. This combination indicates active trading, but it does not yet demonstrate that buyers have regained control.
For EIGEN, the key market signal is whether stronger volume can begin supporting price stability rather than accelerating volatility. The underlying restaking narrative remains important to the Ethereum ecosystem, but price action currently shows that traders are demanding clearer evidence of renewed demand.
SYRUP: Positive Capital Flow Brings a More Constructive Short Term Signal
SYRUP is trading near $0.0982, up 1.97% from its 24 hour opening level. It traded between $0.0928 and $0.1082 during the session, producing a wide range that reflects active interest near recent lows.
Despite the positive intraday move, SYRUP remains down 25.55% over 7 days and 49.72% over 30 days. Its price is only 5.82% above the 7 day and 30 day low of $0.0928, while it remains 53.19% below the 30 day high of $0.2098. This means SYRUP is still operating inside a weak broader structure.
The RSI is 25.20, keeping SYRUP in oversold territory. The MACD remains bearish after a death cross 42 daily candles ago, and price remains below its 7 day, 25 day and 99 day moving averages. SuperTrend also continues to indicate a downtrend.
However, SYRUP stands apart because of its latest capital flow. Large order activity shows a net inflow of 571,168.4 SYRUP, with a net inflow rate of 8.41%. Daily volume is also 1.10 times the 7 day average. This suggests that buying interest has appeared during the latest session, although it is too early to treat one period of positive flow as a confirmed reversal.
SYRUP’s next phase will depend on whether this inflow continues and whether price can maintain stability after its recent rebound. If participation fades quickly, the broader bearish trend may remain dominant. If demand remains consistent, traders may begin to reassess whether downside momentum is losing strength.
Market Perspective
DASH, EIGEN and SYRUP are all technically oversold, but each asset is showing a different market dynamic. DASH remains pressured by weak momentum and modest outflows. EIGEN has elevated volume but still faces meaningful selling pressure. SYRUP has shown the strongest short term capital flow signal, yet its broader trend remains bearish.
The current market favors disciplined analysis over emotional reactions. Oversold readings can create sharp rebounds, but they can also persist while a downtrend continues. Monitoring volume, capital flow, moving average recovery and the ability to hold above recent lows can provide a clearer picture of whether sentiment is truly shifting.
#Dash #EigenLayer #SYRUP #CryptoMarket #AltcoinAnalysis
$DASH
$EIGEN
$SYRUP
1
35

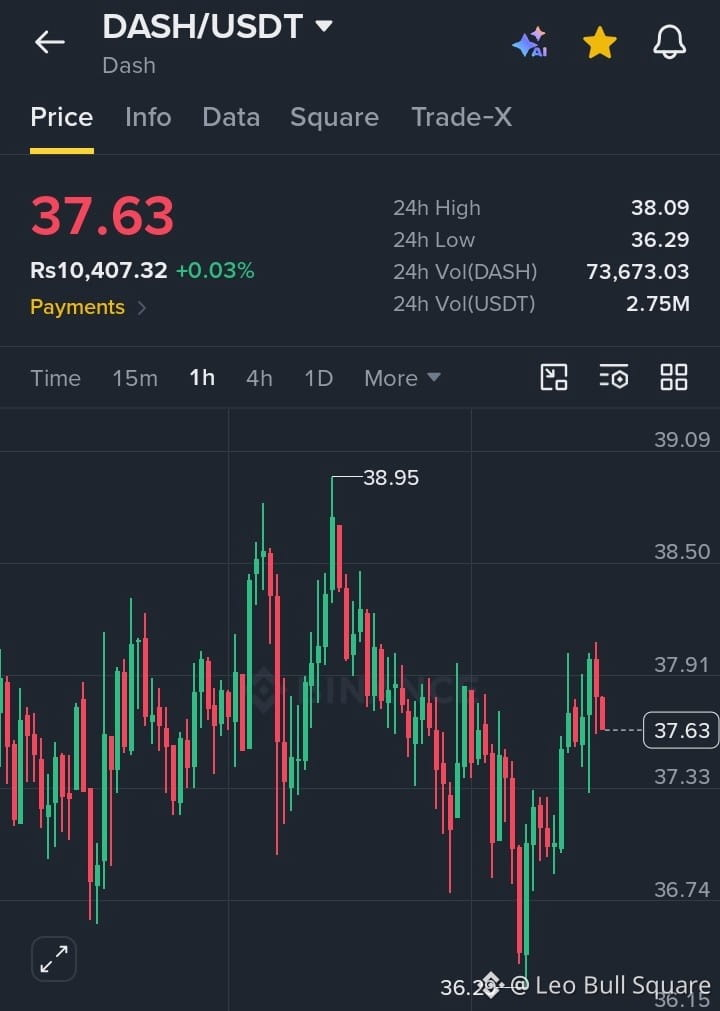
**🔥 $DASH /USDT – Bulls Fight Back After Sweeping $36.29 Support! 🚀** DASH is showing signs of recovery after a sharp liquidity sweep toward $36.29, with buyers pushing price back to $37.63 on the 1H chart. However, the $37.90–$38.09 resistance zone remains a critical hurdle. A confirmed BOS above $37.90 could trigger bullish continuation toward $38.50 and $38.95, while rejection may send price back toward $37.33 and $36.74 support. **Trade Setup:** Watch $37.50–$37.65 for a potential pullback entry after bullish confirmation, with SL below $37.30 and targets at $37.90, $38.50 and $38.95. Volume stands at $2.75M USDT, so watch for confirmation before entering. Don't chase the breakout—trade the structure! Follow for more technical setups.
#DASH
{spot}(DASHUSDT)
**🔥 $DASH /USDT – Bulls Fight Back After Sweeping $36.29 Support! 🚀** DASH is showing signs of recovery after a sharp liquidity sweep toward $36.29, with buyers pushing price back to $37.63 on the 1H chart. However, the $37.90–$38.09 resistance zone remains a critical hurdle. A confirmed BOS above $37.90 could trigger bullish continuation toward $38.50 and $38.95, while rejection may send price back toward $37.33 and $36.74 support. **Trade Setup:** Watch $37.50–$37.65 for a potential pullback entry after bullish confirmation, with SL below $37.30 and targets at $37.90, $38.50 and $38.95. Volume stands at $2.75M USDT, so watch for confirmation before entering. Don't chase the breakout—trade the structure! Follow for more technical setups.
#DASH
#DASH

follow for more
From Leo Bull Square
Gerich71:
thanks
1
12
109
·
--
$DASH #DASH is down 4.07 percent at $36.49, breaking down below its whole 24 hour range. 📉
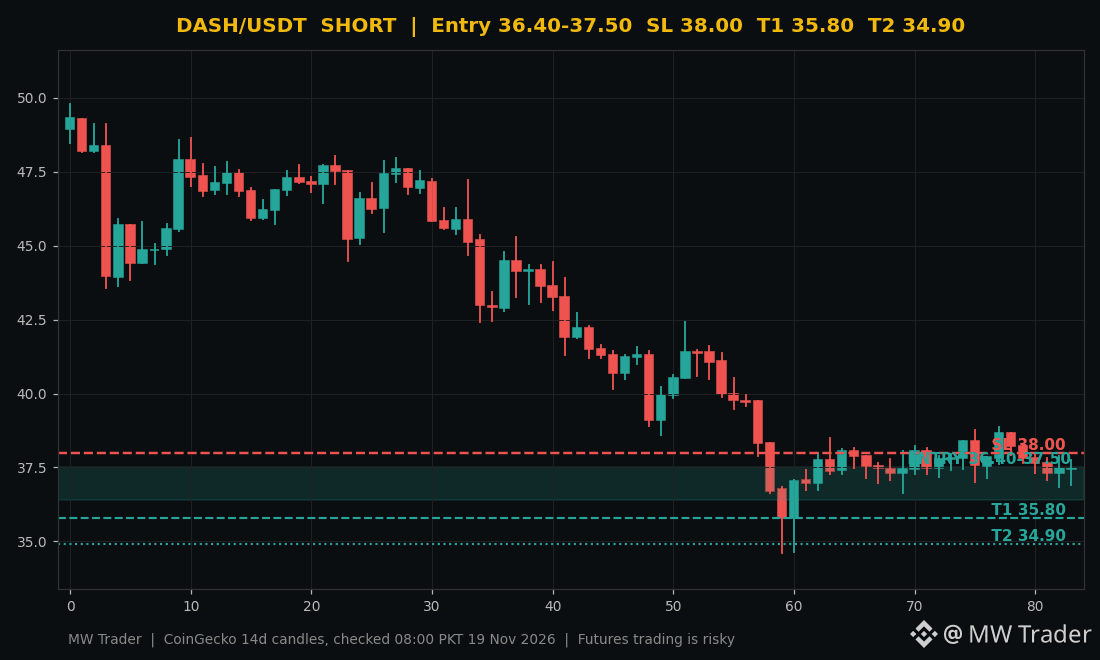
Dash ran from a 24 hour high of $38.39 to a low of $36.83, and the price now sits at $36.49, below its whole 24 hour range, while the last candle closed at $37.49, right inside the entry zone. 🔴 My plan is a short on the entry zone of $36.4 to $37.5, with a stop loss at $38.0, target 1 at $35.8 and target 2 at $34.9. The $36.83 low is already lost, and a clean hold under $36.4 opens the way to $35.8. I stay short only while price holds under $37.5. ⚠️
Does DASH hold under $36.4 and fall to $35.8, or reclaim $37.5 and squeeze the shorts? 🤔
Futures trading is risky, trade small, manage risk, do your own research.
Follow for more trades.
#Dash #Crypto #FuturesTrading #TradingSignals
$DASH #DASH is down 4.07 percent at $36.49, breaking down below its whole 24 hour range. 📉
Dash ran from a 24 hour high of $38.39 to a low of $36.83, and the price now sits at $36.49, below its whole 24 hour range, while the last candle closed at $37.49, right inside the entry zone. 🔴 My plan is a short on the entry zone of $36.4 to $37.5, with a stop loss at $38.0, target 1 at $35.8 and target 2 at $34.9. The $36.83 low is already lost, and a clean hold under $36.4 opens the way to $35.8. I stay short only while price holds under $37.5. ⚠️
Does DASH hold under $36.4 and fall to $35.8, or reclaim $37.5 and squeeze the shorts? 🤔
Futures trading is risky, trade small, manage risk, do your own research.
Follow for more trades.
#Dash #Crypto #FuturesTrading #TradingSignals
Dash ran from a 24 hour high of $38.39 to a low of $36.83, and the price now sits at $36.49, below its whole 24 hour range, while the last candle closed at $37.49, right inside the entry zone. 🔴 My plan is a short on the entry zone of $36.4 to $37.5, with a stop loss at $38.0, target 1 at $35.8 and target 2 at $34.9. The $36.83 low is already lost, and a clean hold under $36.4 opens the way to $35.8. I stay short only while price holds under $37.5. ⚠️
Does DASH hold under $36.4 and fall to $35.8, or reclaim $37.5 and squeeze the shorts? 🤔
Futures trading is risky, trade small, manage risk, do your own research.
Follow for more trades.
#Dash #Crypto #FuturesTrading #TradingSignals
11

·
--
Bearish
$DASH is showing strength from support, with buyers gradually taking control and momentum building for a potential continuation move.
Entry: 30$
TP1: 45$
TP2: 60$
TP3: 90$
SL: 20$
Buy and Trade $DASH
#DASH
{future}(DASHUSDT)
$DASH is showing strength from support, with buyers gradually taking control and momentum building for a potential continuation move.
Entry: 30$
TP1: 45$
TP2: 60$
TP3: 90$
SL: 20$
Buy and Trade $DASH
#DASH
Entry: 30$
TP1: 45$
TP2: 60$
TP3: 90$
SL: 20$
Buy and Trade $DASH
#DASH
1
46

$DASH: The Loud Auction Room: Why the Fastest Bidder Usually Overpays
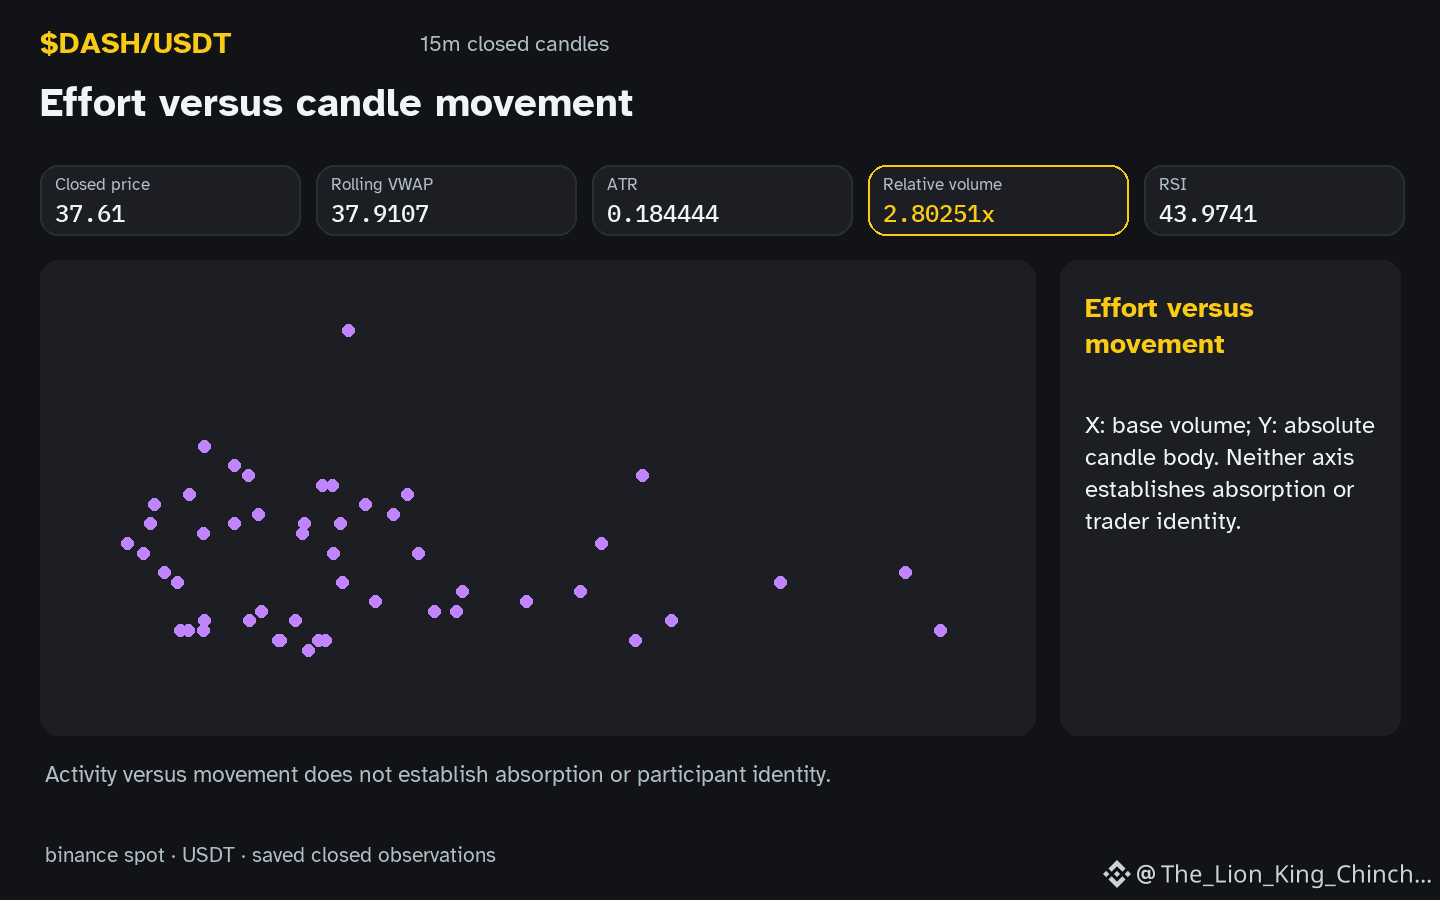
The hourly candle for $DASH is down with relative volume 2.80x baseline. Imagine a live auction where the fastest bidder shouts a price before others can react. That speed often leads to overpaying because the bidder cannot see the full order book. A breakout candle works similarly: a rapid price move on high volume may reflect a few aggressive market orders hitting thin limit layers, not broad conviction. The observation shows price inside the recorded range, hourly direction down, and volume above baseline. RSI reads 44.0. These facts describe only the saved snapshot, not a forecast. If the next closed candle reverts toward the range midpoint on lower relative volume, the auction analogy weakens. Conversely, a follow-through candle with sustained volume might support the idea of continued urgency. The mechanism is hypothetical; candles and volume alone cannot confirm motive, absorption, or causation. A useful reassessment is to watch whether subsequent candles maintain the same volume intensity or decay quickly.
Probabilistic market research, not a recommendation or guaranteed return.
Watchlist contrast: $ETH has hourly direction down and volume above its baseline; $MMT has hourly direction down and volume not above its baseline. This alone does not establish correlation.
The label or the mechanism behind it?
#DASH #ETH #MMT #CryptoEducation #CryptoLearning
$DASH : The Loud Auction Room: Why the Fastest Bidder Usually Overpays
The hourly candle for $DASH is down with relative volume 2.80x baseline. Imagine a live auction where the fastest bidder shouts a price before others can react. That speed often leads to overpaying because the bidder cannot see the full order book. A breakout candle works similarly: a rapid price move on high volume may reflect a few aggressive market orders hitting thin limit layers, not broad conviction. The observation shows price inside the recorded range, hourly direction down, and volume above baseline. RSI reads 44.0. These facts describe only the saved snapshot, not a forecast. If the next closed candle reverts toward the range midpoint on lower relative volume, the auction analogy weakens. Conversely, a follow-through candle with sustained volume might support the idea of continued urgency. The mechanism is hypothetical; candles and volume alone cannot confirm motive, absorption, or causation. A useful reassessment is to watch whether subsequent candles maintain the same volume intensity or decay quickly.
Probabilistic market research, not a recommendation or guaranteed return.
Watchlist contrast: $ETH has hourly direction down and volume above its baseline; $MMT has hourly direction down and volume not above its baseline. This alone does not establish correlation.
The label or the mechanism behind it?
#DASH #ETH #MMT #CryptoEducation #CryptoLearning
The hourly candle for $DASH is down with relative volume 2.80x baseline. Imagine a live auction where the fastest bidder shouts a price before others can react. That speed often leads to overpaying because the bidder cannot see the full order book. A breakout candle works similarly: a rapid price move on high volume may reflect a few aggressive market orders hitting thin limit layers, not broad conviction. The observation shows price inside the recorded range, hourly direction down, and volume above baseline. RSI reads 44.0. These facts describe only the saved snapshot, not a forecast. If the next closed candle reverts toward the range midpoint on lower relative volume, the auction analogy weakens. Conversely, a follow-through candle with sustained volume might support the idea of continued urgency. The mechanism is hypothetical; candles and volume alone cannot confirm motive, absorption, or causation. A useful reassessment is to watch whether subsequent candles maintain the same volume intensity or decay quickly.
Probabilistic market research, not a recommendation or guaranteed return.
Watchlist contrast: $ETH has hourly direction down and volume above its baseline; $MMT has hourly direction down and volume not above its baseline. This alone does not establish correlation.
The label or the mechanism behind it?
#DASH #ETH #MMT #CryptoEducation #CryptoLearning
45

·
--
$DASH Drops 13% in a Day—What’s Behind the $35 Million in Trading Volume?$DASH Current price: $31.02, down 13.2% in 24 hours, with about $35.3 million in trading volume, a market cap of $400 million, and a rank of 105.
For a coin of this size, more than $30 million in daily trading volume suggests this isn’t retail investors just shifting their holdings. The drop has been sharp, volume has picked up, and there are no buyers stepping in on the order book.
The thing to watch is its rank of 105—stuck in the middle, with no compelling story and no buzz to ride. That’s the awkward thing about old coins: when they fall, no one calls the bottom.$DASH Whether this is a shakeout or genuine selling depends on whether volume can contract again.
#DASH
$DASH Drops 13% in a Day—What’s Behind the $35 Million in Trading Volume?
$DASH Current price: $31.02, down 13.2% in 24 hours, with about $35.3 million in trading volume, a market cap of $400 million, and a rank of 105.
For a coin of this size, more than $30 million in daily trading volume suggests this isn’t retail investors just shifting their holdings. The drop has been sharp, volume has picked up, and there are no buyers stepping in on the order book.
The thing to watch is its rank of 105—stuck in the middle, with no compelling story and no buzz to ride. That’s the awkward thing about old coins: when they fall, no one calls the bottom.$DASH Whether this is a shakeout or genuine selling depends on whether volume can contract again.
#DASH
For a coin of this size, more than $30 million in daily trading volume suggests this isn’t retail investors just shifting their holdings. The drop has been sharp, volume has picked up, and there are no buyers stepping in on the order book.
The thing to watch is its rank of 105—stuck in the middle, with no compelling story and no buzz to ride. That’s the awkward thing about old coins: when they fall, no one calls the bottom.$DASH Whether this is a shakeout or genuine selling depends on whether volume can contract again.
#DASH
风中浪客:
$DASH 这量放得有点狠,盘口确实空 跌得这么干脆,估计还得磨一阵
1
1k



·
--
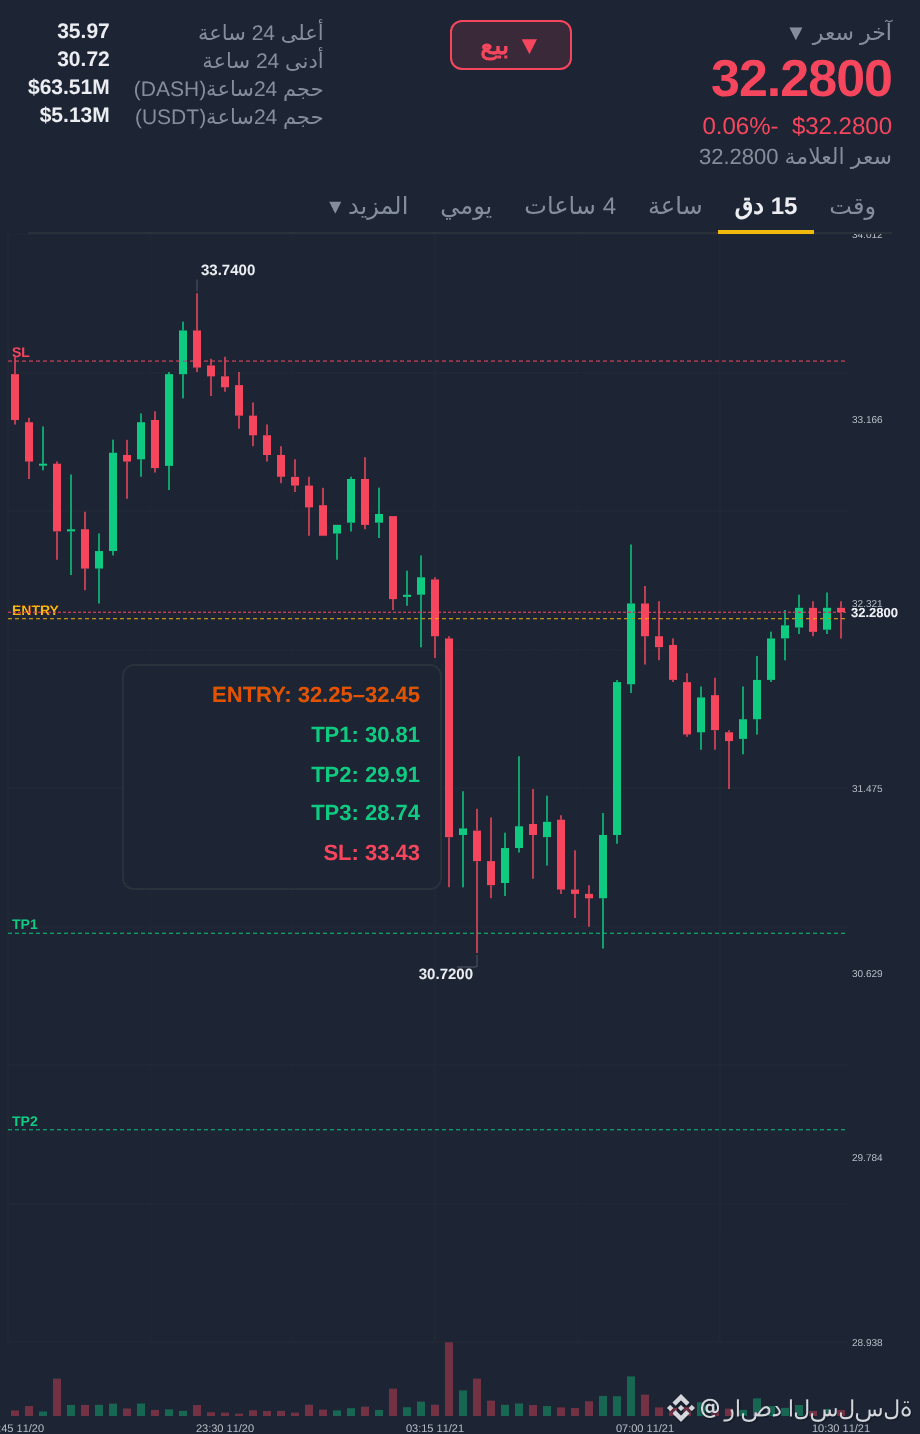
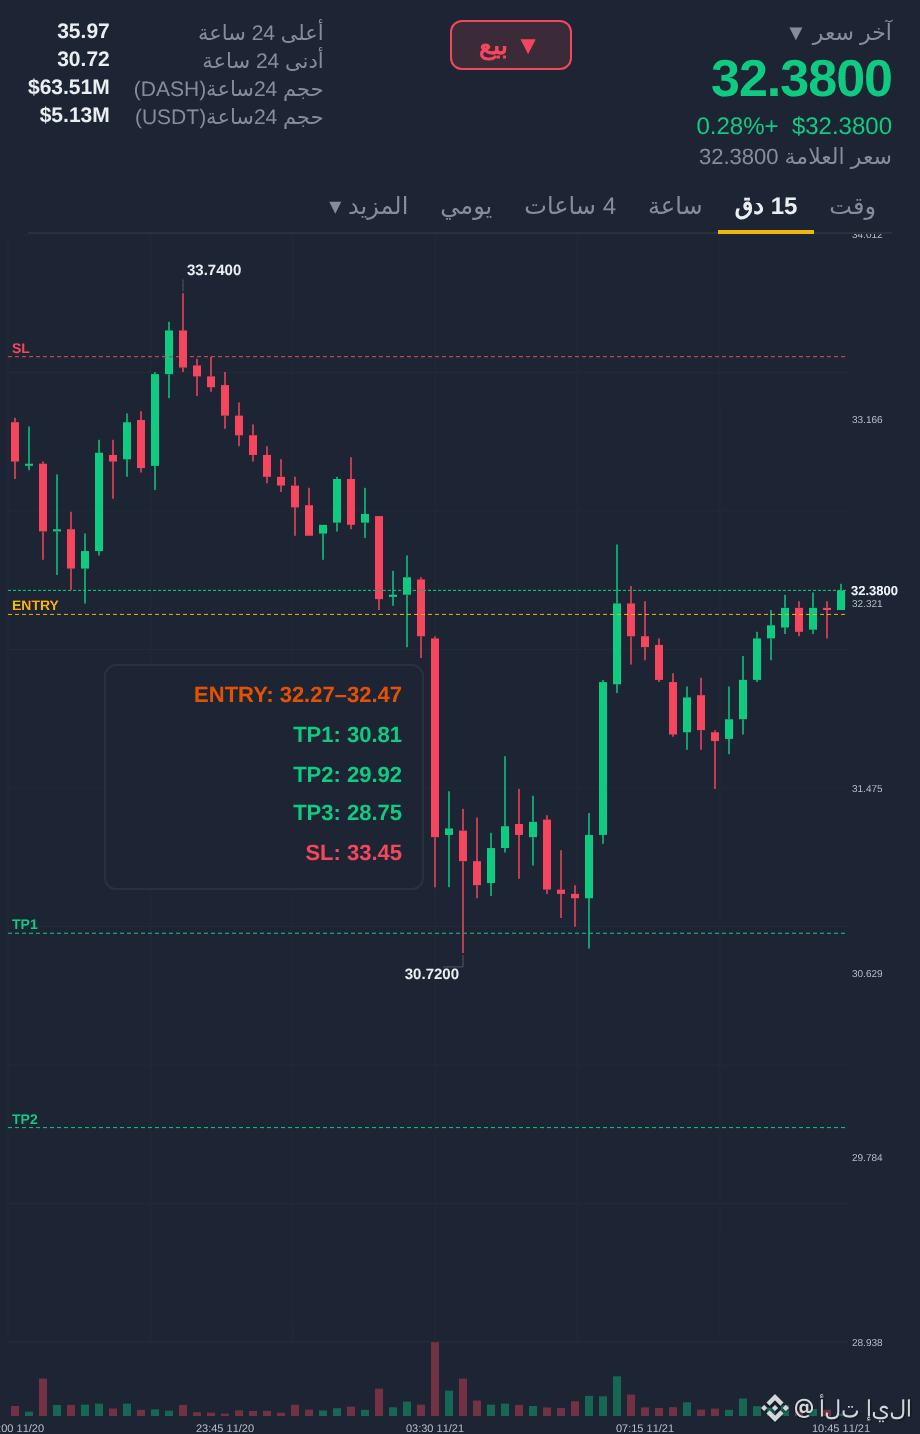
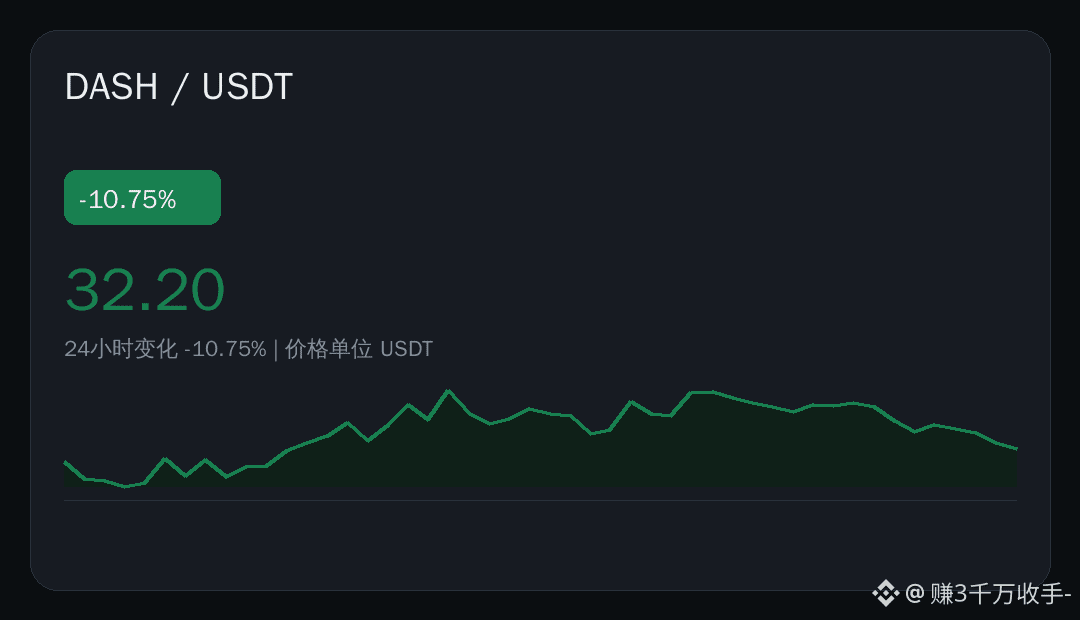
📊 The data is interesting|Latest data for $DASH : 24 hours: -10.75%, current price: 32.20 USDT.
📊 Data snapshot
· Current price: 32.20 USDT
· 24h: -10.75%
· Range: 30.72 — 36.24
· Trading volume: 5039327.72 USDT
Put these numbers together, and you can see the sentiment behind them. Volume tells more than price: bulls and bears are clearly still battling it out, with prices grinding back and forth within the range.
Would you wait for confirmation? 👇
#市场观察 #DASH #Binance
📊 The data is interesting|Latest data for $DASH : 24 hours: -10.75%, current price: 32.20 USDT.
📊 Data snapshot
· Current price: 32.20 USDT
· 24h: -10.75%
· Range: 30.72 — 36.24
· Trading volume: 5039327.72 USDT
Put these numbers together, and you can see the sentiment behind them. Volume tells more than price: bulls and bears are clearly still battling it out, with prices grinding back and forth within the range.
Would you wait for confirmation? 👇
#市场观察 #DASH #Binance
📊 Data snapshot
· Current price: 32.20 USDT
· 24h: -10.75%
· Range: 30.72 — 36.24
· Trading volume: 5039327.72 USDT
Put these numbers together, and you can see the sentiment behind them. Volume tells more than price: bulls and bears are clearly still battling it out, with prices grinding back and forth within the range.
Would you wait for confirmation? 👇
#市场观察 #DASH #Binance
2

·
--
Privacy coins are all cooling off today, with DASH down 12.66% in one day
At the time of writing, DASH is at $31.6, down 12.66% over 24 hours, 20.56% over seven days, and 37.81% over 30 days. Its 24-hour trading volume is $44 million, and its market cap is $408 million. From its peak of $1,493.59, it’s now down 97.9%, with only a fraction of its value left. ZEC, in the same sector, is at $716 at the time of writing, down 15.86% in one day, while XMR is at $444, down 8.13%. None of the three brothers escaped the sell-off.
As a seasoned crypto bagholder, I’ve watched privacy coins give back all their gains after the frenzy that started in late October. When prices were rising, the narrative did the heavy lifting; now that they’re falling, the narrative can’t save them either. DASH was once a leading payment coin, but its trading volume is now under $50 million. Liquidity has already made its exit.
With privacy coins all cooling off, do you think the sector has peaked, or is it just falling along with the broader market?
—— Web3 crypto bagholder Xiaokai
Disclaimer: The above reflects only my personal views and does not constitute investment advice. Investing carries risks; please exercise caution.
#DASH #隐私币 #ZEC
Privacy coins are all cooling off today, with DASH down 12.66% in one day
At the time of writing, DASH is at $31.6, down 12.66% over 24 hours, 20.56% over seven days, and 37.81% over 30 days. Its 24-hour trading volume is $44 million, and its market cap is $408 million. From its peak of $1,493.59, it’s now down 97.9%, with only a fraction of its value left. ZEC, in the same sector, is at $716 at the time of writing, down 15.86% in one day, while XMR is at $444, down 8.13%. None of the three brothers escaped the sell-off.
As a seasoned crypto bagholder, I’ve watched privacy coins give back all their gains after the frenzy that started in late October. When prices were rising, the narrative did the heavy lifting; now that they’re falling, the narrative can’t save them either. DASH was once a leading payment coin, but its trading volume is now under $50 million. Liquidity has already made its exit.
With privacy coins all cooling off, do you think the sector has peaked, or is it just falling along with the broader market?
—— Web3 crypto bagholder Xiaokai
Disclaimer: The above reflects only my personal views and does not constitute investment advice. Investing carries risks; please exercise caution.
#DASH #隐私币 #ZEC
At the time of writing, DASH is at $31.6, down 12.66% over 24 hours, 20.56% over seven days, and 37.81% over 30 days. Its 24-hour trading volume is $44 million, and its market cap is $408 million. From its peak of $1,493.59, it’s now down 97.9%, with only a fraction of its value left. ZEC, in the same sector, is at $716 at the time of writing, down 15.86% in one day, while XMR is at $444, down 8.13%. None of the three brothers escaped the sell-off.
As a seasoned crypto bagholder, I’ve watched privacy coins give back all their gains after the frenzy that started in late October. When prices were rising, the narrative did the heavy lifting; now that they’re falling, the narrative can’t save them either. DASH was once a leading payment coin, but its trading volume is now under $50 million. Liquidity has already made its exit.
With privacy coins all cooling off, do you think the sector has peaked, or is it just falling along with the broader market?
—— Web3 crypto bagholder Xiaokai
Disclaimer: The above reflects only my personal views and does not constitute investment advice. Investing carries risks; please exercise caution.
#DASH #隐私币 #ZEC
420

·
--
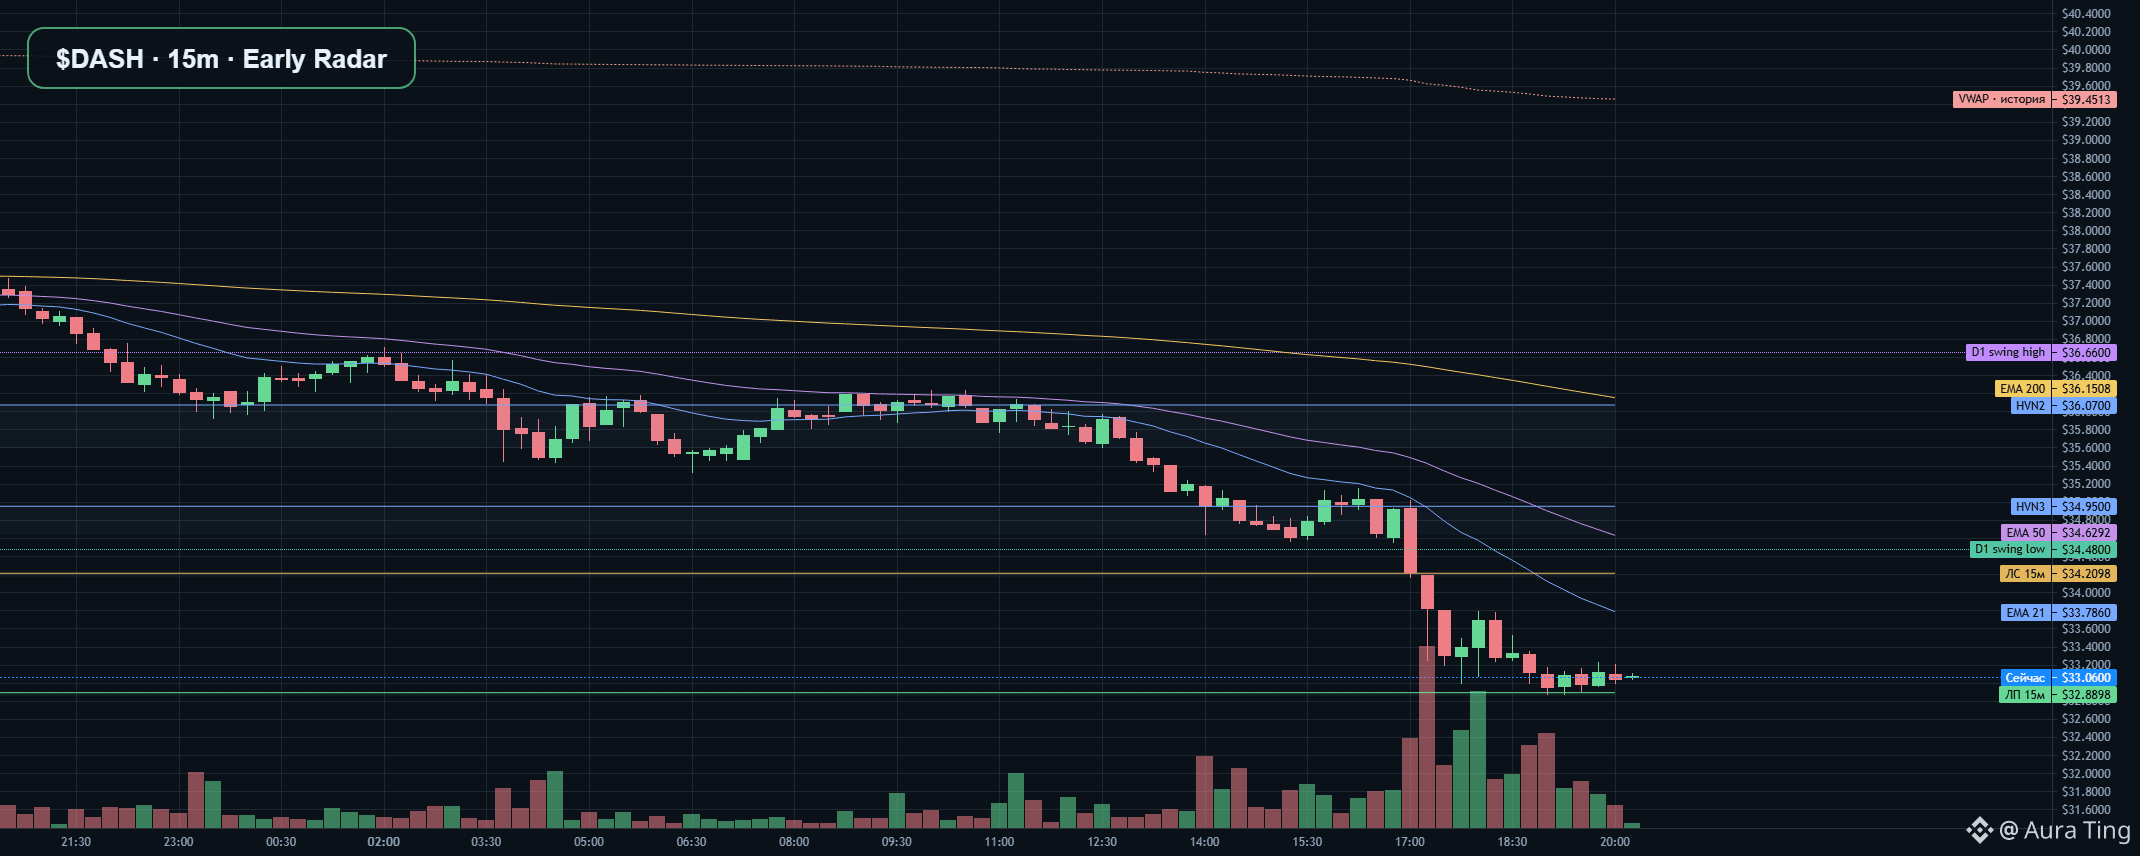
Article
DASH · Early Radar📉 SHORT · $DASH (DASH/USDT) · downward scenario · 15m context, 15m indicators, 5m trigger
📍 Scenario: the plan is based on the current price; waiting for a new closed 5m candle below the entry.
📊 MARKET
💵 Price: $33.06 · 1h +0.24% · 24h -10.60%.
💧 Past 1h: volume $180,945.872 · trades 1,939.
📊 M5 activity: volume $13,323.4045 · trades 147 · Activity score 37/100.
DASH · Early Radar
📉 SHORT · $DASH (DASH/USDT) · downward scenario · 15m context, 15m indicators, 5m trigger
📍 Scenario: the plan is based on the current price; waiting for a new closed 5m candle below the entry.
📊 MARKET
💵 Price: $33.06 · 1h +0.24% · 24h -10.60%.
💧 Past 1h: volume $180,945.872 · trades 1,939.
📊 M5 activity: volume $13,323.4045 · trades 147 · Activity score 37/100.
📍 Scenario: the plan is based on the current price; waiting for a new closed 5m candle below the entry.
📊 MARKET
💵 Price: $33.06 · 1h +0.24% · 24h -10.60%.
💧 Past 1h: volume $180,945.872 · trades 1,939.
📊 M5 activity: volume $13,323.4045 · trades 147 · Activity score 37/100.
20
Log in to explore more content
Join global crypto users on Binance Square
⚡️ Get latest and useful information about crypto.
💬 Trusted by the world’s largest crypto exchange.
👍 Discover real insights from verified creators.
Email / Phone number
Trending Topics
1
#CanBTCReboundAfterFallingBelow60K?
388,957 views
1,660 Discussing
2
#GlobalStocksFaceLongestLosingStreakSince2023
129,378 views
1,154 Discussing
3
#BlackRockIBITPostsRecord$541MSingleDayOutflow
1,028 views
30 Discussing
4
#AnthropicPlungesTowardIPOPriceonDay2
61,498 views
620 Discussing
5
#TwentyOneCapitalAdds172.25BTC
14,326 views
180 Discussing
6
#HKBillWouldExcludeTokenizedDepositsFromVirtualAssets
1,432 views
18 Discussing
7
#BNBDropsBelow540USDTWith8.46%DailyDecline
34,954 views
296 Discussing
8
#HKBillProposesHK$100KFineForUnauthorizedCryptoTitles
1,141 views
17 Discussing
9
#BitMineFaces$10.1BUnrealizedETHLoss
2,166 views
20 Discussing
10
#StrategyReports$35BNetReserves
2,128 views
18 Discussing