
#etfs
etfs
3.6M views
9,717 Discussing
Hot
Latest


Article
2021 vs 2026: Is Bitcoin Repeating History, or Has the Market Fundamentally ChangedIndependent Research | @AlphaCyl
The central question behind this research is whether $BTC Bitcoin is experiencing another familiar market cycle transition or whether the forces shaping its current market have changed enough to make comparisons with 2021 misleading.
I want to examine this through market structure, liquidity, institutional participation, leverage, regulation, investor behaviour and Bitcoin's relationship with traditional financial markets.
One distinction will guide the entire analysis: similar price behaviour does not necessarily mean similar market conditions. To establish whether history is repeating, we need to compare the forces producing the price movements, not simply the charts.
I. THE PRICE SIMILARITY: WHAT THE CHARTS ACTUALLY SHOW
The 2021 bull market reached its November all-time high at approximately $68,789 on November 10. Bitcoin subsequently declined, closing the year at approximately $46,306. CoinGlass
https://www.coinglass.com/currencies/BTC/historical-data/2021?utm_source=chatgpt.com
However, the November peak was not the first major correction of that cycle.
In April 2021, Bitcoin had already reached approximately $64,000 before falling sharply in May. The market experienced a correction exceeding 50%, followed by several months of recovery and a new all time high in November.
This matters because 2021 demonstrated that a substantial correction did not immediately terminate the bull market.
Now consider the current cycle.
Bitcoin reached approximately $126,198 on October 6, 2025. By November 21, 2026, its price had fallen to approximately $55,830, representing a drawdown of roughly 55.8% from that high. @Coinglasse +1
https://www.coinglass.com/currencies/BTC/historical-data/2025?utm_source=chatgpt.com
The 2021 May June figure is an approximate peak to trough correction. The November December figure uses Glassnode's December 2021 reported drawdown from the November ATH. The 2026 figure uses the October 2025 ATH and November 21, 2026 price.
There is a resemblance in the magnitude of the corrections, but the market's position in the cycle is different.
The October 2025 high occurred approximately 18 months after the April 2024 halving. The November 2021 high also occurred roughly 18 months after the May 2020 halving. Bitcoin +2
https://www.coinglass.com/currencies/BTC/historical-data/2025?utm_source=chatgpt.com
This is an interesting historical alignment.
Both cycles experienced a major price peak around 18 months after their respective halvings. However, the current November 2026 market is already more than a year removed from its October 2025 high.
My interpretation: Bitcoin has followed a comparable post-halving peak timeline, but the present decline has progressed into a much deeper drawdown. The four-year cycle remains a useful historical reference, not a reliable timetable for predicting the next bottom.
II. THE LIQUIDITY ENVIRONMENT: 2021 AND 2026 ARE DIFFERENT MARKETS
One of the biggest differences between these periods is the monetary environment.
In November 2021, the Federal Reserve maintained its federal funds target range at 0–0.25%.
It had also begun tapering its asset purchases, reducing monthly Treasury and mortgage-backed securities purchases by $10 billion and $5 billion, respectively. The Fed still described financial conditions as accommodative.
https://www.federalreserve.gov/newsevents/pressreleases/monetary20211103a.htm
https://www.federalreserve.gov/monetarypolicy/fomcminutes20211103.htm
This is important because Bitcoin's 2021 rally developed during an environment of exceptionally low interest rates, substantial central-bank support and abundant liquidity.
By comparison, the Federal Reserve's November 2026 data show:
Federal funds target range: 3.75–4.00%.
September PCE inflation: 3.6%.
October unemployment: 4.1%.
https://www.federalreserve.gov/
The Fed's October meeting minutes, published November 18, provide additional context on its current monetary policy considerations. federalreserve.gov
The difference is substantial.
In 2021, investors could access relatively inexpensive capital while searching for assets offering higher returns. Bitcoin and other speculative assets benefited from that environment.
In 2026, capital has a higher opportunity cost. Investors can earn returns from traditional fixed-income instruments without necessarily accepting Bitcoin's volatility.
This changes the investment decision.
When interest rates are elevated, Bitcoin must compete more directly for capital. Investors have to consider whether the expected return justifies the volatility and potential drawdown.
There is also a second consideration: monetary tightening does not affect Bitcoin in isolation. It can influence equity valuations, borrowing costs, dollar liquidity, leveraged positions and the willingness of investors to hold speculative assets.
The current decline has coincided with concerns about AI valuations, the profitability of infrastructure spending and rising borrowing costs. Reuters reported that these concerns were affecting technology stocks and broader risk assets alongside crypto.
https://www.reuters.com/business/bitcoin-falls-357-56814-2026-11-21/
This provides evidence of a broader risk repricing rather than a purely crypto specific event.
III. INSTITUTIONAL PARTICIPATION: THE BIGGEST STRUCTURAL CHANGE
Perhaps the most important difference between 2021 and 2026 is who now participates in Bitcoin's market.
In 2021, institutional adoption was already developing. Tesla, #MicroStrategy and other companies had introduced corporate Bitcoin treasury strategies. CME Bitcoin futures also provided regulated institutional exposure.
However, the US spot Bitcoin ETF market did not yet exist.
That changed in January 2024, when US spot Bitcoin ETFs began trading.
The result is a fundamentally different capital distribution system.
Investors can now obtain Bitcoin exposure through regulated investment products without directly managing private keys, operating exchange accounts or holding Bitcoin themselves.
This has expanded access through wealth managers, financial advisers and traditional investment platforms.
Consider the institutional ownership data.
According to Galaxy Research's analysis of Q3 2026 SEC Form 13F filings:
- Reporting investment managers held a record 356,491 BTC-equivalent across US spot Bitcoin ETPs as of September 30.
- They added 49,229 BTC-equivalent during Q3, reversing the 47,054 BTC-equivalent they had sold across the preceding three quarters.
- 2,166 managers reported holdings, an increase of 191 from the previous quarter.
https://www.galaxy.com/insights/research/bitcoin-etp-13f-institutional-holdings-q3-2026-wealth-channel-wells-fargo
These are meaningful figures.
But they require careful interpretation.
Form 13F reports qualifying long positions at quarter end. It does not reveal all short positions, derivatives exposure or the complete economic intentions of the reporting institutions.
A fund reporting Bitcoin ETF ownership could have an offsetting position elsewhere.
Consequently, institutional ownership figures cannot automatically be interpreted as directional bullish exposure.
The more interesting question is whether institutional access has changed Bitcoin's sensitivity to traditional financial markets.
I believe this deserves serious attention.
The ETF structure connects Bitcoin demand to portfolio allocations, wealth-management decisions, risk limits and traditional investment flows.
It also introduces another channel through which capital can leave the market.
IV. ARE INSTITUTIONS SELLING #bitcoin ?
This is where the current market becomes particularly interesting.
There is evidence of institutional selling, but the data also shows that institutional behaviour is not uniform.
@CoinDesk Research's October 2026 institutional adoption report found that:
- Combined ETP and digital-asset treasury exposure declined 10.3% to $279 billion.
- ETPs recorded $1.86 billion in net outflows.
- Corporate digital-asset treasuries added approximately $1.16 billion to their holdings.
- Bitcoin ETPs still recorded $87.4 million in October net inflows.
https://www.coindesk.com/research/digital-assets-institutional-adoption-report-october-2026
The report also estimated that publicly traded ETPs and digital asset treasury companies collectively represented approximately 13.7% of Bitcoin's circulating supply.
That is a considerable structural change compared with 2021.
But November brought a more pronounced deterioration in ETF flows.
By November 20, US spot Bitcoin #ETFs had recorded approximately $3.47 billion in net outflows for the month. The November 19 session alone produced $582.2 million in net redemptions.
https://www.theblock.co/news/markets/2026-11-20-us-spot-bitcoin-etfs-see-582-million-in-daily-net-outflows-as-november-total-nears-3-5-billion-444217
These figures indicate a meaningful reduction in ETF demand.
However, there is a distinction between three things:
- Institutions reducing exposure through ETF redemptions.
- Corporate treasuries selling Bitcoin from their balance sheets.
- Institutional investors maintaining Bitcoin exposure while hedging through derivatives.
They are different transactions with different implications.
For example, an ETF redemption can result in the fund selling Bitcoin to meet the redemption process. But it does not establish that the asset manager itself has changed its long term view of Bitcoin.
Likewise, a reduction in the dollar value of corporate Bitcoin holdings can result from falling prices rather than actual BTC sales.
This distinction is supported by October's institutional data, where much of the reduction in exposure was valuation driven.
The evidence supports institutional repositioning and weakening ETF demand. It does not yet establish a coordinated institutional exit from Bitcoin.
V. LEVERAGE AND MARKET STRUCTURE: HAVE WE LEARNED ANYTHING?
Bitcoin's 2021 market was heavily influenced by derivatives positioning.
Glassnode's December 2021 market review reported that Bitcoin futures open interest had nearly doubled over the year, increasing by $9.57 billion, or 97%.
The same research documented a major liquidation event in early December, when Bitcoin fell approximately $8,800 in one day and more than $5.4 billion in futures contracts were forcibly closed.
https://research.glassnode.com/the-week-onchain-week-52-2021/
This illustrates an important characteristic of crypto markets: price declines can become self-reinforcing when leveraged traders are forced to close positions.
Consider the mechanics:
- Bitcoin declines and leveraged long positions lose collateral.
- Exchanges liquidate positions that no longer meet margin requirements.
- Liquidations generate additional selling pressure.
- Prices decline further, exposing additional leveraged positions.
- The process can develop into a liquidation cascade.
This mechanism existed in 2021 and remains relevant in 2026.
However, we should not assume that the current market has the same leverage profile simply because prices are falling.
A proper comparison requires contemporaneous futures open interest, funding rates, perpetual futures basis, options positioning and liquidation data.
The distinction between spot selling and forced derivatives liquidation is particularly important for traders.
A market experiencing heavy spot distribution has a different underlying demand problem from one experiencing a temporary derivatives-driven liquidation cascade.
VI. THE STABLECOIN ECONOMY: A MUCH LARGER MARKET
Another structural difference is the growth of stablecoins.
According to CoinDesk Research's February 2026 industry report, stablecoin market capitalization had exceeded $300 billion, compared with less than $50 billion in early 2020.
The same report estimated that weekly stablecoin transaction volumes averaged approximately $60 billion, compared with around $30 billion during the previous cycle.
https://www.coindesk.com/research/digital-assets-2026-above-the-noise?
2020 figure represents an approximate upper reference of less than $50B; 2026 is reported as exceeding $300B. coindesk.com
Why does this matter?
Stablecoins provide settlement liquidity, trading collateral and a dollar denominated medium of exchange across crypto markets.
Their growth indicates that the ecosystem has developed a substantially larger liquidity infrastructure.
But there is an important qualification.
Stablecoin market capitalization does not equal capital waiting to purchase Bitcoin.
Stablecoins also support payments, exchange settlement, DeFi lending, liquidity pools and cross-border transfers. Some balances remain inactive or are held for purposes unrelated to directional Bitcoin investment.
Therefore, a larger stablecoin economy improves the potential capacity of crypto markets, but it does not guarantee immediate demand for BTC.
This is one area where the 2026 market has stronger underlying infrastructure than 2021, even while Bitcoin's price performance has deteriorated.
VII. REGULATION: IS GOVERNMENT POLICY REPEATING THE 2021 STORY?
Regulatory uncertainty affected Bitcoin in 2021, but the circumstances were different.
One of the most significant events was China's crackdown on cryptocurrency mining and related activities.
The restrictions triggered a major geographical redistribution of Bitcoin mining operations. Glassnode's 2021 review documented an approximately 53% mining shutdown during the migration, followed by a substantial recovery in network hash rate by year-end.
https://research.glassnode.com/the-week-onchain-week-52-2021/
That episode demonstrated that government policy could materially affect Bitcoin's mining industry, infrastructure and market sentiment.
But it did not give China control over Bitcoin's monetary policy or transaction rules.
The network continued operating.
In 2026, the regulatory environment is more developed, particularly in the United States.
Bitcoin has regulated exchange traded products, more established institutional custody channels and a broader financial services infrastructure.
However, regulatory uncertainty remains relevant.
Reuters identified political and regulatory risks following the November 2026 US midterm elections as one of several concerns affecting crypto markets.
https://www.reuters.com/business/bitcoin-falls-357-56814-2026-11-21/
We should separate three regulatory effects:
- Market access: Rules affecting whether banks, funds and investment platforms can provide crypto services.
- Capital movement: Rules affecting custody, taxation, stablecoins and institutional participation.
- Market confidence: Political uncertainty that changes expectations about the future operating environment.
These can influence Bitcoin's price without changing the underlying protocol.
There is currently insufficient evidence to attribute the November decline primarily to government attempts to control Bitcoin.
Regulatory uncertainty is a factor worth monitoring, but the contemporaneous evidence also points to macroeconomic pressure, ETF redemptions and declining risk appetite.
VIII. WHAT HAS ACTUALLY CHANGED BETWEEN THE TWO CYCLES?
The comparison becomes clearer when we separate Bitcoin's market structure from its underlying infrastructure.
Sources:
https://www.federalreserve.gov/newsevents/pressreleases/monetary20211103a.htm
https://www.federalreserve.gov/
https://www.coindesk.com/research/digital-assets-2026-above-the-noise
https://research.glassnode.com/the-week-onchain-week-52-2021/
https://www.galaxy.com/insights/research/bitcoin-etp-13f-institutional-holdings-q3-2026-wealth-channel-wells-fargo?
The table reveals something important.
Bitcoin has become more integrated into traditional financial markets, but that integration has introduced additional channels through which macroeconomic conditions and portfolio decisions can influence its price.
A larger market does not automatically mean a less volatile market.
A deeper capital base does not guarantee that investors will maintain their allocations during periods of uncertainty.
And institutional ownership does not eliminate the possibility of substantial drawdowns.
IX. SO, ARE WE REPEATING 2021?
My conclusion is that Bitcoin is repeating some of the historical cycle characteristics, but the market itself has fundamentally changed.
There are three important similarities.
First, cycle timing. Both the November 2021 and October 2025 peaks occurred approximately 18 months after their respective halvings.
Second, leverage and liquidity. Both markets demonstrate how changes in risk appetite, derivatives positioning and liquidity can accelerate price declines.
Third, institutional and macroeconomic influences. Both cycles were affected by monetary policy and changing investor expectations, although the channels through which those forces operate have expanded considerably.
But the differences are more consequential.
The 2021 market developed in an exceptionally accommodative monetary environment, with relatively limited institutional investment infrastructure.
The 2026 market has a much larger stablecoin economy, regulated spot ETFs, corporate Bitcoin treasuries and significantly deeper connections to traditional financial markets.
Yet these developments have not prevented a drawdown exceeding 55% from the October 2025 high.
That raises an important question about Bitcoin's evolving investment proposition.
Institutional adoption has expanded access and created additional sources of demand. It has also connected Bitcoin more closely to conventional portfolio allocation decisions.
When institutional investors reduce risk, Bitcoin can experience selling pressure alongside equities and other risk assets.
This does not invalidate Bitcoin's monetary properties or long-term investment thesis. It does mean that its market behaviour must be understood through a broader financial framework.
What traders should monitor next
Rather than relying on historical cycle predictions alone, I would monitor these indicators:
These indicators should be evaluated together. No single one establishes that a market bottom or recovery has arrived.
X. THE FINAL THESIS
Bitcoin's current decline deserves to be examined beyond the familiar four-year cycle narrative.
The 2021 market was shaped by retail speculation, expanding derivatives exposure, pandemic-era liquidity and an emerging institutional market.
The 2026 market operates with a substantially different financial architecture. ETFs, corporate treasuries, stablecoins, institutional custody and traditional investment platforms now play much larger roles.
But institutional participation has not made Bitcoin immune to traditional financial conditions. If anything, it has created additional transmission channels between conventional markets and crypto.
The current evidence points to weakening ETF demand, a more restrictive monetary environment than in 2021, and a broader reassessment of risk assets. Corporate accumulation and institutional ownership data also demonstrate that capital is not moving in one direction.
I would therefore resist declaring that the four-year cycle has been invalidated or that Bitcoin must repeat the 2021–2022 bear market.
The more useful conclusion is that historical cycle patterns remain relevant, but the market structure producing them has evolved.
Bitcoin has become more institutional without becoming less exposed to market risk.
And that may be the most important distinction traders need to understand when comparing 2021 with 2026.
Independent research. Not financial advice. Data and market conditions referenced through November 21, 2026.
Research references and verification
[CoinGlass – Bitcoin historical price data, 2021](https://www.coinglass.com/currencies/BTC/historical-data/2021)
[CoinGlass – Bitcoin historical price data, 2025–2026](https://www.coinglass.com/currencies/BTC/historical-data/2025).
[Glassnode – The Week Onchain, Week 52, 2021](https://research.glassnode.com/the-week-onchain-week-52-2021/).
[Glassnode – The Week Onchain, Week 49, 2021](https://research.glassnode.com/week-onchain-week-49-2021/).
[Federal Reserve – November 3, 2021 FOMC statement](https://www.federalreserve.gov/newsevents/pressreleases/monetary20211103a.htm).
[Federal Reserve – Current economic indicators, November 2026](https://www.federalreserve.gov/).
[Galaxy Research – Institutional Holdings of Bitcoin ETPs Reach New All-Time High, November 19,](https://www.galaxy.com/insights/research/bitcoin-etp-13f-institutional-holdings-q3-2026-wealth-channel-wells-fargo).
[CoinDesk Research – Digital Assets Institutional Adoption, October 2026](https://www.coindesk.com/research/digital-assets-institutional-adoption-report-october-2026?).
[CoinDesk Research – Digital Assets 2026: Above the Noise](https://www.coindesk.com/research/digital-assets-2026-above-the-noise).
[Reuters – Bitcoin falls to its lowest in two years, November 21, 2026](https://www.reuters.com/business/bitcoin-falls-357-56814-2026-11-21/).
2021 vs 2026: Is Bitcoin Repeating History, or Has the Market Fundamentally Changed
Independent Research | @AlphaCyl
The central question behind this research is whether $BTC Bitcoin is experiencing another familiar market cycle transition or whether the forces shaping its current market have changed enough to make comparisons with 2021 misleading.
I want to examine this through market structure, liquidity, institutional participation, leverage, regulation, investor behaviour and Bitcoin's relationship with traditional financial markets.
One distinction will guide the entire analysis: similar price behaviour does not necessarily mean similar market conditions. To establish whether history is repeating, we need to compare the forces producing the price movements, not simply the charts.
I. THE PRICE SIMILARITY: WHAT THE CHARTS ACTUALLY SHOW
The 2021 bull market reached its November all-time high at approximately $68,789 on November 10. Bitcoin subsequently declined, closing the year at approximately $46,306. CoinGlass
https://www.coinglass.com/currencies/BTC/historical-data/2021?utm_source=chatgpt.com
However, the November peak was not the first major correction of that cycle.
In April 2021, Bitcoin had already reached approximately $64,000 before falling sharply in May. The market experienced a correction exceeding 50%, followed by several months of recovery and a new all time high in November.
This matters because 2021 demonstrated that a substantial correction did not immediately terminate the bull market.
Now consider the current cycle.
Bitcoin reached approximately $126,198 on October 6, 2025. By November 21, 2026, its price had fallen to approximately $55,830, representing a drawdown of roughly 55.8% from that high. @Coinglass +1
https://www.coinglass.com/currencies/BTC/historical-data/2025?utm_source=chatgpt.com
The 2021 May June figure is an approximate peak to trough correction. The November December figure uses Glassnode's December 2021 reported drawdown from the November ATH. The 2026 figure uses the October 2025 ATH and November 21, 2026 price.
There is a resemblance in the magnitude of the corrections, but the market's position in the cycle is different.
The October 2025 high occurred approximately 18 months after the April 2024 halving. The November 2021 high also occurred roughly 18 months after the May 2020 halving. Bitcoin +2
https://www.coinglass.com/currencies/BTC/historical-data/2025?utm_source=chatgpt.com
This is an interesting historical alignment.
Both cycles experienced a major price peak around 18 months after their respective halvings. However, the current November 2026 market is already more than a year removed from its October 2025 high.
My interpretation: Bitcoin has followed a comparable post-halving peak timeline, but the present decline has progressed into a much deeper drawdown. The four-year cycle remains a useful historical reference, not a reliable timetable for predicting the next bottom.
II. THE LIQUIDITY ENVIRONMENT: 2021 AND 2026 ARE DIFFERENT MARKETS
One of the biggest differences between these periods is the monetary environment.
In November 2021, the Federal Reserve maintained its federal funds target range at 0–0.25%.
It had also begun tapering its asset purchases, reducing monthly Treasury and mortgage-backed securities purchases by $10 billion and $5 billion, respectively. The Fed still described financial conditions as accommodative.
https://www.federalreserve.gov/newsevents/pressreleases/monetary20211103a.htm
https://www.federalreserve.gov/monetarypolicy/fomcminutes20211103.htm
This is important because Bitcoin's 2021 rally developed during an environment of exceptionally low interest rates, substantial central-bank support and abundant liquidity.
By comparison, the Federal Reserve's November 2026 data show:
Federal funds target range: 3.75–4.00%.
September PCE inflation: 3.6%.
October unemployment: 4.1%.
https://www.federalreserve.gov/
The Fed's October meeting minutes, published November 18, provide additional context on its current monetary policy considerations. federalreserve.gov
The difference is substantial.
In 2021, investors could access relatively inexpensive capital while searching for assets offering higher returns. Bitcoin and other speculative assets benefited from that environment.
In 2026, capital has a higher opportunity cost. Investors can earn returns from traditional fixed-income instruments without necessarily accepting Bitcoin's volatility.
This changes the investment decision.
When interest rates are elevated, Bitcoin must compete more directly for capital. Investors have to consider whether the expected return justifies the volatility and potential drawdown.
There is also a second consideration: monetary tightening does not affect Bitcoin in isolation. It can influence equity valuations, borrowing costs, dollar liquidity, leveraged positions and the willingness of investors to hold speculative assets.
The current decline has coincided with concerns about AI valuations, the profitability of infrastructure spending and rising borrowing costs. Reuters reported that these concerns were affecting technology stocks and broader risk assets alongside crypto.
https://www.reuters.com/business/bitcoin-falls-357-56814-2026-11-21/
This provides evidence of a broader risk repricing rather than a purely crypto specific event.
III. INSTITUTIONAL PARTICIPATION: THE BIGGEST STRUCTURAL CHANGE
Perhaps the most important difference between 2021 and 2026 is who now participates in Bitcoin's market.
In 2021, institutional adoption was already developing. Tesla, #MicroStrategy and other companies had introduced corporate Bitcoin treasury strategies. CME Bitcoin futures also provided regulated institutional exposure.
However, the US spot Bitcoin ETF market did not yet exist.
That changed in January 2024, when US spot Bitcoin ETFs began trading.
The result is a fundamentally different capital distribution system.
Investors can now obtain Bitcoin exposure through regulated investment products without directly managing private keys, operating exchange accounts or holding Bitcoin themselves.
This has expanded access through wealth managers, financial advisers and traditional investment platforms.
Consider the institutional ownership data.
According to Galaxy Research's analysis of Q3 2026 SEC Form 13F filings:
- Reporting investment managers held a record 356,491 BTC-equivalent across US spot Bitcoin ETPs as of September 30.
- They added 49,229 BTC-equivalent during Q3, reversing the 47,054 BTC-equivalent they had sold across the preceding three quarters.
- 2,166 managers reported holdings, an increase of 191 from the previous quarter.
https://www.galaxy.com/insights/research/bitcoin-etp-13f-institutional-holdings-q3-2026-wealth-channel-wells-fargo
These are meaningful figures.
But they require careful interpretation.
Form 13F reports qualifying long positions at quarter end. It does not reveal all short positions, derivatives exposure or the complete economic intentions of the reporting institutions.
A fund reporting Bitcoin ETF ownership could have an offsetting position elsewhere.
Consequently, institutional ownership figures cannot automatically be interpreted as directional bullish exposure.
The more interesting question is whether institutional access has changed Bitcoin's sensitivity to traditional financial markets.
I believe this deserves serious attention.
The ETF structure connects Bitcoin demand to portfolio allocations, wealth-management decisions, risk limits and traditional investment flows.
It also introduces another channel through which capital can leave the market.
IV. ARE INSTITUTIONS SELLING #bitcoin ?
This is where the current market becomes particularly interesting.
There is evidence of institutional selling, but the data also shows that institutional behaviour is not uniform.
@CoinDesk Research's October 2026 institutional adoption report found that:
- Combined ETP and digital-asset treasury exposure declined 10.3% to $279 billion.
- ETPs recorded $1.86 billion in net outflows.
- Corporate digital-asset treasuries added approximately $1.16 billion to their holdings.
- Bitcoin ETPs still recorded $87.4 million in October net inflows.
https://www.coindesk.com/research/digital-assets-institutional-adoption-report-october-2026
The report also estimated that publicly traded ETPs and digital asset treasury companies collectively represented approximately 13.7% of Bitcoin's circulating supply.
That is a considerable structural change compared with 2021.
But November brought a more pronounced deterioration in ETF flows.
By November 20, US spot Bitcoin #ETFs had recorded approximately $3.47 billion in net outflows for the month. The November 19 session alone produced $582.2 million in net redemptions.
https://www.theblock.co/news/markets/2026-11-20-us-spot-bitcoin-etfs-see-582-million-in-daily-net-outflows-as-november-total-nears-3-5-billion-444217
These figures indicate a meaningful reduction in ETF demand.
However, there is a distinction between three things:
- Institutions reducing exposure through ETF redemptions.
- Corporate treasuries selling Bitcoin from their balance sheets.
- Institutional investors maintaining Bitcoin exposure while hedging through derivatives.
They are different transactions with different implications.
For example, an ETF redemption can result in the fund selling Bitcoin to meet the redemption process. But it does not establish that the asset manager itself has changed its long term view of Bitcoin.
Likewise, a reduction in the dollar value of corporate Bitcoin holdings can result from falling prices rather than actual BTC sales.
This distinction is supported by October's institutional data, where much of the reduction in exposure was valuation driven.
The evidence supports institutional repositioning and weakening ETF demand. It does not yet establish a coordinated institutional exit from Bitcoin.
V. LEVERAGE AND MARKET STRUCTURE: HAVE WE LEARNED ANYTHING?
Bitcoin's 2021 market was heavily influenced by derivatives positioning.
Glassnode's December 2021 market review reported that Bitcoin futures open interest had nearly doubled over the year, increasing by $9.57 billion, or 97%.
The same research documented a major liquidation event in early December, when Bitcoin fell approximately $8,800 in one day and more than $5.4 billion in futures contracts were forcibly closed.
https://research.glassnode.com/the-week-onchain-week-52-2021/
This illustrates an important characteristic of crypto markets: price declines can become self-reinforcing when leveraged traders are forced to close positions.
Consider the mechanics:
- Bitcoin declines and leveraged long positions lose collateral.
- Exchanges liquidate positions that no longer meet margin requirements.
- Liquidations generate additional selling pressure.
- Prices decline further, exposing additional leveraged positions.
- The process can develop into a liquidation cascade.
This mechanism existed in 2021 and remains relevant in 2026.
However, we should not assume that the current market has the same leverage profile simply because prices are falling.
A proper comparison requires contemporaneous futures open interest, funding rates, perpetual futures basis, options positioning and liquidation data.
The distinction between spot selling and forced derivatives liquidation is particularly important for traders.
A market experiencing heavy spot distribution has a different underlying demand problem from one experiencing a temporary derivatives-driven liquidation cascade.
VI. THE STABLECOIN ECONOMY: A MUCH LARGER MARKET
Another structural difference is the growth of stablecoins.
According to CoinDesk Research's February 2026 industry report, stablecoin market capitalization had exceeded $300 billion, compared with less than $50 billion in early 2020.
The same report estimated that weekly stablecoin transaction volumes averaged approximately $60 billion, compared with around $30 billion during the previous cycle.
https://www.coindesk.com/research/digital-assets-2026-above-the-noise?
2020 figure represents an approximate upper reference of less than $50B; 2026 is reported as exceeding $300B. coindesk.com
Why does this matter?
Stablecoins provide settlement liquidity, trading collateral and a dollar denominated medium of exchange across crypto markets.
Their growth indicates that the ecosystem has developed a substantially larger liquidity infrastructure.
But there is an important qualification.
Stablecoin market capitalization does not equal capital waiting to purchase Bitcoin.
Stablecoins also support payments, exchange settlement, DeFi lending, liquidity pools and cross-border transfers. Some balances remain inactive or are held for purposes unrelated to directional Bitcoin investment.
Therefore, a larger stablecoin economy improves the potential capacity of crypto markets, but it does not guarantee immediate demand for BTC.
This is one area where the 2026 market has stronger underlying infrastructure than 2021, even while Bitcoin's price performance has deteriorated.
VII. REGULATION: IS GOVERNMENT POLICY REPEATING THE 2021 STORY?
Regulatory uncertainty affected Bitcoin in 2021, but the circumstances were different.
One of the most significant events was China's crackdown on cryptocurrency mining and related activities.
The restrictions triggered a major geographical redistribution of Bitcoin mining operations. Glassnode's 2021 review documented an approximately 53% mining shutdown during the migration, followed by a substantial recovery in network hash rate by year-end.
https://research.glassnode.com/the-week-onchain-week-52-2021/
That episode demonstrated that government policy could materially affect Bitcoin's mining industry, infrastructure and market sentiment.
But it did not give China control over Bitcoin's monetary policy or transaction rules.
The network continued operating.
In 2026, the regulatory environment is more developed, particularly in the United States.
Bitcoin has regulated exchange traded products, more established institutional custody channels and a broader financial services infrastructure.
However, regulatory uncertainty remains relevant.
Reuters identified political and regulatory risks following the November 2026 US midterm elections as one of several concerns affecting crypto markets.
https://www.reuters.com/business/bitcoin-falls-357-56814-2026-11-21/
We should separate three regulatory effects:
- Market access: Rules affecting whether banks, funds and investment platforms can provide crypto services.
- Capital movement: Rules affecting custody, taxation, stablecoins and institutional participation.
- Market confidence: Political uncertainty that changes expectations about the future operating environment.
These can influence Bitcoin's price without changing the underlying protocol.
There is currently insufficient evidence to attribute the November decline primarily to government attempts to control Bitcoin.
Regulatory uncertainty is a factor worth monitoring, but the contemporaneous evidence also points to macroeconomic pressure, ETF redemptions and declining risk appetite.
VIII. WHAT HAS ACTUALLY CHANGED BETWEEN THE TWO CYCLES?
The comparison becomes clearer when we separate Bitcoin's market structure from its underlying infrastructure.
Sources:
https://www.federalreserve.gov/newsevents/pressreleases/monetary20211103a.htm
https://www.federalreserve.gov/
https://www.coindesk.com/research/digital-assets-2026-above-the-noise
https://research.glassnode.com/the-week-onchain-week-52-2021/
https://www.galaxy.com/insights/research/bitcoin-etp-13f-institutional-holdings-q3-2026-wealth-channel-wells-fargo?
The table reveals something important.
Bitcoin has become more integrated into traditional financial markets, but that integration has introduced additional channels through which macroeconomic conditions and portfolio decisions can influence its price.
A larger market does not automatically mean a less volatile market.
A deeper capital base does not guarantee that investors will maintain their allocations during periods of uncertainty.
And institutional ownership does not eliminate the possibility of substantial drawdowns.
IX. SO, ARE WE REPEATING 2021?
My conclusion is that Bitcoin is repeating some of the historical cycle characteristics, but the market itself has fundamentally changed.
There are three important similarities.
First, cycle timing. Both the November 2021 and October 2025 peaks occurred approximately 18 months after their respective halvings.
Second, leverage and liquidity. Both markets demonstrate how changes in risk appetite, derivatives positioning and liquidity can accelerate price declines.
Third, institutional and macroeconomic influences. Both cycles were affected by monetary policy and changing investor expectations, although the channels through which those forces operate have expanded considerably.
But the differences are more consequential.
The 2021 market developed in an exceptionally accommodative monetary environment, with relatively limited institutional investment infrastructure.
The 2026 market has a much larger stablecoin economy, regulated spot ETFs, corporate Bitcoin treasuries and significantly deeper connections to traditional financial markets.
Yet these developments have not prevented a drawdown exceeding 55% from the October 2025 high.
That raises an important question about Bitcoin's evolving investment proposition.
Institutional adoption has expanded access and created additional sources of demand. It has also connected Bitcoin more closely to conventional portfolio allocation decisions.
When institutional investors reduce risk, Bitcoin can experience selling pressure alongside equities and other risk assets.
This does not invalidate Bitcoin's monetary properties or long-term investment thesis. It does mean that its market behaviour must be understood through a broader financial framework.
What traders should monitor next
Rather than relying on historical cycle predictions alone, I would monitor these indicators:
These indicators should be evaluated together. No single one establishes that a market bottom or recovery has arrived.
X. THE FINAL THESIS
Bitcoin's current decline deserves to be examined beyond the familiar four-year cycle narrative.
The 2021 market was shaped by retail speculation, expanding derivatives exposure, pandemic-era liquidity and an emerging institutional market.
The 2026 market operates with a substantially different financial architecture. ETFs, corporate treasuries, stablecoins, institutional custody and traditional investment platforms now play much larger roles.
But institutional participation has not made Bitcoin immune to traditional financial conditions. If anything, it has created additional transmission channels between conventional markets and crypto.
The current evidence points to weakening ETF demand, a more restrictive monetary environment than in 2021, and a broader reassessment of risk assets. Corporate accumulation and institutional ownership data also demonstrate that capital is not moving in one direction.
I would therefore resist declaring that the four-year cycle has been invalidated or that Bitcoin must repeat the 2021–2022 bear market.
The more useful conclusion is that historical cycle patterns remain relevant, but the market structure producing them has evolved.
Bitcoin has become more institutional without becoming less exposed to market risk.
And that may be the most important distinction traders need to understand when comparing 2021 with 2026.
Independent research. Not financial advice. Data and market conditions referenced through November 21, 2026.
Research references and verification
[CoinGlass – Bitcoin historical price data, 2021](https://www.coinglass.com/currencies/BTC/historical-data/2021)
[CoinGlass – Bitcoin historical price data, 2025–2026](https://www.coinglass.com/currencies/BTC/historical-data/2025).
[Glassnode – The Week Onchain, Week 52, 2021](https://research.glassnode.com/the-week-onchain-week-52-2021/).
[Glassnode – The Week Onchain, Week 49, 2021](https://research.glassnode.com/week-onchain-week-49-2021/).
[Federal Reserve – November 3, 2021 FOMC statement](https://www.federalreserve.gov/newsevents/pressreleases/monetary20211103a.htm).
[Federal Reserve – Current economic indicators, November 2026](https://www.federalreserve.gov/).
[Galaxy Research – Institutional Holdings of Bitcoin ETPs Reach New All-Time High, November 19,](https://www.galaxy.com/insights/research/bitcoin-etp-13f-institutional-holdings-q3-2026-wealth-channel-wells-fargo).
[CoinDesk Research – Digital Assets Institutional Adoption, October 2026](https://www.coindesk.com/research/digital-assets-institutional-adoption-report-october-2026?).
[CoinDesk Research – Digital Assets 2026: Above the Noise](https://www.coindesk.com/research/digital-assets-2026-above-the-noise).
[Reuters – Bitcoin falls to its lowest in two years, November 21, 2026](https://www.reuters.com/business/bitcoin-falls-357-56814-2026-11-21/).
The central question behind this research is whether $BTC Bitcoin is experiencing another familiar market cycle transition or whether the forces shaping its current market have changed enough to make comparisons with 2021 misleading.
I want to examine this through market structure, liquidity, institutional participation, leverage, regulation, investor behaviour and Bitcoin's relationship with traditional financial markets.
One distinction will guide the entire analysis: similar price behaviour does not necessarily mean similar market conditions. To establish whether history is repeating, we need to compare the forces producing the price movements, not simply the charts.
I. THE PRICE SIMILARITY: WHAT THE CHARTS ACTUALLY SHOW
The 2021 bull market reached its November all-time high at approximately $68,789 on November 10. Bitcoin subsequently declined, closing the year at approximately $46,306. CoinGlass
https://www.coinglass.com/currencies/BTC/historical-data/2021?utm_source=chatgpt.com
However, the November peak was not the first major correction of that cycle.
In April 2021, Bitcoin had already reached approximately $64,000 before falling sharply in May. The market experienced a correction exceeding 50%, followed by several months of recovery and a new all time high in November.
This matters because 2021 demonstrated that a substantial correction did not immediately terminate the bull market.
Now consider the current cycle.
Bitcoin reached approximately $126,198 on October 6, 2025. By November 21, 2026, its price had fallen to approximately $55,830, representing a drawdown of roughly 55.8% from that high. @Coinglass +1
https://www.coinglass.com/currencies/BTC/historical-data/2025?utm_source=chatgpt.com
The 2021 May June figure is an approximate peak to trough correction. The November December figure uses Glassnode's December 2021 reported drawdown from the November ATH. The 2026 figure uses the October 2025 ATH and November 21, 2026 price.
There is a resemblance in the magnitude of the corrections, but the market's position in the cycle is different.
The October 2025 high occurred approximately 18 months after the April 2024 halving. The November 2021 high also occurred roughly 18 months after the May 2020 halving. Bitcoin +2
https://www.coinglass.com/currencies/BTC/historical-data/2025?utm_source=chatgpt.com
This is an interesting historical alignment.
Both cycles experienced a major price peak around 18 months after their respective halvings. However, the current November 2026 market is already more than a year removed from its October 2025 high.
My interpretation: Bitcoin has followed a comparable post-halving peak timeline, but the present decline has progressed into a much deeper drawdown. The four-year cycle remains a useful historical reference, not a reliable timetable for predicting the next bottom.
II. THE LIQUIDITY ENVIRONMENT: 2021 AND 2026 ARE DIFFERENT MARKETS
One of the biggest differences between these periods is the monetary environment.
In November 2021, the Federal Reserve maintained its federal funds target range at 0–0.25%.
It had also begun tapering its asset purchases, reducing monthly Treasury and mortgage-backed securities purchases by $10 billion and $5 billion, respectively. The Fed still described financial conditions as accommodative.
https://www.federalreserve.gov/newsevents/pressreleases/monetary20211103a.htm
https://www.federalreserve.gov/monetarypolicy/fomcminutes20211103.htm
This is important because Bitcoin's 2021 rally developed during an environment of exceptionally low interest rates, substantial central-bank support and abundant liquidity.
By comparison, the Federal Reserve's November 2026 data show:
Federal funds target range: 3.75–4.00%.
September PCE inflation: 3.6%.
October unemployment: 4.1%.
https://www.federalreserve.gov/
The Fed's October meeting minutes, published November 18, provide additional context on its current monetary policy considerations. federalreserve.gov
The difference is substantial.
In 2021, investors could access relatively inexpensive capital while searching for assets offering higher returns. Bitcoin and other speculative assets benefited from that environment.
In 2026, capital has a higher opportunity cost. Investors can earn returns from traditional fixed-income instruments without necessarily accepting Bitcoin's volatility.
This changes the investment decision.
When interest rates are elevated, Bitcoin must compete more directly for capital. Investors have to consider whether the expected return justifies the volatility and potential drawdown.
There is also a second consideration: monetary tightening does not affect Bitcoin in isolation. It can influence equity valuations, borrowing costs, dollar liquidity, leveraged positions and the willingness of investors to hold speculative assets.
The current decline has coincided with concerns about AI valuations, the profitability of infrastructure spending and rising borrowing costs. Reuters reported that these concerns were affecting technology stocks and broader risk assets alongside crypto.
https://www.reuters.com/business/bitcoin-falls-357-56814-2026-11-21/
This provides evidence of a broader risk repricing rather than a purely crypto specific event.
III. INSTITUTIONAL PARTICIPATION: THE BIGGEST STRUCTURAL CHANGE
Perhaps the most important difference between 2021 and 2026 is who now participates in Bitcoin's market.
In 2021, institutional adoption was already developing. Tesla, #MicroStrategy and other companies had introduced corporate Bitcoin treasury strategies. CME Bitcoin futures also provided regulated institutional exposure.
However, the US spot Bitcoin ETF market did not yet exist.
That changed in January 2024, when US spot Bitcoin ETFs began trading.
The result is a fundamentally different capital distribution system.
Investors can now obtain Bitcoin exposure through regulated investment products without directly managing private keys, operating exchange accounts or holding Bitcoin themselves.
This has expanded access through wealth managers, financial advisers and traditional investment platforms.
Consider the institutional ownership data.
According to Galaxy Research's analysis of Q3 2026 SEC Form 13F filings:
- Reporting investment managers held a record 356,491 BTC-equivalent across US spot Bitcoin ETPs as of September 30.
- They added 49,229 BTC-equivalent during Q3, reversing the 47,054 BTC-equivalent they had sold across the preceding three quarters.
- 2,166 managers reported holdings, an increase of 191 from the previous quarter.
https://www.galaxy.com/insights/research/bitcoin-etp-13f-institutional-holdings-q3-2026-wealth-channel-wells-fargo
These are meaningful figures.
But they require careful interpretation.
Form 13F reports qualifying long positions at quarter end. It does not reveal all short positions, derivatives exposure or the complete economic intentions of the reporting institutions.
A fund reporting Bitcoin ETF ownership could have an offsetting position elsewhere.
Consequently, institutional ownership figures cannot automatically be interpreted as directional bullish exposure.
The more interesting question is whether institutional access has changed Bitcoin's sensitivity to traditional financial markets.
I believe this deserves serious attention.
The ETF structure connects Bitcoin demand to portfolio allocations, wealth-management decisions, risk limits and traditional investment flows.
It also introduces another channel through which capital can leave the market.
IV. ARE INSTITUTIONS SELLING #bitcoin ?
This is where the current market becomes particularly interesting.
There is evidence of institutional selling, but the data also shows that institutional behaviour is not uniform.
@CoinDesk Research's October 2026 institutional adoption report found that:
- Combined ETP and digital-asset treasury exposure declined 10.3% to $279 billion.
- ETPs recorded $1.86 billion in net outflows.
- Corporate digital-asset treasuries added approximately $1.16 billion to their holdings.
- Bitcoin ETPs still recorded $87.4 million in October net inflows.
https://www.coindesk.com/research/digital-assets-institutional-adoption-report-october-2026
The report also estimated that publicly traded ETPs and digital asset treasury companies collectively represented approximately 13.7% of Bitcoin's circulating supply.
That is a considerable structural change compared with 2021.
But November brought a more pronounced deterioration in ETF flows.
By November 20, US spot Bitcoin #ETFs had recorded approximately $3.47 billion in net outflows for the month. The November 19 session alone produced $582.2 million in net redemptions.
https://www.theblock.co/news/markets/2026-11-20-us-spot-bitcoin-etfs-see-582-million-in-daily-net-outflows-as-november-total-nears-3-5-billion-444217
These figures indicate a meaningful reduction in ETF demand.
However, there is a distinction between three things:
- Institutions reducing exposure through ETF redemptions.
- Corporate treasuries selling Bitcoin from their balance sheets.
- Institutional investors maintaining Bitcoin exposure while hedging through derivatives.
They are different transactions with different implications.
For example, an ETF redemption can result in the fund selling Bitcoin to meet the redemption process. But it does not establish that the asset manager itself has changed its long term view of Bitcoin.
Likewise, a reduction in the dollar value of corporate Bitcoin holdings can result from falling prices rather than actual BTC sales.
This distinction is supported by October's institutional data, where much of the reduction in exposure was valuation driven.
The evidence supports institutional repositioning and weakening ETF demand. It does not yet establish a coordinated institutional exit from Bitcoin.
V. LEVERAGE AND MARKET STRUCTURE: HAVE WE LEARNED ANYTHING?
Bitcoin's 2021 market was heavily influenced by derivatives positioning.
Glassnode's December 2021 market review reported that Bitcoin futures open interest had nearly doubled over the year, increasing by $9.57 billion, or 97%.
The same research documented a major liquidation event in early December, when Bitcoin fell approximately $8,800 in one day and more than $5.4 billion in futures contracts were forcibly closed.
https://research.glassnode.com/the-week-onchain-week-52-2021/
This illustrates an important characteristic of crypto markets: price declines can become self-reinforcing when leveraged traders are forced to close positions.
Consider the mechanics:
- Bitcoin declines and leveraged long positions lose collateral.
- Exchanges liquidate positions that no longer meet margin requirements.
- Liquidations generate additional selling pressure.
- Prices decline further, exposing additional leveraged positions.
- The process can develop into a liquidation cascade.
This mechanism existed in 2021 and remains relevant in 2026.
However, we should not assume that the current market has the same leverage profile simply because prices are falling.
A proper comparison requires contemporaneous futures open interest, funding rates, perpetual futures basis, options positioning and liquidation data.
The distinction between spot selling and forced derivatives liquidation is particularly important for traders.
A market experiencing heavy spot distribution has a different underlying demand problem from one experiencing a temporary derivatives-driven liquidation cascade.
VI. THE STABLECOIN ECONOMY: A MUCH LARGER MARKET
Another structural difference is the growth of stablecoins.
According to CoinDesk Research's February 2026 industry report, stablecoin market capitalization had exceeded $300 billion, compared with less than $50 billion in early 2020.
The same report estimated that weekly stablecoin transaction volumes averaged approximately $60 billion, compared with around $30 billion during the previous cycle.
https://www.coindesk.com/research/digital-assets-2026-above-the-noise?
2020 figure represents an approximate upper reference of less than $50B; 2026 is reported as exceeding $300B. coindesk.com
Why does this matter?
Stablecoins provide settlement liquidity, trading collateral and a dollar denominated medium of exchange across crypto markets.
Their growth indicates that the ecosystem has developed a substantially larger liquidity infrastructure.
But there is an important qualification.
Stablecoin market capitalization does not equal capital waiting to purchase Bitcoin.
Stablecoins also support payments, exchange settlement, DeFi lending, liquidity pools and cross-border transfers. Some balances remain inactive or are held for purposes unrelated to directional Bitcoin investment.
Therefore, a larger stablecoin economy improves the potential capacity of crypto markets, but it does not guarantee immediate demand for BTC.
This is one area where the 2026 market has stronger underlying infrastructure than 2021, even while Bitcoin's price performance has deteriorated.
VII. REGULATION: IS GOVERNMENT POLICY REPEATING THE 2021 STORY?
Regulatory uncertainty affected Bitcoin in 2021, but the circumstances were different.
One of the most significant events was China's crackdown on cryptocurrency mining and related activities.
The restrictions triggered a major geographical redistribution of Bitcoin mining operations. Glassnode's 2021 review documented an approximately 53% mining shutdown during the migration, followed by a substantial recovery in network hash rate by year-end.
https://research.glassnode.com/the-week-onchain-week-52-2021/
That episode demonstrated that government policy could materially affect Bitcoin's mining industry, infrastructure and market sentiment.
But it did not give China control over Bitcoin's monetary policy or transaction rules.
The network continued operating.
In 2026, the regulatory environment is more developed, particularly in the United States.
Bitcoin has regulated exchange traded products, more established institutional custody channels and a broader financial services infrastructure.
However, regulatory uncertainty remains relevant.
Reuters identified political and regulatory risks following the November 2026 US midterm elections as one of several concerns affecting crypto markets.
https://www.reuters.com/business/bitcoin-falls-357-56814-2026-11-21/
We should separate three regulatory effects:
- Market access: Rules affecting whether banks, funds and investment platforms can provide crypto services.
- Capital movement: Rules affecting custody, taxation, stablecoins and institutional participation.
- Market confidence: Political uncertainty that changes expectations about the future operating environment.
These can influence Bitcoin's price without changing the underlying protocol.
There is currently insufficient evidence to attribute the November decline primarily to government attempts to control Bitcoin.
Regulatory uncertainty is a factor worth monitoring, but the contemporaneous evidence also points to macroeconomic pressure, ETF redemptions and declining risk appetite.
VIII. WHAT HAS ACTUALLY CHANGED BETWEEN THE TWO CYCLES?
The comparison becomes clearer when we separate Bitcoin's market structure from its underlying infrastructure.
Sources:
https://www.federalreserve.gov/newsevents/pressreleases/monetary20211103a.htm
https://www.federalreserve.gov/
https://www.coindesk.com/research/digital-assets-2026-above-the-noise
https://research.glassnode.com/the-week-onchain-week-52-2021/
https://www.galaxy.com/insights/research/bitcoin-etp-13f-institutional-holdings-q3-2026-wealth-channel-wells-fargo?
The table reveals something important.
Bitcoin has become more integrated into traditional financial markets, but that integration has introduced additional channels through which macroeconomic conditions and portfolio decisions can influence its price.
A larger market does not automatically mean a less volatile market.
A deeper capital base does not guarantee that investors will maintain their allocations during periods of uncertainty.
And institutional ownership does not eliminate the possibility of substantial drawdowns.
IX. SO, ARE WE REPEATING 2021?
My conclusion is that Bitcoin is repeating some of the historical cycle characteristics, but the market itself has fundamentally changed.
There are three important similarities.
First, cycle timing. Both the November 2021 and October 2025 peaks occurred approximately 18 months after their respective halvings.
Second, leverage and liquidity. Both markets demonstrate how changes in risk appetite, derivatives positioning and liquidity can accelerate price declines.
Third, institutional and macroeconomic influences. Both cycles were affected by monetary policy and changing investor expectations, although the channels through which those forces operate have expanded considerably.
But the differences are more consequential.
The 2021 market developed in an exceptionally accommodative monetary environment, with relatively limited institutional investment infrastructure.
The 2026 market has a much larger stablecoin economy, regulated spot ETFs, corporate Bitcoin treasuries and significantly deeper connections to traditional financial markets.
Yet these developments have not prevented a drawdown exceeding 55% from the October 2025 high.
That raises an important question about Bitcoin's evolving investment proposition.
Institutional adoption has expanded access and created additional sources of demand. It has also connected Bitcoin more closely to conventional portfolio allocation decisions.
When institutional investors reduce risk, Bitcoin can experience selling pressure alongside equities and other risk assets.
This does not invalidate Bitcoin's monetary properties or long-term investment thesis. It does mean that its market behaviour must be understood through a broader financial framework.
What traders should monitor next
Rather than relying on historical cycle predictions alone, I would monitor these indicators:
These indicators should be evaluated together. No single one establishes that a market bottom or recovery has arrived.
X. THE FINAL THESIS
Bitcoin's current decline deserves to be examined beyond the familiar four-year cycle narrative.
The 2021 market was shaped by retail speculation, expanding derivatives exposure, pandemic-era liquidity and an emerging institutional market.
The 2026 market operates with a substantially different financial architecture. ETFs, corporate treasuries, stablecoins, institutional custody and traditional investment platforms now play much larger roles.
But institutional participation has not made Bitcoin immune to traditional financial conditions. If anything, it has created additional transmission channels between conventional markets and crypto.
The current evidence points to weakening ETF demand, a more restrictive monetary environment than in 2021, and a broader reassessment of risk assets. Corporate accumulation and institutional ownership data also demonstrate that capital is not moving in one direction.
I would therefore resist declaring that the four-year cycle has been invalidated or that Bitcoin must repeat the 2021–2022 bear market.
The more useful conclusion is that historical cycle patterns remain relevant, but the market structure producing them has evolved.
Bitcoin has become more institutional without becoming less exposed to market risk.
And that may be the most important distinction traders need to understand when comparing 2021 with 2026.
Independent research. Not financial advice. Data and market conditions referenced through November 21, 2026.
Research references and verification
[CoinGlass – Bitcoin historical price data, 2021](https://www.coinglass.com/currencies/BTC/historical-data/2021)
[CoinGlass – Bitcoin historical price data, 2025–2026](https://www.coinglass.com/currencies/BTC/historical-data/2025).
[Glassnode – The Week Onchain, Week 52, 2021](https://research.glassnode.com/the-week-onchain-week-52-2021/).
[Glassnode – The Week Onchain, Week 49, 2021](https://research.glassnode.com/week-onchain-week-49-2021/).
[Federal Reserve – November 3, 2021 FOMC statement](https://www.federalreserve.gov/newsevents/pressreleases/monetary20211103a.htm).
[Federal Reserve – Current economic indicators, November 2026](https://www.federalreserve.gov/).
[Galaxy Research – Institutional Holdings of Bitcoin ETPs Reach New All-Time High, November 19,](https://www.galaxy.com/insights/research/bitcoin-etp-13f-institutional-holdings-q3-2026-wealth-channel-wells-fargo).
[CoinDesk Research – Digital Assets Institutional Adoption, October 2026](https://www.coindesk.com/research/digital-assets-institutional-adoption-report-october-2026?).
[CoinDesk Research – Digital Assets 2026: Above the Noise](https://www.coindesk.com/research/digital-assets-2026-above-the-noise).
[Reuters – Bitcoin falls to its lowest in two years, November 21, 2026](https://www.reuters.com/business/bitcoin-falls-357-56814-2026-11-21/).
1
696

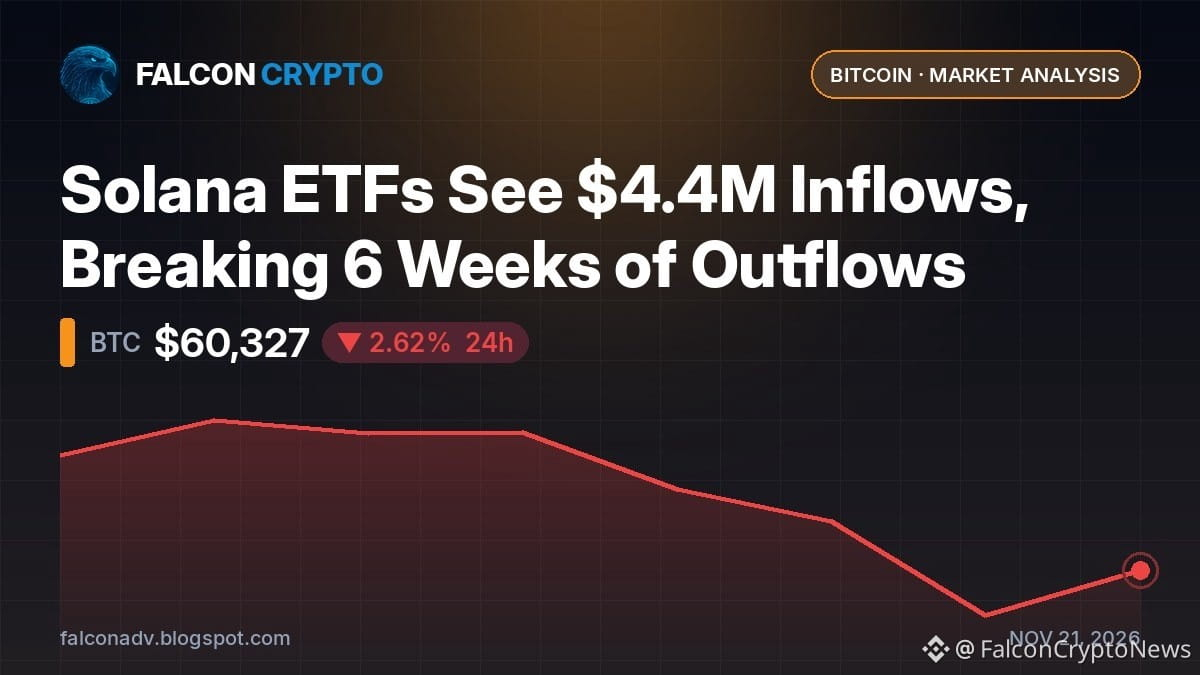
🚀 Solana ETFs defied the broader crypto market's sell-off last week, attracting a notable $4.4 million in inflows!
📌 This crucial injection of capital ended a six-week consecutive period of withdrawals for Solana-focused funds, a stark contrast to the billions exiting Bitcoin ($BTC) and Ethereum ($ETH) ETFs.
📊 While the majority of this $4.4M came in a single day, it hints at specific institutional interest in the Solana ecosystem. Despite a slight 24h dip for $SOL at $70.61, this inflow suggests underlying support.
⚠️ However, with $BTC at $60,327 and $ETH at $1,692, the overall market remains under pressure. Is this a sign of Solana's resilience or just a temporary anomaly?
👀 What do you think this means for Solana's future amidst the wider crypto volatility? Share your insights!
#Solana #ETFs #CryptoNews
📖 Full analysis: https://falconadv.blogspot.com/2026/11/solana-etfs-see-44m-inflows-breaking-6.html
🚀 Solana ETFs defied the broader crypto market's sell-off last week, attracting a notable $4.4 million in inflows!
📌 This crucial injection of capital ended a six-week consecutive period of withdrawals for Solana-focused funds, a stark contrast to the billions exiting Bitcoin ($BTC ) and Ethereum ($ETH ) ETFs.
📊 While the majority of this $4.4M came in a single day, it hints at specific institutional interest in the Solana ecosystem. Despite a slight 24h dip for $SOL at $70.61, this inflow suggests underlying support.
⚠️ However, with $BTC at $60,327 and $ETH at $1,692, the overall market remains under pressure. Is this a sign of Solana's resilience or just a temporary anomaly?
👀 What do you think this means for Solana's future amidst the wider crypto volatility? Share your insights!
#Solana #ETFs #CryptoNews
📖 Full analysis: https://falconadv.blogspot.com/2026/11/solana-etfs-see-44m-inflows-breaking-6.html
📌 This crucial injection of capital ended a six-week consecutive period of withdrawals for Solana-focused funds, a stark contrast to the billions exiting Bitcoin ($BTC ) and Ethereum ($ETH ) ETFs.
📊 While the majority of this $4.4M came in a single day, it hints at specific institutional interest in the Solana ecosystem. Despite a slight 24h dip for $SOL at $70.61, this inflow suggests underlying support.
⚠️ However, with $BTC at $60,327 and $ETH at $1,692, the overall market remains under pressure. Is this a sign of Solana's resilience or just a temporary anomaly?
👀 What do you think this means for Solana's future amidst the wider crypto volatility? Share your insights!
#Solana #ETFs #CryptoNews
📖 Full analysis: https://falconadv.blogspot.com/2026/11/solana-etfs-see-44m-inflows-breaking-6.html
1
77

BlackRock just had its worst day ever with Bitcoin.
$541M walked out of IBIT on Thursday — the biggest single-day exit since the fund launched in January 2024. That alone was 93% of the $582M that left all US spot Bitcoin ETFs that day. November's total outflow is now around $3.5B.
And $BTC is feeling it. It's sitting right on $60K tonight — about $60,129 on Binance spot, down about 5% in the last 24 hours, with a big liquidation cluster sitting just under that line.
Fear & Greed is still at 12. Extreme fear, day after day.
Not financial advice. DYOR.
#Bitcoin #Crypto #ETFs
BlackRock just had its worst day ever with Bitcoin.
$541M walked out of IBIT on Thursday — the biggest single-day exit since the fund launched in January 2024. That alone was 93% of the $582M that left all US spot Bitcoin ETFs that day. November's total outflow is now around $3.5B.
And $BTC is feeling it. It's sitting right on $60K tonight — about $60,129 on Binance spot, down about 5% in the last 24 hours, with a big liquidation cluster sitting just under that line.
Fear & Greed is still at 12. Extreme fear, day after day.
Not financial advice. DYOR.
#Bitcoin #Crypto #ETFs
$541M walked out of IBIT on Thursday — the biggest single-day exit since the fund launched in January 2024. That alone was 93% of the $582M that left all US spot Bitcoin ETFs that day. November's total outflow is now around $3.5B.
And $BTC is feeling it. It's sitting right on $60K tonight — about $60,129 on Binance spot, down about 5% in the last 24 hours, with a big liquidation cluster sitting just under that line.
Fear & Greed is still at 12. Extreme fear, day after day.
Not financial advice. DYOR.
#Bitcoin #Crypto #ETFs
1
Funny how the story flips depending on which window you look through.
Everyone's been watching spot ETFs bleed $2.9B this month — and fair enough, that's real money walking out the door.
But Galaxy Research just dropped the Q3 13F numbers, and they tell a very different story. Institutions added 49,229 BTC through spot ETFs between July and September — about $4.1B of net buying, wiping out three straight quarters of selling in one go. Total reported holdings hit a record 356,491 BTC.
Wells Fargo led the charge, adding 14,636 BTC. It's now the biggest institutional holder at 30,553 BTC. And BlackRock's IBIT still holds two-thirds of the whole institutional pile.
Honest caveat: these filings are a September 30 snapshot, and a lot has changed since — the funds have shed 38,531 BTC since then. But the big money was buying the dip all summer while everyone else was waiting for it.
$BTC is at ~$61,766 right now (Binance spot, -3.4% today, day range $61,230–$64,052). The institutions bought between $57K and $87K. They're still here.
Not financial advice. DYOR.
#Bitcoin #Crypto #ETFs
Funny how the story flips depending on which window you look through.
Everyone's been watching spot ETFs bleed $2.9B this month — and fair enough, that's real money walking out the door.
But Galaxy Research just dropped the Q3 13F numbers, and they tell a very different story. Institutions added 49,229 BTC through spot ETFs between July and September — about $4.1B of net buying, wiping out three straight quarters of selling in one go. Total reported holdings hit a record 356,491 BTC.
Wells Fargo led the charge, adding 14,636 BTC. It's now the biggest institutional holder at 30,553 BTC. And BlackRock's IBIT still holds two-thirds of the whole institutional pile.
Honest caveat: these filings are a September 30 snapshot, and a lot has changed since — the funds have shed 38,531 BTC since then. But the big money was buying the dip all summer while everyone else was waiting for it.
$BTC is at ~$61,766 right now (Binance spot, -3.4% today, day range $61,230–$64,052). The institutions bought between $57K and $87K. They're still here.
Not financial advice. DYOR.
#Bitcoin #Crypto #ETFs
Everyone's been watching spot ETFs bleed $2.9B this month — and fair enough, that's real money walking out the door.
But Galaxy Research just dropped the Q3 13F numbers, and they tell a very different story. Institutions added 49,229 BTC through spot ETFs between July and September — about $4.1B of net buying, wiping out three straight quarters of selling in one go. Total reported holdings hit a record 356,491 BTC.
Wells Fargo led the charge, adding 14,636 BTC. It's now the biggest institutional holder at 30,553 BTC. And BlackRock's IBIT still holds two-thirds of the whole institutional pile.
Honest caveat: these filings are a September 30 snapshot, and a lot has changed since — the funds have shed 38,531 BTC since then. But the big money was buying the dip all summer while everyone else was waiting for it.
$BTC is at ~$61,766 right now (Binance spot, -3.4% today, day range $61,230–$64,052). The institutions bought between $57K and $87K. They're still here.
Not financial advice. DYOR.
#Bitcoin #Crypto #ETFs
BTC+2.15%
IBITETF-4.95%
2
Third day in a row, same story.
US spot Bitcoin ETFs bled another $582M on Thursday. Add Tuesday's $240M and Wednesday's $306M and that's over $1.1B out in three days — nearly $2.9B gone in November alone.
And yet $BTC is still sitting at $61,814, holding above this morning's $61,290 low. The sellers are loud, but nobody's let $60K go yet. Fear & Greed is still parked at 12.
If the flows flip green, the whole mood changes fast. Until then, it's a waiting game.
Not financial advice. DYOR.
#Bitcoin #Crypto #ETFs
Third day in a row, same story.
US spot Bitcoin ETFs bled another $582M on Thursday. Add Tuesday's $240M and Wednesday's $306M and that's over $1.1B out in three days — nearly $2.9B gone in November alone.
And yet $BTC is still sitting at $61,814, holding above this morning's $61,290 low. The sellers are loud, but nobody's let $60K go yet. Fear & Greed is still parked at 12.
If the flows flip green, the whole mood changes fast. Until then, it's a waiting game.
Not financial advice. DYOR.
#Bitcoin #Crypto #ETFs
US spot Bitcoin ETFs bled another $582M on Thursday. Add Tuesday's $240M and Wednesday's $306M and that's over $1.1B out in three days — nearly $2.9B gone in November alone.
And yet $BTC is still sitting at $61,814, holding above this morning's $61,290 low. The sellers are loud, but nobody's let $60K go yet. Fear & Greed is still parked at 12.
If the flows flip green, the whole mood changes fast. Until then, it's a waiting game.
Not financial advice. DYOR.
#Bitcoin #Crypto #ETFs
1

·
--
Bullish
⚡ Institutional Inflows: Ethereum ($ETH ) Holding Key Ground as ETF Momentum Builds! 📈
While retail traders chase day-to-day hype, institutional investors are playing a long-term game with Ethereum ($ETH). Global spot Ethereum ETFs, staking protocols, and layer-2 scaling solutions continue to build a formidable foundation.
🔍 Why Ethereum Remains the Institutional Benchmark:
1️⃣ Sustained ETF Inflows: Institutional demand is quietly soaking up supply from secondary markets directly into regulated spot Ethereum funds, adding long-term price support.
2️⃣ Staking Deflation: Over 30 million $ETH is currently locked in staking contracts, removing substantial supply from immediate market circulation.
3️⃣ Layer-2 Scaling Surge: Networks like Arbitrum, Optimism, and Base are driving massive transaction volumes, while mainnet Ethereum captures the base settlement value.
💡 Strategic Perspective:
In crypto, patience often outperforms panic. Watching major institutional inflow trends and staking metrics provides clarity when short-term volatility creates market noise.
Are you accumulating $ETH, staking for yield, or focusing on L2 ecosystems? Drop your perspective in the comments! 👇
#ETH #CryptoAnalysis #InstitutionalCrypto #ETFs #BinanceSquare $ETH
{spot}(ETHUSDT)
⚡ Institutional Inflows: Ethereum ($ETH ) Holding Key Ground as ETF Momentum Builds! 📈
While retail traders chase day-to-day hype, institutional investors are playing a long-term game with Ethereum ($ETH ). Global spot Ethereum ETFs, staking protocols, and layer-2 scaling solutions continue to build a formidable foundation.
🔍 Why Ethereum Remains the Institutional Benchmark:
1️⃣ Sustained ETF Inflows: Institutional demand is quietly soaking up supply from secondary markets directly into regulated spot Ethereum funds, adding long-term price support.
2️⃣ Staking Deflation: Over 30 million $ETH is currently locked in staking contracts, removing substantial supply from immediate market circulation.
3️⃣ Layer-2 Scaling Surge: Networks like Arbitrum, Optimism, and Base are driving massive transaction volumes, while mainnet Ethereum captures the base settlement value.
💡 Strategic Perspective:
In crypto, patience often outperforms panic. Watching major institutional inflow trends and staking metrics provides clarity when short-term volatility creates market noise.
Are you accumulating $ETH , staking for yield, or focusing on L2 ecosystems? Drop your perspective in the comments! 👇
#ETH #CryptoAnalysis #InstitutionalCrypto #ETFs #BinanceSquare $ETH
While retail traders chase day-to-day hype, institutional investors are playing a long-term game with Ethereum ($ETH ). Global spot Ethereum ETFs, staking protocols, and layer-2 scaling solutions continue to build a formidable foundation.
🔍 Why Ethereum Remains the Institutional Benchmark:
1️⃣ Sustained ETF Inflows: Institutional demand is quietly soaking up supply from secondary markets directly into regulated spot Ethereum funds, adding long-term price support.
2️⃣ Staking Deflation: Over 30 million $ETH is currently locked in staking contracts, removing substantial supply from immediate market circulation.
3️⃣ Layer-2 Scaling Surge: Networks like Arbitrum, Optimism, and Base are driving massive transaction volumes, while mainnet Ethereum captures the base settlement value.
💡 Strategic Perspective:
In crypto, patience often outperforms panic. Watching major institutional inflow trends and staking metrics provides clarity when short-term volatility creates market noise.
Are you accumulating $ETH , staking for yield, or focusing on L2 ecosystems? Drop your perspective in the comments! 👇
#ETH #CryptoAnalysis #InstitutionalCrypto #ETFs #BinanceSquare $ETH

1
49

Custody consolidation is becoming a quiet trend among major ETF issuers. Moving assets to a single provider streamlines operations and reflects the maturing infrastructure behind these institutional products. As traditional finance deepens its crypto footprint, behind-the-scenes plumbing like custody choices matters just as much as price action. Efficiency and security are the real winners here. $BTC $ETH $SOL #Bitcoin #CryptoCustody #ETFs
Custody consolidation is becoming a quiet trend among major ETF issuers. Moving assets to a single provider streamlines operations and reflects the maturing infrastructure behind these institutional products. As traditional finance deepens its crypto footprint, behind-the-scenes plumbing like custody choices matters just as much as price action. Efficiency and security are the real winners here. $BTC $ETH $SOL #Bitcoin #CryptoCustody #ETFs
54

·
--
🚨 $BTC hovers $61,735 (-2.6% 24h) as institutions flood US ETFs – dip over?
Big money is back. After a weeks‑long sell‑off, major asset managers filed fresh applications for Bitcoin ETFs, pushing $BTC back into the spotlight.
The price retest at $61,735 tests the $62,500 psychological ceiling while the $60,000 support holds firm, hinting at a possible swing back.
• 📊 Price: $61,735 (‑2.6% 24h)
• 🎯 Key levels: $62,500 resistance, $60,000 support
• 💰 Volume: $1.35B 24h, still robust amid “Extreme Fear” (FGI 12)
• 🔄 Correlated moves: $ETH down 3.7% at $1,732, $SOL slipping to $72.5
If institutions lock in more capital, the dip could be a short‑term shakeout. If the ETF pipeline stalls, we may see another wave of sell pressure.
Bullish long‑term or short‑term noise? Share your thoughts below 👇
$BTC $ETH $SOL #Crypto #Bitcoin #ETFs
🚨 $BTC hovers $61,735 (-2.6% 24h) as institutions flood US ETFs – dip over?
Big money is back. After a weeks‑long sell‑off, major asset managers filed fresh applications for Bitcoin ETFs, pushing $BTC back into the spotlight.
The price retest at $61,735 tests the $62,500 psychological ceiling while the $60,000 support holds firm, hinting at a possible swing back.
• 📊 Price: $61,735 (‑2.6% 24h)
• 🎯 Key levels: $62,500 resistance, $60,000 support
• 💰 Volume: $1.35B 24h, still robust amid “Extreme Fear” (FGI 12)
• 🔄 Correlated moves: $ETH down 3.7% at $1,732, $SOL slipping to $72.5
If institutions lock in more capital, the dip could be a short‑term shakeout. If the ETF pipeline stalls, we may see another wave of sell pressure.
Bullish long‑term or short‑term noise? Share your thoughts below 👇
$BTC $ETH $SOL #Crypto #Bitcoin #ETFs
Big money is back. After a weeks‑long sell‑off, major asset managers filed fresh applications for Bitcoin ETFs, pushing $BTC back into the spotlight.
The price retest at $61,735 tests the $62,500 psychological ceiling while the $60,000 support holds firm, hinting at a possible swing back.
• 📊 Price: $61,735 (‑2.6% 24h)
• 🎯 Key levels: $62,500 resistance, $60,000 support
• 💰 Volume: $1.35B 24h, still robust amid “Extreme Fear” (FGI 12)
• 🔄 Correlated moves: $ETH down 3.7% at $1,732, $SOL slipping to $72.5
If institutions lock in more capital, the dip could be a short‑term shakeout. If the ETF pipeline stalls, we may see another wave of sell pressure.
Bullish long‑term or short‑term noise? Share your thoughts below 👇
$BTC $ETH $SOL #Crypto #Bitcoin #ETFs
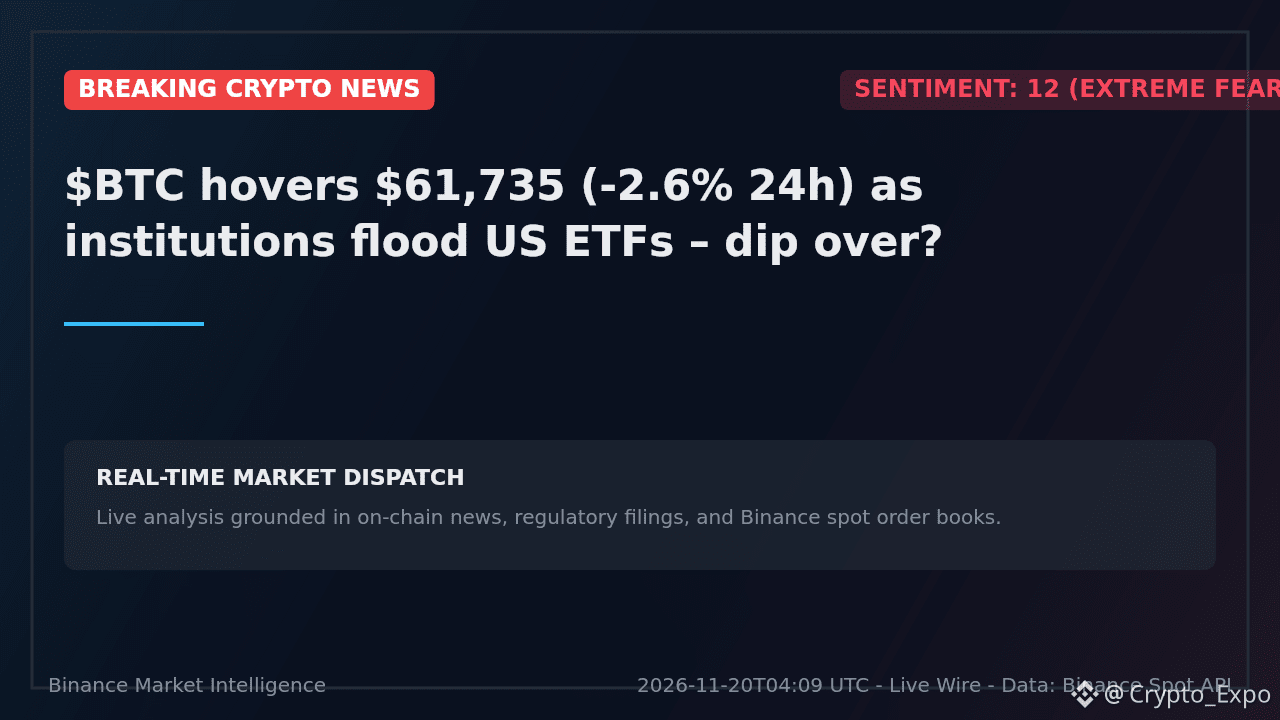
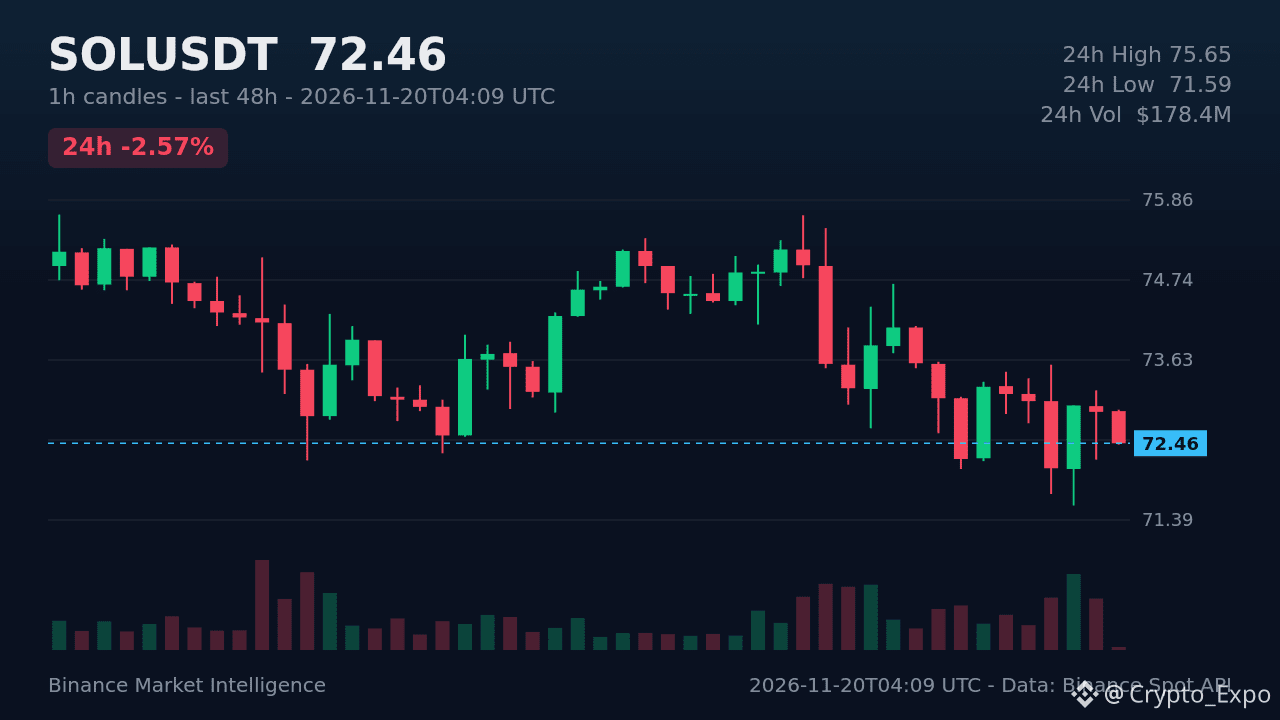
41

·
--

Article
🚨 CRYPTO MARKET TODAY | Nov 20, 2026Bitcoin Approaches $60,000 as ETF Outflows Surpass $2.5 Billion in 2026
The crypto bear market continues. Investors are reducing exposure as pressure builds across all markets.
📉 Market Update:
Bitcoin (BTC): $61,635.18 | -2.15%
Ethereum (ETH): $1,745.57 | -1.64%
Solana (SOL): $72.47 | -1.56%
🔍 What's Driving The Market?
1. Fed minutes reinforced expectations of further rate hikes 2. Wall Street sell-off - all major indexes down 2%+ 3. U.S. Spot Bitcoin ETFs recorded $300M+ outflows in a single day, pushing 2026 total outflows past $2.5B. ETF assets have now fallen to a 3-month low.
⚠️ Key Level To Watch:
$60,000 is the critical support for Bitcoin. A decisive break below could trigger further pressure across the entire market.
Smart money doesn't panic - it watches for capital returning, selling pressure fading, and key levels being reclaimed.
Do you think Bitcoin will hold $60K or break below? 👇 Comment your view.#bitcoin #solana #Ethereum #CryptoMarketAlert #ETFs
🚨 CRYPTO MARKET TODAY | Nov 20, 2026
Bitcoin Approaches $60,000 as ETF Outflows Surpass $2.5 Billion in 2026
The crypto bear market continues. Investors are reducing exposure as pressure builds across all markets.
📉 Market Update:
Bitcoin (BTC): $61,635.18 | -2.15%
Ethereum (ETH): $1,745.57 | -1.64%
Solana (SOL): $72.47 | -1.56%
🔍 What's Driving The Market?
1. Fed minutes reinforced expectations of further rate hikes 2. Wall Street sell-off - all major indexes down 2%+ 3. U.S. Spot Bitcoin ETFs recorded $300M+ outflows in a single day, pushing 2026 total outflows past $2.5B. ETF assets have now fallen to a 3-month low.
⚠️ Key Level To Watch:
$60,000 is the critical support for Bitcoin. A decisive break below could trigger further pressure across the entire market.
Smart money doesn't panic - it watches for capital returning, selling pressure fading, and key levels being reclaimed.
Do you think Bitcoin will hold $60K or break below? 👇 Comment your view.#bitcoin #solana #Ethereum #CryptoMarketAlert #ETFs
The crypto bear market continues. Investors are reducing exposure as pressure builds across all markets.
📉 Market Update:
Bitcoin (BTC): $61,635.18 | -2.15%
Ethereum (ETH): $1,745.57 | -1.64%
Solana (SOL): $72.47 | -1.56%
🔍 What's Driving The Market?
1. Fed minutes reinforced expectations of further rate hikes 2. Wall Street sell-off - all major indexes down 2%+ 3. U.S. Spot Bitcoin ETFs recorded $300M+ outflows in a single day, pushing 2026 total outflows past $2.5B. ETF assets have now fallen to a 3-month low.
⚠️ Key Level To Watch:
$60,000 is the critical support for Bitcoin. A decisive break below could trigger further pressure across the entire market.
Smart money doesn't panic - it watches for capital returning, selling pressure fading, and key levels being reclaimed.
Do you think Bitcoin will hold $60K or break below? 👇 Comment your view.#bitcoin #solana #Ethereum #CryptoMarketAlert #ETFs
79
Honestly, the ETF numbers explain a lot of this week's pain.
US spot Bitcoin ETFs have now bled about $2.9 billion in November alone — $306 million of that just on Wednesday. That's the second straight week of outflows over $1 billion.
Meanwhile $BTC is sitting at ~$62,200, down 23% in a month, and the Fear & Greed index is stuck in extreme fear at 10-12.
The flip side? Every big outflow week eventually ends. The question is whether $60K holds first.
Not financial advice. DYOR.
#Bitcoin #Crypto #ETFs
Honestly, the ETF numbers explain a lot of this week's pain.
US spot Bitcoin ETFs have now bled about $2.9 billion in November alone — $306 million of that just on Wednesday. That's the second straight week of outflows over $1 billion.
Meanwhile $BTC is sitting at ~$62,200, down 23% in a month, and the Fear & Greed index is stuck in extreme fear at 10-12.
The flip side? Every big outflow week eventually ends. The question is whether $60K holds first.
Not financial advice. DYOR.
#Bitcoin #Crypto #ETFs
US spot Bitcoin ETFs have now bled about $2.9 billion in November alone — $306 million of that just on Wednesday. That's the second straight week of outflows over $1 billion.
Meanwhile $BTC is sitting at ~$62,200, down 23% in a month, and the Fear & Greed index is stuck in extreme fear at 10-12.
The flip side? Every big outflow week eventually ends. The question is whether $60K holds first.
Not financial advice. DYOR.
#Bitcoin #Crypto #ETFs
2
The launch of 24/7 futures tied to traditional spot Bitcoin ETFs marks a fascinating shift for market connectivity. By bridging the gap while traditional stock exchanges remain closed, traders gain continuous synthetic exposure. However, operating perpetual contracts outside traditional market hours introduces unique liquidity and risk dynamics, especially when tracking assets that rely on standard settlement windows. It highlights the growing fusion of traditional finance and crypto rails. $BTC #Binance #Bitcoin #ETFs
The launch of 24/7 futures tied to traditional spot Bitcoin ETFs marks a fascinating shift for market connectivity. By bridging the gap while traditional stock exchanges remain closed, traders gain continuous synthetic exposure. However, operating perpetual contracts outside traditional market hours introduces unique liquidity and risk dynamics, especially when tracking assets that rely on standard settlement windows. It highlights the growing fusion of traditional finance and crypto rails. $BTC #Binance #Bitcoin #ETFs
8

·
--
From a different angle than BTC’s drop and one company’s buying: Galaxy’s analysis of 13F filings recorded a net addition equivalent to 49,229 bitcoin for spot bitcoin funds in Q3, bringing the total to a record 356,491 bitcoin equivalent as of September 30. But this is a quarterly snapshot, not today’s flows. What’s your take? 📊🧾👀
$BTC #Bitcoin #ETFs
From a different angle than BTC’s drop and one company’s buying: Galaxy’s analysis of 13F filings recorded a net addition equivalent to 49,229 bitcoin for spot bitcoin funds in Q3, bringing the total to a record 356,491 bitcoin equivalent as of September 30. But this is a quarterly snapshot, not today’s flows. What’s your take? 📊🧾👀
$BTC #Bitcoin #ETFs
$BTC #Bitcoin #ETFs

70

·
--
Bullish
Partly True
$PEPE is going all in. This December, Canary Capital will find out whether the ETF for $PEPE gets approved. While skeptics sell, others are buying. Everyone is divided, but there will only be one winner in the end. Buyers could celebrate Christmas 🎄🎄🎁 if #ETFs gets approved, but if it doesn't, sellers will celebrate. The question is: what will happen? Who will win??? All the coins are falling, and a rally seems impossible, but $PEPE has shown that nothing is impossible in this life.
I'm going to save this post until D-day 😅.
Follow me so you don't miss out on crypto content and signals.
{spot}(PEPEUSDT)
$PEPE is going all in. This December, Canary Capital will find out whether the ETF for $PEPE gets approved. While skeptics sell, others are buying. Everyone is divided, but there will only be one winner in the end. Buyers could celebrate Christmas 🎄🎄🎁 if #ETFs gets approved, but if it doesn't, sellers will celebrate. The question is: what will happen? Who will win??? All the coins are falling, and a rally seems impossible, but $PEPE has shown that nothing is impossible in this life.
I'm going to save this post until D-day 😅.
Follow me so you don't miss out on crypto content and signals.
I'm going to save this post until D-day 😅.
Follow me so you don't miss out on crypto content and signals.
7
2.7k

🚨 $BTC INSTITUTIONS BREAK ETF RECORD IN THE THIRD QUARTER
While the market searches for direction, the data reveal an institutional avalanche:
• Institutional holdings of Bitcoin ETFs reached 356,491 BTC, the highest level ever recorded.
• They added 49,229 BTC in Q3, surpassing the combined loss of 47,054 BTC over the previous three quarters.
• More than half of the net positive inflows came from wealth advisors and platforms.
Do you think this institutional surge will push $BTC to new highs, or is it just a pause before the correction? 👇
$BTC
#Bitcoin #ETFs #Institutional
🚨 $BTC INSTITUTIONS BREAK ETF RECORD IN THE THIRD QUARTER
While the market searches for direction, the data reveal an institutional avalanche:
• Institutional holdings of Bitcoin ETFs reached 356,491 BTC, the highest level ever recorded.
• They added 49,229 BTC in Q3, surpassing the combined loss of 47,054 BTC over the previous three quarters.
• More than half of the net positive inflows came from wealth advisors and platforms.
Do you think this institutional surge will push $BTC to new highs, or is it just a pause before the correction? 👇
$BTC
#Bitcoin #ETFs #Institutional
While the market searches for direction, the data reveal an institutional avalanche:
• Institutional holdings of Bitcoin ETFs reached 356,491 BTC, the highest level ever recorded.
• They added 49,229 BTC in Q3, surpassing the combined loss of 47,054 BTC over the previous three quarters.
• More than half of the net positive inflows came from wealth advisors and platforms.
Do you think this institutional surge will push $BTC to new highs, or is it just a pause before the correction? 👇
$BTC
#Bitcoin #ETFs #Institutional

94

🚨 $BTC INSTITUTIONS BREAK ETF RECORD IN THE THIRD QUARTER
As the market searches for direction, the data reveal an institutional influx:
• Institutional holdings of Bitcoin ETFs reached 356,491 BTC, the highest level on record.
• They added 49,229 BTC in Q3, surpassing the combined loss of 47,054 BTC across the previous three quarters.
• More than half of the positive net flows came from wealth advisors and platforms.
Do you think this institutional surge will push $BTC to new highs, or is it just a pause before the correction? 👇
$BTC
#Bitcoin #ETFs #Institutional
🚨 $BTC INSTITUTIONS BREAK ETF RECORD IN THE THIRD QUARTER
As the market searches for direction, the data reveal an institutional influx:
• Institutional holdings of Bitcoin ETFs reached 356,491 BTC, the highest level on record.
• They added 49,229 BTC in Q3, surpassing the combined loss of 47,054 BTC across the previous three quarters.
• More than half of the positive net flows came from wealth advisors and platforms.
Do you think this institutional surge will push $BTC to new highs, or is it just a pause before the correction? 👇
$BTC
#Bitcoin #ETFs #Institutional
As the market searches for direction, the data reveal an institutional influx:
• Institutional holdings of Bitcoin ETFs reached 356,491 BTC, the highest level on record.
• They added 49,229 BTC in Q3, surpassing the combined loss of 47,054 BTC across the previous three quarters.
• More than half of the positive net flows came from wealth advisors and platforms.
Do you think this institutional surge will push $BTC to new highs, or is it just a pause before the correction? 👇
$BTC
#Bitcoin #ETFs #Institutional

1
78
·
--
🚨 **$ZEC ETF listing in Texas – Catapult or Hype?**
Bitwise just filed to list a Zcash ETF on a Texas Stock Exchange. If approved, $ZEC could see fresh institutional capital while the market wrestles with Extreme Fear sentiment.
📊 Market & Token Impact
• $ZEC drops 1.1% to $939.48, testing support near $914.28 📉
• Resistance at $973.87 may hold a bounce if ETF news fuels buying 💹
• $BTC steadies around $64.2k amid -1.16% 24h move, keeping risk‑off bias ⚠️
• Fear‑Greed Index at 11 (Extreme Fear) – a potential catalyst for contrarian plays 📈
Bullish long‑term or short‑term noise? Share your thoughts below 👇
$ZEC $BTC #Crypto #Altcoins #ETFs
🚨 **$ZEC ETF listing in Texas – Catapult or Hype?**
Bitwise just filed to list a Zcash ETF on a Texas Stock Exchange. If approved, $ZEC could see fresh institutional capital while the market wrestles with Extreme Fear sentiment.
📊 Market & Token Impact
• $ZEC drops 1.1% to $939.48, testing support near $914.28 📉
• Resistance at $973.87 may hold a bounce if ETF news fuels buying 💹
• $BTC steadies around $64.2k amid -1.16% 24h move, keeping risk‑off bias ⚠️
• Fear‑Greed Index at 11 (Extreme Fear) – a potential catalyst for contrarian plays 📈
Bullish long‑term or short‑term noise? Share your thoughts below 👇
$ZEC $BTC #Crypto #Altcoins #ETFs
Bitwise just filed to list a Zcash ETF on a Texas Stock Exchange. If approved, $ZEC could see fresh institutional capital while the market wrestles with Extreme Fear sentiment.
📊 Market & Token Impact
• $ZEC drops 1.1% to $939.48, testing support near $914.28 📉
• Resistance at $973.87 may hold a bounce if ETF news fuels buying 💹
• $BTC steadies around $64.2k amid -1.16% 24h move, keeping risk‑off bias ⚠️
• Fear‑Greed Index at 11 (Extreme Fear) – a potential catalyst for contrarian plays 📈
Bullish long‑term or short‑term noise? Share your thoughts below 👇
$ZEC $BTC #Crypto #Altcoins #ETFs
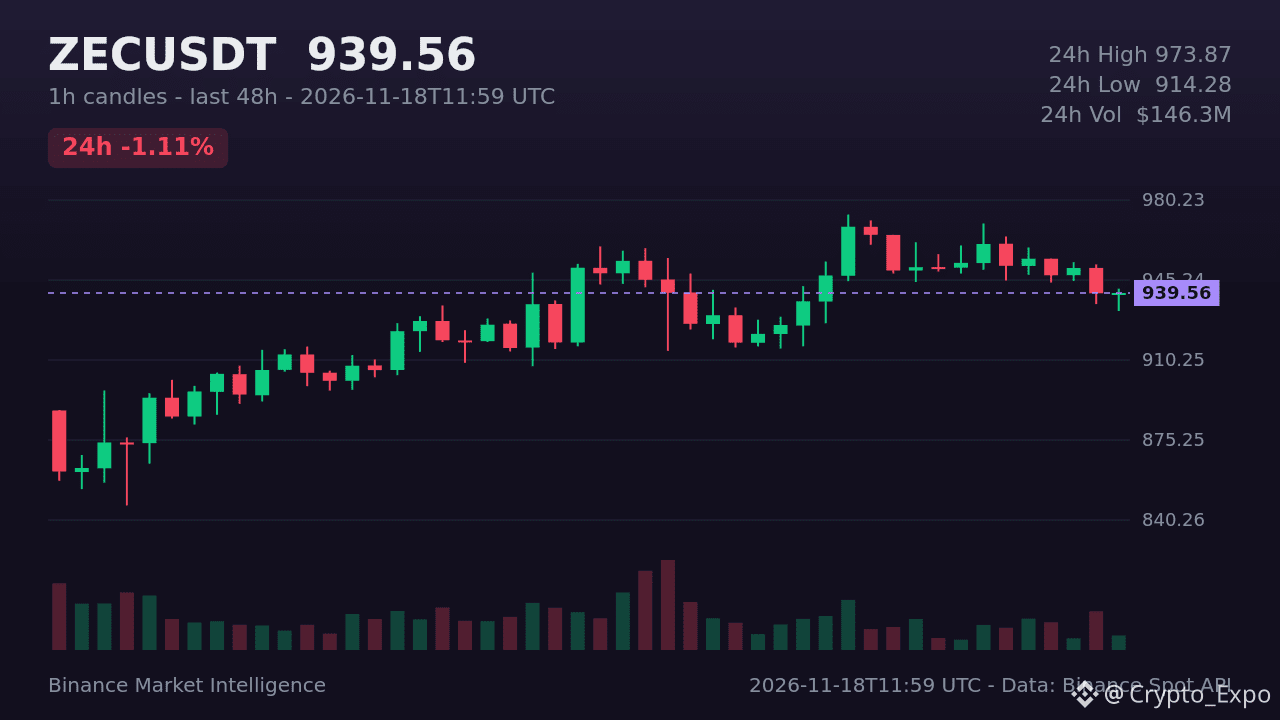
7

·
--
Bullish
Verified
@Square-Creator-8ec6c5316f27 , you're telling us about an interesting launch in the stock market. It's Teucrium's VEN ETF, which offers indirect exposure to a potential economic recovery in Venezuela through international companies linked to the country. However, it is not without risks, so analyzing its composition, costs, and geopolitical context will be essential before investing.
$CVX $SHELL $KO
#BinanceSquare #venezuela #ETFs #NYSEArca
@MaryCR , you're telling us about an interesting launch in the stock market. It's Teucrium's VEN ETF, which offers indirect exposure to a potential economic recovery in Venezuela through international companies linked to the country. However, it is not without risks, so analyzing its composition, costs, and geopolitical context will be essential before investing.
$CVX $SHELL $KO
#BinanceSquare #venezuela #ETFs #NYSEArca
$CVX $SHELL $KO
#BinanceSquare #venezuela #ETFs #NYSEArca

MaryCR
·
--
Did you know an ETF with exposure to Venezuela just debuted on Wall Street? Meet VEN 🔍
A Wall Street launch that’s generating quite a bit of buzz really caught my attention: the first Venezuela-linked exchange-traded fund (ETF) has started trading. On November 18, 2026, U.S. firm Teucrium launched the Teucrium Venezuela Future Opportunities ETF, which trades on the NYSE Arca exchange under the ticker VEN. The fund tracks an index developed by index provider MarketVector.
When you read the name for the first time, it’s natural to think it’s a fund packed with Venezuelan companies listed on the Caracas Stock Exchange. But when you take a closer look at the fine print and the fund’s actual holdings, you find something quite interesting: they aren’t Venezuelan local stocks, but large international corporations with operations, licenses, assets, or business ties connected to Venezuela.
When you read the name for the first time, it’s natural to think it’s a fund packed with Venezuelan companies listed on the Caracas Stock Exchange. But when you take a closer look at the fine print and the fund’s actual holdings, you find something quite interesting: they aren’t Venezuelan local stocks, but large international corporations with operations, licenses, assets, or business ties connected to Venezuela.

292
Spot BTC ETFs flipped back to red fast 📉
Just one day after a $7.9M inflow ended 7 straight days of outflows, US spot Bitcoin ETFs saw $239.9M in net outflows on Nov 17.
BlackRock's IBIT led the exit with $209.5M out — after taking in $76.5M the day before. Spot ETH ETFs lost $29.1M too.
$BTC still holding ~$64,700, flat on the day. One green day does not make a trend — watch the next flow print before calling a bottom.
Not financial advice. DYOR.
#Bitcoin #Crypto #ETFs
Spot BTC ETFs flipped back to red fast 📉
Just one day after a $7.9M inflow ended 7 straight days of outflows, US spot Bitcoin ETFs saw $239.9M in net outflows on Nov 17.
BlackRock's IBIT led the exit with $209.5M out — after taking in $76.5M the day before. Spot ETH ETFs lost $29.1M too.
$BTC still holding ~$64,700, flat on the day. One green day does not make a trend — watch the next flow print before calling a bottom.
Not financial advice. DYOR.
#Bitcoin #Crypto #ETFs
Just one day after a $7.9M inflow ended 7 straight days of outflows, US spot Bitcoin ETFs saw $239.9M in net outflows on Nov 17.
BlackRock's IBIT led the exit with $209.5M out — after taking in $76.5M the day before. Spot ETH ETFs lost $29.1M too.
$BTC still holding ~$64,700, flat on the day. One green day does not make a trend — watch the next flow print before calling a bottom.
Not financial advice. DYOR.
#Bitcoin #Crypto #ETFs
3

Breaking news: Roundhill has withdrawn its plans for derivative income ETFs for $SOL and $XRP after more than a year awaiting SEC approval. This decision is a powerful signal about where crypto money is headed!
The harsh reality: Spot ETFs directly holding $SOL and $XRP attracted nearly $1 billion (US$969 million) in just a few months. Meanwhile, similar income products managed to "pull in" just $12 million. What does this nearly 100-fold difference tell us?
Clearly, investors are prioritizing direct exposure to spot tokens over complex options-based yield strategies. They want simplicity and direct growth potential.
This shows that market risk appetite and expectations are changing. Smart money is still flowing into the underlying assets.
So, would you rather hold spot assets to catch the next big wave, or seek smaller, steady returns from yield products?
#CryptoNews #ETFs
$SOL $XRP
Breaking news: Roundhill has withdrawn its plans for derivative income ETFs for $SOL and $XRP after more than a year awaiting SEC approval. This decision is a powerful signal about where crypto money is headed!
The harsh reality: Spot ETFs directly holding $SOL and $XRP attracted nearly $1 billion (US$969 million) in just a few months. Meanwhile, similar income products managed to "pull in" just $12 million. What does this nearly 100-fold difference tell us?
Clearly, investors are prioritizing direct exposure to spot tokens over complex options-based yield strategies. They want simplicity and direct growth potential.
This shows that market risk appetite and expectations are changing. Smart money is still flowing into the underlying assets.
So, would you rather hold spot assets to catch the next big wave, or seek smaller, steady returns from yield products?
#CryptoNews #ETFs
$SOL $XRP
The harsh reality: Spot ETFs directly holding $SOL and $XRP attracted nearly $1 billion (US$969 million) in just a few months. Meanwhile, similar income products managed to "pull in" just $12 million. What does this nearly 100-fold difference tell us?
Clearly, investors are prioritizing direct exposure to spot tokens over complex options-based yield strategies. They want simplicity and direct growth potential.
This shows that market risk appetite and expectations are changing. Smart money is still flowing into the underlying assets.
So, would you rather hold spot assets to catch the next big wave, or seek smaller, steady returns from yield products?
#CryptoNews #ETFs
$SOL $XRP
214

·
--
Bitcoin ETF numbers aren't looking good this week.
On Wednesday, U.S. spot ETFs lost $306.4 million.
This brought total assets under management to $77.7 billion, their lowest level in three months.
The move happened just as the price of $BTC briefly touched $63,000.
Net outflows this year have now exceeded $2.5 billion.
What do you think of this move by investors?
#Bitcoin #ETFs
Bitcoin ETF numbers aren't looking good this week.
On Wednesday, U.S. spot ETFs lost $306.4 million.
This brought total assets under management to $77.7 billion, their lowest level in three months.
The move happened just as the price of $BTC briefly touched $63,000.
Net outflows this year have now exceeded $2.5 billion.
What do you think of this move by investors?
#Bitcoin #ETFs
On Wednesday, U.S. spot ETFs lost $306.4 million.
This brought total assets under management to $77.7 billion, their lowest level in three months.
The move happened just as the price of $BTC briefly touched $63,000.
Net outflows this year have now exceeded $2.5 billion.
What do you think of this move by investors?
#Bitcoin #ETFs
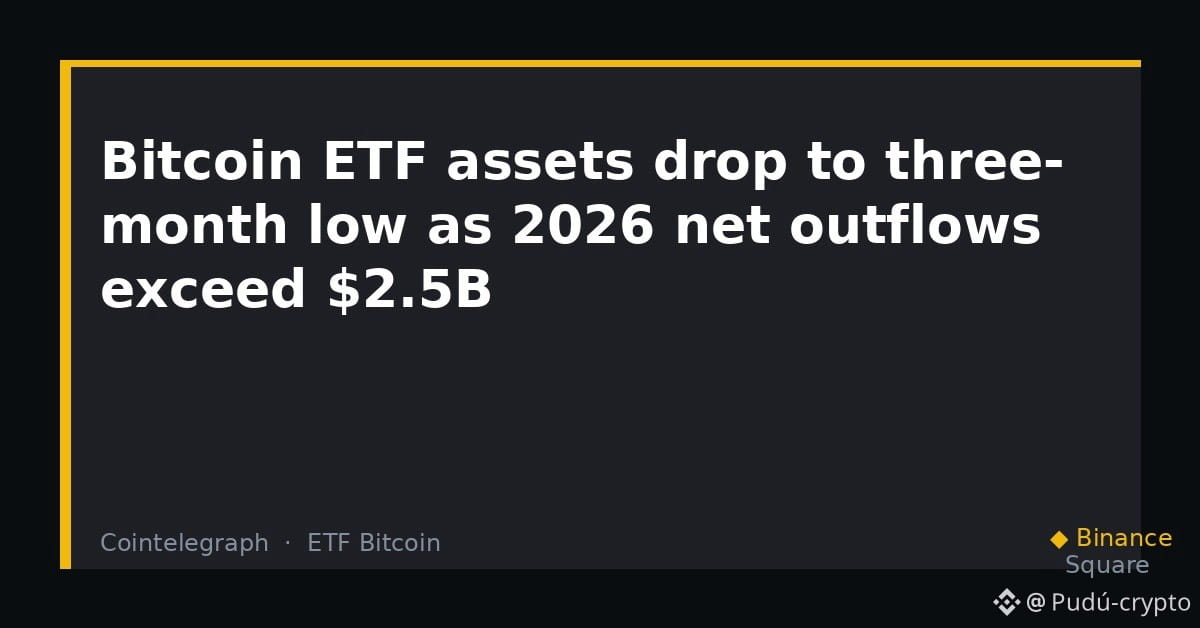
79
Log in to explore more content
Join global crypto users on Binance Square
⚡️ Get latest and useful information about crypto.
💬 Trusted by the world’s largest crypto exchange.
👍 Discover real insights from verified creators.
Email / Phone number
Trending Topics
1
#NvidiaLoses$2.7TrillionInMonthAndAHalf
16,477 views
111 Discussing
2
#CanBTCReboundAfterFallingBelow60K?
728,345 views
2,918 Discussing
3
#GlobalStocksFaceLongestLosingStreakSince2023
265,205 views
1,959 Discussing
4
#BlackRockIBITPostsRecord$541MSingleDayOutflow
30,205 views
88 Discussing
5
#AnthropicPlungesTowardIPOPriceonDay2
133,724 views
1,188 Discussing
6
#TwentyOneCapitalAdds172.25BTC
60,943 views
646 Discussing
7
#HKBillWouldExcludeTokenizedDepositsFromVirtualAssets
7,450 views
50 Discussing
8
#BNBDropsBelow540USDTWith8.46%DailyDecline
73,600 views
635 Discussing
9
#HKBillProposesHK$100KFineForUnauthorizedCryptoTitles
2,468 views
22 Discussing
10
#BitMineFaces$10.1BUnrealizedETHLoss
5,116 views
27 Discussing