
#impactbytrade
impactbytrade
5,595 views
26 Discussing
Hot
Latest


·
--
Bearish
$IMX short — Rejection from highs, targeting lower support 🩸
IMX faced a massive rejection after spiking to $0.1479, leaving a huge bearish wick. The price is now trading below all key 1H moving averages (MA7, MA25, and MA99), indicating heavy selling pressure. The structure remains bearish, and a clean 1H close below the local support at $0.1083 will confirm the continuation of the downtrend.
Entry: 1H close below $0.1080
SL: Above $0.1150 (Above the MA cluster)
Target 1: $0.1050
Target 2: $0.1000
If price reclaims $0.1150, the setup is invalid — cut your losses.
$IMX
{future}(IMXUSDT)
DYOR. NFA. Always use strict risk management.
#IMX #ImmutableX #TradeIdea #IMPACTbyTrade
$IMX short — Rejection from highs, targeting lower support 🩸
IMX faced a massive rejection after spiking to $0.1479, leaving a huge bearish wick. The price is now trading below all key 1H moving averages (MA7, MA25, and MA99), indicating heavy selling pressure. The structure remains bearish, and a clean 1H close below the local support at $0.1083 will confirm the continuation of the downtrend.
Entry: 1H close below $0.1080
SL: Above $0.1150 (Above the MA cluster)
Target 1: $0.1050
Target 2: $0.1000
If price reclaims $0.1150, the setup is invalid — cut your losses.
$IMX
DYOR. NFA. Always use strict risk management.
#IMX #ImmutableX #TradeIdea #IMPACTbyTrade
IMX faced a massive rejection after spiking to $0.1479, leaving a huge bearish wick. The price is now trading below all key 1H moving averages (MA7, MA25, and MA99), indicating heavy selling pressure. The structure remains bearish, and a clean 1H close below the local support at $0.1083 will confirm the continuation of the downtrend.
Entry: 1H close below $0.1080
SL: Above $0.1150 (Above the MA cluster)
Target 1: $0.1050
Target 2: $0.1000
If price reclaims $0.1150, the setup is invalid — cut your losses.
$IMX
DYOR. NFA. Always use strict risk management.
#IMX #ImmutableX #TradeIdea #IMPACTbyTrade
390

·
--
Article
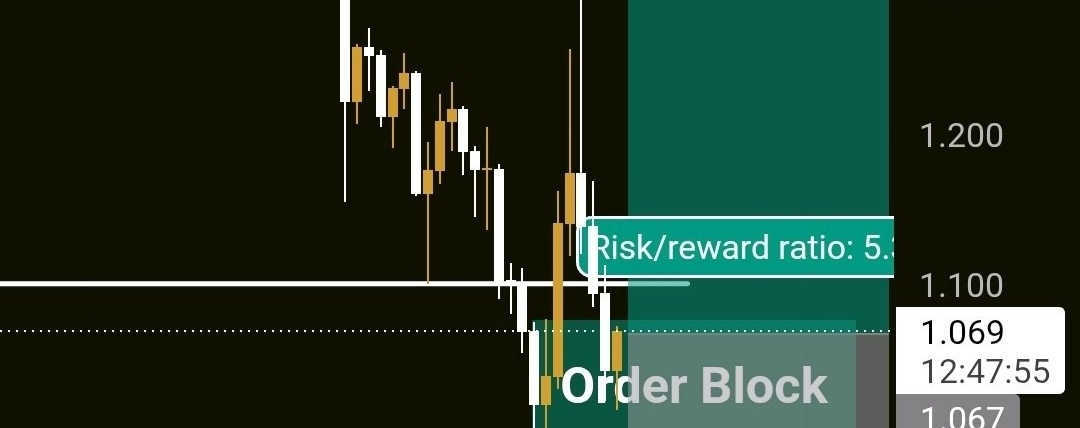
GRAMUSDTGRAMUSDT — The $1.12 support I was watching in my previous GRAM analysis failed. But that failure has brought price back to a location where I'm seriously interested in building a new bullish position. GRAM rallied from $0.991 to $1.29, then surrendered most of that recovery. The breakout lost its momentum, and price returned to my daily order block around $1.00–$1.08. This changes the opportunity completely. My earlier analysis focused on whether GRAM could sustain its breakout. Now I'm studying whether buyers can defend the same area that preceded the last significant rally. The latest 4H data show price dipping toward $1.016 before recovering to approximately $1.07. That reaction interests me, especially because the previous $0.991 swing low remains intact. I'm strongly bullish on this potential accumulation area. However, the 4H trend hasn't turned bullish yet. EMA21 near $1.094 and MA28 near $1.133 remain overhead, while MACD is still negative. I want to see whether buyers can turn this early reaction into genuine demand. Recovering $1.10–$1.13 would improve the immediate outlook, but the previous rejection near $1.29 remains an important obstacle. My larger objective is $1.722. I believe GRAM has the potential to revisit that region if the daily order block develops into a sustainable base. That's my projected recovery scenario, not an expectation of an immediate 61% rally. My chart also gives me a defined way to manage the risk. The planned spot setup uses $1.067 as the entry reference, $0.944 as the protective stop and $1.722 as the extended target. That's approximately 5.33:1 theoretical risk-to-reward before fees, applicable only at the marked entry. A sustained breakdown below $0.991 would seriously weaken the accumulation thesis before the final stop is reached. I won't keep adding if the market starts accepting prices below the structure I'm relying on. I'm very confident in the potential opportunity developing here, but the difference between my earlier GRAM analysis and this one is important. I'm no longer depending on the strength of a breakout. I'm evaluating whether the market is offering a second opportunity to accumulate near the origin of that breakout. #IMPACTbyTrade
GRAMUSDT
GRAMUSDT — The $1.12 support I was watching in my previous GRAM analysis failed. But that failure has brought price back to a location where I'm seriously interested in building a new bullish position. GRAM rallied from $0.991 to $1.29, then surrendered most of that recovery. The breakout lost its momentum, and price returned to my daily order block around $1.00–$1.08. This changes the opportunity completely. My earlier analysis focused on whether GRAM could sustain its breakout. Now I'm studying whether buyers can defend the same area that preceded the last significant rally. The latest 4H data show price dipping toward $1.016 before recovering to approximately $1.07. That reaction interests me, especially because the previous $0.991 swing low remains intact. I'm strongly bullish on this potential accumulation area. However, the 4H trend hasn't turned bullish yet. EMA21 near $1.094 and MA28 near $1.133 remain overhead, while MACD is still negative. I want to see whether buyers can turn this early reaction into genuine demand. Recovering $1.10–$1.13 would improve the immediate outlook, but the previous rejection near $1.29 remains an important obstacle. My larger objective is $1.722. I believe GRAM has the potential to revisit that region if the daily order block develops into a sustainable base. That's my projected recovery scenario, not an expectation of an immediate 61% rally. My chart also gives me a defined way to manage the risk. The planned spot setup uses $1.067 as the entry reference, $0.944 as the protective stop and $1.722 as the extended target. That's approximately 5.33:1 theoretical risk-to-reward before fees, applicable only at the marked entry. A sustained breakdown below $0.991 would seriously weaken the accumulation thesis before the final stop is reached. I won't keep adding if the market starts accepting prices below the structure I'm relying on. I'm very confident in the potential opportunity developing here, but the difference between my earlier GRAM analysis and this one is important. I'm no longer depending on the strength of a breakout. I'm evaluating whether the market is offering a second opportunity to accumulate near the origin of that breakout. #IMPACTbyTrade
1
1.2k
·
--
$BNB
{spot}(BNBUSDT)
most catastrophic move is unfolding right now 📉🩸 everyone is watching the brutal fall from the 810.20 peak but there's a far more terrifying signal hiding in this daily chart that most traders are completely ignorin on daily chart, BNB completely lost its macro structure, getting violently rejected and trapped below both the EMA 50 and EMA 200 price spent time trying to find a floor, but this recent collapse didn't happen simply because of weak momentum it came after sellers completely obliterated the support zone, breaking straight through the 680 level and leaving a trail of blood. That's part of this setup most traders are missing now look at the current price. BNB is bleeding out at 631.18, sitting right on 0.786 Fibonacci level, with absolutely no bullish volume to save it bullish reversal is a complete illusion. My previous local support levels have shattered, so I am aggressively bearish right now A brief oversold signal on the RSI doesn't automatically destroy this catastrophic bearish setup. In fact, if BNB fails to reclaim the 650 area and forms a clear bearish continuation, my target towards that psychological and technical 1.618 Fibonacci level at exactly 600 dollars becomes a massive reality. Those are my targets, not a guarantee from the market i'm watching for confirmation, not blindly catching a falling knife. A sustained higher-timeframe break back above the recent lower high, followed by a successful reclaim of the 693 EMA, would invalidate this bearish setup Any new short entry needs a defined stop above the confirmed structure and a favorable risk-to-reward ratio before execution BNB has already shown what pure capitulation looks like on the charts market is screaming for lower prices here's real question: Are we watching BNB build a temporary floor for a dead cat bounce, or is this the final nail in the coffin that sends us straight down to 600 dollars? #IMPACTbyTrade $BTC
$BNB
most catastrophic move is unfolding right now 📉🩸 everyone is watching the brutal fall from the 810.20 peak but there's a far more terrifying signal hiding in this daily chart that most traders are completely ignorin on daily chart, BNB completely lost its macro structure, getting violently rejected and trapped below both the EMA 50 and EMA 200 price spent time trying to find a floor, but this recent collapse didn't happen simply because of weak momentum it came after sellers completely obliterated the support zone, breaking straight through the 680 level and leaving a trail of blood. That's part of this setup most traders are missing now look at the current price. BNB is bleeding out at 631.18, sitting right on 0.786 Fibonacci level, with absolutely no bullish volume to save it bullish reversal is a complete illusion. My previous local support levels have shattered, so I am aggressively bearish right now A brief oversold signal on the RSI doesn't automatically destroy this catastrophic bearish setup. In fact, if BNB fails to reclaim the 650 area and forms a clear bearish continuation, my target towards that psychological and technical 1.618 Fibonacci level at exactly 600 dollars becomes a massive reality. Those are my targets, not a guarantee from the market i'm watching for confirmation, not blindly catching a falling knife. A sustained higher-timeframe break back above the recent lower high, followed by a successful reclaim of the 693 EMA, would invalidate this bearish setup Any new short entry needs a defined stop above the confirmed structure and a favorable risk-to-reward ratio before execution BNB has already shown what pure capitulation looks like on the charts market is screaming for lower prices here's real question: Are we watching BNB build a temporary floor for a dead cat bounce, or is this the final nail in the coffin that sends us straight down to 600 dollars? #IMPACTbyTrade $BTC
most catastrophic move is unfolding right now 📉🩸 everyone is watching the brutal fall from the 810.20 peak but there's a far more terrifying signal hiding in this daily chart that most traders are completely ignorin on daily chart, BNB completely lost its macro structure, getting violently rejected and trapped below both the EMA 50 and EMA 200 price spent time trying to find a floor, but this recent collapse didn't happen simply because of weak momentum it came after sellers completely obliterated the support zone, breaking straight through the 680 level and leaving a trail of blood. That's part of this setup most traders are missing now look at the current price. BNB is bleeding out at 631.18, sitting right on 0.786 Fibonacci level, with absolutely no bullish volume to save it bullish reversal is a complete illusion. My previous local support levels have shattered, so I am aggressively bearish right now A brief oversold signal on the RSI doesn't automatically destroy this catastrophic bearish setup. In fact, if BNB fails to reclaim the 650 area and forms a clear bearish continuation, my target towards that psychological and technical 1.618 Fibonacci level at exactly 600 dollars becomes a massive reality. Those are my targets, not a guarantee from the market i'm watching for confirmation, not blindly catching a falling knife. A sustained higher-timeframe break back above the recent lower high, followed by a successful reclaim of the 693 EMA, would invalidate this bearish setup Any new short entry needs a defined stop above the confirmed structure and a favorable risk-to-reward ratio before execution BNB has already shown what pure capitulation looks like on the charts market is screaming for lower prices here's real question: Are we watching BNB build a temporary floor for a dead cat bounce, or is this the final nail in the coffin that sends us straight down to 600 dollars? #IMPACTbyTrade $BTC

55
·
--
Bullish
$Q long — Consolidating above MAs, targeting $0.0330 🚀
Q is showing strong bullish structure on the 1H chart, pumping over 10% today and reclaiming all key moving averages. The price is currently cooling off at $0.0297 after hitting a local high of $0.0315. A clean 1H close above the $0.0305 resistance will confirm the continuation of the uptrend.
Entry: 1H close above $0.0305
SL: Below $0.0284 (Under MA 7 support)
Target 1: $0.0315 (24h High)
Target 2: $0.0330
If $0.0284 breaks down, the setup is invalid — cut your losses.
$Q
{future}(QUSDT)
DYOR. NFA. Always use strict risk management.
#Q #QuackAI #TradeIdea #IMPACTbyTrade
$Q long — Consolidating above MAs, targeting $0.0330 🚀
Q is showing strong bullish structure on the 1H chart, pumping over 10% today and reclaiming all key moving averages. The price is currently cooling off at $0.0297 after hitting a local high of $0.0315. A clean 1H close above the $0.0305 resistance will confirm the continuation of the uptrend.
Entry: 1H close above $0.0305
SL: Below $0.0284 (Under MA 7 support)
Target 1: $0.0315 (24h High)
Target 2: $0.0330
If $0.0284 breaks down, the setup is invalid — cut your losses.
$Q
DYOR. NFA. Always use strict risk management.
#Q #QuackAI #TradeIdea #IMPACTbyTrade
Q is showing strong bullish structure on the 1H chart, pumping over 10% today and reclaiming all key moving averages. The price is currently cooling off at $0.0297 after hitting a local high of $0.0315. A clean 1H close above the $0.0305 resistance will confirm the continuation of the uptrend.
Entry: 1H close above $0.0305
SL: Below $0.0284 (Under MA 7 support)
Target 1: $0.0315 (24h High)
Target 2: $0.0330
If $0.0284 breaks down, the setup is invalid — cut your losses.
$Q
DYOR. NFA. Always use strict risk management.
#Q #QuackAI #TradeIdea #IMPACTbyTrade
552
·
--
Bullish
$BULLA long — Capitulation bounce from 24h lows, targeting MA resistance 🚀
BULLA experienced a massive -31% sell-off today, dropping aggressively to find support at the $0.0416 zone. Price is currently trying to stabilize at the bottom. A clean 1H close above the $0.0440 local resistance will confirm a relief bounce, giving a short-term opportunity to catch the retracement toward the moving averages.
Entry: 1H close above $0.0440
SL: Below $0.0400 (Under the 24h low)
Target 1: $0.0465 (MA 7 resistance)
Target 2: $0.0500
If $0.0400 breaks down, the setup is invalid — cut your losses immediately.
$BULLA
{future}(BULLAUSDT)
DYOR. NFA. Early-stage project, extreme volatility. Use strict risk management.
#BULLA #TradeIdea #IMPACTbyTrade
$BULLA long — Capitulation bounce from 24h lows, targeting MA resistance 🚀
BULLA experienced a massive -31% sell-off today, dropping aggressively to find support at the $0.0416 zone. Price is currently trying to stabilize at the bottom. A clean 1H close above the $0.0440 local resistance will confirm a relief bounce, giving a short-term opportunity to catch the retracement toward the moving averages.
Entry: 1H close above $0.0440
SL: Below $0.0400 (Under the 24h low)
Target 1: $0.0465 (MA 7 resistance)
Target 2: $0.0500
If $0.0400 breaks down, the setup is invalid — cut your losses immediately.
$BULLA
DYOR. NFA. Early-stage project, extreme volatility. Use strict risk management.
#BULLA #TradeIdea #IMPACTbyTrade
BULLA experienced a massive -31% sell-off today, dropping aggressively to find support at the $0.0416 zone. Price is currently trying to stabilize at the bottom. A clean 1H close above the $0.0440 local resistance will confirm a relief bounce, giving a short-term opportunity to catch the retracement toward the moving averages.
Entry: 1H close above $0.0440
SL: Below $0.0400 (Under the 24h low)
Target 1: $0.0465 (MA 7 resistance)
Target 2: $0.0500
If $0.0400 breaks down, the setup is invalid — cut your losses immediately.
$BULLA
DYOR. NFA. Early-stage project, extreme volatility. Use strict risk management.
#BULLA #TradeIdea #IMPACTbyTrade
2
621
·
--
Bullish
$SOPH long — Strong reversal momentum, targeting $0.00170 🚀
SOPH is showing impressive bullish momentum, pumping over +18% today and reclaiming all key moving averages on the 1H chart. The price is currently consolidating just below its local high of $0.00162 with a strong volume surge. The order book confirms buyer dominance with a 60% bid wall. A clean 1H close above the $0.00152 resistance will confirm the continuation of the uptrend.
Entry: 1H close above $0.00152
SL: Below $0.00140 (Under MA 7 support)
Target 1: $0.00162 (24h High)
Target 2: $0.00170
If $0.00140 breaks down, the setup is invalid — cut your losses.
$SOPH
{future}(SOPHUSDT)
DYOR. NFA. Always use strict risk management.
#SOPH #Sophon #TradeIdea #IMPACTbyTrade
$SOPH long — Strong reversal momentum, targeting $0.00170 🚀
SOPH is showing impressive bullish momentum, pumping over +18% today and reclaiming all key moving averages on the 1H chart. The price is currently consolidating just below its local high of $0.00162 with a strong volume surge. The order book confirms buyer dominance with a 60% bid wall. A clean 1H close above the $0.00152 resistance will confirm the continuation of the uptrend.
Entry: 1H close above $0.00152
SL: Below $0.00140 (Under MA 7 support)
Target 1: $0.00162 (24h High)
Target 2: $0.00170
If $0.00140 breaks down, the setup is invalid — cut your losses.
$SOPH
DYOR. NFA. Always use strict risk management.
#SOPH #Sophon #TradeIdea #IMPACTbyTrade
SOPH is showing impressive bullish momentum, pumping over +18% today and reclaiming all key moving averages on the 1H chart. The price is currently consolidating just below its local high of $0.00162 with a strong volume surge. The order book confirms buyer dominance with a 60% bid wall. A clean 1H close above the $0.00152 resistance will confirm the continuation of the uptrend.
Entry: 1H close above $0.00152
SL: Below $0.00140 (Under MA 7 support)
Target 1: $0.00162 (24h High)
Target 2: $0.00170
If $0.00140 breaks down, the setup is invalid — cut your losses.
$SOPH
DYOR. NFA. Always use strict risk management.
#SOPH #Sophon #TradeIdea #IMPACTbyTrade
296
·
--
Bullish
$PONS long — Reclaiming key MAs, targeting a breakout to $0.175 🚀
PONS is showing a strong bullish reversal on the 1H chart after bouncing hard from the $0.1394 support zone. The price has successfully reclaimed the MA(25) and MA(99) levels, turning them into support. A clean 1H close above the $0.1600 resistance will confirm the continuation of the uptrend and open the path toward recent highs.
Entry: 1H close above $0.1600
SL: Below $0.1480 (Under the MA cluster)
Target 1: $0.1665 (24h High)
Target 2: $0.1750
If $0.1480 breaks down, the setup is invalid — cut your losses.
$PONS
{future}(PONSUSDT)
DYOR. NFA. Always use strict risk management.
#PONS #TradeIdea #IMPACTbyTrade
$PONS long — Reclaiming key MAs, targeting a breakout to $0.175 🚀
PONS is showing a strong bullish reversal on the 1H chart after bouncing hard from the $0.1394 support zone. The price has successfully reclaimed the MA(25) and MA(99) levels, turning them into support. A clean 1H close above the $0.1600 resistance will confirm the continuation of the uptrend and open the path toward recent highs.
Entry: 1H close above $0.1600
SL: Below $0.1480 (Under the MA cluster)
Target 1: $0.1665 (24h High)
Target 2: $0.1750
If $0.1480 breaks down, the setup is invalid — cut your losses.
$PONS
DYOR. NFA. Always use strict risk management.
#PONS #TradeIdea #IMPACTbyTrade
PONS is showing a strong bullish reversal on the 1H chart after bouncing hard from the $0.1394 support zone. The price has successfully reclaimed the MA(25) and MA(99) levels, turning them into support. A clean 1H close above the $0.1600 resistance will confirm the continuation of the uptrend and open the path toward recent highs.
Entry: 1H close above $0.1600
SL: Below $0.1480 (Under the MA cluster)
Target 1: $0.1665 (24h High)
Target 2: $0.1750
If $0.1480 breaks down, the setup is invalid — cut your losses.
$PONS
DYOR. NFA. Always use strict risk management.
#PONS #TradeIdea #IMPACTbyTrade
1
495
·
--
Bullish
$MANTR long — Capitulation wick bounce, targeting MA resistance 🚀
MANTR experienced a sharp sell-off (-10.96%) but printed a massive volume spike at the $0.00251 low, signaling potential exhaustion of sellers. The order book now shows strong buyer support with a 59% bid wall. A clean 1H close above the $0.00268 local resistance will confirm the relief bounce toward the moving averages.
Entry: 1H close above $0.00268
SL: Below $0.00245 (Under the capitulation wick)
Target 1: $0.00278 (MA 7 resistance)
Target 2: $0.00287 (MA 25 resistance)
If $0.00245 breaks down, the setup is invalid — cut your losses.
$MANTRA
{future}(MANTRAUSDT)
DYOR. NFA. High volatility, use strict risk management.
#MANTR #MANTRADao #TradeIdea #IMPACTbyTrade
$MANTR long — Capitulation wick bounce, targeting MA resistance 🚀
MANTR experienced a sharp sell-off (-10.96%) but printed a massive volume spike at the $0.00251 low, signaling potential exhaustion of sellers. The order book now shows strong buyer support with a 59% bid wall. A clean 1H close above the $0.00268 local resistance will confirm the relief bounce toward the moving averages.
Entry: 1H close above $0.00268
SL: Below $0.00245 (Under the capitulation wick)
Target 1: $0.00278 (MA 7 resistance)
Target 2: $0.00287 (MA 25 resistance)
If $0.00245 breaks down, the setup is invalid — cut your losses.
$MANTRA
DYOR. NFA. High volatility, use strict risk management.
#MANTR #MANTRADao #TradeIdea #IMPACTbyTrade
MANTR experienced a sharp sell-off (-10.96%) but printed a massive volume spike at the $0.00251 low, signaling potential exhaustion of sellers. The order book now shows strong buyer support with a 59% bid wall. A clean 1H close above the $0.00268 local resistance will confirm the relief bounce toward the moving averages.
Entry: 1H close above $0.00268
SL: Below $0.00245 (Under the capitulation wick)
Target 1: $0.00278 (MA 7 resistance)
Target 2: $0.00287 (MA 25 resistance)
If $0.00245 breaks down, the setup is invalid — cut your losses.
$MANTRA
DYOR. NFA. High volatility, use strict risk management.
#MANTR #MANTRADao #TradeIdea #IMPACTbyTrade
1
529
·
--
Bullish
$AGT long — Bouncing from MA(7) support for a relief rally 🚀
AGT had a massive parabolic run to $0.086 and is now cooling off with a -25% correction. The price has found a local bottom around $0.046 and is currently bouncing, holding firmly above the 1H MA(7) support at $0.0536. Buyers are stepping in with 53% bids in the order book. A clean 1H close above the $0.0580 local resistance will confirm the bounce toward the next moving average.
Entry: 1H close above $0.0580
SL: Below $0.0520 (Under MA 7 support)
Target 1: $0.0640 (MA 25 resistance)
Target 2: $0.0700
If $0.0520 breaks down, the setup is invalid — cut your losses.
$AGT
{future}(AGTUSDT)
DYOR. NFA. High volatility after a major pump, use strict risk management.
#AGT #AlayaGovernance #TradeIdea #IMPACTbyTrade
$AGT long — Bouncing from MA(7) support for a relief rally 🚀
AGT had a massive parabolic run to $0.086 and is now cooling off with a -25% correction. The price has found a local bottom around $0.046 and is currently bouncing, holding firmly above the 1H MA(7) support at $0.0536. Buyers are stepping in with 53% bids in the order book. A clean 1H close above the $0.0580 local resistance will confirm the bounce toward the next moving average.
Entry: 1H close above $0.0580
SL: Below $0.0520 (Under MA 7 support)
Target 1: $0.0640 (MA 25 resistance)
Target 2: $0.0700
If $0.0520 breaks down, the setup is invalid — cut your losses.
$AGT
DYOR. NFA. High volatility after a major pump, use strict risk management.
#AGT #AlayaGovernance #TradeIdea #IMPACTbyTrade
AGT had a massive parabolic run to $0.086 and is now cooling off with a -25% correction. The price has found a local bottom around $0.046 and is currently bouncing, holding firmly above the 1H MA(7) support at $0.0536. Buyers are stepping in with 53% bids in the order book. A clean 1H close above the $0.0580 local resistance will confirm the bounce toward the next moving average.
Entry: 1H close above $0.0580
SL: Below $0.0520 (Under MA 7 support)
Target 1: $0.0640 (MA 25 resistance)
Target 2: $0.0700
If $0.0520 breaks down, the setup is invalid — cut your losses.
$AGT
DYOR. NFA. High volatility after a major pump, use strict risk management.
#AGT #AlayaGovernance #TradeIdea #IMPACTbyTrade
1
674
·
--
Bullish
$AKE long — Parabolic breakout, targeting $0.00450 🚀
AKE is going absolutely parabolic today, pumping over +59% from the $0.0024 support zone. The 1H chart shows a massive volume explosion, and the price has reclaimed the MA(99) with a strong 66% buy wall in the order book. Price is currently consolidating below the peak. A clean 1H close above the $0.0040 psychological resistance will confirm the next leg up.
Entry: 1H close above $0.0040
SL: Below $0.0034 (Under the breakout candle's support)
Target 1: $0.004355 (24h High)
Target 2: $0.004500
If $0.0034 breaks down, the setup is invalid — cut your losses.
$AKE
{future}(AKEUSDT)
DYOR. NFA. Parabolic moves are highly volatile, use strict risk management.
#AKE #AKEDO #TradeIdea #IMPACTbyTrade
$AKE long — Parabolic breakout, targeting $0.00450 🚀
AKE is going absolutely parabolic today, pumping over +59% from the $0.0024 support zone. The 1H chart shows a massive volume explosion, and the price has reclaimed the MA(99) with a strong 66% buy wall in the order book. Price is currently consolidating below the peak. A clean 1H close above the $0.0040 psychological resistance will confirm the next leg up.
Entry: 1H close above $0.0040
SL: Below $0.0034 (Under the breakout candle's support)
Target 1: $0.004355 (24h High)
Target 2: $0.004500
If $0.0034 breaks down, the setup is invalid — cut your losses.
$AKE
DYOR. NFA. Parabolic moves are highly volatile, use strict risk management.
#AKE #AKEDO #TradeIdea #IMPACTbyTrade
AKE is going absolutely parabolic today, pumping over +59% from the $0.0024 support zone. The 1H chart shows a massive volume explosion, and the price has reclaimed the MA(99) with a strong 66% buy wall in the order book. Price is currently consolidating below the peak. A clean 1H close above the $0.0040 psychological resistance will confirm the next leg up.
Entry: 1H close above $0.0040
SL: Below $0.0034 (Under the breakout candle's support)
Target 1: $0.004355 (24h High)
Target 2: $0.004500
If $0.0034 breaks down, the setup is invalid — cut your losses.
$AKE
DYOR. NFA. Parabolic moves are highly volatile, use strict risk management.
#AKE #AKEDO #TradeIdea #IMPACTbyTrade
1
760
·
--
Bullish
$BARD long — Parabolic breakout with heavy buy pressure, targeting $0.150 🚀
BARD is going absolutely parabolic today, pumping over 60% in a single hour from the $0.080 zone. The 1H chart shows massive volume spikes, and the order book is heavily bullish with a 72% buy wall. Price is currently consolidating just below its 24h high. A clean 1H close above the $0.1385 resistance will confirm the continuation of this explosive uptrend.
Entry: 1H close above $0.1385
SL: Below $0.1180 (Under the breakout candle body)
Target 1: $0.1450
Target 2: $0.1550
If $0.1180 breaks down, the setup is invalid — cut your losses.
$BARD
{future}(BARDUSDT)
DYOR. NFA. Extremely high volatility, use strict risk management.
#BARD #Lombard #TradeIdea #IMPACTbyTrade
$BARD long — Parabolic breakout with heavy buy pressure, targeting $0.150 🚀
BARD is going absolutely parabolic today, pumping over 60% in a single hour from the $0.080 zone. The 1H chart shows massive volume spikes, and the order book is heavily bullish with a 72% buy wall. Price is currently consolidating just below its 24h high. A clean 1H close above the $0.1385 resistance will confirm the continuation of this explosive uptrend.
Entry: 1H close above $0.1385
SL: Below $0.1180 (Under the breakout candle body)
Target 1: $0.1450
Target 2: $0.1550
If $0.1180 breaks down, the setup is invalid — cut your losses.
$BARD
DYOR. NFA. Extremely high volatility, use strict risk management.
#BARD #Lombard #TradeIdea #IMPACTbyTrade
BARD is going absolutely parabolic today, pumping over 60% in a single hour from the $0.080 zone. The 1H chart shows massive volume spikes, and the order book is heavily bullish with a 72% buy wall. Price is currently consolidating just below its 24h high. A clean 1H close above the $0.1385 resistance will confirm the continuation of this explosive uptrend.
Entry: 1H close above $0.1385
SL: Below $0.1180 (Under the breakout candle body)
Target 1: $0.1450
Target 2: $0.1550
If $0.1180 breaks down, the setup is invalid — cut your losses.
$BARD
DYOR. NFA. Extremely high volatility, use strict risk management.
#BARD #Lombard #TradeIdea #IMPACTbyTrade
313
·
--
Bullish
$DODOX long — Massive volume breakout, targeting $0.030+ 🚀
DODOX just went parabolic with a massive +17% pump, breaking out of its consolidation zone with huge volume spikes. The price is currently cooling off slightly at $0.0274, holding well above all key moving averages. The order book shows strong buyer dominance with 62% bids. A clean 1H close above the $0.0285 local resistance will confirm the next leg up.
Entry: 1H close above $0.0285
SL: Below $0.0258 (Under MA 7 support)
Target 1: $0.0300
Target 2: $0.0320
If $0.0258 breaks down, the setup is invalid — cut your losses.
$DODOX
{future}(DODOXUSDT)
DYOR. NFA. Parabolic moves are highly volatile, use strict risk management.
#DODOX #DODO #TradeIdea #IMPACTbyTrade
$DODOX long — Massive volume breakout, targeting $0.030+ 🚀
DODOX just went parabolic with a massive +17% pump, breaking out of its consolidation zone with huge volume spikes. The price is currently cooling off slightly at $0.0274, holding well above all key moving averages. The order book shows strong buyer dominance with 62% bids. A clean 1H close above the $0.0285 local resistance will confirm the next leg up.
Entry: 1H close above $0.0285
SL: Below $0.0258 (Under MA 7 support)
Target 1: $0.0300
Target 2: $0.0320
If $0.0258 breaks down, the setup is invalid — cut your losses.
$DODOX
DYOR. NFA. Parabolic moves are highly volatile, use strict risk management.
#DODOX #DODO #TradeIdea #IMPACTbyTrade
DODOX just went parabolic with a massive +17% pump, breaking out of its consolidation zone with huge volume spikes. The price is currently cooling off slightly at $0.0274, holding well above all key moving averages. The order book shows strong buyer dominance with 62% bids. A clean 1H close above the $0.0285 local resistance will confirm the next leg up.
Entry: 1H close above $0.0285
SL: Below $0.0258 (Under MA 7 support)
Target 1: $0.0300
Target 2: $0.0320
If $0.0258 breaks down, the setup is invalid — cut your losses.
$DODOX
DYOR. NFA. Parabolic moves are highly volatile, use strict risk management.
#DODOX #DODO #TradeIdea #IMPACTbyTrade
1
240
·
--
Bullish
$MAGMA long — Massive V-shaped recovery, targeting $0.350 🚀
MAGMA is showing absolute dominance today, pumping over 25% and hitting a new local high of $0.329. After a quick dip to $0.243, buyers aggressively stepped back in with huge volume, creating a V-shaped recovery. The price is riding high above all key moving averages with a 59% buy wall. A clean 1H close above the $0.3300 resistance will confirm the next leg up.
Entry: 1H close above $0.3300
SL: Below $0.2950 (Under MA 7 support)
Target 1: $0.3400
Target 2: $0.3500
If $0.2950 breaks down, the setup is invalid — cut your losses.
$MAGMA
{future}(MAGMAUSDT)
DYOR. NFA. Parabolic moves are highly volatile, use strict risk management.
#MAGMA #TradeIdea #IMPACTbyTrade
$MAGMA long — Massive V-shaped recovery, targeting $0.350 🚀
MAGMA is showing absolute dominance today, pumping over 25% and hitting a new local high of $0.329. After a quick dip to $0.243, buyers aggressively stepped back in with huge volume, creating a V-shaped recovery. The price is riding high above all key moving averages with a 59% buy wall. A clean 1H close above the $0.3300 resistance will confirm the next leg up.
Entry: 1H close above $0.3300
SL: Below $0.2950 (Under MA 7 support)
Target 1: $0.3400
Target 2: $0.3500
If $0.2950 breaks down, the setup is invalid — cut your losses.
$MAGMA
DYOR. NFA. Parabolic moves are highly volatile, use strict risk management.
#MAGMA #TradeIdea #IMPACTbyTrade
MAGMA is showing absolute dominance today, pumping over 25% and hitting a new local high of $0.329. After a quick dip to $0.243, buyers aggressively stepped back in with huge volume, creating a V-shaped recovery. The price is riding high above all key moving averages with a 59% buy wall. A clean 1H close above the $0.3300 resistance will confirm the next leg up.
Entry: 1H close above $0.3300
SL: Below $0.2950 (Under MA 7 support)
Target 1: $0.3400
Target 2: $0.3500
If $0.2950 breaks down, the setup is invalid — cut your losses.
$MAGMA
DYOR. NFA. Parabolic moves are highly volatile, use strict risk management.
#MAGMA #TradeIdea #IMPACTbyTrade
ADITYAA-56
·
--
Bullish$MAGMA long — Holding MA(25) support after a volatile pump 🚀
MAGMA experienced massive volatility, pumping to $0.316 before a sharp retracement. The price is currently holding perfectly at the 1H MA(25) support level ($0.272). A clean 1H close above the $0.276 local resistance will confirm the bounce and open the path toward the moving averages above.
Entry: 1H close above $0.276
SL: Below $0.253 (24h Low)
Target 1: $0.281 (MA 7 resistance)
Target 2: $0.300
If $0.253 breaks down, the setup is invalid — cut your losses.
$MAGMA
DYOR. NFA. High volatility, manage risk strictly.
#MAGMA #TradeIdea #IMPACTbyTrade
MAGMA experienced massive volatility, pumping to $0.316 before a sharp retracement. The price is currently holding perfectly at the 1H MA(25) support level ($0.272). A clean 1H close above the $0.276 local resistance will confirm the bounce and open the path toward the moving averages above.
Entry: 1H close above $0.276
SL: Below $0.253 (24h Low)
Target 1: $0.281 (MA 7 resistance)
Target 2: $0.300
If $0.253 breaks down, the setup is invalid — cut your losses.
$MAGMA
DYOR. NFA. High volatility, manage risk strictly.
#MAGMA #TradeIdea #IMPACTbyTrade
277
·
--
Bullish
$MAGMA long — Holding MA(25) support after a volatile pump 🚀
MAGMA experienced massive volatility, pumping to $0.316 before a sharp retracement. The price is currently holding perfectly at the 1H MA(25) support level ($0.272). A clean 1H close above the $0.276 local resistance will confirm the bounce and open the path toward the moving averages above.
Entry: 1H close above $0.276
SL: Below $0.253 (24h Low)
Target 1: $0.281 (MA 7 resistance)
Target 2: $0.300
If $0.253 breaks down, the setup is invalid — cut your losses.
$MAGMA
{future}(MAGMAUSDT)
DYOR. NFA. High volatility, manage risk strictly.
#MAGMA #TradeIdea #IMPACTbyTrade
$MAGMA long — Holding MA(25) support after a volatile pump 🚀
MAGMA experienced massive volatility, pumping to $0.316 before a sharp retracement. The price is currently holding perfectly at the 1H MA(25) support level ($0.272). A clean 1H close above the $0.276 local resistance will confirm the bounce and open the path toward the moving averages above.
Entry: 1H close above $0.276
SL: Below $0.253 (24h Low)
Target 1: $0.281 (MA 7 resistance)
Target 2: $0.300
If $0.253 breaks down, the setup is invalid — cut your losses.
$MAGMA
DYOR. NFA. High volatility, manage risk strictly.
#MAGMA #TradeIdea #IMPACTbyTrade
MAGMA experienced massive volatility, pumping to $0.316 before a sharp retracement. The price is currently holding perfectly at the 1H MA(25) support level ($0.272). A clean 1H close above the $0.276 local resistance will confirm the bounce and open the path toward the moving averages above.
Entry: 1H close above $0.276
SL: Below $0.253 (24h Low)
Target 1: $0.281 (MA 7 resistance)
Target 2: $0.300
If $0.253 breaks down, the setup is invalid — cut your losses.
$MAGMA
DYOR. NFA. High volatility, manage risk strictly.
#MAGMA #TradeIdea #IMPACTbyTrade
1
405
·
--
Bullish
$NIL long — Massive 81% buy wall signaling a strong reversal 🚀
NIL is showing immense buying pressure with a massive 81% buy wall in the order book. After bottoming out at $0.0542, the price has reclaimed both the MA(7) and MA(25) on the 1H chart. A clean 1H close above the MA(99) resistance at $0.0572 will confirm the breakout and trigger a stronger relief rally.
Entry: 1H close above $0.0572
SL: Below $0.0555 (Under recent consolidation)
Target 1: $0.0593 (24h High)
Target 2: $0.0610
If $0.0555 breaks down, the setup is invalid — cut your losses.
$NIL
{future}(NILUSDT)
DYOR. NFA. Always use strict risk management.
#NIL #Nillion #TradeIdea #IMPACTbyTrade
$NIL long — Massive 81% buy wall signaling a strong reversal 🚀
NIL is showing immense buying pressure with a massive 81% buy wall in the order book. After bottoming out at $0.0542, the price has reclaimed both the MA(7) and MA(25) on the 1H chart. A clean 1H close above the MA(99) resistance at $0.0572 will confirm the breakout and trigger a stronger relief rally.
Entry: 1H close above $0.0572
SL: Below $0.0555 (Under recent consolidation)
Target 1: $0.0593 (24h High)
Target 2: $0.0610
If $0.0555 breaks down, the setup is invalid — cut your losses.
$NIL
DYOR. NFA. Always use strict risk management.
#NIL #Nillion #TradeIdea #IMPACTbyTrade
NIL is showing immense buying pressure with a massive 81% buy wall in the order book. After bottoming out at $0.0542, the price has reclaimed both the MA(7) and MA(25) on the 1H chart. A clean 1H close above the MA(99) resistance at $0.0572 will confirm the breakout and trigger a stronger relief rally.
Entry: 1H close above $0.0572
SL: Below $0.0555 (Under recent consolidation)
Target 1: $0.0593 (24h High)
Target 2: $0.0610
If $0.0555 breaks down, the setup is invalid — cut your losses.
$NIL
DYOR. NFA. Always use strict risk management.
#NIL #Nillion #TradeIdea #IMPACTbyTrade
237
·
--
Bullish
$AKE long — Bottom consolidation breakout, targeting $0.0030 🚀
AKE is showing signs of life after a massive sell-off, currently bouncing off its local lows. The 1H chart shows the price reclaiming both the MA(7) and MA(25) levels, with a 55% buy wall building up in the order book. A clean 1H close above the immediate resistance at $0.002750 will confirm the breakout and trigger a relief rally.
Entry: 1H close above $0.002750
SL: Below $0.002500 (Under MA 25 support)
Target 1: $0.002950 (Recent wick high)
Target 2: $0.003200
If $0.002500 breaks down, the setup is invalid — cut your losses.
$AKE
{future}(AKEUSDT)
DYOR. NFA. Extreme volatility after a major dump, manage risk strictly.
#AKE #AKEDO #TradeIdea #IMPACTbyTrade
$AKE long — Bottom consolidation breakout, targeting $0.0030 🚀
AKE is showing signs of life after a massive sell-off, currently bouncing off its local lows. The 1H chart shows the price reclaiming both the MA(7) and MA(25) levels, with a 55% buy wall building up in the order book. A clean 1H close above the immediate resistance at $0.002750 will confirm the breakout and trigger a relief rally.
Entry: 1H close above $0.002750
SL: Below $0.002500 (Under MA 25 support)
Target 1: $0.002950 (Recent wick high)
Target 2: $0.003200
If $0.002500 breaks down, the setup is invalid — cut your losses.
$AKE
DYOR. NFA. Extreme volatility after a major dump, manage risk strictly.
#AKE #AKEDO #TradeIdea #IMPACTbyTrade
AKE is showing signs of life after a massive sell-off, currently bouncing off its local lows. The 1H chart shows the price reclaiming both the MA(7) and MA(25) levels, with a 55% buy wall building up in the order book. A clean 1H close above the immediate resistance at $0.002750 will confirm the breakout and trigger a relief rally.
Entry: 1H close above $0.002750
SL: Below $0.002500 (Under MA 25 support)
Target 1: $0.002950 (Recent wick high)
Target 2: $0.003200
If $0.002500 breaks down, the setup is invalid — cut your losses.
$AKE
DYOR. NFA. Extreme volatility after a major dump, manage risk strictly.
#AKE #AKEDO #TradeIdea #IMPACTbyTrade
1
842
·
--
Bullish
$PREDICT long — V-shaped recovery, targeting MA(99) resistance 🚀
PREDICT showed a massive volume spike, bouncing hard from the $1.05 low and reclaiming the $1.12 zone. The price is currently holding strong above the 1H MA(7) and MA(25) supports. A clean 1H close above the $1.1400 local resistance will confirm the continuation of the recovery trend.
Entry: 1H close above $1.1400
SL: Below $1.1100 (Under MA 25 support)
Target 1: $1.1580 (MA 99 resistance)
Target 2: $1.2000 (Recent spike high)
If $1.1100 breaks down, the setup is invalid — cut your losses.
$PREDICT
{future}(PREDICTUSDT)
DYOR. NFA. Always use strict risk management.
#PREDICT #Predict #TradeIdea #IMPACTbyTrade
$PREDICT long — V-shaped recovery, targeting MA(99) resistance 🚀
PREDICT showed a massive volume spike, bouncing hard from the $1.05 low and reclaiming the $1.12 zone. The price is currently holding strong above the 1H MA(7) and MA(25) supports. A clean 1H close above the $1.1400 local resistance will confirm the continuation of the recovery trend.
Entry: 1H close above $1.1400
SL: Below $1.1100 (Under MA 25 support)
Target 1: $1.1580 (MA 99 resistance)
Target 2: $1.2000 (Recent spike high)
If $1.1100 breaks down, the setup is invalid — cut your losses.
$PREDICT
DYOR. NFA. Always use strict risk management.
#PREDICT #Predict #TradeIdea #IMPACTbyTrade
PREDICT showed a massive volume spike, bouncing hard from the $1.05 low and reclaiming the $1.12 zone. The price is currently holding strong above the 1H MA(7) and MA(25) supports. A clean 1H close above the $1.1400 local resistance will confirm the continuation of the recovery trend.
Entry: 1H close above $1.1400
SL: Below $1.1100 (Under MA 25 support)
Target 1: $1.1580 (MA 99 resistance)
Target 2: $1.2000 (Recent spike high)
If $1.1100 breaks down, the setup is invalid — cut your losses.
$PREDICT
DYOR. NFA. Always use strict risk management.
#PREDICT #Predict #TradeIdea #IMPACTbyTrade
549
·
--
Bullish
$HUMA long — Massive buy wall signaling a V-shaped recovery 🚀
HUMA had a heavy sell-off down to $0.0074 but is now showing a powerful bounce. The order book is extremely bullish with a massive 82% buy wall, pushing the price back above the MA(7) and testing MA(25) at $0.0081. A clean 1H close above the $0.00845 resistance will confirm the continuation of the recovery trend.
Entry: 1H close above $0.00845
SL: Below $0.00785 (Under MA 7 support)
Target 1: $0.00883 (24h High)
Target 2: $0.00920
If $0.00785 breaks down, the setup is invalid — cut your losses.
$HUMA
{future}(HUMAUSDT)
DYOR. NFA. High volatility, use strict risk management.
#HUMA #HumaFinance #TradeIdea #IMPACTbyTrade
$HUMA long — Massive buy wall signaling a V-shaped recovery 🚀
HUMA had a heavy sell-off down to $0.0074 but is now showing a powerful bounce. The order book is extremely bullish with a massive 82% buy wall, pushing the price back above the MA(7) and testing MA(25) at $0.0081. A clean 1H close above the $0.00845 resistance will confirm the continuation of the recovery trend.
Entry: 1H close above $0.00845
SL: Below $0.00785 (Under MA 7 support)
Target 1: $0.00883 (24h High)
Target 2: $0.00920
If $0.00785 breaks down, the setup is invalid — cut your losses.
$HUMA
DYOR. NFA. High volatility, use strict risk management.
#HUMA #HumaFinance #TradeIdea #IMPACTbyTrade
HUMA had a heavy sell-off down to $0.0074 but is now showing a powerful bounce. The order book is extremely bullish with a massive 82% buy wall, pushing the price back above the MA(7) and testing MA(25) at $0.0081. A clean 1H close above the $0.00845 resistance will confirm the continuation of the recovery trend.
Entry: 1H close above $0.00845
SL: Below $0.00785 (Under MA 7 support)
Target 1: $0.00883 (24h High)
Target 2: $0.00920
If $0.00785 breaks down, the setup is invalid — cut your losses.
$HUMA
DYOR. NFA. High volatility, use strict risk management.
#HUMA #HumaFinance #TradeIdea #IMPACTbyTrade
612
·
--
Bearish
$KGEN short — Rejection from highs, targeting MA(99) support 🩸
KGEN had a massive parabolic pump to $0.107 but faced heavy rejection and is now trading below its MA(25) resistance ($0.080). The order book is heavily bearish with 64% sellers dominating. A clean 1H close below the $0.0750 support will confirm the continuation of the downtrend.
Entry: 1H close below $0.0750
SL: Above $0.0810 (MA 25 resistance)
Target 1: $0.0691 (MA 99 support)
Target 2: $0.0650
If price reclaims $0.0810, the setup is invalid — cut your losses.
$KGEN
{future}(KGENUSDT)
DYOR. NFA. High volatility, use strict risk management.
#KGEN #KGeN #TradeIdea #IMPACTbyTrade
$KGEN short — Rejection from highs, targeting MA(99) support 🩸
KGEN had a massive parabolic pump to $0.107 but faced heavy rejection and is now trading below its MA(25) resistance ($0.080). The order book is heavily bearish with 64% sellers dominating. A clean 1H close below the $0.0750 support will confirm the continuation of the downtrend.
Entry: 1H close below $0.0750
SL: Above $0.0810 (MA 25 resistance)
Target 1: $0.0691 (MA 99 support)
Target 2: $0.0650
If price reclaims $0.0810, the setup is invalid — cut your losses.
$KGEN
DYOR. NFA. High volatility, use strict risk management.
#KGEN #KGeN #TradeIdea #IMPACTbyTrade
KGEN had a massive parabolic pump to $0.107 but faced heavy rejection and is now trading below its MA(25) resistance ($0.080). The order book is heavily bearish with 64% sellers dominating. A clean 1H close below the $0.0750 support will confirm the continuation of the downtrend.
Entry: 1H close below $0.0750
SL: Above $0.0810 (MA 25 resistance)
Target 1: $0.0691 (MA 99 support)
Target 2: $0.0650
If price reclaims $0.0810, the setup is invalid — cut your losses.
$KGEN
DYOR. NFA. High volatility, use strict risk management.
#KGEN #KGeN #TradeIdea #IMPACTbyTrade
1
360
·
--
Bullish
$SXT long — Breaking out for a push to $0.011 🚀
SXT is showing strong bullish momentum, pumping over 10% today. The 1H chart shows a clear uptrend with the price riding well above all key moving averages. It is currently testing the critical resistance at the 24h high of $0.01026. A clean 1H close above this level will confirm the breakout and open the path for further gains.
Entry: 1H close above $0.01030
SL: Below $0.00970 (MA 7 support)
Target 1: $0.01050
Target 2: $0.01090
If $0.00970 breaks down, the setup is invalid — cut your losses.
$SXT
{future}(SXTUSDT)
DYOR. NFA. Always use strict risk management.
#SXT #SpaceAndTime #TradeIdea #IMPACTbyTrade
$SXT long — Breaking out for a push to $0.011 🚀
SXT is showing strong bullish momentum, pumping over 10% today. The 1H chart shows a clear uptrend with the price riding well above all key moving averages. It is currently testing the critical resistance at the 24h high of $0.01026. A clean 1H close above this level will confirm the breakout and open the path for further gains.
Entry: 1H close above $0.01030
SL: Below $0.00970 (MA 7 support)
Target 1: $0.01050
Target 2: $0.01090
If $0.00970 breaks down, the setup is invalid — cut your losses.
$SXT
DYOR. NFA. Always use strict risk management.
#SXT #SpaceAndTime #TradeIdea #IMPACTbyTrade
SXT is showing strong bullish momentum, pumping over 10% today. The 1H chart shows a clear uptrend with the price riding well above all key moving averages. It is currently testing the critical resistance at the 24h high of $0.01026. A clean 1H close above this level will confirm the breakout and open the path for further gains.
Entry: 1H close above $0.01030
SL: Below $0.00970 (MA 7 support)
Target 1: $0.01050
Target 2: $0.01090
If $0.00970 breaks down, the setup is invalid — cut your losses.
$SXT
DYOR. NFA. Always use strict risk management.
#SXT #SpaceAndTime #TradeIdea #IMPACTbyTrade
1
2
245
Log in to explore more content
Join global crypto users on Binance Square
⚡️ Get latest and useful information about crypto.
💬 Trusted by the world’s largest crypto exchange.
👍 Discover real insights from verified creators.
Email / Phone number
Trending Topics
1
#BTCReboundsAbove$60KAmidWhaleDipBuying
39,432 views
218 Discussing
2
#SolanaSets2027RoadmapToDoubleComputeCapacity
23,642 views
549 Discussing
3
#CaliforniaNvidiaProbeExaminesPotentialCriminalViolations
6,061 views
74 Discussing
4
#BlackRockLaunchesHKDollarDigitalLiquidityFund
19,344 views
452 Discussing
5
#NvidiaLoses$2.7TrillionInMonthAndAHalf
63,198 views
269 Discussing
6
#GlobalStocksFaceLongestLosingStreakSince2023
503,647 views
3,184 Discussing
7
#BlackRockIBITPostsRecord$541MSingleDayOutflow
81,159 views
161 Discussing
8
#AnthropicPlungesTowardIPOPriceonDay2
273,464 views
2,115 Discussing
9
#TwentyOneCapitalAdds172.25BTC
139,824 views
1,449 Discussing
10
#HKBillWouldExcludeTokenizedDepositsFromVirtualAssets
16,572 views
95 Discussing