
#pons
pons
1.4M views
6,083 Discussing
Hot
Latest

·
--
Bullish
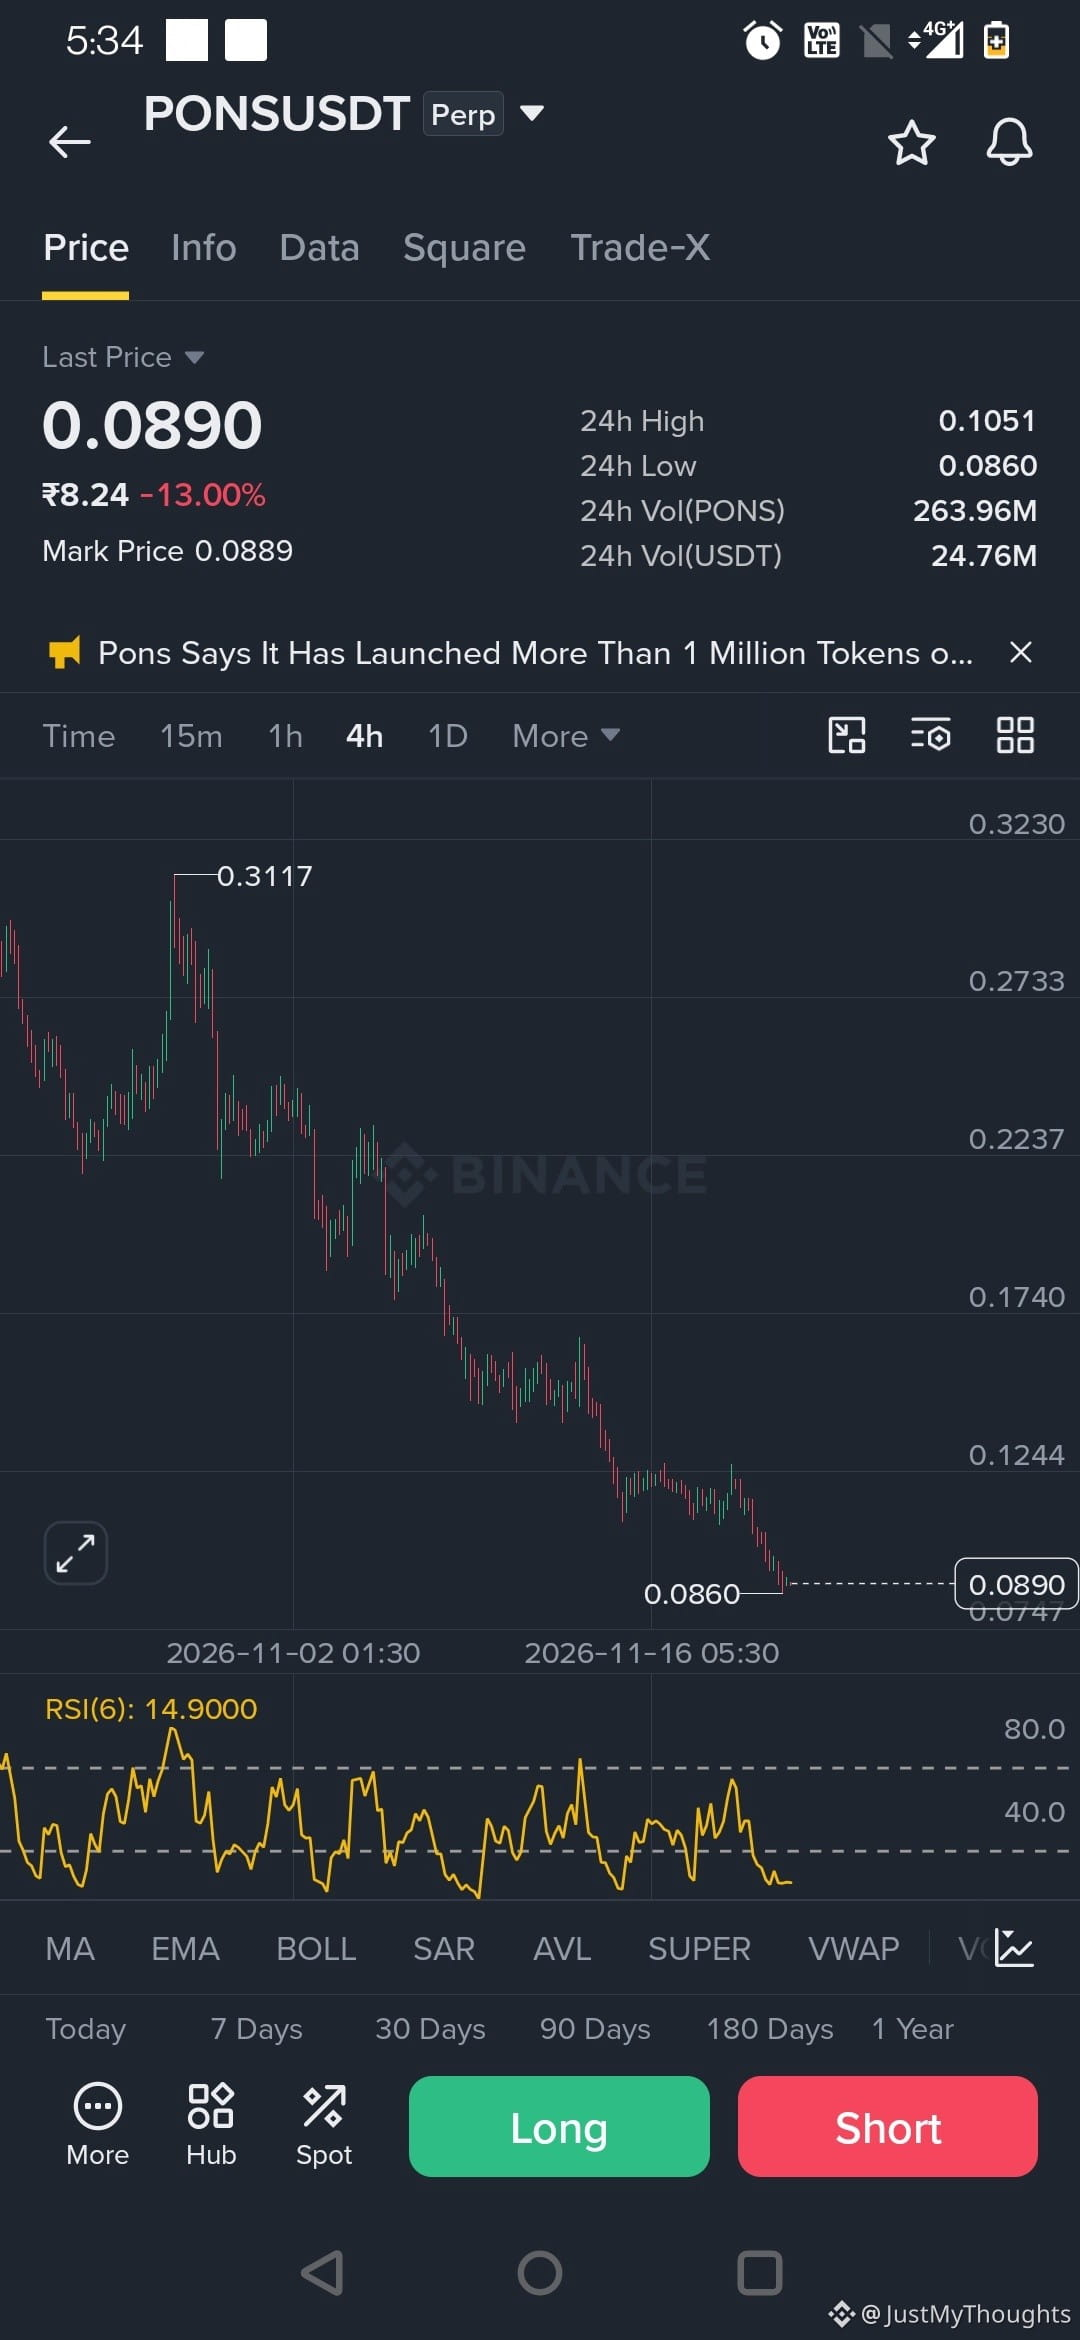
Why are supply burns failing to stop $PONS from sliding toward 0.0890 after dropping from 0.3117?
Around 330 million tokens have already been burned, yet fading daily fee momentum and heavy market fear are keeping buyers hesitant. Even with 4H RSI(6) deeply oversold at 14.90, token counts and past milestones do not guarantee demand when liquidity dries up.
Watch 0.0860 to 0.0747 as the immediate floor; a break below 0.0747 extends the slide, while reclaiming 0.1244 is needed to shift short-term structure.
Are token burns enough when platform activity cools down?
#PONS #Robinhood #CanBTCReboundAfterFallingBelow60K?
Why are supply burns failing to stop $PONS from sliding toward 0.0890 after dropping from 0.3117?
Around 330 million tokens have already been burned, yet fading daily fee momentum and heavy market fear are keeping buyers hesitant. Even with 4H RSI(6) deeply oversold at 14.90, token counts and past milestones do not guarantee demand when liquidity dries up.
Watch 0.0860 to 0.0747 as the immediate floor; a break below 0.0747 extends the slide, while reclaiming 0.1244 is needed to shift short-term structure.
Are token burns enough when platform activity cools down?
#PONS #Robinhood #CanBTCReboundAfterFallingBelow60K?
Around 330 million tokens have already been burned, yet fading daily fee momentum and heavy market fear are keeping buyers hesitant. Even with 4H RSI(6) deeply oversold at 14.90, token counts and past milestones do not guarantee demand when liquidity dries up.
Watch 0.0860 to 0.0747 as the immediate floor; a break below 0.0747 extends the slide, while reclaiming 0.1244 is needed to shift short-term structure.
Are token burns enough when platform activity cools down?
#PONS #Robinhood #CanBTCReboundAfterFallingBelow60K?
478

🚀 $PONS : Official Tokenomics Update – How Does Its Buyback & Burn Mechanism Work?
PONS is building its ecosystem on Robinhood Chain, with a token-launch and trading platform.
Here are some important facts from its official documentation:
🔹 1. Fixed Supply
PONS has an initial fixed supply of 1 billion tokens.
🔹 2. Buyback & Burn
According to Pons documentation, 80% of protocol fees are allocated to buying PONS through an automated TWAP mechanism. Purchased tokens are sent to a burn address.
🔹 3. Platform Development
The remaining 20% of protocol fees supports infrastructure and team expansion.
🔹 4. Ecosystem
Pons allows users to launch and trade tokens through their wallets on Robinhood Chain.
📊 My Analysis
The buyback-and-burn mechanism is an important part of PONS tokenomics. Continued platform activity could support this mechanism, but its long-term impact depends on actual trading activity and market demand.
⚠️ Investment Risk:
PONS is a speculative memecoin. Token burns do not guarantee price increases. Liquidity, volatility and market conditions can create significant losses.
💬 What is your opinion? Can PONS build sustainable growth through its ecosystem and buyback mechanism?
#PONS #RobinhoodChain #CryptoAnalysis #Tokenomics #BinanceSquare
🚀 $PONS : Official Tokenomics Update – How Does Its Buyback & Burn Mechanism Work?
PONS is building its ecosystem on Robinhood Chain, with a token-launch and trading platform.
Here are some important facts from its official documentation:
🔹 1. Fixed Supply
PONS has an initial fixed supply of 1 billion tokens.
🔹 2. Buyback & Burn
According to Pons documentation, 80% of protocol fees are allocated to buying PONS through an automated TWAP mechanism. Purchased tokens are sent to a burn address.
🔹 3. Platform Development
The remaining 20% of protocol fees supports infrastructure and team expansion.
🔹 4. Ecosystem
Pons allows users to launch and trade tokens through their wallets on Robinhood Chain.
📊 My Analysis
The buyback-and-burn mechanism is an important part of PONS tokenomics. Continued platform activity could support this mechanism, but its long-term impact depends on actual trading activity and market demand.
⚠️ Investment Risk:
PONS is a speculative memecoin. Token burns do not guarantee price increases. Liquidity, volatility and market conditions can create significant losses.
💬 What is your opinion? Can PONS build sustainable growth through its ecosystem and buyback mechanism?
#PONS #RobinhoodChain #CryptoAnalysis #Tokenomics #BinanceSquare
PONS is building its ecosystem on Robinhood Chain, with a token-launch and trading platform.
Here are some important facts from its official documentation:
🔹 1. Fixed Supply
PONS has an initial fixed supply of 1 billion tokens.
🔹 2. Buyback & Burn
According to Pons documentation, 80% of protocol fees are allocated to buying PONS through an automated TWAP mechanism. Purchased tokens are sent to a burn address.
🔹 3. Platform Development
The remaining 20% of protocol fees supports infrastructure and team expansion.
🔹 4. Ecosystem
Pons allows users to launch and trade tokens through their wallets on Robinhood Chain.
📊 My Analysis
The buyback-and-burn mechanism is an important part of PONS tokenomics. Continued platform activity could support this mechanism, but its long-term impact depends on actual trading activity and market demand.
⚠️ Investment Risk:
PONS is a speculative memecoin. Token burns do not guarantee price increases. Liquidity, volatility and market conditions can create significant losses.
💬 What is your opinion? Can PONS build sustainable growth through its ecosystem and buyback mechanism?
#PONS #RobinhoodChain #CryptoAnalysis #Tokenomics #BinanceSquare
495


·
--
Bearish
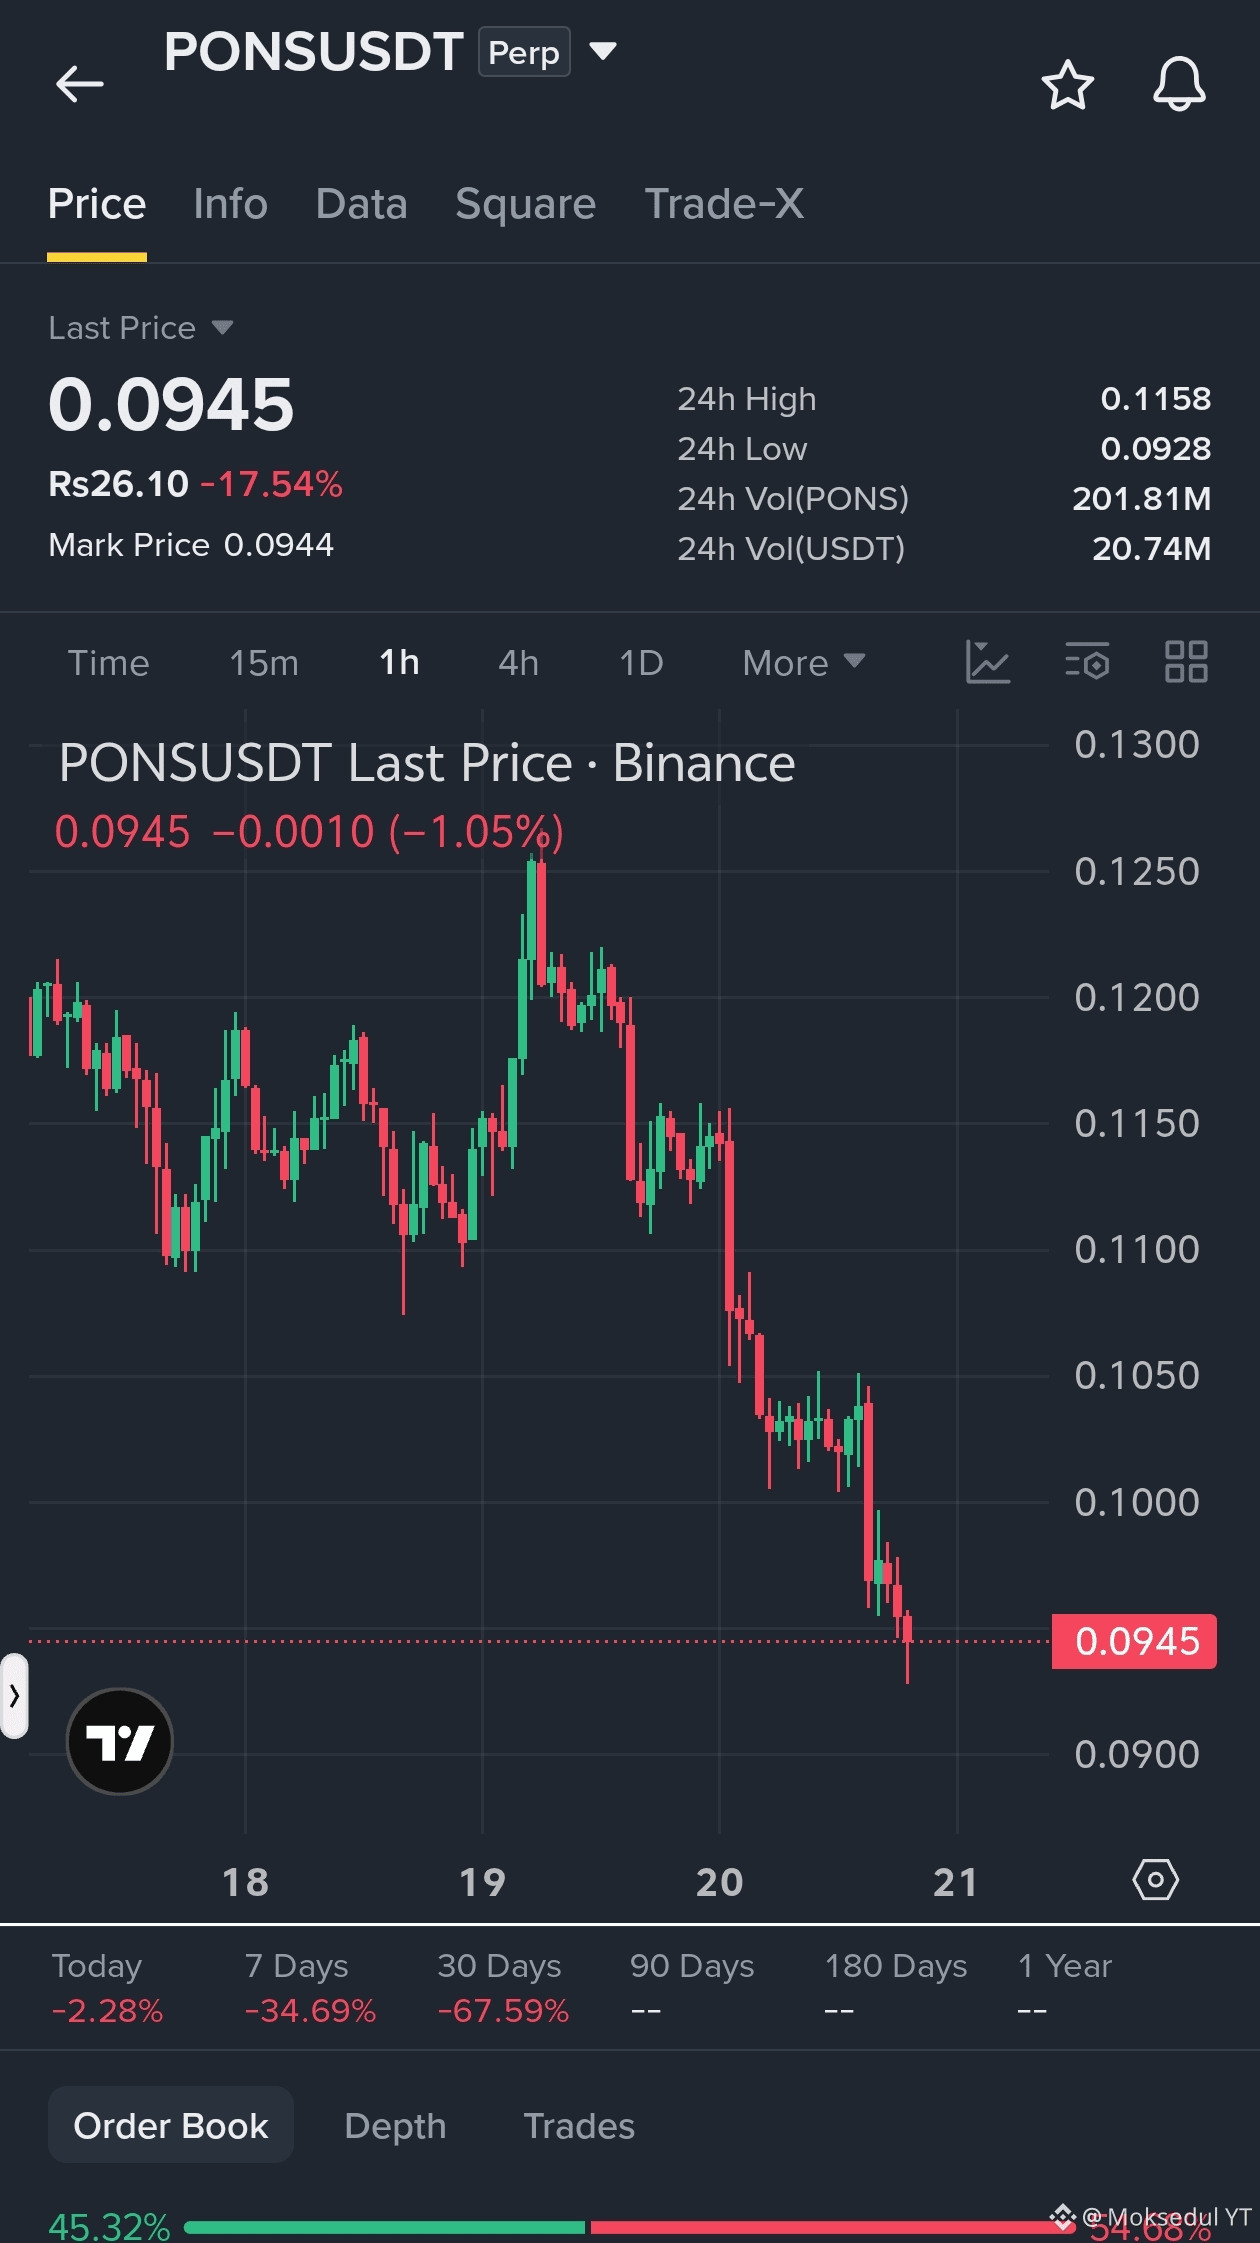
🚨 Guys Get Ready for a Big $PONS Short Opportunity‼️
Entry: 0.0945
TP: 0.0900
TP: 0.0850
SL: 0.1050
Fam, are you ready for #PONS s next move? After a massive rejection, $PONS is in a heavy downtrend and the bears are showing no mercy. I’m watching for a potential continuation dump toward the $0.085 level. Sellers are in full control right now! Let’s see the next move together! 📉
Manage your risk and watch for confirmation! 🐻
$AKE
🚨 Guys Get Ready for a Big $PONS Short Opportunity‼️
Entry: 0.0945
TP: 0.0900
TP: 0.0850
SL: 0.1050
Fam, are you ready for #PONS s next move? After a massive rejection, $PONS is in a heavy downtrend and the bears are showing no mercy. I’m watching for a potential continuation dump toward the $0.085 level. Sellers are in full control right now! Let’s see the next move together! 📉
Manage your risk and watch for confirmation! 🐻
$AKE
Entry: 0.0945
TP: 0.0900
TP: 0.0850
SL: 0.1050
Fam, are you ready for #PONS s next move? After a massive rejection, $PONS is in a heavy downtrend and the bears are showing no mercy. I’m watching for a potential continuation dump toward the $0.085 level. Sellers are in full control right now! Let’s see the next move together! 📉
Manage your risk and watch for confirmation! 🐻
$AKE
EllWeezy:
🐻🐻
1
2
1.2k

·
--
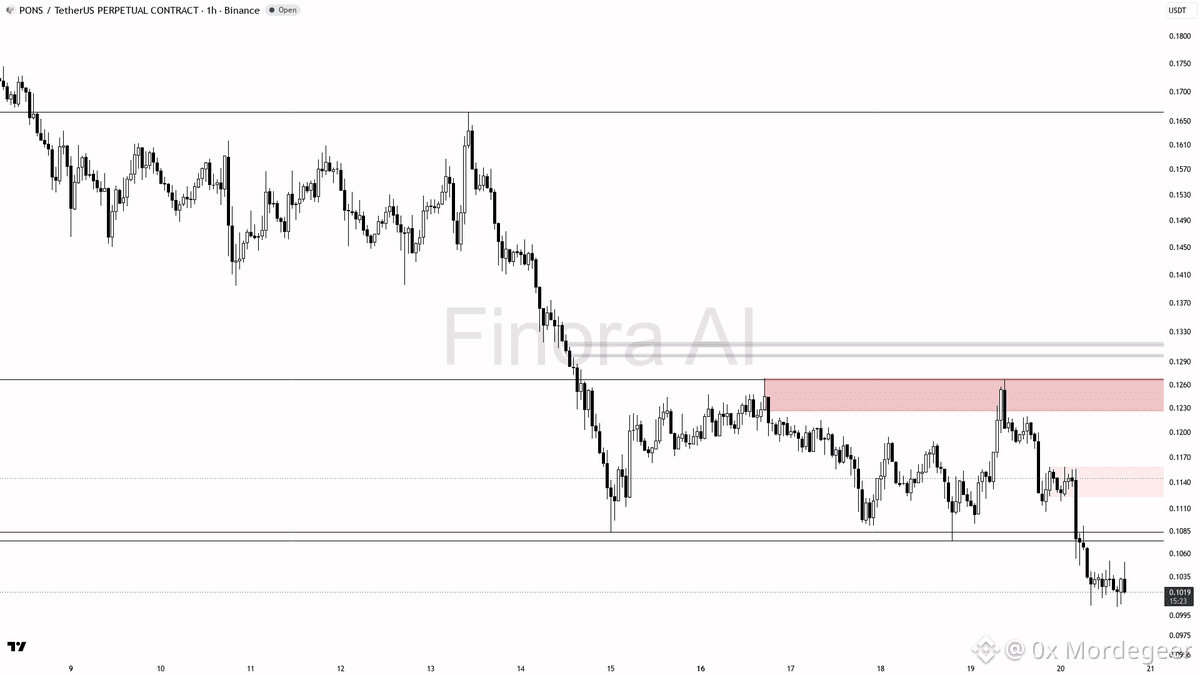
📊 $PONS Technical Analysis & Setup
$PONS is facing strong downside pressure, down 3% in 15m on 2.2x volume with a bearish overall structure below key moving averages. Avoid chasing the initial flush and wait for proper confirmation.
• Key Support / Demand: 0.1005 (swing low liquidity edge), 0.0975, and 0.0957 extension
• Resistance / Supply Targets: 0.1040, 0.1074 relief-retest zone, with 0.1067 overhead structure
• Trigger / Confirmation: Wait for a relief-retest of 0.1040-0.1074 and a lower-timeframe rejection (bearish engulfing, pin bar, or market structure shift) before executing shorts
• Risk / Invalidation: A confirmed 1h close above 0.1158 flips the bearish structure and invalidates the setup
• Market Execution: Monitor volume profiles and order book depth closely amid falling open interest ($10.6M, -11.2% 24h) and long-skewed positioning
DYOR — Educational setup, not financial advice.
#BinanceSquare #Crypto #PONS #Trading
📊 $PONS Technical Analysis & Setup
$PONS is facing strong downside pressure, down 3% in 15m on 2.2x volume with a bearish overall structure below key moving averages. Avoid chasing the initial flush and wait for proper confirmation.
• Key Support / Demand: 0.1005 (swing low liquidity edge), 0.0975, and 0.0957 extension
• Resistance / Supply Targets: 0.1040, 0.1074 relief-retest zone, with 0.1067 overhead structure
• Trigger / Confirmation: Wait for a relief-retest of 0.1040-0.1074 and a lower-timeframe rejection (bearish engulfing, pin bar, or market structure shift) before executing shorts
• Risk / Invalidation: A confirmed 1h close above 0.1158 flips the bearish structure and invalidates the setup
• Market Execution: Monitor volume profiles and order book depth closely amid falling open interest ($10.6M, -11.2% 24h) and long-skewed positioning
DYOR — Educational setup, not financial advice.
#BinanceSquare #Crypto #PONS #Trading
$PONS is facing strong downside pressure, down 3% in 15m on 2.2x volume with a bearish overall structure below key moving averages. Avoid chasing the initial flush and wait for proper confirmation.
• Key Support / Demand: 0.1005 (swing low liquidity edge), 0.0975, and 0.0957 extension
• Resistance / Supply Targets: 0.1040, 0.1074 relief-retest zone, with 0.1067 overhead structure
• Trigger / Confirmation: Wait for a relief-retest of 0.1040-0.1074 and a lower-timeframe rejection (bearish engulfing, pin bar, or market structure shift) before executing shorts
• Risk / Invalidation: A confirmed 1h close above 0.1158 flips the bearish structure and invalidates the setup
• Market Execution: Monitor volume profiles and order book depth closely amid falling open interest ($10.6M, -11.2% 24h) and long-skewed positioning
DYOR — Educational setup, not financial advice.
#BinanceSquare #Crypto #PONS #Trading
16

·
--
Bearish
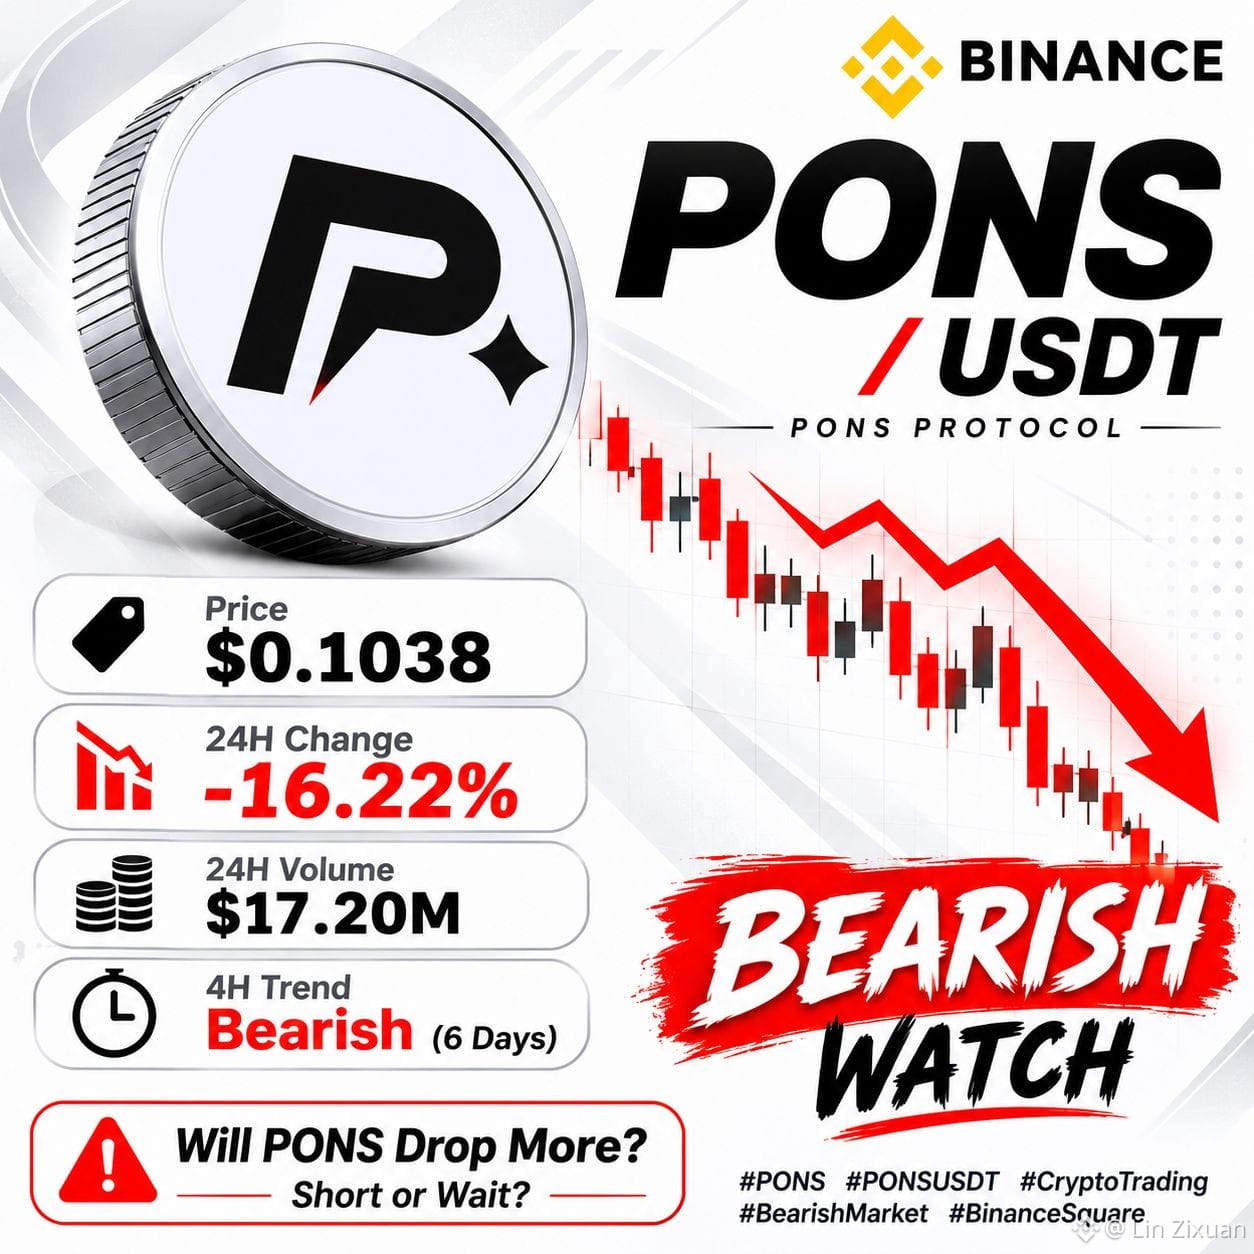
$PONS is under serious selling pressure today. 📉
💰 Price: $0.1038
🔴 24H: -16.22%
📊 Volume: $17.20M
⏳ 4H Trend: Bearish for 6 days
My 3 observations:
1️⃣ Sellers are dominating.
2️⃣ Downtrend is still active.
3️⃣ Waiting for a pullback before considering any SHORT.
No blind entries. Let the chart confirm first.
Would you SHORT $PONS ?
{alpha}(46630x39dbed3a2bd333467115de45665cc57f813c4571)
#pons #ponsusdt #CryptoTradingTips #Bearishmarket📊📥🔴 #altcoinseason
$PONS is under serious selling pressure today. 📉
💰 Price: $0.1038
🔴 24H: -16.22%
📊 Volume: $17.20M
⏳ 4H Trend: Bearish for 6 days
My 3 observations:
1️⃣ Sellers are dominating.
2️⃣ Downtrend is still active.
3️⃣ Waiting for a pullback before considering any SHORT.
No blind entries. Let the chart confirm first.
Would you SHORT $PONS ?
#pons #ponsusdt #CryptoTradingTips #Bearishmarket📊📥🔴 #altcoinseason
💰 Price: $0.1038
🔴 24H: -16.22%
📊 Volume: $17.20M
⏳ 4H Trend: Bearish for 6 days
My 3 observations:
1️⃣ Sellers are dominating.
2️⃣ Downtrend is still active.
3️⃣ Waiting for a pullback before considering any SHORT.
No blind entries. Let the chart confirm first.
Would you SHORT $PONS ?
#pons #ponsusdt #CryptoTradingTips #Bearishmarket📊📥🔴 #altcoinseason
25

·
--
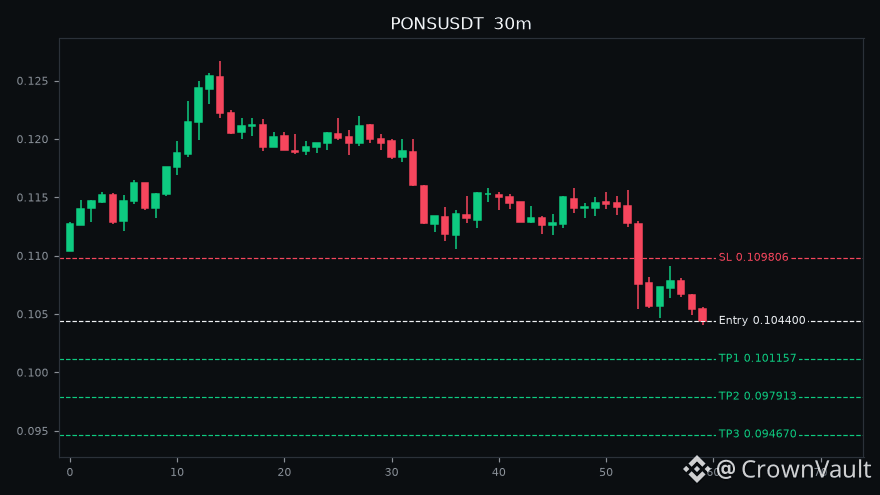
🔴 $PONS trade idea: SHORT (30m)
Entry: 0.104400
Stop Loss: 0.109806
TP1: 0.101157
TP2: 0.097913
TP3: 0.094670
EMA20 < EMA50 | RSI 26 | MACD bearish | ATR 2.4% | Vol 1.4x
Keep position size small.
#Futures #PONS #CryptoTrading #Binance
⚠️ Not financial advice. Do your own research.
🔴 $PONS trade idea: SHORT (30m)
Entry: 0.104400
Stop Loss: 0.109806
TP1: 0.101157
TP2: 0.097913
TP3: 0.094670
EMA20 < EMA50 | RSI 26 | MACD bearish | ATR 2.4% | Vol 1.4x
Keep position size small.
#Futures #PONS #CryptoTrading #Binance
⚠️ Not financial advice. Do your own research.
Entry: 0.104400
Stop Loss: 0.109806
TP1: 0.101157
TP2: 0.097913
TP3: 0.094670
EMA20 < EMA50 | RSI 26 | MACD bearish | ATR 2.4% | Vol 1.4x
Keep position size small.
#Futures #PONS #CryptoTrading #Binance
⚠️ Not financial advice. Do your own research.
6
Partly True
🚀 $PONS Is Expanding – 33% of Supply Burned! What's Next?
PONS has shared important updates that could influence its long-term market story.
🔥 1. Major Token Burn On November 12, Pons announced that 33% of the total $PONS supply had been burned. The project also stated that its treasury is actively acquiring $PONS on the open market.
📈 2. SPY Stock Token Growth On November 13, Pons highlighted SPDR S&P 500 Trust ($SPY) as its highest-volume ETF stock-token pair, reporting more than $3.25 billion in trading volume on Robinhood Chain. Pons accounted for over 8% of that volume.
🌐 3. Platform Adoption Pons also announced that more than 1 million tokens had been launched on its platform.
My Market Analysis:
These developments provide three important things to watch:
Reduced token supply through burns.
Growing exposure to stock-token trading.
Increasing platform launch activity.
However, token burns and platform growth do not automatically mean the PONS price will increase. Sustainable trading volume, liquidity, and actual demand remain important.
⚠️ Risk Warning: PONS is a highly speculative crypto asset. Price volatility, liquidity changes, declining platform activity, and market sentiment could create significant losses. Always DYOR before investing.
Discussion: Can continued token burns and stock-token growth help PONS build long-term momentum? Or does it need stronger demand first?
#pons #RobinhoodChain #crypto #TokenBurn #spy #Altcoins #BinanceSquare
🚀 $PONS Is Expanding – 33% of Supply Burned! What's Next?
PONS has shared important updates that could influence its long-term market story.
🔥 1. Major Token Burn On November 12, Pons announced that 33% of the total $PONS supply had been burned. The project also stated that its treasury is actively acquiring $PONS on the open market.
📈 2. SPY Stock Token Growth On November 13, Pons highlighted SPDR S&P 500 Trust ($SPY) as its highest-volume ETF stock-token pair, reporting more than $3.25 billion in trading volume on Robinhood Chain. Pons accounted for over 8% of that volume.
🌐 3. Platform Adoption Pons also announced that more than 1 million tokens had been launched on its platform.
My Market Analysis:
These developments provide three important things to watch:
Reduced token supply through burns.
Growing exposure to stock-token trading.
Increasing platform launch activity.
However, token burns and platform growth do not automatically mean the PONS price will increase. Sustainable trading volume, liquidity, and actual demand remain important.
⚠️ Risk Warning: PONS is a highly speculative crypto asset. Price volatility, liquidity changes, declining platform activity, and market sentiment could create significant losses. Always DYOR before investing.
Discussion: Can continued token burns and stock-token growth help PONS build long-term momentum? Or does it need stronger demand first?
#pons #RobinhoodChain #crypto #TokenBurn #spy #Altcoins #BinanceSquare
PONS has shared important updates that could influence its long-term market story.
🔥 1. Major Token Burn On November 12, Pons announced that 33% of the total $PONS supply had been burned. The project also stated that its treasury is actively acquiring $PONS on the open market.
📈 2. SPY Stock Token Growth On November 13, Pons highlighted SPDR S&P 500 Trust ($SPY) as its highest-volume ETF stock-token pair, reporting more than $3.25 billion in trading volume on Robinhood Chain. Pons accounted for over 8% of that volume.
🌐 3. Platform Adoption Pons also announced that more than 1 million tokens had been launched on its platform.
My Market Analysis:
These developments provide three important things to watch:
Reduced token supply through burns.
Growing exposure to stock-token trading.
Increasing platform launch activity.
However, token burns and platform growth do not automatically mean the PONS price will increase. Sustainable trading volume, liquidity, and actual demand remain important.
⚠️ Risk Warning: PONS is a highly speculative crypto asset. Price volatility, liquidity changes, declining platform activity, and market sentiment could create significant losses. Always DYOR before investing.
Discussion: Can continued token burns and stock-token growth help PONS build long-term momentum? Or does it need stronger demand first?
#pons #RobinhoodChain #crypto #TokenBurn #spy #Altcoins #BinanceSquare
windykiss:
follow em theo lệnh với anh ơi
1
688

·
--
$BIRB $MET $PONS 30-minute weakness; bearish trend confirmed on the 4-hour chart 🔥
════════════════════
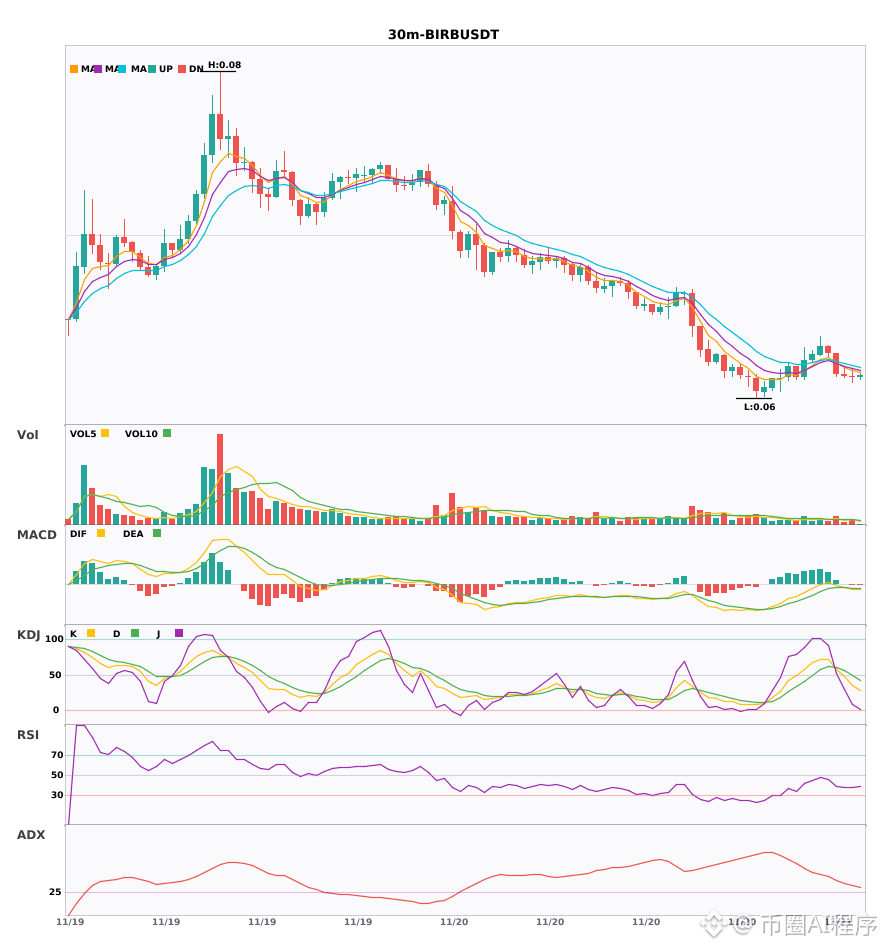
🟢 $BIRB 30-minute bearish signal
⚠️ Technical analysis: 4-hour bearish trend confirmed by 30-minute confluence. MACD death cross below zero, accelerating bearish momentum. EMA5 crossed below EMA8, turning bearish in the short term. Volume increased 1.6x.
════════════════════
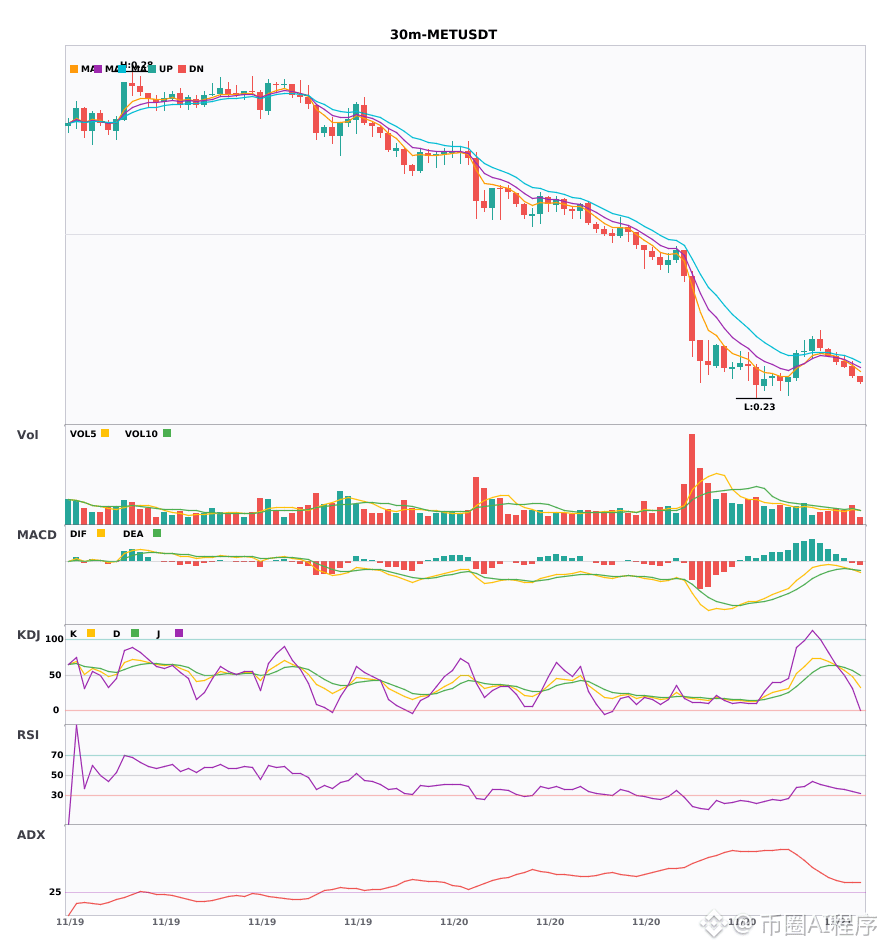
🟢 $MET 30-minute bearish signal
⚠️ Technical analysis: 30-minute MACD death cross below zero. Bearish moving average alignment has just formed, confirmed by 4-hour bearish confluence. Volume is at a normal 1.2x; a multi-timeframe confluence short signal.
════════════════════
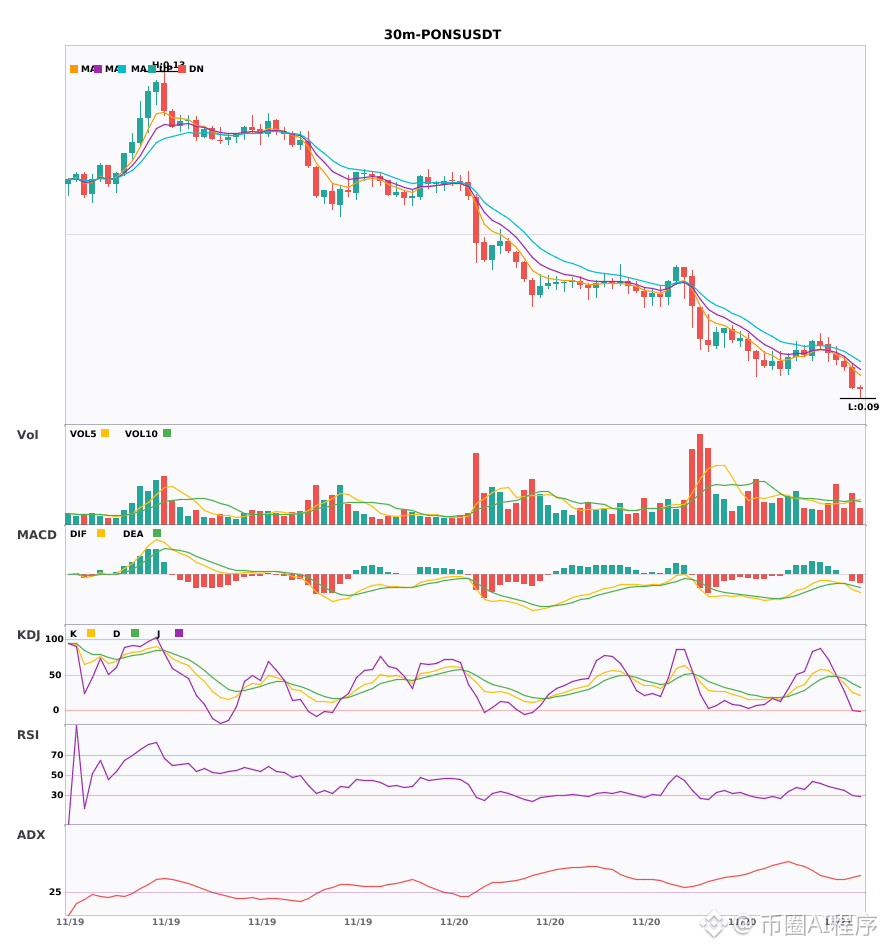
🟢 $PONS 30-minute bearish signal
⚠️ Technical analysis: 4-hour bearish confluence confirmed. 30-minute entry: MACD death cross below zero with expanding green bars, signaling accelerating bearish momentum; moving averages are bearishly aligned and diverging downward; KDJ is weak, with K crossing below D and not yet oversold. Volume is 1.3x—a multi-timeframe confluence short signal.
════════════════════
🔔 Follow for first-hand market alerts 🔔
#多周期共振 #BIRB #MET #PONS
📌 When trading, watch for whether the candlestick pattern confirms the signal
$BIRB $MET $PONS 30-minute weakness; bearish trend confirmed on the 4-hour chart 🔥
════════════════════
🟢 $BIRB 30-minute bearish signal
⚠️ Technical analysis: 4-hour bearish trend confirmed by 30-minute confluence. MACD death cross below zero, accelerating bearish momentum. EMA5 crossed below EMA8, turning bearish in the short term. Volume increased 1.6x.
════════════════════
🟢 $MET 30-minute bearish signal
⚠️ Technical analysis: 30-minute MACD death cross below zero. Bearish moving average alignment has just formed, confirmed by 4-hour bearish confluence. Volume is at a normal 1.2x; a multi-timeframe confluence short signal.
════════════════════
🟢 $PONS 30-minute bearish signal
⚠️ Technical analysis: 4-hour bearish confluence confirmed. 30-minute entry: MACD death cross below zero with expanding green bars, signaling accelerating bearish momentum; moving averages are bearishly aligned and diverging downward; KDJ is weak, with K crossing below D and not yet oversold. Volume is 1.3x—a multi-timeframe confluence short signal.
════════════════════
🔔 Follow for first-hand market alerts 🔔
#多周期共振 #BIRB #MET #PONS
📌 When trading, watch for whether the candlestick pattern confirms the signal
════════════════════
🟢 $BIRB 30-minute bearish signal
⚠️ Technical analysis: 4-hour bearish trend confirmed by 30-minute confluence. MACD death cross below zero, accelerating bearish momentum. EMA5 crossed below EMA8, turning bearish in the short term. Volume increased 1.6x.
════════════════════
🟢 $MET 30-minute bearish signal
⚠️ Technical analysis: 30-minute MACD death cross below zero. Bearish moving average alignment has just formed, confirmed by 4-hour bearish confluence. Volume is at a normal 1.2x; a multi-timeframe confluence short signal.
════════════════════
🟢 $PONS 30-minute bearish signal
⚠️ Technical analysis: 4-hour bearish confluence confirmed. 30-minute entry: MACD death cross below zero with expanding green bars, signaling accelerating bearish momentum; moving averages are bearishly aligned and diverging downward; KDJ is weak, with K crossing below D and not yet oversold. Volume is 1.3x—a multi-timeframe confluence short signal.
════════════════════
🔔 Follow for first-hand market alerts 🔔
#多周期共振 #BIRB #MET #PONS
📌 When trading, watch for whether the candlestick pattern confirms the signal
70

·
--
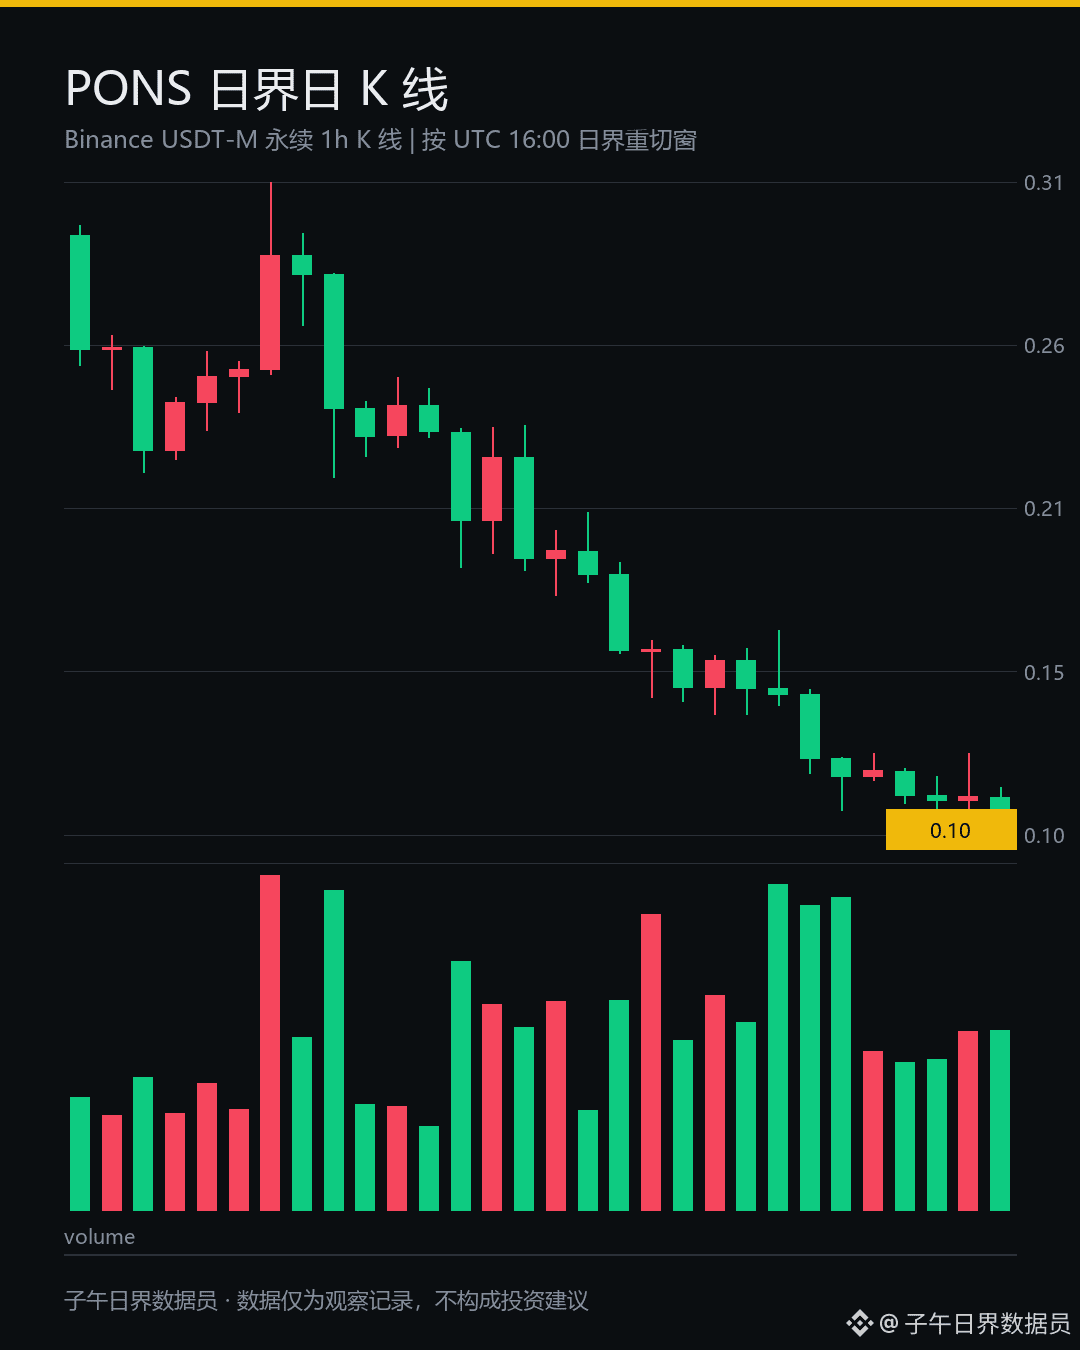
I froze for a moment when I came across this $PONS chart, and had to check twice before believing it was the same coin.
It broke.
Down 14.405% in 24 hours, sliding all the way from the top of its 20-day range to 0.1005.
That was the floor of the entire previous range, and today it broke straight through it by 3.69%.
Trading volume was 17.24 million—not exactly quiet.
But the number of contracts held increased by 2.93%, while notional value shrank by 13.08%. That suggests new positions were opened at much lower prices.
When a thinly traded coin breaks below the low of its previous range, all the support can disappear at once. Even limit orders are unwilling to sit there for another second.
It’s like draining a reservoir: once the gates open, it’s always the top layer that gets swept away first.
There wasn’t much liquidity in that layer to begin with, so once liquidity is pulled, the bottom shows through.
Long accounts make up 58.29%, and the funding rate is still positive at 0.005%.
With the price like this, accounts are still tilted long and the funding rate hasn’t turned negative. Those two numbers look pretty awkward side by side.
It suggests that the positions that should have been closed haven’t been closed yet.
My stance is simply to keep watching and not touch anything.
What do you think? With positions still carrying a positive funding rate after breaking below the bottom of the range, is this the final leg down, or just the beginning?
$BTC $ETH
#PONS #比特币 #Cryptocurrency
The above is a record of my personal trading system and observations of market data. It does not constitute investment advice
I froze for a moment when I came across this $PONS chart, and had to check twice before believing it was the same coin.
It broke.
Down 14.405% in 24 hours, sliding all the way from the top of its 20-day range to 0.1005.
That was the floor of the entire previous range, and today it broke straight through it by 3.69%.
Trading volume was 17.24 million—not exactly quiet.
But the number of contracts held increased by 2.93%, while notional value shrank by 13.08%. That suggests new positions were opened at much lower prices.
When a thinly traded coin breaks below the low of its previous range, all the support can disappear at once. Even limit orders are unwilling to sit there for another second.
It’s like draining a reservoir: once the gates open, it’s always the top layer that gets swept away first.
There wasn’t much liquidity in that layer to begin with, so once liquidity is pulled, the bottom shows through.
Long accounts make up 58.29%, and the funding rate is still positive at 0.005%.
With the price like this, accounts are still tilted long and the funding rate hasn’t turned negative. Those two numbers look pretty awkward side by side.
It suggests that the positions that should have been closed haven’t been closed yet.
My stance is simply to keep watching and not touch anything.
What do you think? With positions still carrying a positive funding rate after breaking below the bottom of the range, is this the final leg down, or just the beginning?
$BTC $ETH
#PONS #比特币 #Cryptocurrency
The above is a record of my personal trading system and observations of market data. It does not constitute investment advice
It broke.
Down 14.405% in 24 hours, sliding all the way from the top of its 20-day range to 0.1005.
That was the floor of the entire previous range, and today it broke straight through it by 3.69%.
Trading volume was 17.24 million—not exactly quiet.
But the number of contracts held increased by 2.93%, while notional value shrank by 13.08%. That suggests new positions were opened at much lower prices.
When a thinly traded coin breaks below the low of its previous range, all the support can disappear at once. Even limit orders are unwilling to sit there for another second.
It’s like draining a reservoir: once the gates open, it’s always the top layer that gets swept away first.
There wasn’t much liquidity in that layer to begin with, so once liquidity is pulled, the bottom shows through.
Long accounts make up 58.29%, and the funding rate is still positive at 0.005%.
With the price like this, accounts are still tilted long and the funding rate hasn’t turned negative. Those two numbers look pretty awkward side by side.
It suggests that the positions that should have been closed haven’t been closed yet.
My stance is simply to keep watching and not touch anything.
What do you think? With positions still carrying a positive funding rate after breaking below the bottom of the range, is this the final leg down, or just the beginning?
$BTC $ETH
#PONS #比特币 #Cryptocurrency
The above is a record of my personal trading system and observations of market data. It does not constitute investment advice
236

·
--
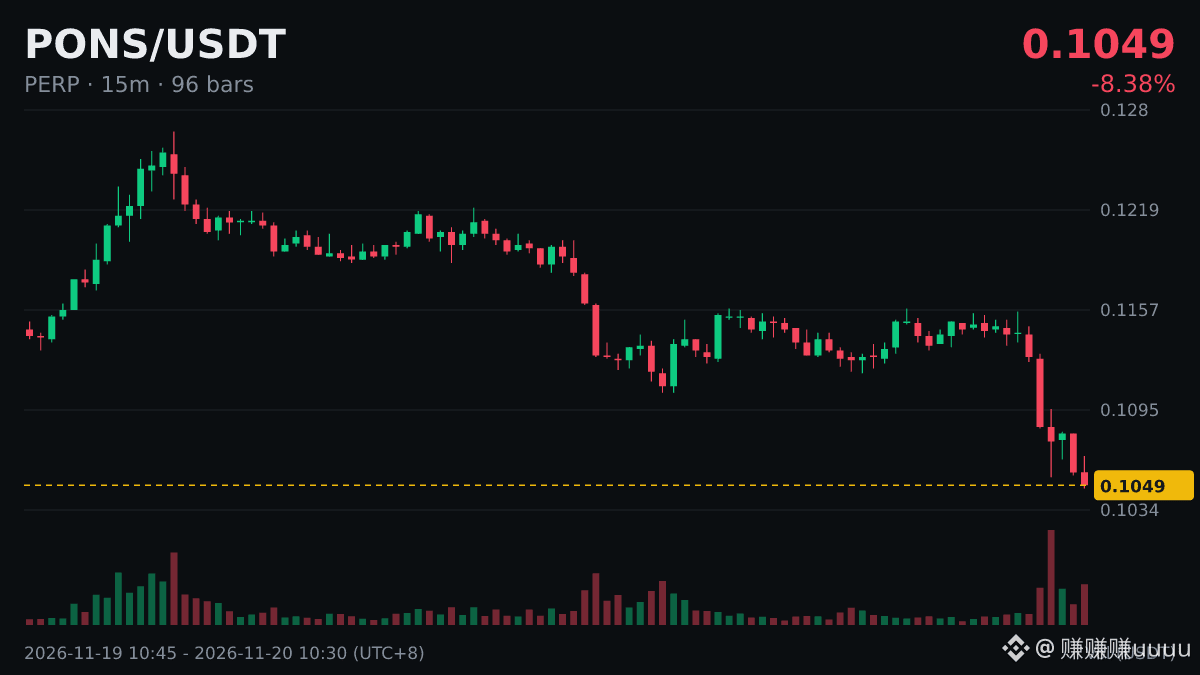
🐋 $PONS hit a 30-day low, and selling hasn’t stopped.
Current price: 0.105, breaking below the previous low of 0.1054. 24-hour trading volume: $17.68 million.
There are often many long-position stop-loss orders below the previous low, and breaking below it can trigger a cascade of stop-losses. Watch for large orders buying at low prices.
#PONS
🐋 $PONS hit a 30-day low, and selling hasn’t stopped.
Current price: 0.105, breaking below the previous low of 0.1054. 24-hour trading volume: $17.68 million.
There are often many long-position stop-loss orders below the previous low, and breaking below it can trigger a cascade of stop-losses. Watch for large orders buying at low prices.
#PONS
Current price: 0.105, breaking below the previous low of 0.1054. 24-hour trading volume: $17.68 million.
There are often many long-position stop-loss orders below the previous low, and breaking below it can trigger a cascade of stop-losses. Watch for large orders buying at low prices.
#PONS
464

·
--
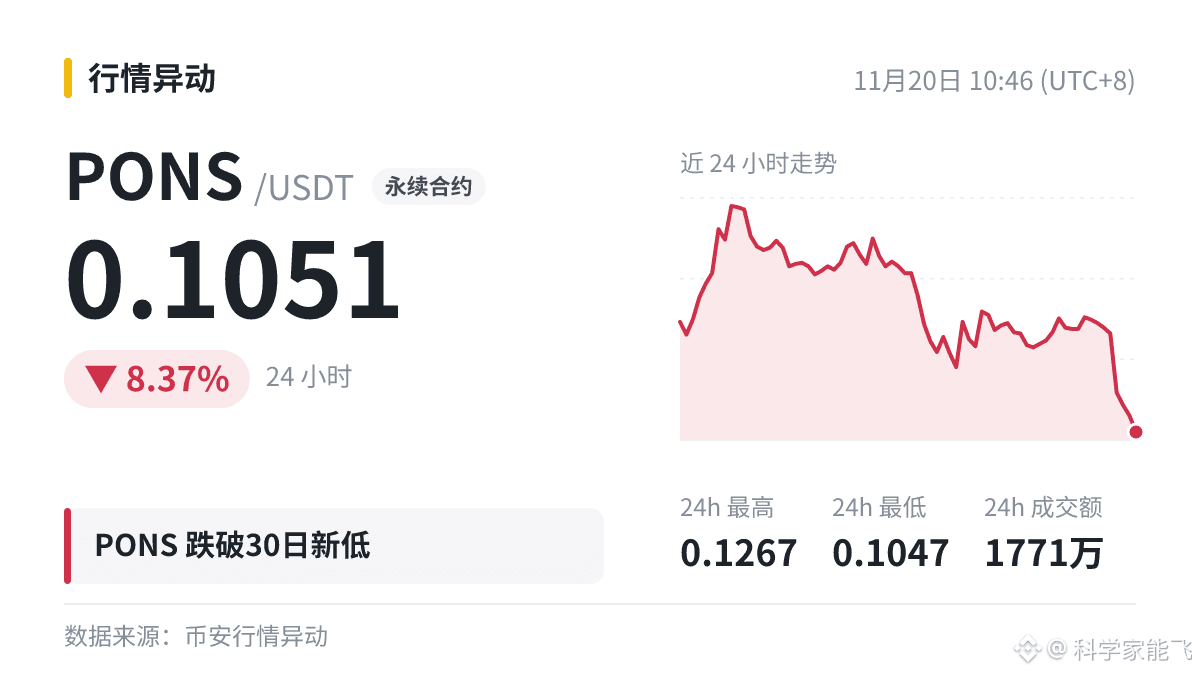
Now | $PONS has fallen below the 30-day low, at 0.1051 (previous low: 0.1054), down 8.37% in 24h. Until there’s a signal that it has bottomed, it’s safer to make fewer moves. That’s it for now; we’ll review again in a few days.
#PONS
Now | $PONS has fallen below the 30-day low, at 0.1051 (previous low: 0.1054), down 8.37% in 24h. Until there’s a signal that it has bottomed, it’s safer to make fewer moves. That’s it for now; we’ll review again in a few days.
#PONS
#PONS
53

·
--
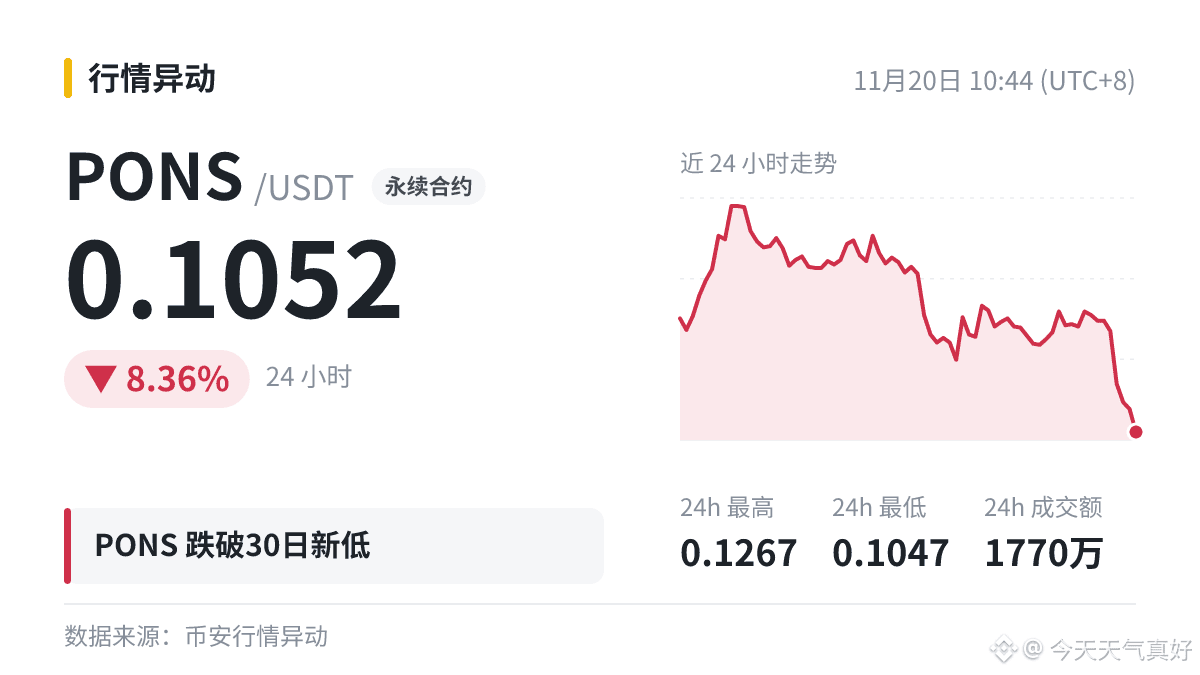
👀 Funds Watch:
$PONS 30 hits a new daily low. Current price: 0.1052; previous low: 0.1054; 24h: -8.36%.
There’s no clear support at these low levels for now, and large orders are mostly being pulled. Don’t rush to buy the dip.
Do you think the market’s reaction is overdone?
#PONS
👀 Funds Watch:
$PONS 30 hits a new daily low. Current price: 0.1052; previous low: 0.1054; 24h: -8.36%.
There’s no clear support at these low levels for now, and large orders are mostly being pulled. Don’t rush to buy the dip.
Do you think the market’s reaction is overdone?
#PONS
$PONS 30 hits a new daily low. Current price: 0.1052; previous low: 0.1054; 24h: -8.36%.
There’s no clear support at these low levels for now, and large orders are mostly being pulled. Don’t rush to buy the dip.
Do you think the market’s reaction is overdone?
#PONS
64

·
--
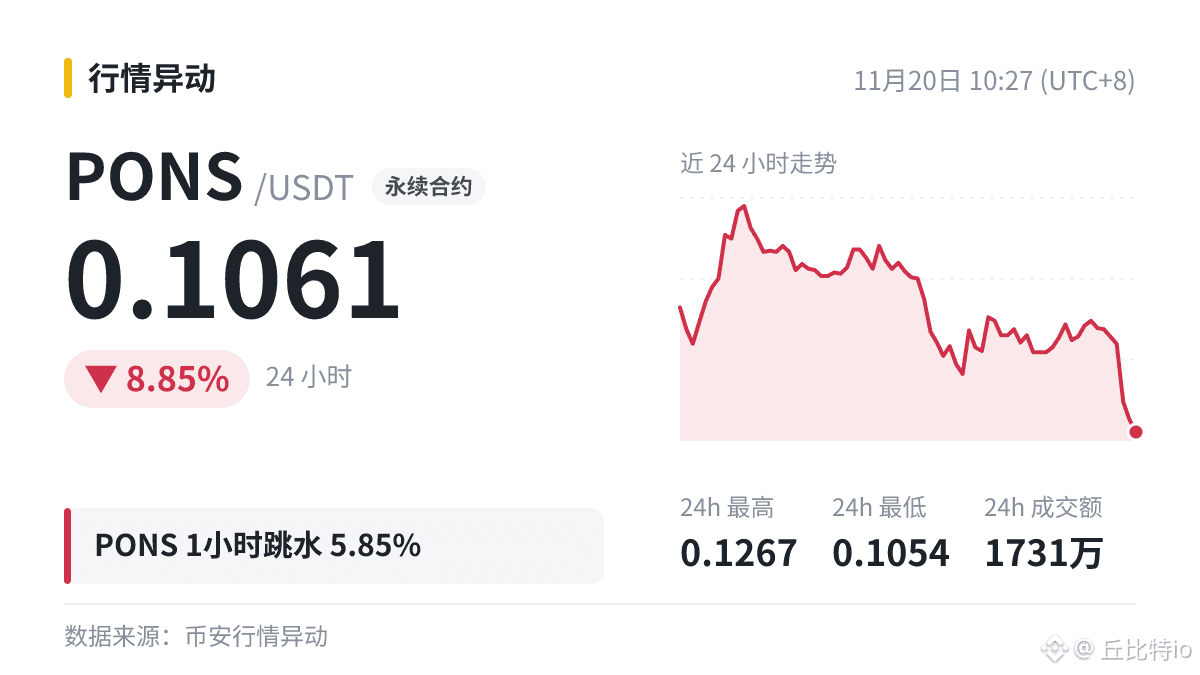
Whoa, what is $PONS supposed to be doing?
Down 5.85% in an hour, current price 0.1061, 1h -6.19%.
Panic is starting to spread. Don’t rush to cut your losses; think through your exit strategy first…
Keep your leverage low so you can stay calmer during the downturn.
#PONS
Whoa, what is $PONS supposed to be doing?
Down 5.85% in an hour, current price 0.1061, 1h -6.19%.
Panic is starting to spread. Don’t rush to cut your losses; think through your exit strategy first…
Keep your leverage low so you can stay calmer during the downturn.
#PONS
Down 5.85% in an hour, current price 0.1061, 1h -6.19%.
Panic is starting to spread. Don’t rush to cut your losses; think through your exit strategy first…
Keep your leverage low so you can stay calmer during the downturn.
#PONS
48

·
--
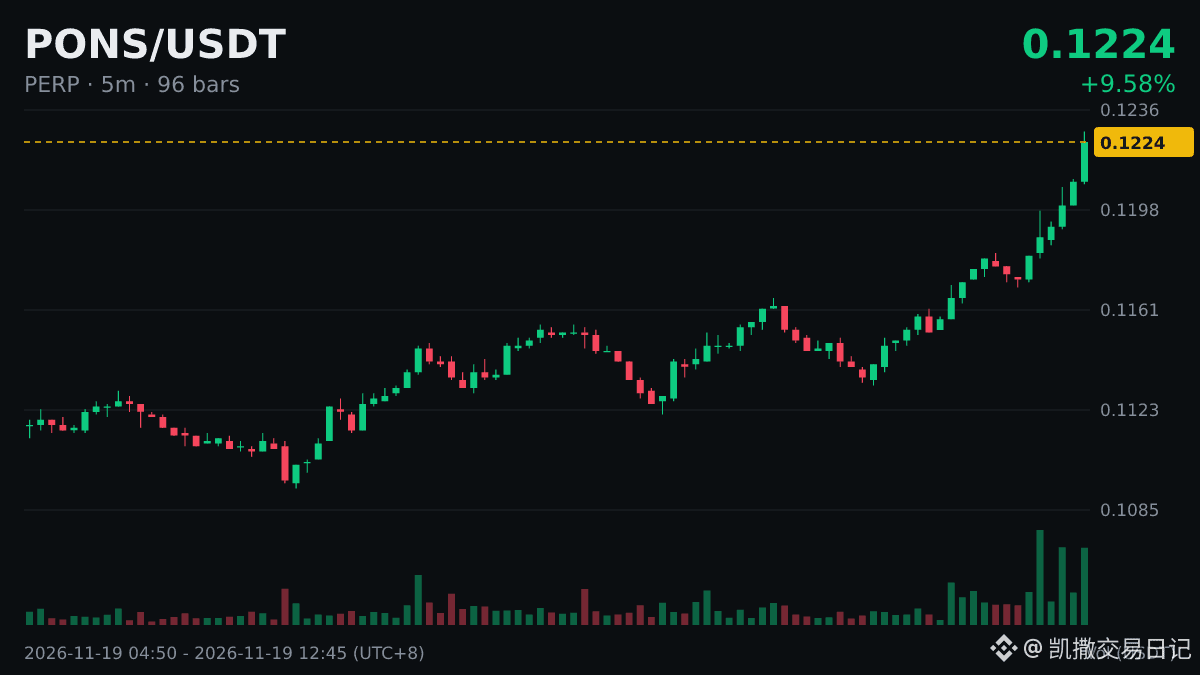
$PONS 1-hour rally of 5.32%, with 24h trading volume of $11.94 million.
Large investors' moves often show up in trading volume first, while price tends to follow afterward.
The more smoothly it rises, the more you should move your defensive levels upward.
#PONS
Just sharing; this is not investment advice.
$PONS 1-hour rally of 5.32%, with 24h trading volume of $11.94 million.
Large investors' moves often show up in trading volume first, while price tends to follow afterward.
The more smoothly it rises, the more you should move your defensive levels upward.
#PONS
Just sharing; this is not investment advice.
Large investors' moves often show up in trading volume first, while price tends to follow afterward.
The more smoothly it rises, the more you should move your defensive levels upward.
#PONS
Just sharing; this is not investment advice.
12

·
--
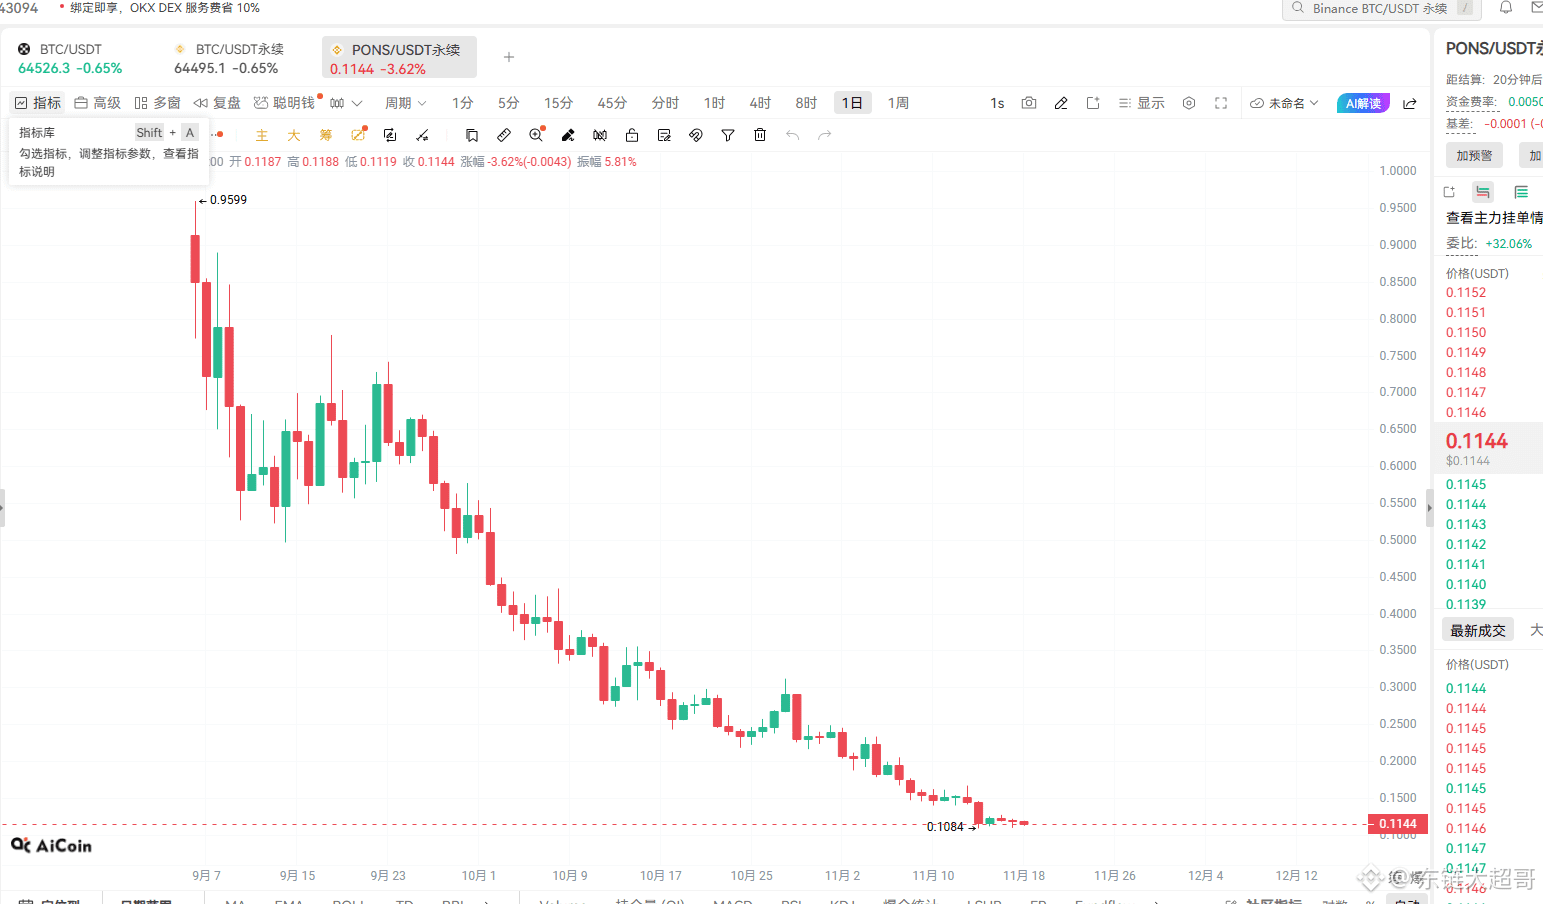
I really can't figure it out: PONS was a platform making over $10 million a day, yet its price has fallen from $1 to $0.10.
At its peak in September, PONS was generating over $10 million a day in fees—more than the entire Robinhood Chain was earning at the time.
They used the money they made to buy PONS and burn it. So far, 330 million tokens have been burned—more than 30% of the supply is gone—yet the price has still crashed hard.
The main reason people piled into PONS back then was that the platform was making money every day and using it to buy and burn tokens. The supply kept shrinking, so the price kept going up.
But once the Robinhood Chain cooled off, nobody was launching tokens anymore. By early November, daily fees were down to around $250,000—more than 40 times lower.
The platform stopped making money, so the funds for buying and burning tokens dried up too. Naturally, everyone who came for that left.
Put simply, PONS isn't a bad platform—the problem is that nobody's using the Robinhood Chain anymore.
Dachao is still firmly bullish on it. If the chain stays quiet for a day, PONS will keep grinding for a day. As soon as the Robinhood Chain heats up again, PONS will most likely be the first to take off, haha.
CA: 0x39dBED3a2bd333467115dE45665cC57F813C4571 #PONS
$PONS
I really can't figure it out: PONS was a platform making over $10 million a day, yet its price has fallen from $1 to $0.10.
At its peak in September, PONS was generating over $10 million a day in fees—more than the entire Robinhood Chain was earning at the time.
They used the money they made to buy PONS and burn it. So far, 330 million tokens have been burned—more than 30% of the supply is gone—yet the price has still crashed hard.
The main reason people piled into PONS back then was that the platform was making money every day and using it to buy and burn tokens. The supply kept shrinking, so the price kept going up.
But once the Robinhood Chain cooled off, nobody was launching tokens anymore. By early November, daily fees were down to around $250,000—more than 40 times lower.
The platform stopped making money, so the funds for buying and burning tokens dried up too. Naturally, everyone who came for that left.
Put simply, PONS isn't a bad platform—the problem is that nobody's using the Robinhood Chain anymore.
Dachao is still firmly bullish on it. If the chain stays quiet for a day, PONS will keep grinding for a day. As soon as the Robinhood Chain heats up again, PONS will most likely be the first to take off, haha.
CA: 0x39dBED3a2bd333467115dE45665cC57F813C4571 #PONS
$PONS
At its peak in September, PONS was generating over $10 million a day in fees—more than the entire Robinhood Chain was earning at the time.
They used the money they made to buy PONS and burn it. So far, 330 million tokens have been burned—more than 30% of the supply is gone—yet the price has still crashed hard.
The main reason people piled into PONS back then was that the platform was making money every day and using it to buy and burn tokens. The supply kept shrinking, so the price kept going up.
But once the Robinhood Chain cooled off, nobody was launching tokens anymore. By early November, daily fees were down to around $250,000—more than 40 times lower.
The platform stopped making money, so the funds for buying and burning tokens dried up too. Naturally, everyone who came for that left.
Put simply, PONS isn't a bad platform—the problem is that nobody's using the Robinhood Chain anymore.
Dachao is still firmly bullish on it. If the chain stays quiet for a day, PONS will keep grinding for a day. As soon as the Robinhood Chain heats up again, PONS will most likely be the first to take off, haha.
CA: 0x39dBED3a2bd333467115dE45665cC57F813C4571 #PONS
$PONS
Gina Adderly ueIO:
发这文案有奖励吗?全网在发
1
3.4k

·
--
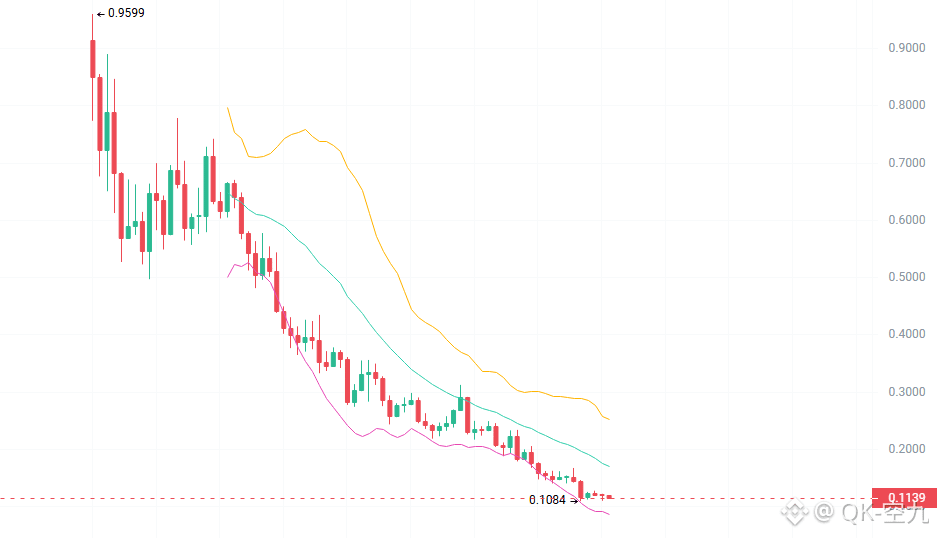
PONS (Fat to Death): This Year's Biggest PONS Scam?
When it first launched, the Robinhood chain was booming, with an incredible sense of momentum, and countless people got hooked. PONS was also widely praised because it was the platform's launch token.
It opened around 0.96, but then began sliding steadily. Last month, when it was around 0.45, I had already said it would at least get cut in half.
I said it could fall to around 0.25 and got mocked by quite a few people. But when it finally got there, countless people started buying the dip. We, however, were watching for 0.19.
Once it reached 0.19, we bought the dip. It bounced back to around 0.23, but things didn't look right, so we got out. In the end, we were watching for around 0.13—who knew it would drop to around 0.1?
PONS has been falling continuously since the beginning, with no sign of a rebound. I dare say plenty of good people are still stuck watching from the sidelines at 0.9, 0.8, and 0.7! $PONS #pons
{future}(PONSUSDT)
PONS (Fat to Death): This Year's Biggest PONS Scam?
When it first launched, the Robinhood chain was booming, with an incredible sense of momentum, and countless people got hooked. PONS was also widely praised because it was the platform's launch token.
It opened around 0.96, but then began sliding steadily. Last month, when it was around 0.45, I had already said it would at least get cut in half.
I said it could fall to around 0.25 and got mocked by quite a few people. But when it finally got there, countless people started buying the dip. We, however, were watching for 0.19.
Once it reached 0.19, we bought the dip. It bounced back to around 0.23, but things didn't look right, so we got out. In the end, we were watching for around 0.13—who knew it would drop to around 0.1?
PONS has been falling continuously since the beginning, with no sign of a rebound. I dare say plenty of good people are still stuck watching from the sidelines at 0.9, 0.8, and 0.7! $PONS #pons
When it first launched, the Robinhood chain was booming, with an incredible sense of momentum, and countless people got hooked. PONS was also widely praised because it was the platform's launch token.
It opened around 0.96, but then began sliding steadily. Last month, when it was around 0.45, I had already said it would at least get cut in half.
I said it could fall to around 0.25 and got mocked by quite a few people. But when it finally got there, countless people started buying the dip. We, however, were watching for 0.19.
Once it reached 0.19, we bought the dip. It bounced back to around 0.23, but things didn't look right, so we got out. In the end, we were watching for around 0.13—who knew it would drop to around 0.1?
PONS has been falling continuously since the beginning, with no sign of a rebound. I dare say plenty of good people are still stuck watching from the sidelines at 0.9, 0.8, and 0.7! $PONS #pons
夫妻团队-叶先森:
但愿吧!更希望去0.03开头再买点!
4
2.3k

·
--
🔥 $PONS rebounded from 0.11 to 0.114, with short-term investor interest continuing to heat up. The average 15-minute volatility is 0.85%, with a maximum of 1.24%. Market sentiment is stable, with no clear signs of selling pressure.
📊 Bullish momentum: Buzz around the market has attracted dip-buying. The candlestick chart shows a series of small bullish candles. The 6th candle surged to 0.12 on high volume, then pulled back on lower volume. Support at 0.112–0.113 is holding, and the short-term trend remains range-bound with a bullish bias.
🚀 Trading suggestions:
- Consider a small long position on a pullback to 0.112–0.113, with a stop-loss at 0.109 and a target of 0.118–0.120;
- If price breaks above 0.116 on high volume, consider going long, with 0.113 as the stop.
⚠️ If it falls below 0.110, stay on the sidelines. Manage your position size. DYOR. #PONS #加密货币 #Short-term trading
🔥 $PONS rebounded from 0.11 to 0.114, with short-term investor interest continuing to heat up. The average 15-minute volatility is 0.85%, with a maximum of 1.24%. Market sentiment is stable, with no clear signs of selling pressure.
📊 Bullish momentum: Buzz around the market has attracted dip-buying. The candlestick chart shows a series of small bullish candles. The 6th candle surged to 0.12 on high volume, then pulled back on lower volume. Support at 0.112–0.113 is holding, and the short-term trend remains range-bound with a bullish bias.
🚀 Trading suggestions:
- Consider a small long position on a pullback to 0.112–0.113, with a stop-loss at 0.109 and a target of 0.118–0.120;
- If price breaks above 0.116 on high volume, consider going long, with 0.113 as the stop.
⚠️ If it falls below 0.110, stay on the sidelines. Manage your position size. DYOR. #PONS #加密货币 #Short-term trading
📊 Bullish momentum: Buzz around the market has attracted dip-buying. The candlestick chart shows a series of small bullish candles. The 6th candle surged to 0.12 on high volume, then pulled back on lower volume. Support at 0.112–0.113 is holding, and the short-term trend remains range-bound with a bullish bias.
🚀 Trading suggestions:
- Consider a small long position on a pullback to 0.112–0.113, with a stop-loss at 0.109 and a target of 0.118–0.120;
- If price breaks above 0.116 on high volume, consider going long, with 0.113 as the stop.
⚠️ If it falls below 0.110, stay on the sidelines. Manage your position size. DYOR. #PONS #加密货币 #Short-term trading
558

·
--
🔥 $PONS Short-Term Sharp Drop Analysis
Current price $PONSUSDT: 0.1143
📉 Reasons for the drop:
The 15-minute chart shows that $PONS surged to 0.12 on the sixth candlestick, then pulled back with two consecutive bearish candles. Rebound volume fell from 1.13 million to 730,000, indicating heavy selling pressure above 0.12 and insufficient buying support. Average volatility of 0.92% is normal; this is not a liquidity collapse, but more likely profit-taking after the surge combined with resistance overhead.
⚡️ Short-term trading strategy:
The bias is range-bound to bearish. Pay close attention to two levels:
🔹 Resistance: 0.118–0.122
🔹 Support: 0.110–0.105
🟥 Short: If a rebound to 0.116–0.118 stalls or is followed by a high-volume bearish candle, consider a small short position. Set a stop-loss above 0.122, with targets at 0.110 → 0.105.
🟩 Long: If the price reclaims and holds above 0.120, then retests 0.118 without breaking below it, consider a small long position. Set a stop-loss below 0.114, with a target of 0.128–0.130.
⚠️ If the price breaks below 0.110, don't rush to buy the dip; the decline could accelerate. PONS is volatile, so manage your position size and use strict stop-losses. #PONS #交易策略 #Cryptocurrency
🔥 $PONS Short-Term Sharp Drop Analysis
Current price $PONSUSDT: 0.1143
📉 Reasons for the drop:
The 15-minute chart shows that $PONS surged to 0.12 on the sixth candlestick, then pulled back with two consecutive bearish candles. Rebound volume fell from 1.13 million to 730,000, indicating heavy selling pressure above 0.12 and insufficient buying support. Average volatility of 0.92% is normal; this is not a liquidity collapse, but more likely profit-taking after the surge combined with resistance overhead.
⚡️ Short-term trading strategy:
The bias is range-bound to bearish. Pay close attention to two levels:
🔹 Resistance: 0.118–0.122
🔹 Support: 0.110–0.105
🟥 Short: If a rebound to 0.116–0.118 stalls or is followed by a high-volume bearish candle, consider a small short position. Set a stop-loss above 0.122, with targets at 0.110 → 0.105.
🟩 Long: If the price reclaims and holds above 0.120, then retests 0.118 without breaking below it, consider a small long position. Set a stop-loss below 0.114, with a target of 0.128–0.130.
⚠️ If the price breaks below 0.110, don't rush to buy the dip; the decline could accelerate. PONS is volatile, so manage your position size and use strict stop-losses. #PONS #交易策略 #Cryptocurrency
Current price $PONSUSDT: 0.1143
📉 Reasons for the drop:
The 15-minute chart shows that $PONS surged to 0.12 on the sixth candlestick, then pulled back with two consecutive bearish candles. Rebound volume fell from 1.13 million to 730,000, indicating heavy selling pressure above 0.12 and insufficient buying support. Average volatility of 0.92% is normal; this is not a liquidity collapse, but more likely profit-taking after the surge combined with resistance overhead.
⚡️ Short-term trading strategy:
The bias is range-bound to bearish. Pay close attention to two levels:
🔹 Resistance: 0.118–0.122
🔹 Support: 0.110–0.105
🟥 Short: If a rebound to 0.116–0.118 stalls or is followed by a high-volume bearish candle, consider a small short position. Set a stop-loss above 0.122, with targets at 0.110 → 0.105.
🟩 Long: If the price reclaims and holds above 0.120, then retests 0.118 without breaking below it, consider a small long position. Set a stop-loss below 0.114, with a target of 0.128–0.130.
⚠️ If the price breaks below 0.110, don't rush to buy the dip; the decline could accelerate. PONS is volatile, so manage your position size and use strict stop-losses. #PONS #交易策略 #Cryptocurrency
515
·
--
🔥 $PONS Short-Term Analysis | Current Price $0.1138
📊 Last 10 candles on the 15-minute timeframe: average change -0.12%, average range 0.90%, maximum move 1.49%. There are slightly more bearish candles, but their bodies are small, indicating insufficient bearish momentum. The market is showing low-volatility, range-bound movement.
🧭 Key Levels:
Resistance: $0.1150 / $0.1200
Support: $0.1120 / $0.1100
⚠️ Should you enter a trade? An immediate entry is not recommended. The price is in the middle of the range, and trading volume shows no significant change. The risk/reward ratio is unattractive before a breakout, and you could easily get stopped out by price swings.
💡 Short-Term Strategy (Conditional Orders):
1️⃣ If price breaks above $0.1150 on increased volume, go long with a small position. Target: $0.1200; stop-loss: $0.1120.
2️⃣ If price falls below $0.1120, go short with a small position. Targets: $0.1100 / $0.1080; stop-loss: $0.1140.
3️⃣ Until a breakout, it is best to stay out of the market and wait for a clear direction.
🛡️ Risk Management: Keep each position below 5%, use strict stop-losses, and do not hold positions overnight.
#PONS #Crypto #Short-Term
🔥 $PONS Short-Term Analysis | Current Price $0.1138
📊 Last 10 candles on the 15-minute timeframe: average change -0.12%, average range 0.90%, maximum move 1.49%. There are slightly more bearish candles, but their bodies are small, indicating insufficient bearish momentum. The market is showing low-volatility, range-bound movement.
🧭 Key Levels:
Resistance: $0.1150 / $0.1200
Support: $0.1120 / $0.1100
⚠️ Should you enter a trade? An immediate entry is not recommended. The price is in the middle of the range, and trading volume shows no significant change. The risk/reward ratio is unattractive before a breakout, and you could easily get stopped out by price swings.
💡 Short-Term Strategy (Conditional Orders):
1️⃣ If price breaks above $0.1150 on increased volume, go long with a small position. Target: $0.1200; stop-loss: $0.1120.
2️⃣ If price falls below $0.1120, go short with a small position. Targets: $0.1100 / $0.1080; stop-loss: $0.1140.
3️⃣ Until a breakout, it is best to stay out of the market and wait for a clear direction.
🛡️ Risk Management: Keep each position below 5%, use strict stop-losses, and do not hold positions overnight.
#PONS #Crypto #Short-Term
📊 Last 10 candles on the 15-minute timeframe: average change -0.12%, average range 0.90%, maximum move 1.49%. There are slightly more bearish candles, but their bodies are small, indicating insufficient bearish momentum. The market is showing low-volatility, range-bound movement.
🧭 Key Levels:
Resistance: $0.1150 / $0.1200
Support: $0.1120 / $0.1100
⚠️ Should you enter a trade? An immediate entry is not recommended. The price is in the middle of the range, and trading volume shows no significant change. The risk/reward ratio is unattractive before a breakout, and you could easily get stopped out by price swings.
💡 Short-Term Strategy (Conditional Orders):
1️⃣ If price breaks above $0.1150 on increased volume, go long with a small position. Target: $0.1200; stop-loss: $0.1120.
2️⃣ If price falls below $0.1120, go short with a small position. Targets: $0.1100 / $0.1080; stop-loss: $0.1140.
3️⃣ Until a breakout, it is best to stay out of the market and wait for a clear direction.
🛡️ Risk Management: Keep each position below 5%, use strict stop-losses, and do not hold positions overnight.
#PONS #Crypto #Short-Term
711
·
--
🔥 $PONS Short-term capital interest is heating up, with the price rebounding from 0.11 to 0.114. The average 15-minute volatility is 0.85%, with a maximum of 1.24%, which is within the normal range; no panic selling is evident.
📊 Drivers of the rise: Buzz around the market topic has brought in dip-buying demand. The candlestick chart shows several consecutive small bullish candles as buyers accumulate. The sixth candle surged to 0.12 on increased volume, followed by a low-volume pullback. Support at 0.112–0.113 is holding, and the short-term outlook remains bullish but range-bound.
🚀 Entry strategy:
- Consider a small long position on a pullback to 0.112–0.113, with a stop-loss at 0.109 and a target of 0.118–0.120;
- If the price breaks above 0.116 on increased volume, consider going long, with 0.113 as the defensive level.
⚠️ If the price falls below 0.110, stay on the sidelines. Manage position size and DYOR. #PONS #加密货币 #ShortTermTrading
🔥 $PONS Short-term capital interest is heating up, with the price rebounding from 0.11 to 0.114. The average 15-minute volatility is 0.85%, with a maximum of 1.24%, which is within the normal range; no panic selling is evident.
📊 Drivers of the rise: Buzz around the market topic has brought in dip-buying demand. The candlestick chart shows several consecutive small bullish candles as buyers accumulate. The sixth candle surged to 0.12 on increased volume, followed by a low-volume pullback. Support at 0.112–0.113 is holding, and the short-term outlook remains bullish but range-bound.
🚀 Entry strategy:
- Consider a small long position on a pullback to 0.112–0.113, with a stop-loss at 0.109 and a target of 0.118–0.120;
- If the price breaks above 0.116 on increased volume, consider going long, with 0.113 as the defensive level.
⚠️ If the price falls below 0.110, stay on the sidelines. Manage position size and DYOR. #PONS #加密货币 #ShortTermTrading
📊 Drivers of the rise: Buzz around the market topic has brought in dip-buying demand. The candlestick chart shows several consecutive small bullish candles as buyers accumulate. The sixth candle surged to 0.12 on increased volume, followed by a low-volume pullback. Support at 0.112–0.113 is holding, and the short-term outlook remains bullish but range-bound.
🚀 Entry strategy:
- Consider a small long position on a pullback to 0.112–0.113, with a stop-loss at 0.109 and a target of 0.118–0.120;
- If the price breaks above 0.116 on increased volume, consider going long, with 0.113 as the defensive level.
⚠️ If the price falls below 0.110, stay on the sidelines. Manage position size and DYOR. #PONS #加密货币 #ShortTermTrading
360
Log in to explore more content
Join global crypto users on Binance Square
⚡️ Get latest and useful information about crypto.
💬 Trusted by the world’s largest crypto exchange.
👍 Discover real insights from verified creators.
Email / Phone number
Trending Topics
1
#NvidiaLoses$2.7TrillionInMonthAndAHalf
2,415 views
54 Discussing
2
#CanBTCReboundAfterFallingBelow60K?
576,950 views
2,433 Discussing
3
#GlobalStocksFaceLongestLosingStreakSince2023
199,690 views
1,686 Discussing
4
#BlackRockIBITPostsRecord$541MSingleDayOutflow
18,210 views
60 Discussing
5
#AnthropicPlungesTowardIPOPriceonDay2
99,351 views
983 Discussing
6
#TwentyOneCapitalAdds172.25BTC
41,630 views
491 Discussing
7
#HKBillWouldExcludeTokenizedDepositsFromVirtualAssets
4,188 views
47 Discussing
8
#BNBDropsBelow540USDTWith8.46%DailyDecline
57,132 views
510 Discussing
9
#HKBillProposesHK$100KFineForUnauthorizedCryptoTitles
1,946 views
20 Discussing
10
#BitMineFaces$10.1BUnrealizedETHLoss
4,177 views
25 Discussing