
#intw
intw
62,985 views
833 Discussing
Hot
Latest

·
--
Is the weakness in $INTW finally reaching a breaking point?
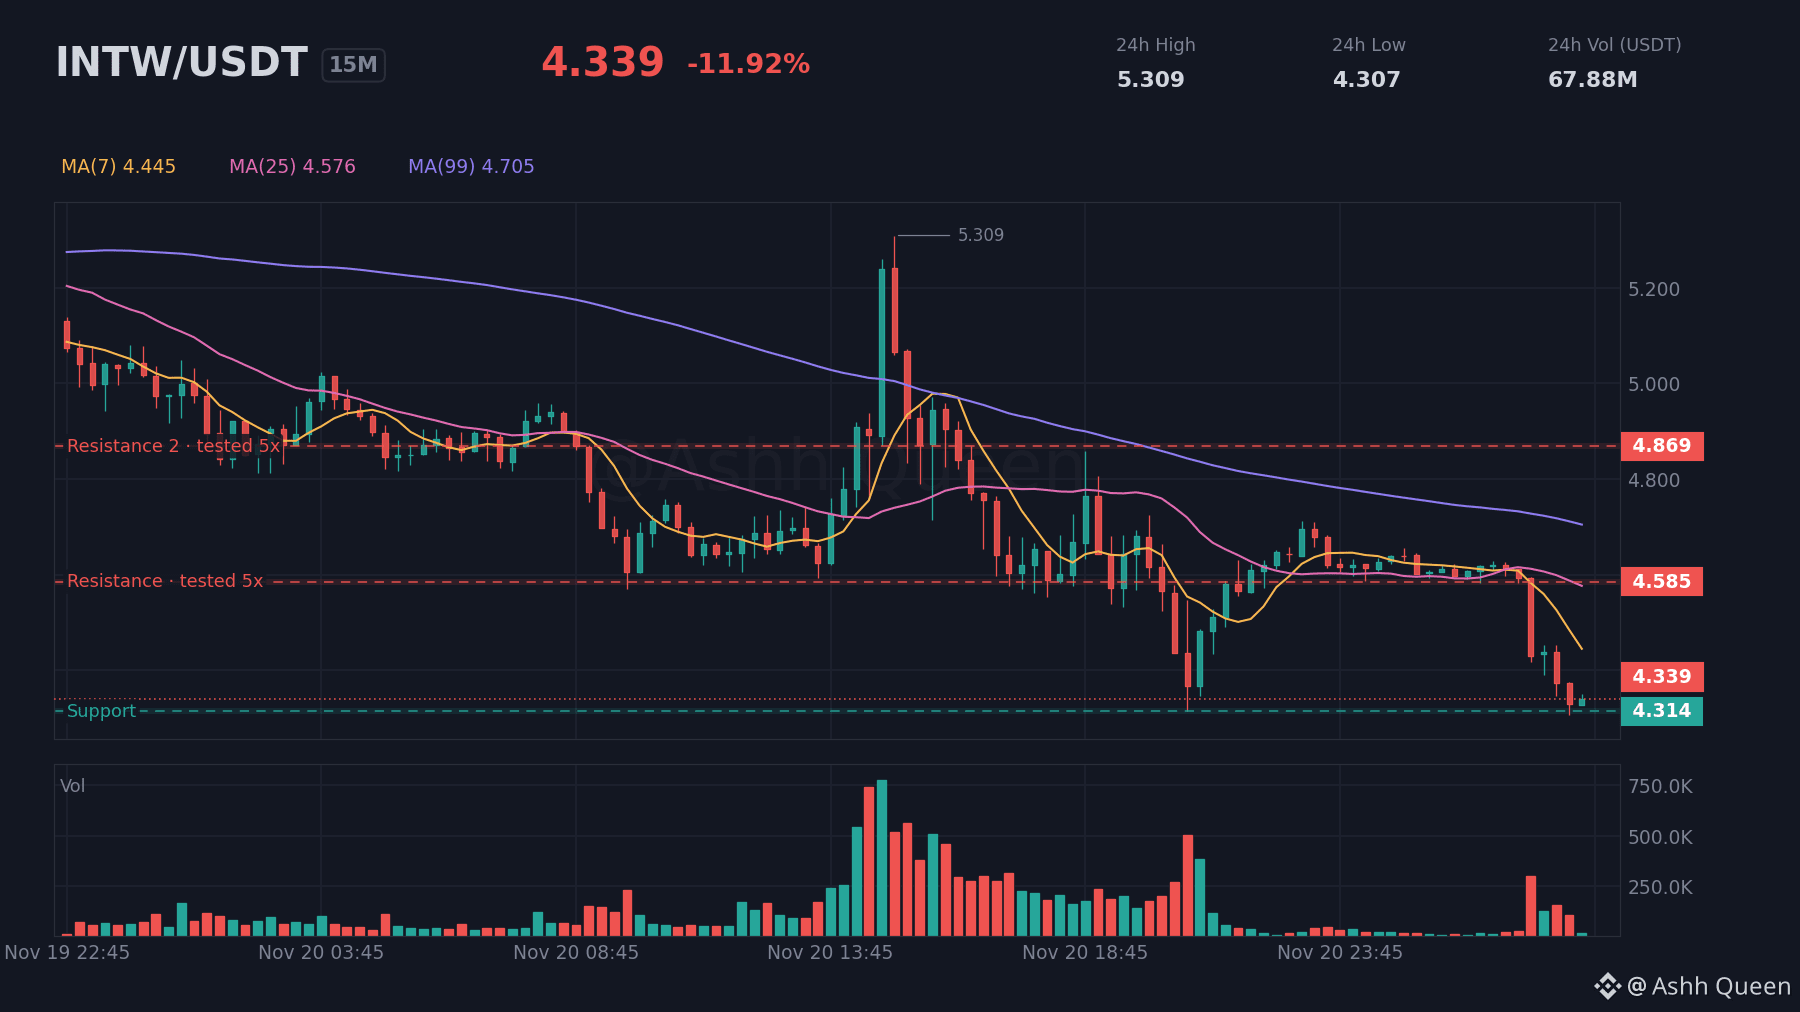
The perpetual contract just dropped by MOVE at -2.21% in the last hour, accelerating the current trend. Price is currently at 4.338, putting it dangerously close to support at 4.314. 🐻
If support fails to hold, we could see further downside. If buyers step in, resistance at 4.585 becomes the first real hurdle to clear. ⚔️
Which level on the chart are you watching right now and why?
#INTW #Stocks #BinanceSquare
⚠️ Perpetual contracts are leveraged derivatives, not the stock or commodity itself.
Not financial advice. Markets are volatile, so use stop-losses and only risk what you can afford to lose.
Is the weakness in $INTW finally reaching a breaking point?
The perpetual contract just dropped by MOVE at -2.21% in the last hour, accelerating the current trend. Price is currently at 4.338, putting it dangerously close to support at 4.314. 🐻
If support fails to hold, we could see further downside. If buyers step in, resistance at 4.585 becomes the first real hurdle to clear. ⚔️
Which level on the chart are you watching right now and why?
#INTW #Stocks #BinanceSquare
⚠️ Perpetual contracts are leveraged derivatives, not the stock or commodity itself.
Not financial advice. Markets are volatile, so use stop-losses and only risk what you can afford to lose.
The perpetual contract just dropped by MOVE at -2.21% in the last hour, accelerating the current trend. Price is currently at 4.338, putting it dangerously close to support at 4.314. 🐻
If support fails to hold, we could see further downside. If buyers step in, resistance at 4.585 becomes the first real hurdle to clear. ⚔️
Which level on the chart are you watching right now and why?
#INTW #Stocks #BinanceSquare
⚠️ Perpetual contracts are leveraged derivatives, not the stock or commodity itself.
Not financial advice. Markets are volatile, so use stop-losses and only risk what you can afford to lose.
1
69
·
--
$INTW is trending upward with a MOVE at +1.66% in the last hour. ⚠️
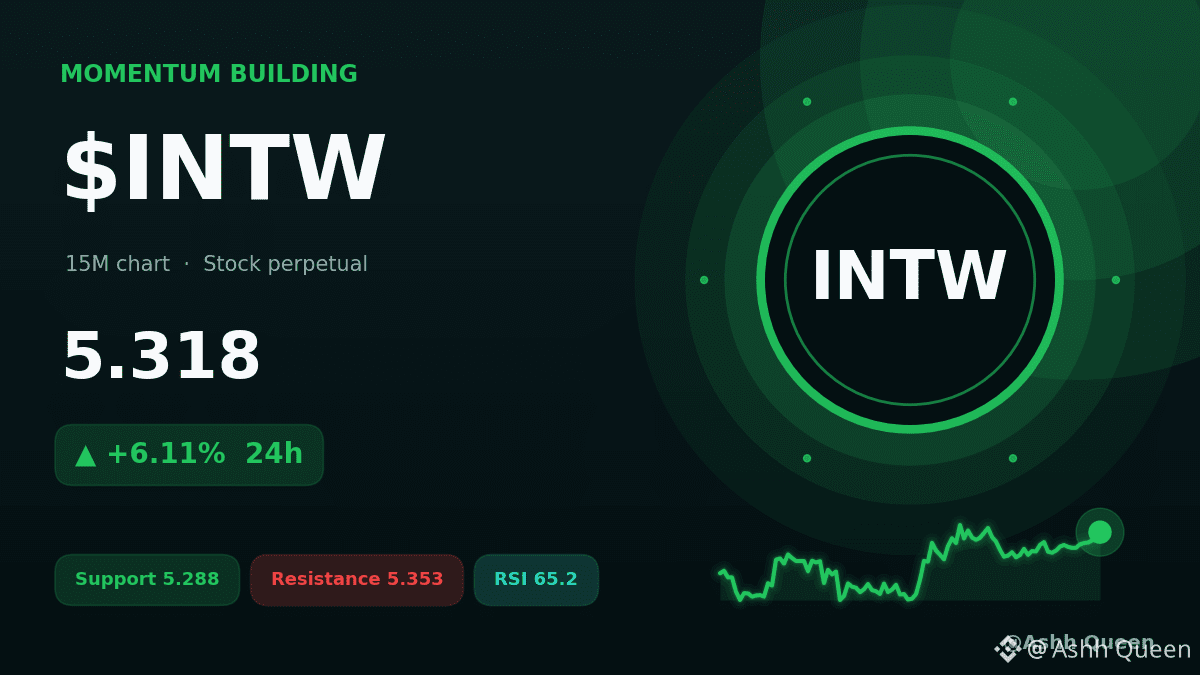
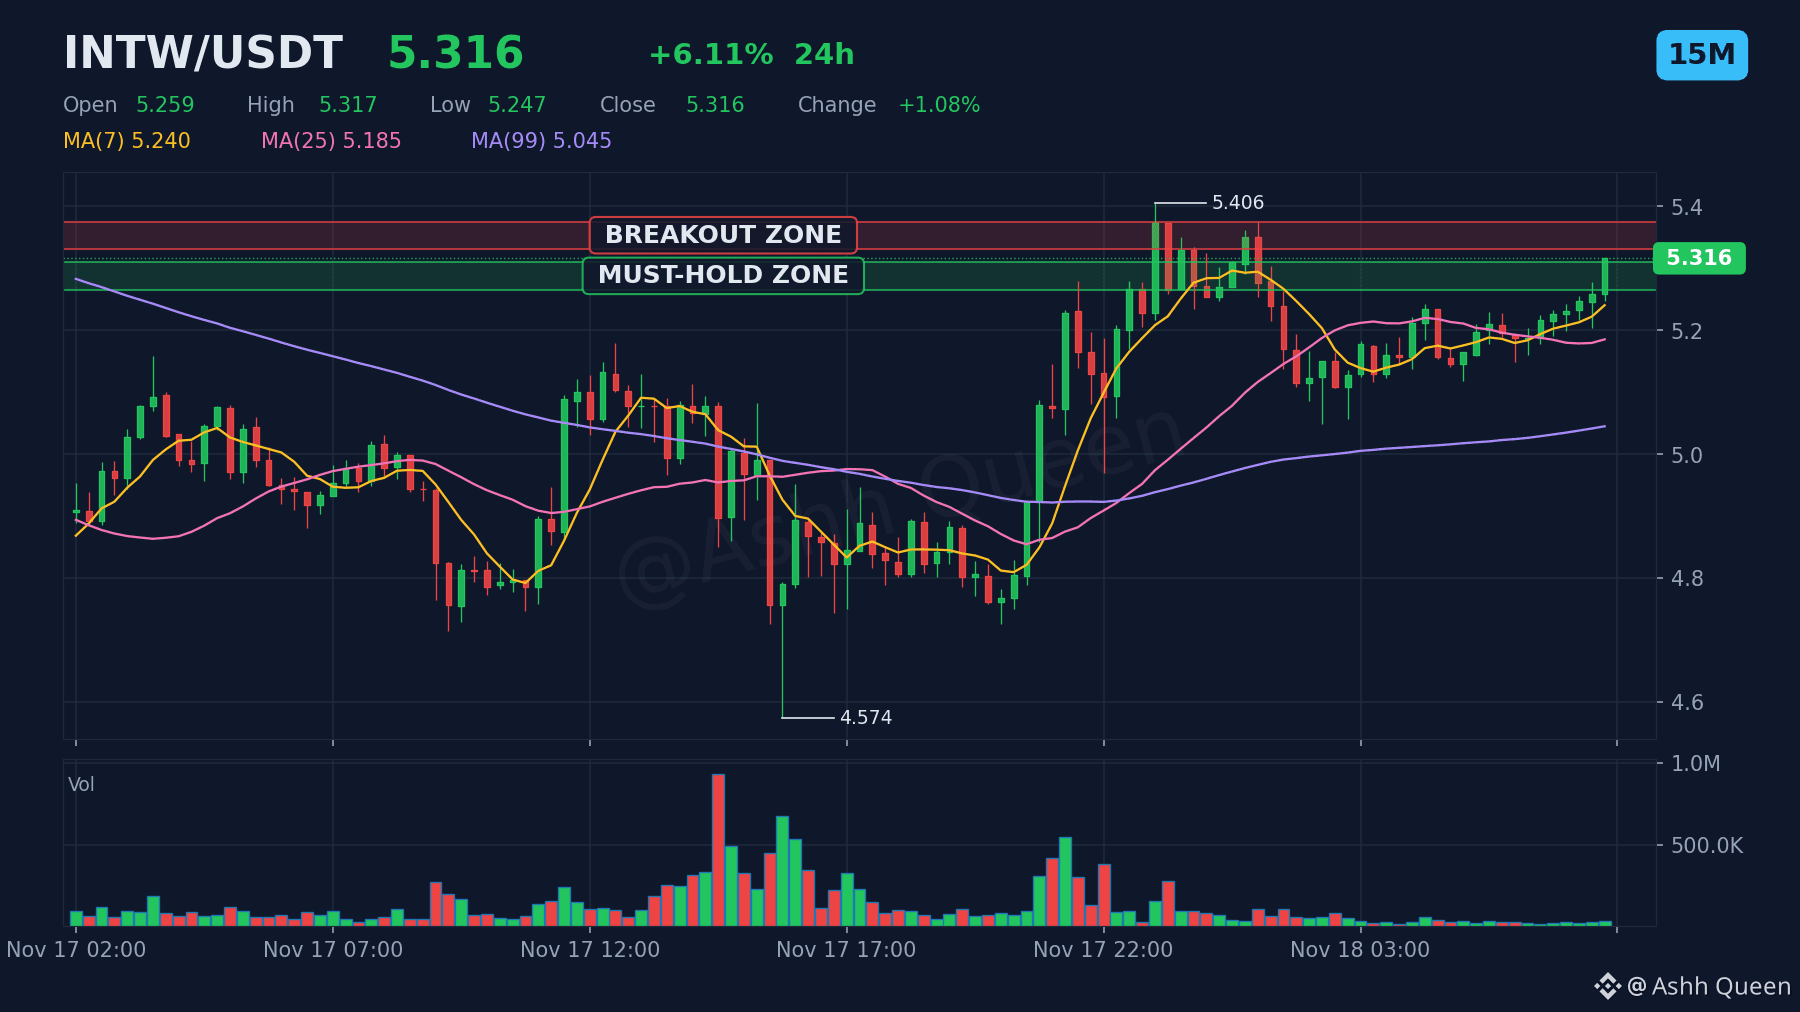
This perpetual contract holds steady above EMA50 at 5.157 and VWAP at 5.205. If the price sustains above support1 at 5.288, the path toward resistance1 at 5.353 opens. 🛡️
What is your read on this momentum, and which indicator are you watching? 🧐
#INTW #Stocks #StockMarket #BinanceSquare #Volatility
⚠️ Perpetual contracts are leveraged derivatives, not the stock or commodity itself.
DYOR. Size positions carefully and never trade with money you cannot afford to lose.
$INTW is trending upward with a MOVE at +1.66% in the last hour. ⚠️
This perpetual contract holds steady above EMA50 at 5.157 and VWAP at 5.205. If the price sustains above support1 at 5.288, the path toward resistance1 at 5.353 opens. 🛡️
What is your read on this momentum, and which indicator are you watching? 🧐
#INTW #Stocks #StockMarket #BinanceSquare #Volatility
⚠️ Perpetual contracts are leveraged derivatives, not the stock or commodity itself.
DYOR. Size positions carefully and never trade with money you cannot afford to lose.
This perpetual contract holds steady above EMA50 at 5.157 and VWAP at 5.205. If the price sustains above support1 at 5.288, the path toward resistance1 at 5.353 opens. 🛡️
What is your read on this momentum, and which indicator are you watching? 🧐
#INTW #Stocks #StockMarket #BinanceSquare #Volatility
⚠️ Perpetual contracts are leveraged derivatives, not the stock or commodity itself.
DYOR. Size positions carefully and never trade with money you cannot afford to lose.
5

·
--
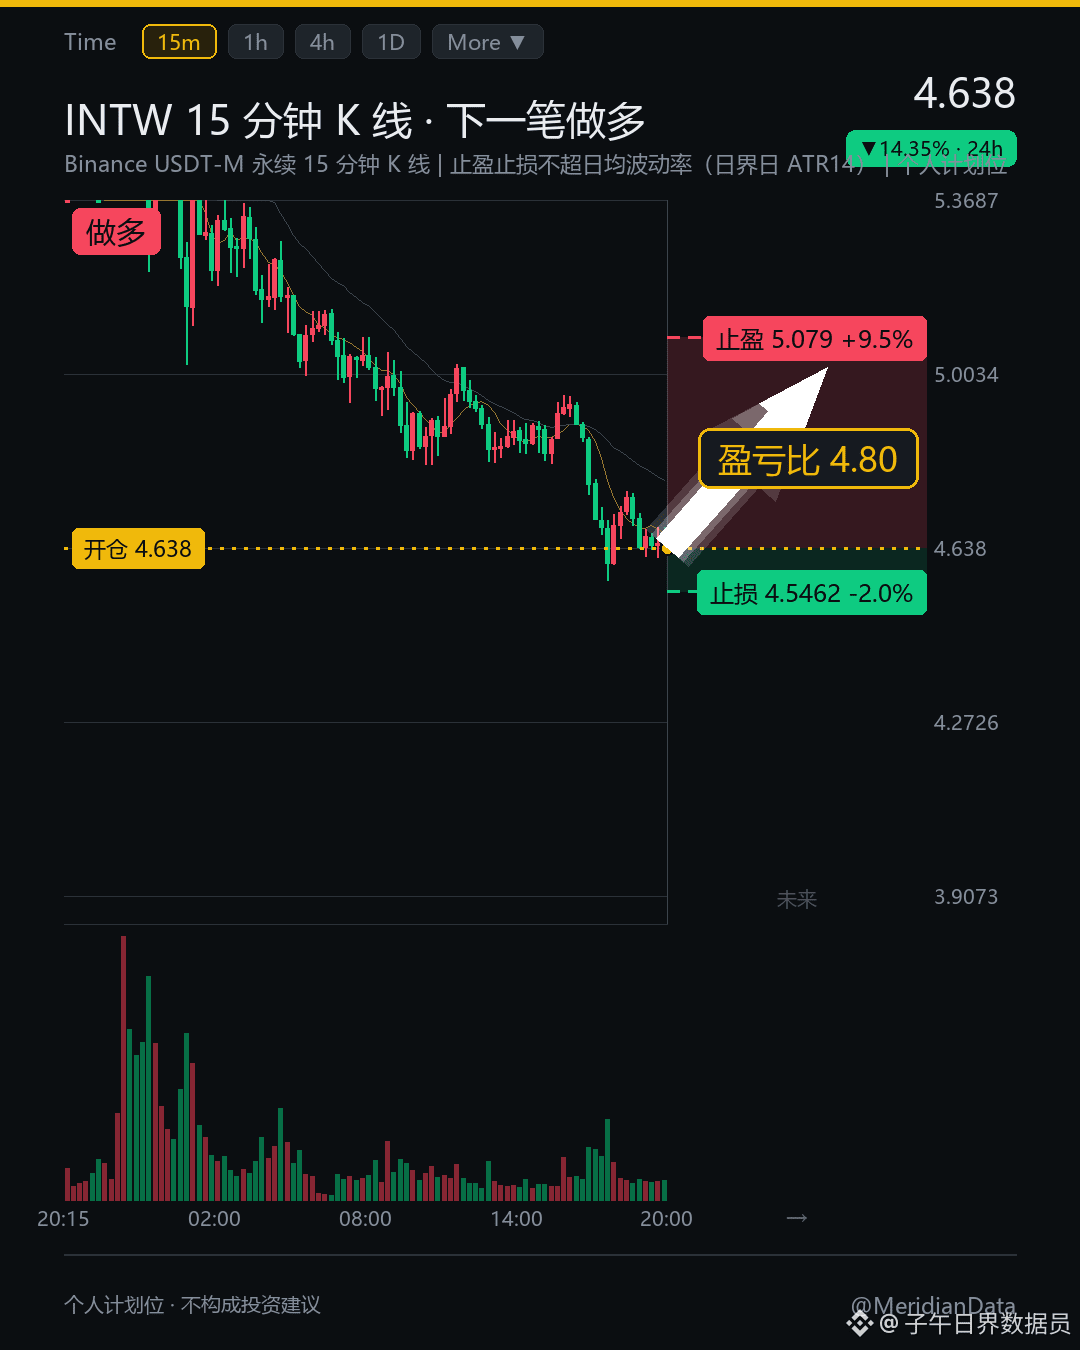
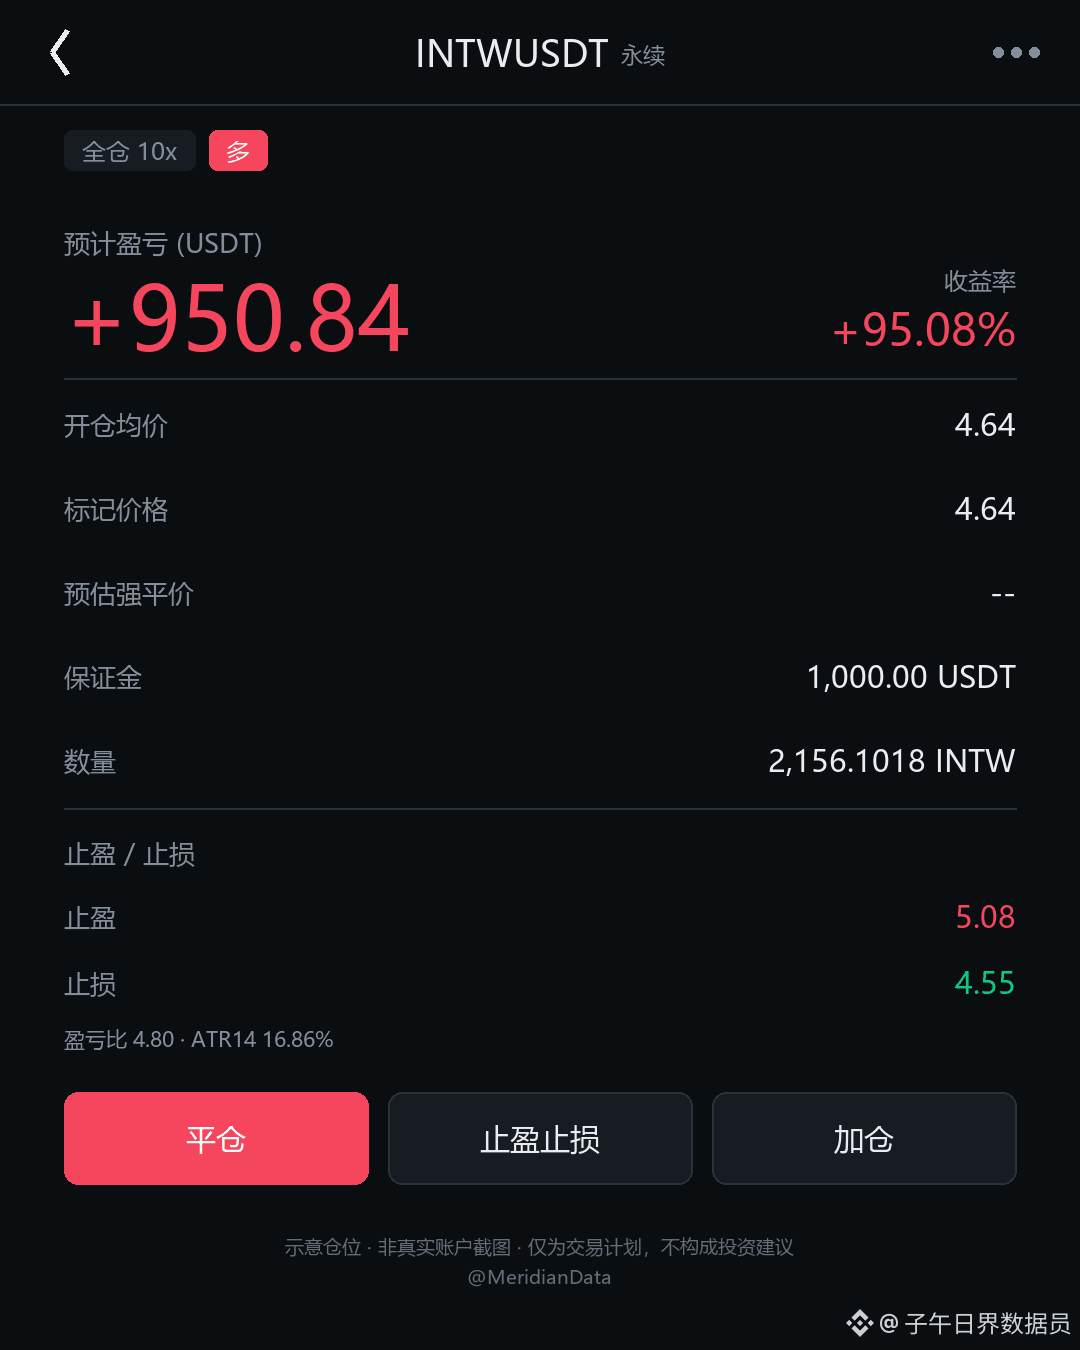
Going long at the 9.0% quantile; I’m prepared to give this trade, $INTW , a try.
Take profit: 5.079
Stop loss: 4.5462
{future}(INTWUSDT)
Some of you may be asking an obvious question: why catch something that’s been falling for nearly two weeks at this level?
The price is low enough. The 20-day range is 4.32 to 7.85, and it’s fallen 17.95% in seven days.
Prices like this are hammered down; they won’t go up just because people cheer them on.
Let me explain the setup first. Average daily volatility is 16.86%, and both the take-profit and stop-loss levels are within that range.
The risk-reward ratio on this trade is 4.80.
Honestly, I thought the stop would need to be farther away to be safe, but after checking twice, I found that the boundary indicated by the 15-minute structure is right at 4.5462.
Only a setup with more than nine percentage points of upside and just over two points of downside is worthy of me seriously taking a shot at a price that’s fallen this far.
There aren’t many holders left at that upper level, and the real profit-taking hasn’t even started.
The market is only so deep: it’s easy to knock down, but hard to lift back up.
It’s like a reservoir running dry: the rocks are the first thing exposed. You won’t know whether there’s support underneath until the water really builds back up.
If I’m wrong, I’ll admit it then. I won’t let a losing trade ride.
What do you think: with something that’s been falling for two weeks, are you buying the rebound or catching a falling knife?
$BNB $WASTED
#INTW #BNB #cryptocurrency
The above is a record of my personal trading system and data observations, and does not constitute investment advice
Going long at the 9.0% quantile; I’m prepared to give this trade, $INTW , a try.
Take profit: 5.079
Stop loss: 4.5462
Some of you may be asking an obvious question: why catch something that’s been falling for nearly two weeks at this level?
The price is low enough. The 20-day range is 4.32 to 7.85, and it’s fallen 17.95% in seven days.
Prices like this are hammered down; they won’t go up just because people cheer them on.
Let me explain the setup first. Average daily volatility is 16.86%, and both the take-profit and stop-loss levels are within that range.
The risk-reward ratio on this trade is 4.80.
Honestly, I thought the stop would need to be farther away to be safe, but after checking twice, I found that the boundary indicated by the 15-minute structure is right at 4.5462.
Only a setup with more than nine percentage points of upside and just over two points of downside is worthy of me seriously taking a shot at a price that’s fallen this far.
There aren’t many holders left at that upper level, and the real profit-taking hasn’t even started.
The market is only so deep: it’s easy to knock down, but hard to lift back up.
It’s like a reservoir running dry: the rocks are the first thing exposed. You won’t know whether there’s support underneath until the water really builds back up.
If I’m wrong, I’ll admit it then. I won’t let a losing trade ride.
What do you think: with something that’s been falling for two weeks, are you buying the rebound or catching a falling knife?
$BNB $WASTED
#INTW #BNB #cryptocurrency
The above is a record of my personal trading system and data observations, and does not constitute investment advice
Take profit: 5.079
Stop loss: 4.5462
Some of you may be asking an obvious question: why catch something that’s been falling for nearly two weeks at this level?
The price is low enough. The 20-day range is 4.32 to 7.85, and it’s fallen 17.95% in seven days.
Prices like this are hammered down; they won’t go up just because people cheer them on.
Let me explain the setup first. Average daily volatility is 16.86%, and both the take-profit and stop-loss levels are within that range.
The risk-reward ratio on this trade is 4.80.
Honestly, I thought the stop would need to be farther away to be safe, but after checking twice, I found that the boundary indicated by the 15-minute structure is right at 4.5462.
Only a setup with more than nine percentage points of upside and just over two points of downside is worthy of me seriously taking a shot at a price that’s fallen this far.
There aren’t many holders left at that upper level, and the real profit-taking hasn’t even started.
The market is only so deep: it’s easy to knock down, but hard to lift back up.
It’s like a reservoir running dry: the rocks are the first thing exposed. You won’t know whether there’s support underneath until the water really builds back up.
If I’m wrong, I’ll admit it then. I won’t let a losing trade ride.
What do you think: with something that’s been falling for two weeks, are you buying the rebound or catching a falling knife?
$BNB $WASTED
#INTW #BNB #cryptocurrency
The above is a record of my personal trading system and data observations, and does not constitute investment advice
28

·
--
$INTC $ASML $INTW 30-minute bearish signal; 4-hour bearish trend confirmed 🔥
════════════════════
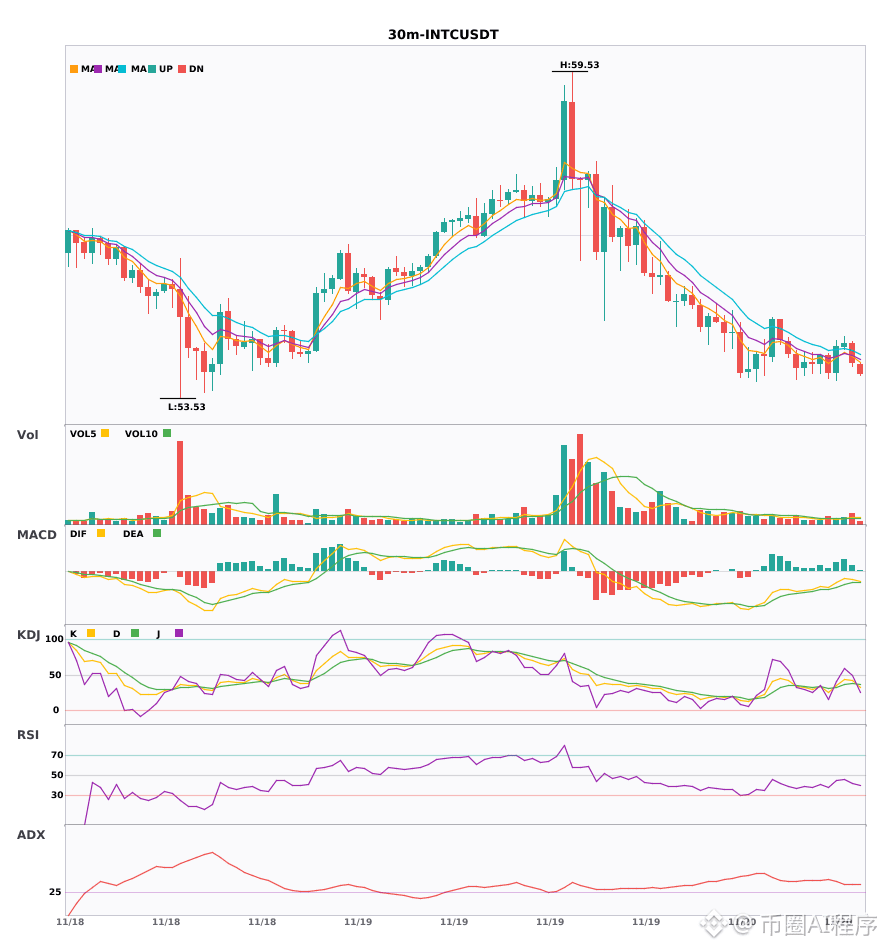
🟢 $INTC 30-minute bearish signal
⚠️Technical: 4-hour bearish + 30-minute bearish confluence confirmed. EMA5 crossed below EMA8, and the moving averages have turned bearish. KDJ is weak (K41.7 D38.0), with volume up 1.7x.
════════════════════
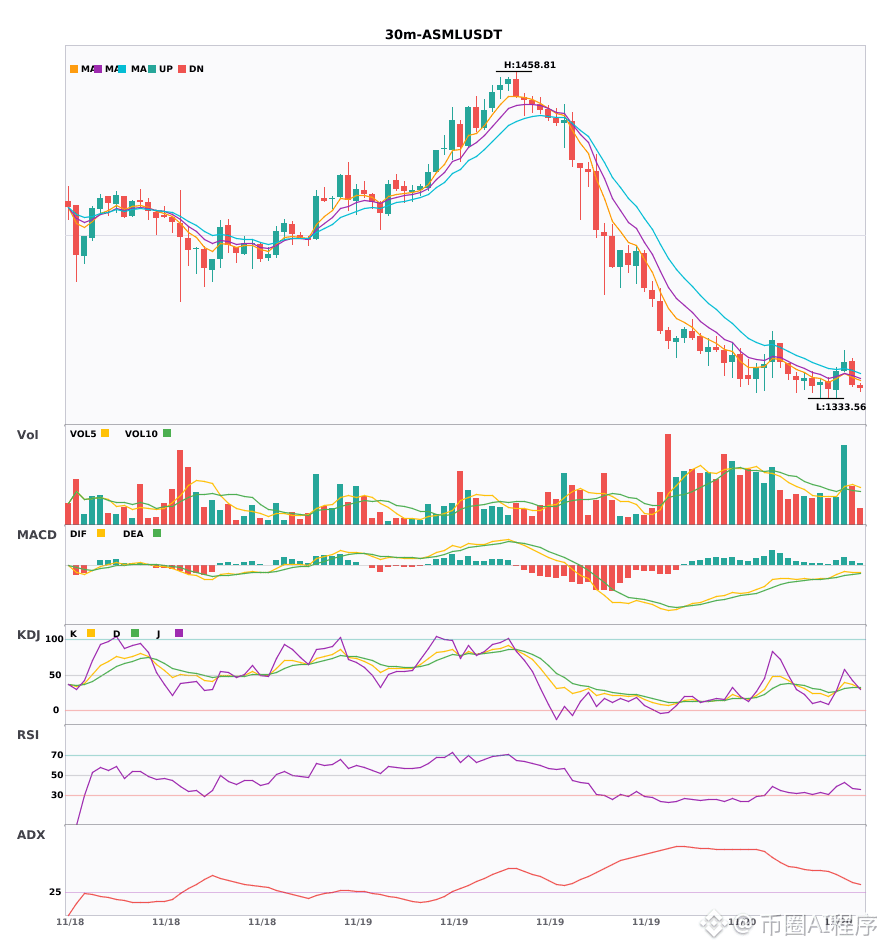
🟢 $ASML 30-minute bearish signal
⚠️Technical: 4-hour bearish + 30-minute entry confluence! The 30-minute EMA5 has just crossed below EMA8, turning bearish. KDJ is weak (K36 D32), with volume up 2.2x.
════════════════════
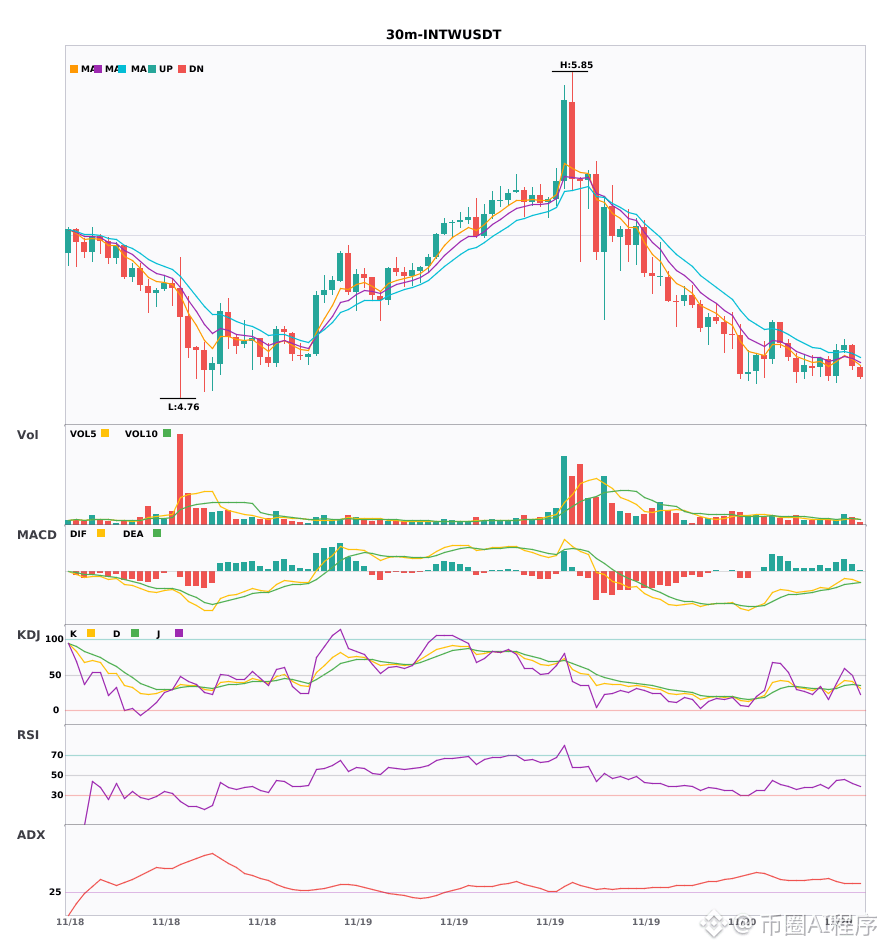
🟢 $INTW 30-minute bearish signal
⚠️Technical: The 30-minute EMA5 has just crossed below EMA8, turning bearish. KDJ is weak and moving downward, but not oversold. Volume is up 1.7x, confirming multi-timeframe confluence with the 4-hour bearish trend. The bearish signal is clear.
════════════════════
🔔 Follow for firsthand market movement alerts 🔔
#多周期共振 #INTC #ASML #INTW
📌 When trading, pay attention to whether the candlestick pattern aligns.
$INTC $ASML $INTW 30-minute bearish signal; 4-hour bearish trend confirmed 🔥
════════════════════
🟢 $INTC 30-minute bearish signal
⚠️Technical: 4-hour bearish + 30-minute bearish confluence confirmed. EMA5 crossed below EMA8, and the moving averages have turned bearish. KDJ is weak (K41.7 D38.0), with volume up 1.7x.
════════════════════
🟢 $ASML 30-minute bearish signal
⚠️Technical: 4-hour bearish + 30-minute entry confluence! The 30-minute EMA5 has just crossed below EMA8, turning bearish. KDJ is weak (K36 D32), with volume up 2.2x.
════════════════════
🟢 $INTW 30-minute bearish signal
⚠️Technical: The 30-minute EMA5 has just crossed below EMA8, turning bearish. KDJ is weak and moving downward, but not oversold. Volume is up 1.7x, confirming multi-timeframe confluence with the 4-hour bearish trend. The bearish signal is clear.
════════════════════
🔔 Follow for firsthand market movement alerts 🔔
#多周期共振 #INTC #ASML #INTW
📌 When trading, pay attention to whether the candlestick pattern aligns.
════════════════════
🟢 $INTC 30-minute bearish signal
⚠️Technical: 4-hour bearish + 30-minute bearish confluence confirmed. EMA5 crossed below EMA8, and the moving averages have turned bearish. KDJ is weak (K41.7 D38.0), with volume up 1.7x.
════════════════════
🟢 $ASML 30-minute bearish signal
⚠️Technical: 4-hour bearish + 30-minute entry confluence! The 30-minute EMA5 has just crossed below EMA8, turning bearish. KDJ is weak (K36 D32), with volume up 2.2x.
════════════════════
🟢 $INTW 30-minute bearish signal
⚠️Technical: The 30-minute EMA5 has just crossed below EMA8, turning bearish. KDJ is weak and moving downward, but not oversold. Volume is up 1.7x, confirming multi-timeframe confluence with the 4-hour bearish trend. The bearish signal is clear.
════════════════════
🔔 Follow for firsthand market movement alerts 🔔
#多周期共振 #INTC #ASML #INTW
📌 When trading, pay attention to whether the candlestick pattern aligns.
17

·
--
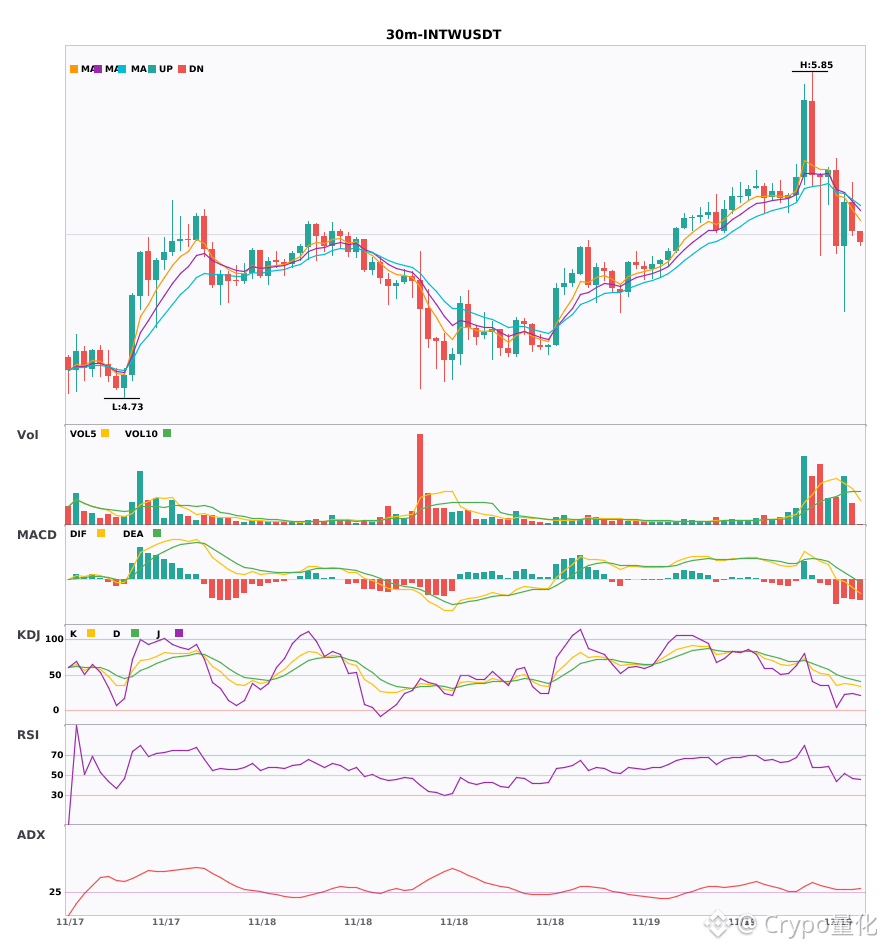
$H/$STXX/$INTW 30-minute synchronized weakening; beware of a pullback 🔥
════════════════════
🟢 $H 30-minute bearish signal
⚠️ Technicals: ADX is as high as 50, indicating a strong trend, but beware of an overheated pullback; MACD is bearish, with the trend relatively weak but momentum increasing; EMA5, 8, and 13 are bearishly aligned and trending downward; KDJ is weak, with K below D, giving bears the advantage; trading volume surged to 3.8 times its usual level.
════════════════════
🟢 $STXX 30-minute bearish signal
⚠️ Technicals: ADX shows a clear trend; MACD’s green bars are expanding and momentum is strengthening; moving averages are bearishly aligned and spreading downward; KDJ is weak, with K crossing below D but not yet oversold; trading volume doubled.
════════════════════
🟢 $INTW 30-minute bearish signal
⚠️ Technicals: ADX has just crossed 30, signaling the start of a trend that may offer an opportunity to participate; MACD’s green bars continue to expand, and bearish momentum is increasing; EMA5, 8, and 13 have just formed a bearish alignment and are moving downward; on KDJ, K is below D but not yet oversold, so bears have the upper hand; trading volume increased by 1.5 times.
════════════════════
🔔 Follow for real-time market updates 🔔
#技术分析 #H #STXX #INTW
📌 When trading, pay attention to whether the candlestick pattern matches
$H /$STXX /$INTW 30-minute synchronized weakening; beware of a pullback 🔥
════════════════════
🟢 $H 30-minute bearish signal
⚠️ Technicals: ADX is as high as 50, indicating a strong trend, but beware of an overheated pullback; MACD is bearish, with the trend relatively weak but momentum increasing; EMA5, 8, and 13 are bearishly aligned and trending downward; KDJ is weak, with K below D, giving bears the advantage; trading volume surged to 3.8 times its usual level.
════════════════════
🟢 $STXX 30-minute bearish signal
⚠️ Technicals: ADX shows a clear trend; MACD’s green bars are expanding and momentum is strengthening; moving averages are bearishly aligned and spreading downward; KDJ is weak, with K crossing below D but not yet oversold; trading volume doubled.
════════════════════
🟢 $INTW 30-minute bearish signal
⚠️ Technicals: ADX has just crossed 30, signaling the start of a trend that may offer an opportunity to participate; MACD’s green bars continue to expand, and bearish momentum is increasing; EMA5, 8, and 13 have just formed a bearish alignment and are moving downward; on KDJ, K is below D but not yet oversold, so bears have the upper hand; trading volume increased by 1.5 times.
════════════════════
🔔 Follow for real-time market updates 🔔
#技术分析 #H #STXX #INTW
📌 When trading, pay attention to whether the candlestick pattern matches
════════════════════
🟢 $H 30-minute bearish signal
⚠️ Technicals: ADX is as high as 50, indicating a strong trend, but beware of an overheated pullback; MACD is bearish, with the trend relatively weak but momentum increasing; EMA5, 8, and 13 are bearishly aligned and trending downward; KDJ is weak, with K below D, giving bears the advantage; trading volume surged to 3.8 times its usual level.
════════════════════
🟢 $STXX 30-minute bearish signal
⚠️ Technicals: ADX shows a clear trend; MACD’s green bars are expanding and momentum is strengthening; moving averages are bearishly aligned and spreading downward; KDJ is weak, with K crossing below D but not yet oversold; trading volume doubled.
════════════════════
🟢 $INTW 30-minute bearish signal
⚠️ Technicals: ADX has just crossed 30, signaling the start of a trend that may offer an opportunity to participate; MACD’s green bars continue to expand, and bearish momentum is increasing; EMA5, 8, and 13 have just formed a bearish alignment and are moving downward; on KDJ, K is below D but not yet oversold, so bears have the upper hand; trading volume increased by 1.5 times.
════════════════════
🔔 Follow for real-time market updates 🔔
#技术分析 #H #STXX #INTW
📌 When trading, pay attention to whether the candlestick pattern matches
11

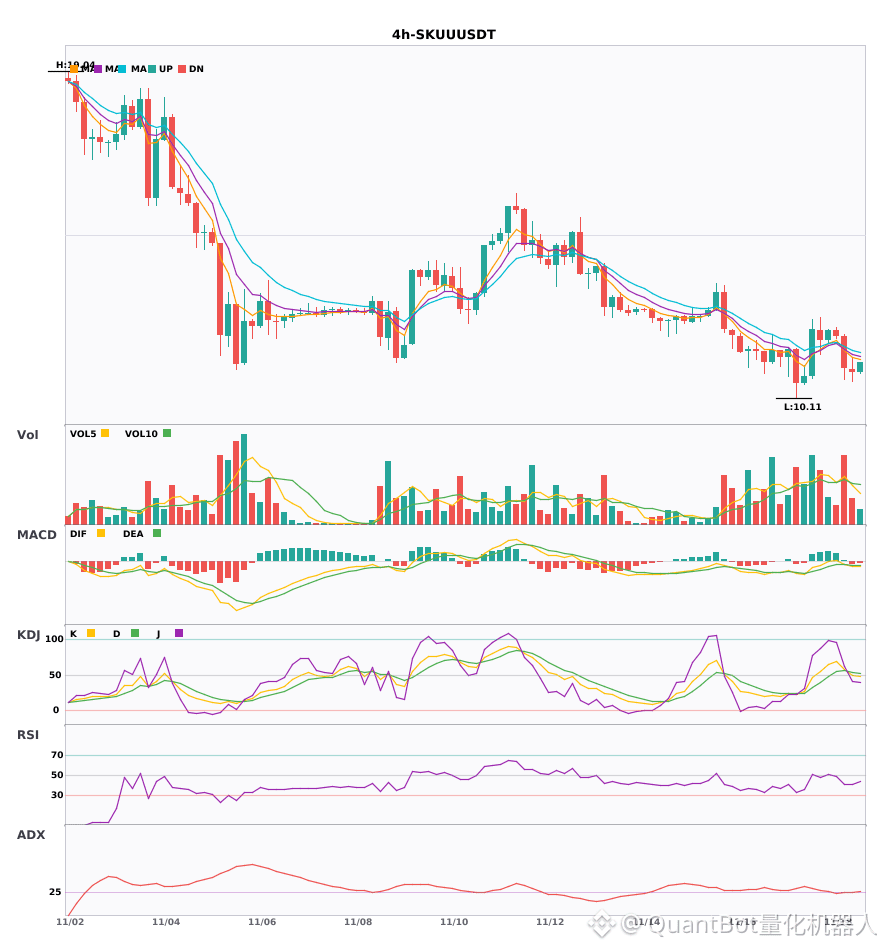
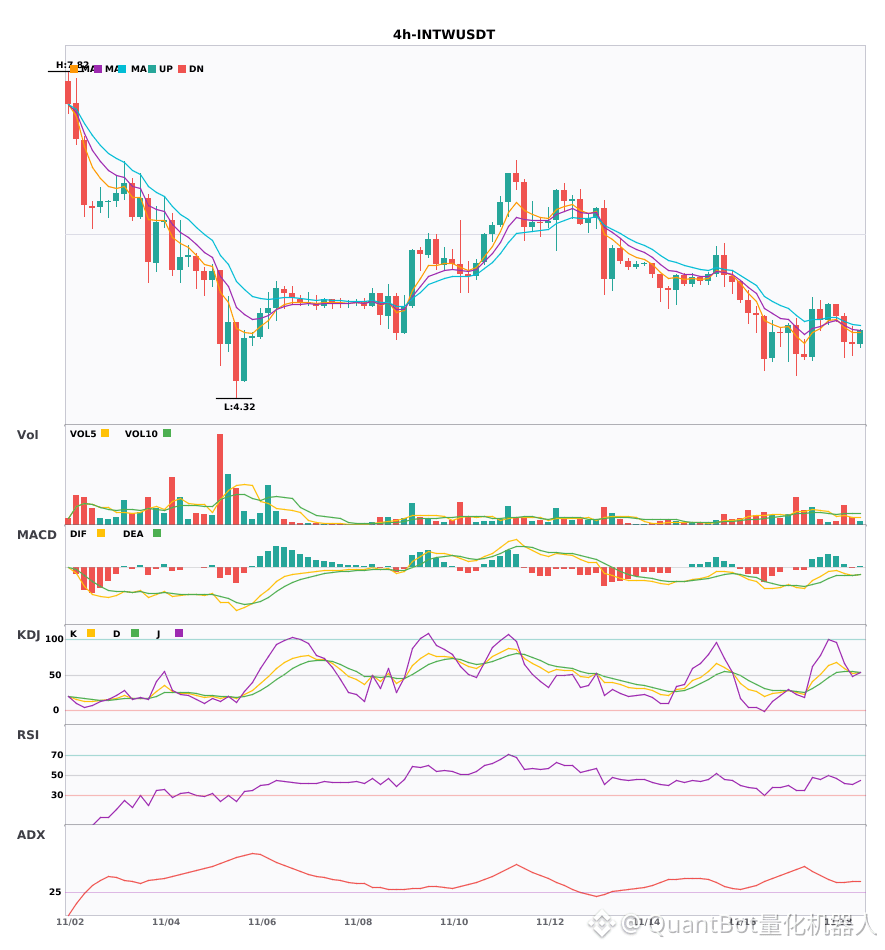
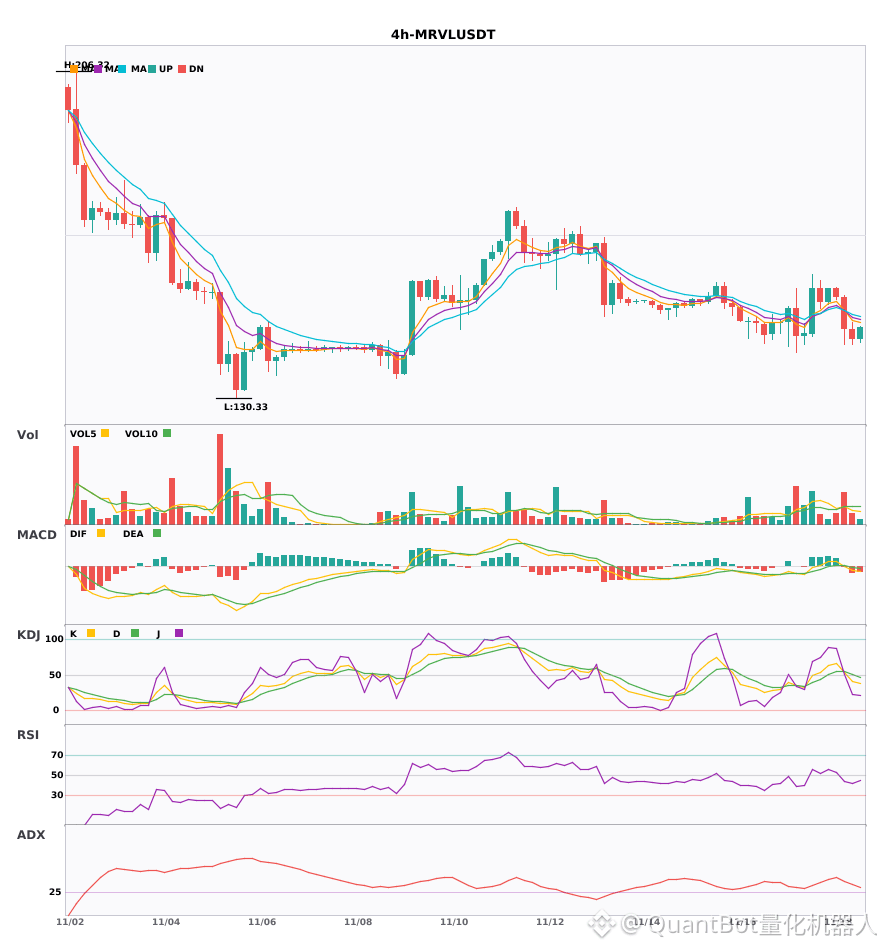
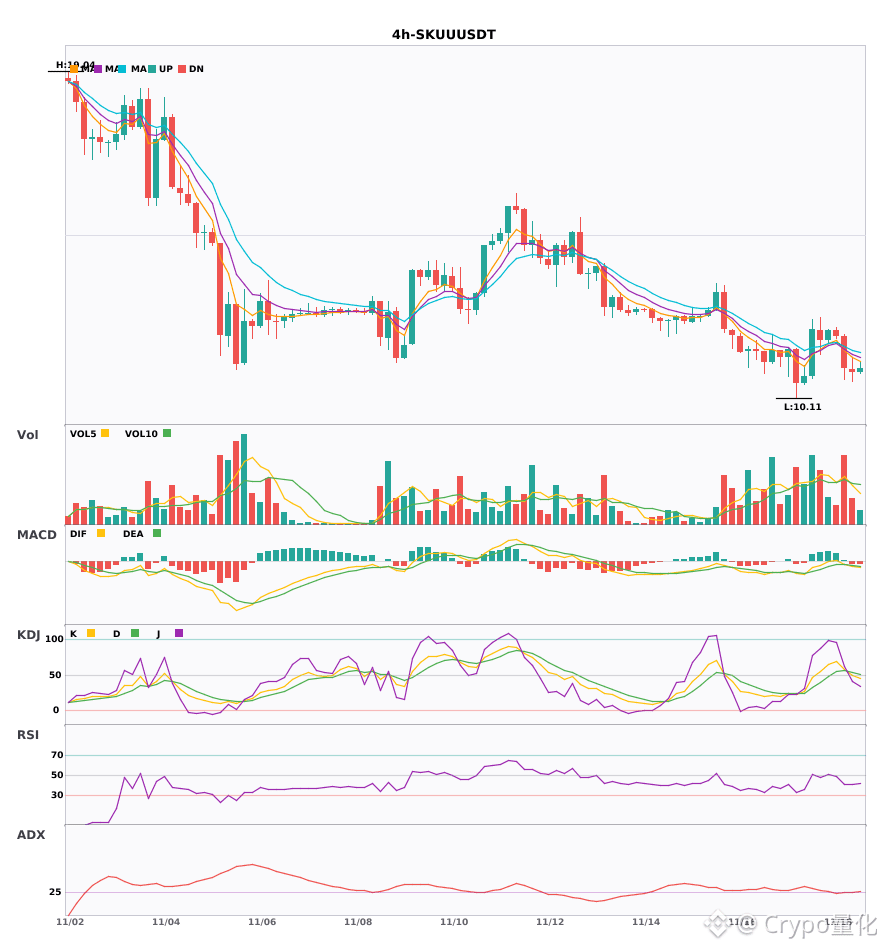
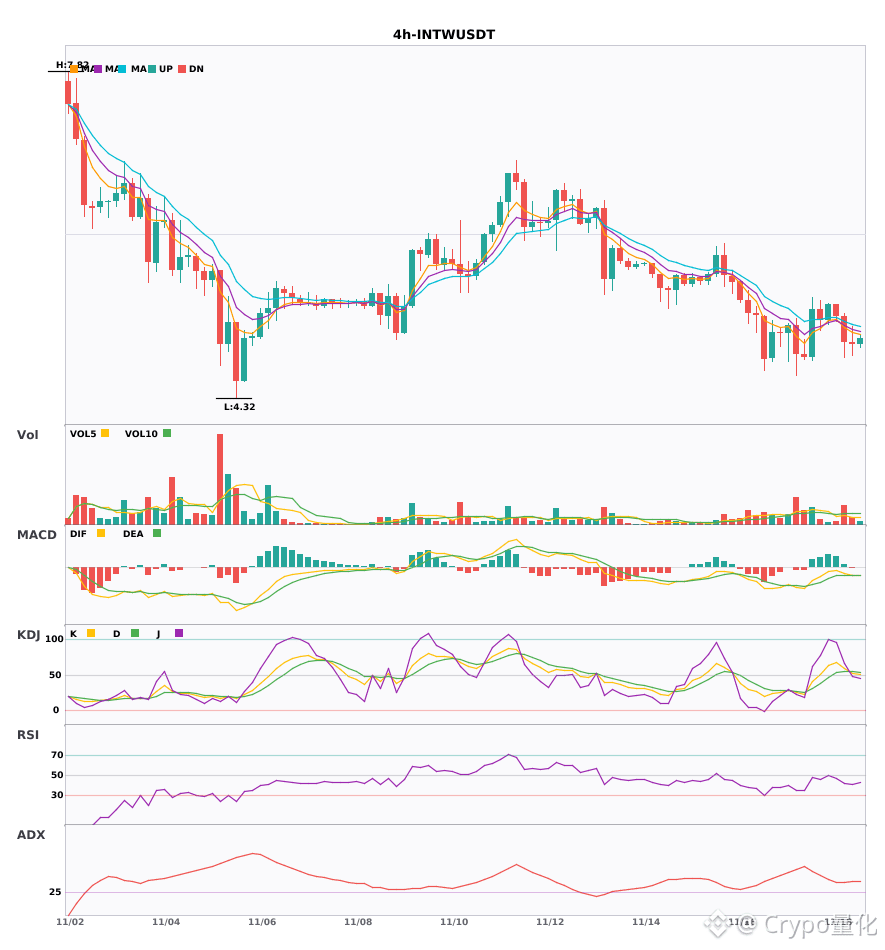
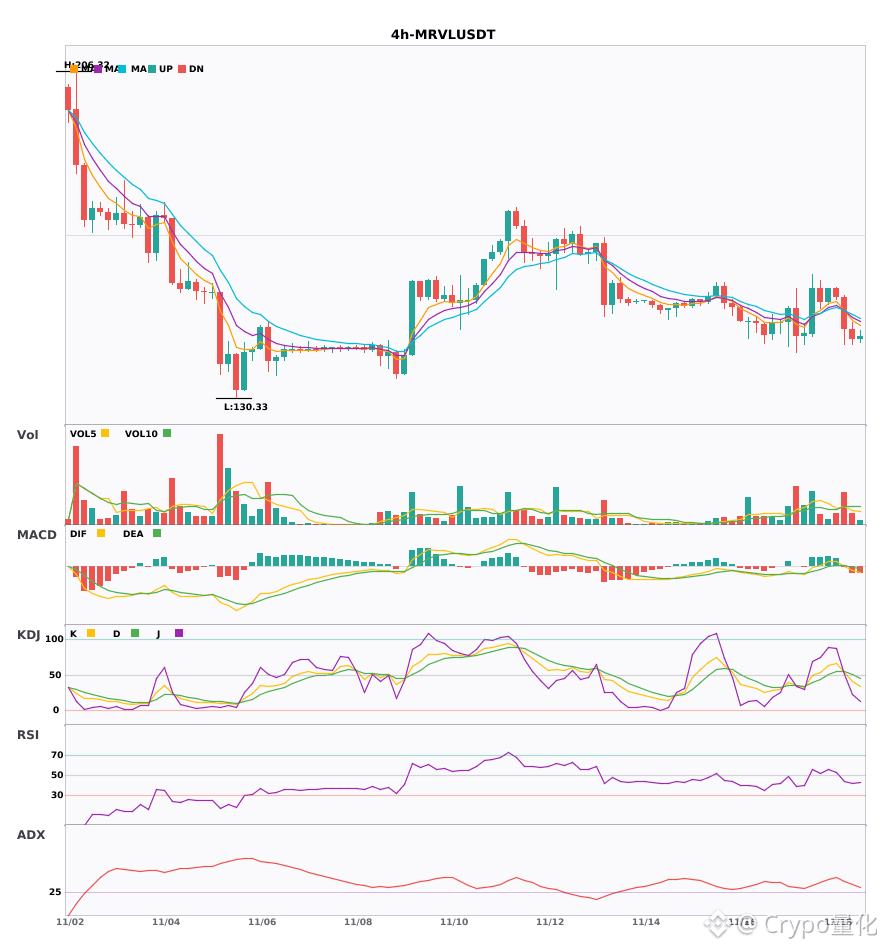
$SKUU/$INTW/$MRVL 4H Bearish convergence reversal signal confirmed
📉 $SKUU | 4-hour bearish signal
━━━━━━━━━━━━━━━━━━
Technical analysis: ADX (27) indicates a developing trend; tradeable. MACD bearish cross below zero, strengthening bearish momentum. EMA5<8<13 in bearish alignment. KDJ bearish cross (K49.6, D53.9), bearish in the short term. Volume increased 1.5x.
Price change: -0.9100%
📉 $INTW | 4-hour bearish signal
━━━━━━━━━━━━━━━━━━
Technical analysis: ADX (36) indicates a significant trend. MACD bearish cross below zero, accelerating bearish momentum. EMA5/8/13 in bearish alignment. KDJ bearish cross K52.3/D54.3. Volume increased 1.7x.
Price change: -0.4500%
📉 $MRVL | 4-hour bearish signal
━━━━━━━━━━━━━━━━━━
Technical analysis: ADX 37, indicating significant trend strength. MACD DIF fell below the zero line, signaling a bearish trend reversal. EMA5 crossed below EMA8, short-term bearish bias. Volume increased 1.8x.
Price change: -1.5900%
━━━━━━━━━━━━━━━━━━
#技术分析 #SKUU #INTW #MRVL
📌 The above content is for reference only and does not constitute investment advice
$SKUU /$INTW /$MRVL 4H Bearish convergence reversal signal confirmed
📉 $SKUU | 4-hour bearish signal
━━━━━━━━━━━━━━━━━━
Technical analysis: ADX (27) indicates a developing trend; tradeable. MACD bearish cross below zero, strengthening bearish momentum. EMA5<8<13 in bearish alignment. KDJ bearish cross (K49.6, D53.9), bearish in the short term. Volume increased 1.5x.
Price change: -0.9100%
📉 $INTW | 4-hour bearish signal
━━━━━━━━━━━━━━━━━━
Technical analysis: ADX (36) indicates a significant trend. MACD bearish cross below zero, accelerating bearish momentum. EMA5/8/13 in bearish alignment. KDJ bearish cross K52.3/D54.3. Volume increased 1.7x.
Price change: -0.4500%
📉 $MRVL | 4-hour bearish signal
━━━━━━━━━━━━━━━━━━
Technical analysis: ADX 37, indicating significant trend strength. MACD DIF fell below the zero line, signaling a bearish trend reversal. EMA5 crossed below EMA8, short-term bearish bias. Volume increased 1.8x.
Price change: -1.5900%
━━━━━━━━━━━━━━━━━━
#技术分析 #SKUU #INTW #MRVL
📌 The above content is for reference only and does not constitute investment advice
📉 $SKUU | 4-hour bearish signal
━━━━━━━━━━━━━━━━━━
Technical analysis: ADX (27) indicates a developing trend; tradeable. MACD bearish cross below zero, strengthening bearish momentum. EMA5<8<13 in bearish alignment. KDJ bearish cross (K49.6, D53.9), bearish in the short term. Volume increased 1.5x.
Price change: -0.9100%
📉 $INTW | 4-hour bearish signal
━━━━━━━━━━━━━━━━━━
Technical analysis: ADX (36) indicates a significant trend. MACD bearish cross below zero, accelerating bearish momentum. EMA5/8/13 in bearish alignment. KDJ bearish cross K52.3/D54.3. Volume increased 1.7x.
Price change: -0.4500%
📉 $MRVL | 4-hour bearish signal
━━━━━━━━━━━━━━━━━━
Technical analysis: ADX 37, indicating significant trend strength. MACD DIF fell below the zero line, signaling a bearish trend reversal. EMA5 crossed below EMA8, short-term bearish bias. Volume increased 1.8x.
Price change: -1.5900%
━━━━━━━━━━━━━━━━━━
#技术分析 #SKUU #INTW #MRVL
📌 The above content is for reference only and does not constitute investment advice
15
·
--
4H bearish alert is here $SKUU $INTW $MRVL🔥
════════════════════
🟢 $SKUU 4-hour bearish signal
⚠️Technicals: ADX(27) confirms the trend is established—bearish follow-through is possible; MACD has formed a high-volume death cross below zero; EMAs are bearishly aligned; KDJ death cross (K49.6/D53.9), volume 1.5x
════════════════════
🟢 $INTW 4-hour bearish signal
⚠️Technicals: ADX confirms a clear trend; MACD has formed a death cross below zero, with bears gaining strength; moving averages are bearishly aligned; KDJ death cross suggests a short-term bearish bias; volume up 1.7x.
════════════════════
🟢 $MRVL 4-hour bearish signal
⚠️Technicals: Strong trend (ADX37) | MACD has fallen below the zero line and is starting to turn bearish | Moving averages have just formed a death cross; short-term momentum is weakening | Trading volume up 1.8x
════════════════════
🔔 Follow for first-hand market updates 🔔
#技术分析 #SKUU #INTW #MRVL
📌 When trading, pay attention to whether the candlestick pattern aligns
4H bearish alert is here $SKUU $INTW $MRVL 🔥
════════════════════
🟢 $SKUU 4-hour bearish signal
⚠️Technicals: ADX(27) confirms the trend is established—bearish follow-through is possible; MACD has formed a high-volume death cross below zero; EMAs are bearishly aligned; KDJ death cross (K49.6/D53.9), volume 1.5x
════════════════════
🟢 $INTW 4-hour bearish signal
⚠️Technicals: ADX confirms a clear trend; MACD has formed a death cross below zero, with bears gaining strength; moving averages are bearishly aligned; KDJ death cross suggests a short-term bearish bias; volume up 1.7x.
════════════════════
🟢 $MRVL 4-hour bearish signal
⚠️Technicals: Strong trend (ADX37) | MACD has fallen below the zero line and is starting to turn bearish | Moving averages have just formed a death cross; short-term momentum is weakening | Trading volume up 1.8x
════════════════════
🔔 Follow for first-hand market updates 🔔
#技术分析 #SKUU #INTW #MRVL
📌 When trading, pay attention to whether the candlestick pattern aligns
════════════════════
🟢 $SKUU 4-hour bearish signal
⚠️Technicals: ADX(27) confirms the trend is established—bearish follow-through is possible; MACD has formed a high-volume death cross below zero; EMAs are bearishly aligned; KDJ death cross (K49.6/D53.9), volume 1.5x
════════════════════
🟢 $INTW 4-hour bearish signal
⚠️Technicals: ADX confirms a clear trend; MACD has formed a death cross below zero, with bears gaining strength; moving averages are bearishly aligned; KDJ death cross suggests a short-term bearish bias; volume up 1.7x.
════════════════════
🟢 $MRVL 4-hour bearish signal
⚠️Technicals: Strong trend (ADX37) | MACD has fallen below the zero line and is starting to turn bearish | Moving averages have just formed a death cross; short-term momentum is weakening | Trading volume up 1.8x
════════════════════
🔔 Follow for first-hand market updates 🔔
#技术分析 #SKUU #INTW #MRVL
📌 When trading, pay attention to whether the candlestick pattern aligns
14
·
--
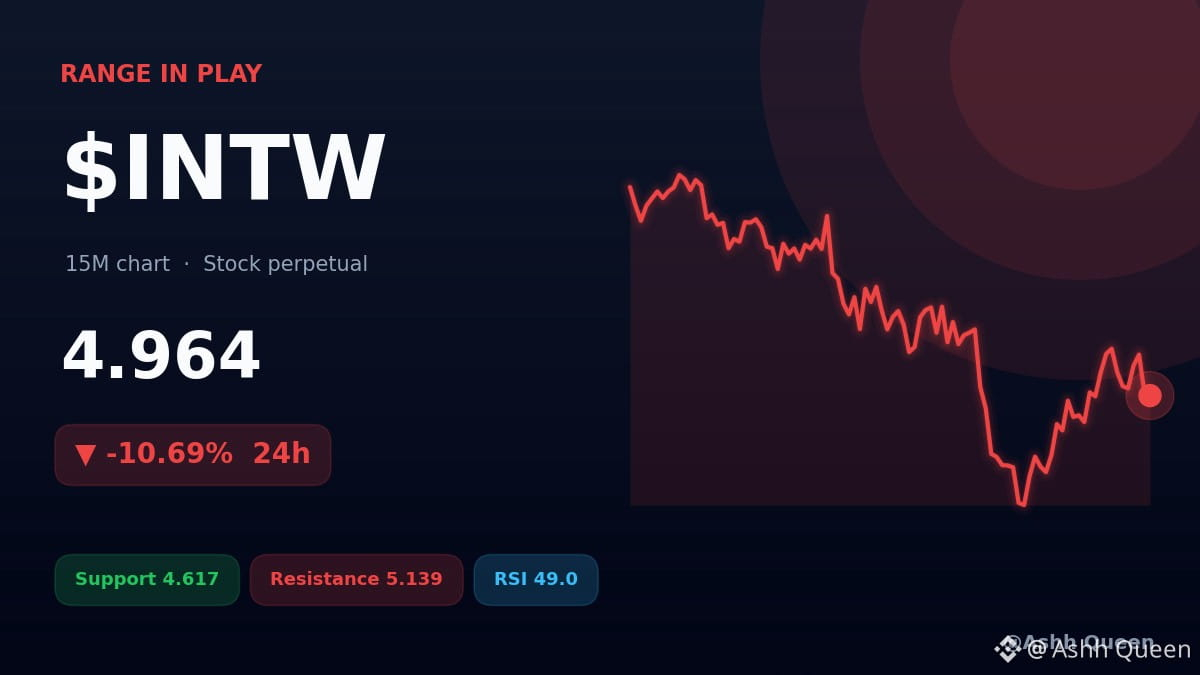
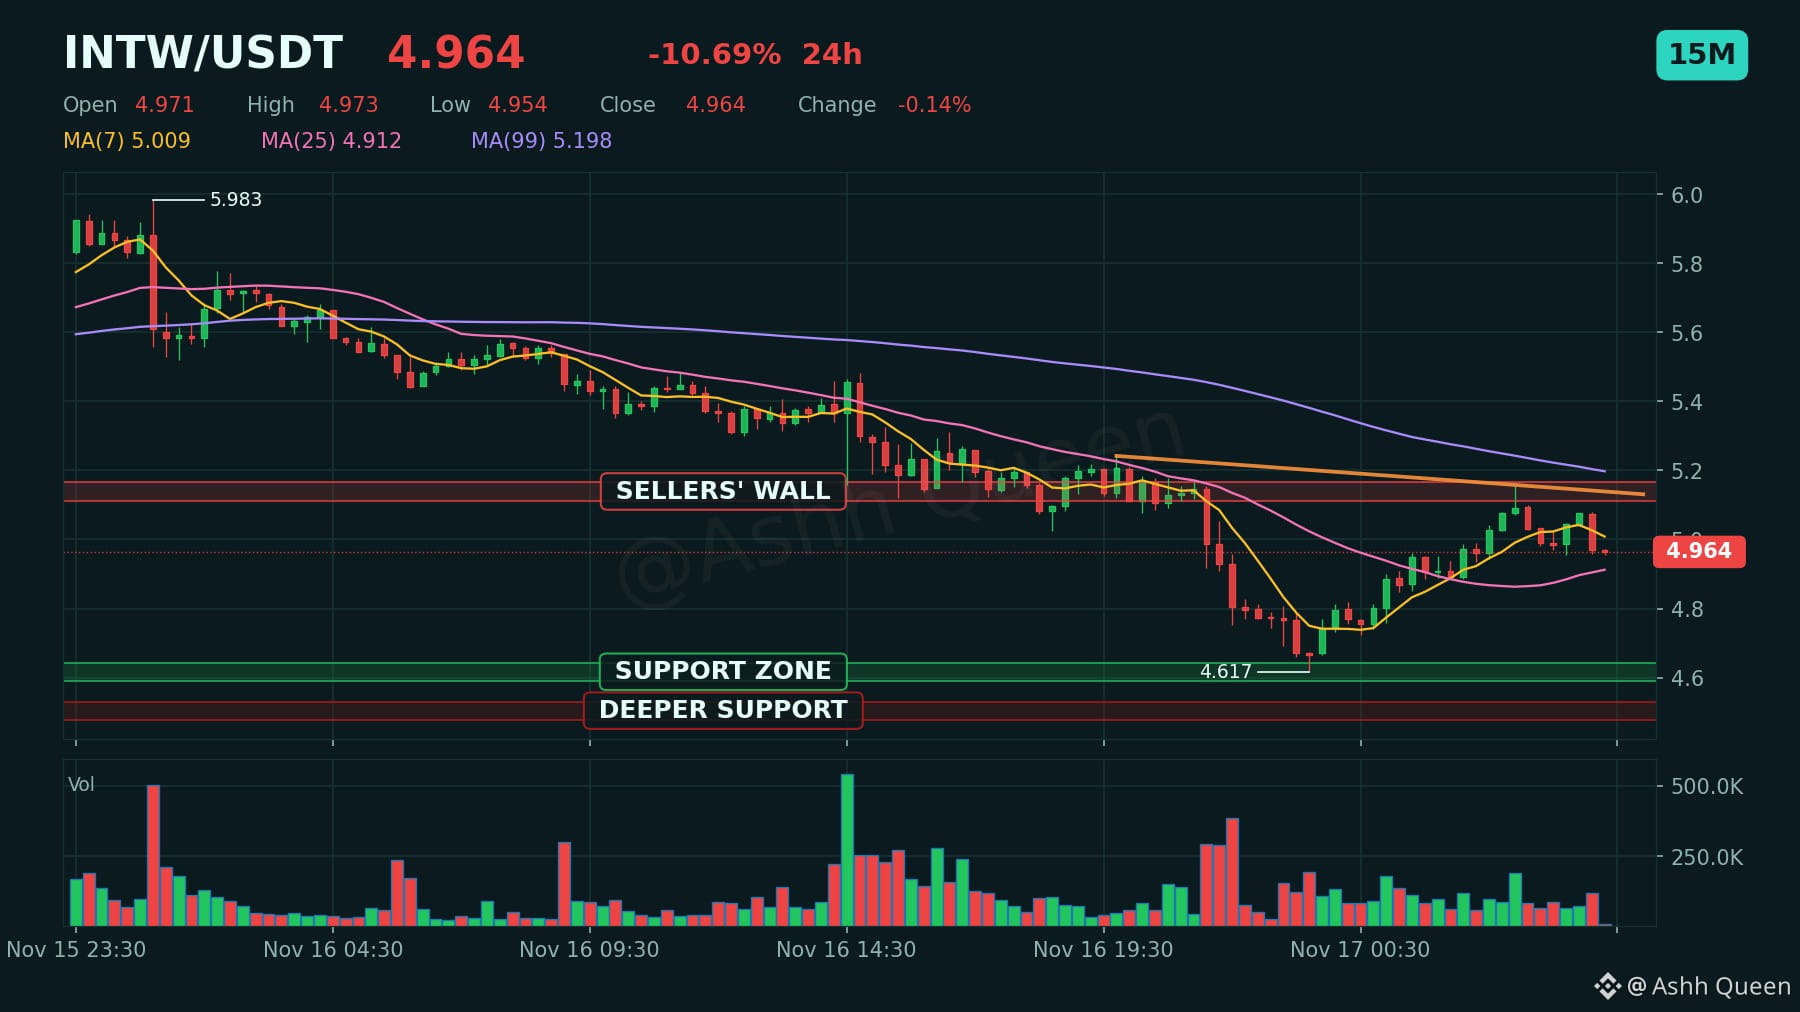
Many expect a steady recovery for $INTW, but the data suggests caution.
This perpetual contract moved -2.17% in the last hour, hovering near VWAP at 4.936. While it sits above support at 4.617, it remains below EMA20 at 4.975. ⚠️
If the price holds above VWAP at 4.936, a test of resistance at 5.139 could follow. If it fails, we look toward support at 4.617. 🛡️ 🧐
Are you expecting a trend reversal or further consolidation for $INTW?
#INTW #Stocks #MarketUpdate #BinanceSquare
⚠️ Perpetual contracts are leveraged derivatives, not the stock or commodity itself.
Not financial advice. Protect your capital first, the next setup always comes.
Many expect a steady recovery for $INTW , but the data suggests caution.
This perpetual contract moved -2.17% in the last hour, hovering near VWAP at 4.936. While it sits above support at 4.617, it remains below EMA20 at 4.975. ⚠️
If the price holds above VWAP at 4.936, a test of resistance at 5.139 could follow. If it fails, we look toward support at 4.617. 🛡️ 🧐
Are you expecting a trend reversal or further consolidation for $INTW ?
#INTW #Stocks #MarketUpdate #BinanceSquare
⚠️ Perpetual contracts are leveraged derivatives, not the stock or commodity itself.
Not financial advice. Protect your capital first, the next setup always comes.
This perpetual contract moved -2.17% in the last hour, hovering near VWAP at 4.936. While it sits above support at 4.617, it remains below EMA20 at 4.975. ⚠️
If the price holds above VWAP at 4.936, a test of resistance at 5.139 could follow. If it fails, we look toward support at 4.617. 🛡️ 🧐
Are you expecting a trend reversal or further consolidation for $INTW ?
#INTW #Stocks #MarketUpdate #BinanceSquare
⚠️ Perpetual contracts are leveraged derivatives, not the stock or commodity itself.
Not financial advice. Protect your capital first, the next setup always comes.
1
·
--
$INTW/$MU/$SOXL 4-hour candlestick chart crosses below the D-line—beware of a pullback 🔥
════════════════════
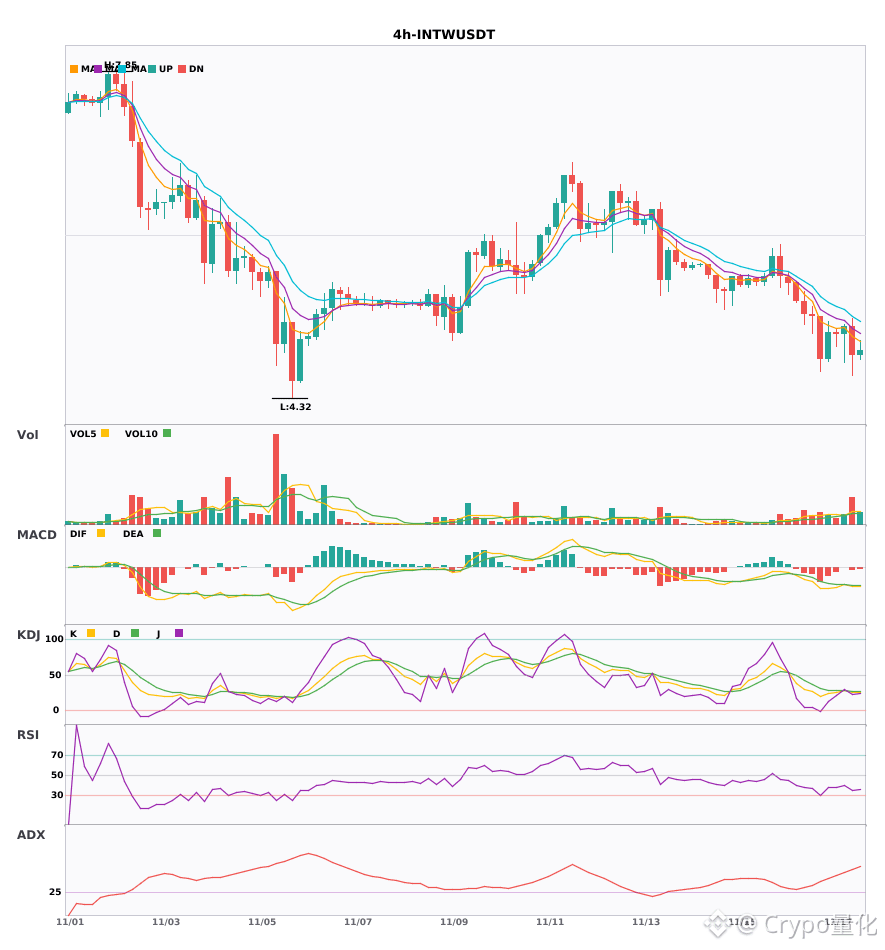
🟢 $INTW 4-hour bearish signal
⚠️ Technicals: The ADX trend is very strong, but don't chase highs. The MACD bearish crossover is gaining momentum, the moving averages are bearishly aligned and trending down, the KDJ bearish crossover suggests short-term weakness, and volume is up 2.4x.
════════════════════
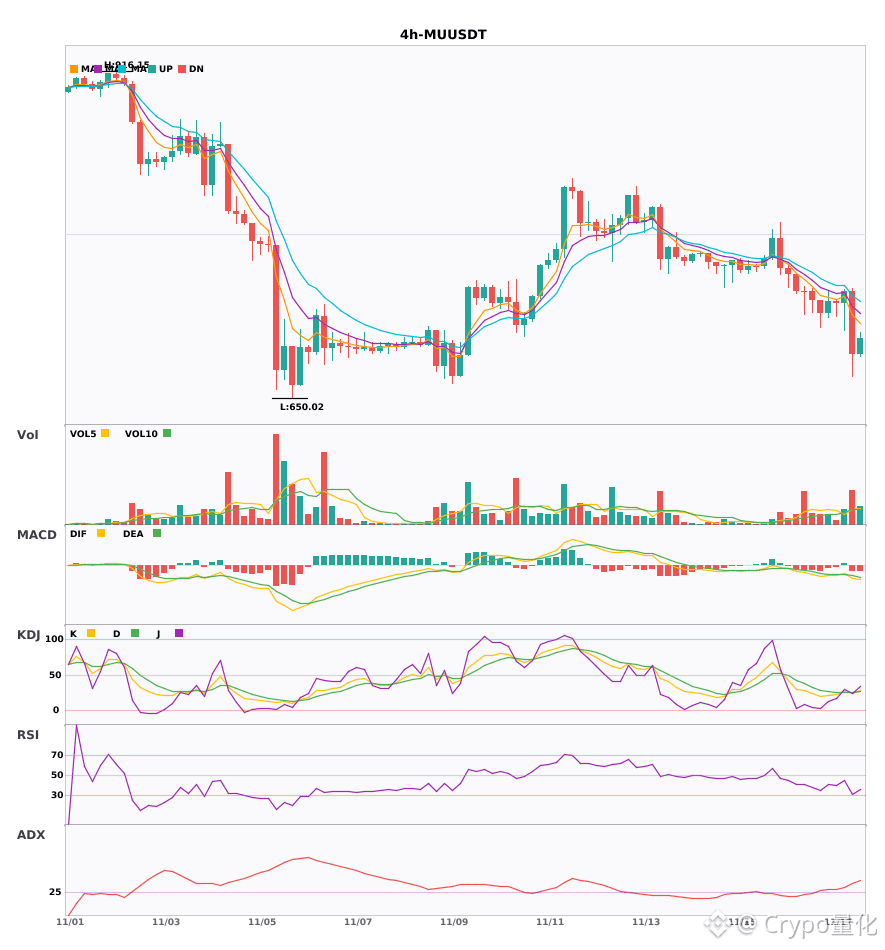
🟢 $MU 4-hour bearish signal
⚠️ Technicals: ADX at 38 indicates a strong trend; the MACD bearish crossover below zero is accelerating, the moving averages are diverging bearishly, and the KDJ has formed a bearish crossover. Volume is up 2.3x; the short-term outlook is bearish.
📢 Market update: Binance will support cash dividend payments for Micron Technology (MU) through bStocks.
════════════════════
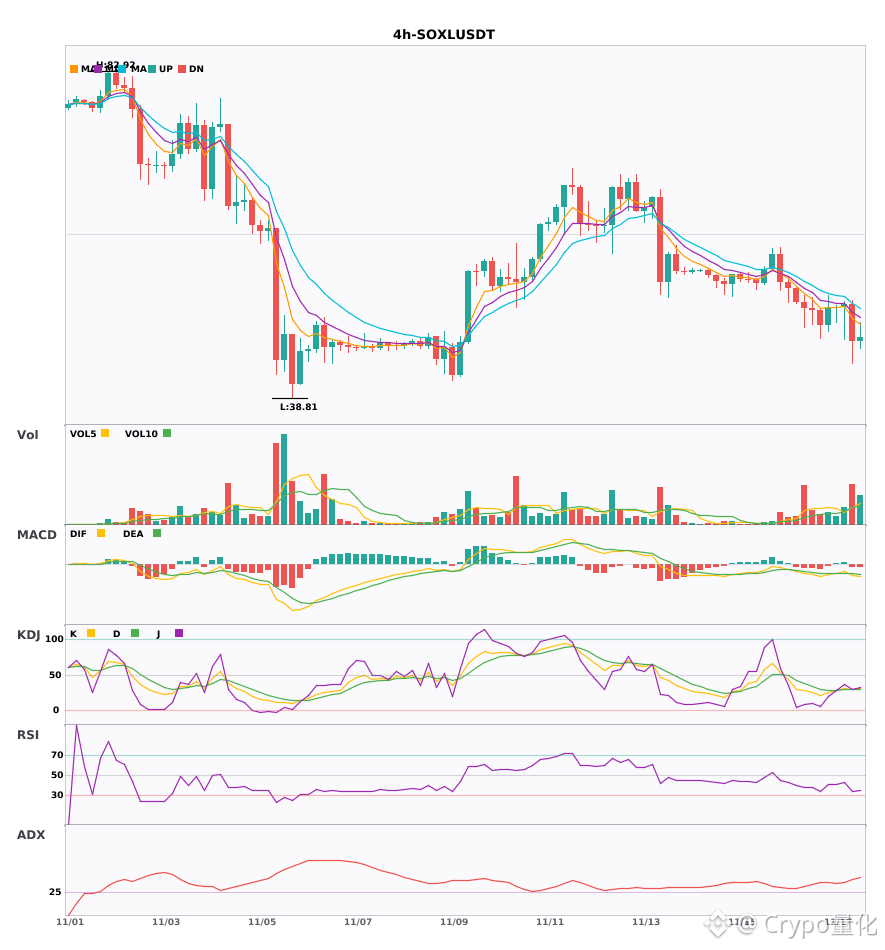
🟢 $SOXL 4-hour bearish signal
⚠️ Technicals: ADX is at 41, indicating a fairly strong trend. The MACD bearish crossover comes with rising volume, the moving averages are bearishly aligned, and the KDJ bearish crossover signals a bearish outlook. Volume is up 2.4x.
════════════════════
🔔 Follow for first-hand market updates 🔔
#技术分析 #INTW #MU #SOXL
📌 When trading, pay attention to whether the candlestick pattern confirms the signal
$INTW /$MU /$SOXL 4-hour candlestick chart crosses below the D-line—beware of a pullback 🔥
════════════════════
🟢 $INTW 4-hour bearish signal
⚠️ Technicals: The ADX trend is very strong, but don't chase highs. The MACD bearish crossover is gaining momentum, the moving averages are bearishly aligned and trending down, the KDJ bearish crossover suggests short-term weakness, and volume is up 2.4x.
════════════════════
🟢 $MU 4-hour bearish signal
⚠️ Technicals: ADX at 38 indicates a strong trend; the MACD bearish crossover below zero is accelerating, the moving averages are diverging bearishly, and the KDJ has formed a bearish crossover. Volume is up 2.3x; the short-term outlook is bearish.
📢 Market update: Binance will support cash dividend payments for Micron Technology (MU) through bStocks.
════════════════════
🟢 $SOXL 4-hour bearish signal
⚠️ Technicals: ADX is at 41, indicating a fairly strong trend. The MACD bearish crossover comes with rising volume, the moving averages are bearishly aligned, and the KDJ bearish crossover signals a bearish outlook. Volume is up 2.4x.
════════════════════
🔔 Follow for first-hand market updates 🔔
#技术分析 #INTW #MU #SOXL
📌 When trading, pay attention to whether the candlestick pattern confirms the signal
════════════════════
🟢 $INTW 4-hour bearish signal
⚠️ Technicals: The ADX trend is very strong, but don't chase highs. The MACD bearish crossover is gaining momentum, the moving averages are bearishly aligned and trending down, the KDJ bearish crossover suggests short-term weakness, and volume is up 2.4x.
════════════════════
🟢 $MU 4-hour bearish signal
⚠️ Technicals: ADX at 38 indicates a strong trend; the MACD bearish crossover below zero is accelerating, the moving averages are diverging bearishly, and the KDJ has formed a bearish crossover. Volume is up 2.3x; the short-term outlook is bearish.
📢 Market update: Binance will support cash dividend payments for Micron Technology (MU) through bStocks.
════════════════════
🟢 $SOXL 4-hour bearish signal
⚠️ Technicals: ADX is at 41, indicating a fairly strong trend. The MACD bearish crossover comes with rising volume, the moving averages are bearishly aligned, and the KDJ bearish crossover signals a bearish outlook. Volume is up 2.4x.
════════════════════
🔔 Follow for first-hand market updates 🔔
#技术分析 #INTW #MU #SOXL
📌 When trading, pay attention to whether the candlestick pattern confirms the signal
19
·
--
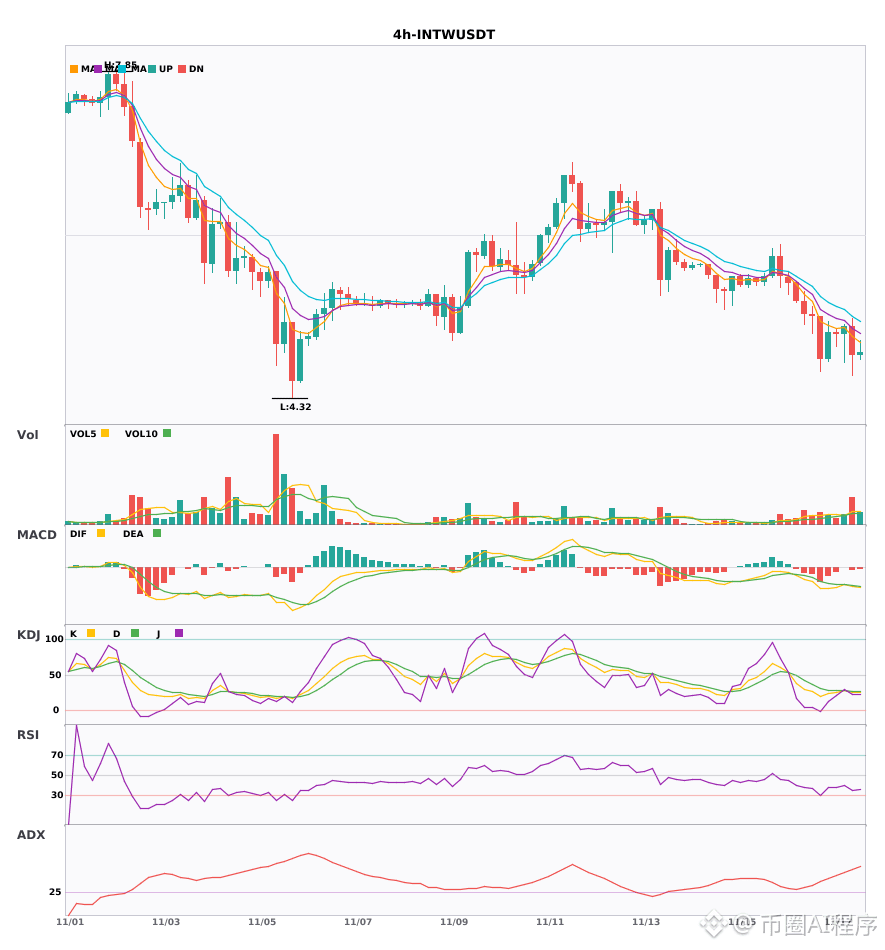
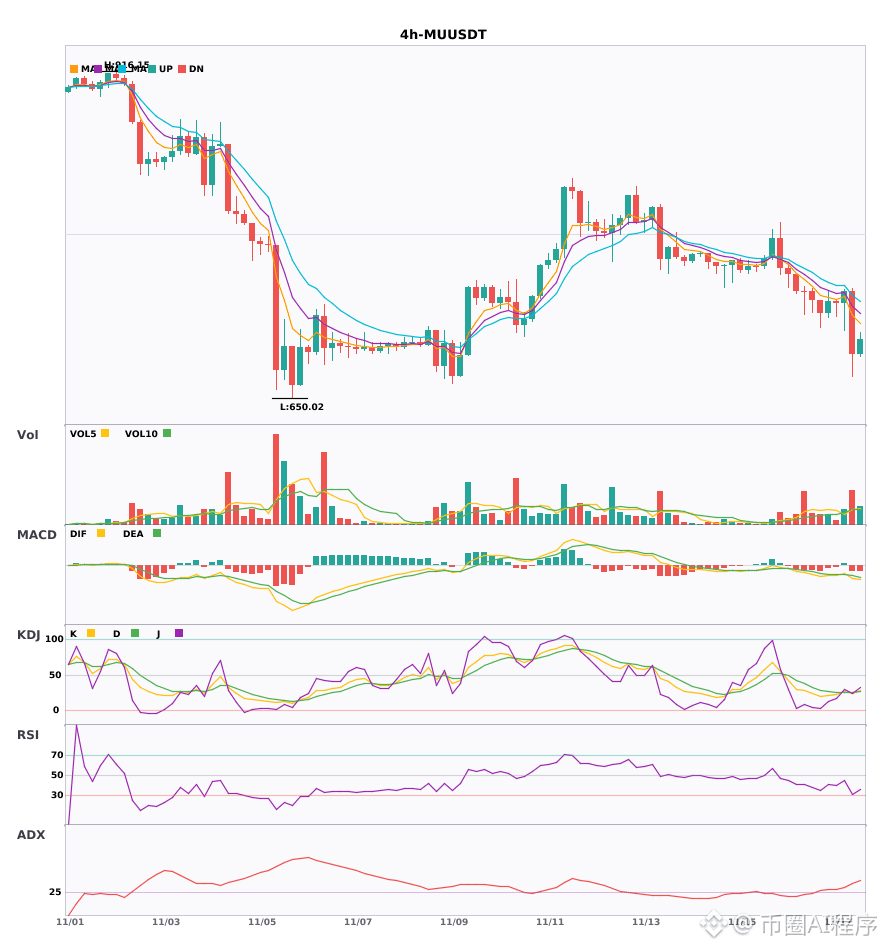
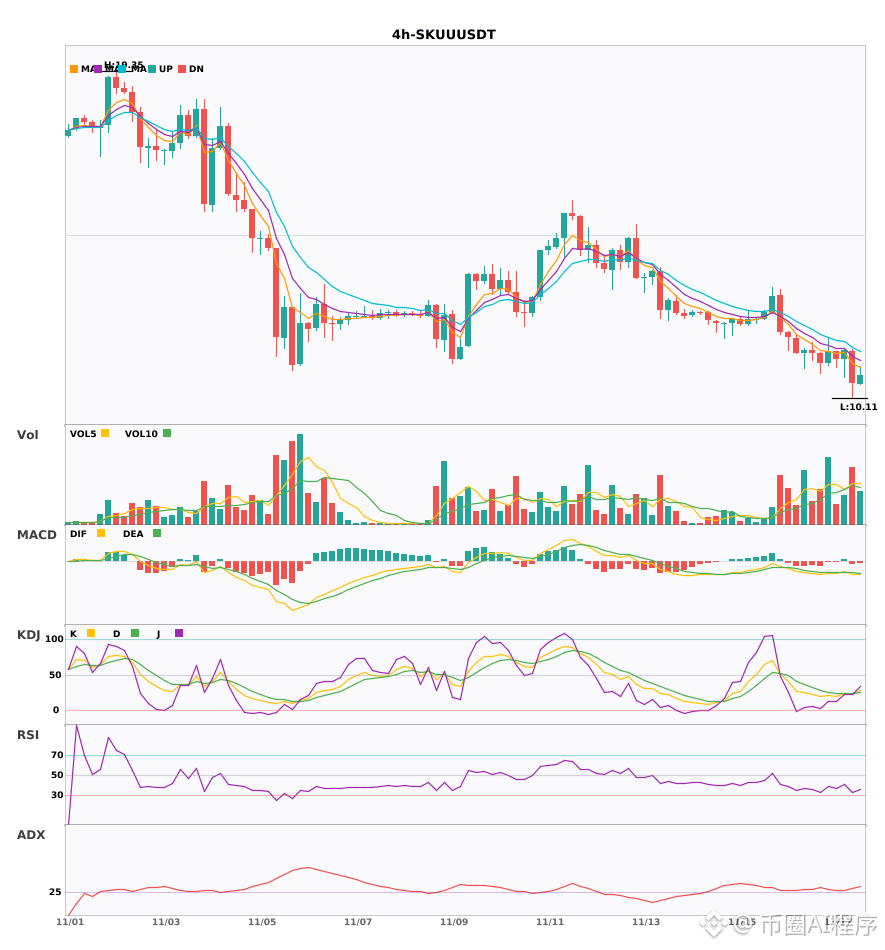
$INTW/$MU/$SKUU 4-hour short setup triggered; the daily trend has turned bearish 🔥
════════════════════
🟢 $INTW 4-hour bearish signal
⚠️Technical analysis: Daily and 4-hour bearish confluence confirmed! The 4-hour MACD has formed a death cross below zero, with the green bars expanding. Moving averages are bearishly aligned and diverging downward. KDJ has formed a death cross but is not yet oversold. Volume is up 2.4x; the trend favors bears.
════════════════════
🟢 $MU 4-hour bearish signal
⚠️Technical analysis: Bearish confluence across multiple timeframes: the 4-hour MACD has formed a high-volume death cross below zero; EMAs are bearishly aligned and diverging downward; KDJ has formed a death cross but is not oversold. Daily bearish confluence is confirmed, and volume is up 2.3x. Short-term outlook is bearish.
📢Market update: Binance will support Micron Technology (MU) cash dividend distributions through bStocks.
════════════════════
🟢 $SKUU 4-hour bearish signal
⚠️Technical analysis: Daily and 4-hour bearish confluence confirmed! MACD has formed a high-volume death cross, moving averages are bearishly diverging downward, and KDJ shows weak bearish dominance at low levels. Volume is up 1.5x.
════════════════════
🔔 Follow for firsthand market movement updates 🔔
#多周期共振 #INTW #MU #SKUU
📌 When trading, pay attention to whether the candlestick pattern confirms
$INTW /$MU /$SKUU 4-hour short setup triggered; the daily trend has turned bearish 🔥
════════════════════
🟢 $INTW 4-hour bearish signal
⚠️Technical analysis: Daily and 4-hour bearish confluence confirmed! The 4-hour MACD has formed a death cross below zero, with the green bars expanding. Moving averages are bearishly aligned and diverging downward. KDJ has formed a death cross but is not yet oversold. Volume is up 2.4x; the trend favors bears.
════════════════════
🟢 $MU 4-hour bearish signal
⚠️Technical analysis: Bearish confluence across multiple timeframes: the 4-hour MACD has formed a high-volume death cross below zero; EMAs are bearishly aligned and diverging downward; KDJ has formed a death cross but is not oversold. Daily bearish confluence is confirmed, and volume is up 2.3x. Short-term outlook is bearish.
📢Market update: Binance will support Micron Technology (MU) cash dividend distributions through bStocks.
════════════════════
🟢 $SKUU 4-hour bearish signal
⚠️Technical analysis: Daily and 4-hour bearish confluence confirmed! MACD has formed a high-volume death cross, moving averages are bearishly diverging downward, and KDJ shows weak bearish dominance at low levels. Volume is up 1.5x.
════════════════════
🔔 Follow for firsthand market movement updates 🔔
#多周期共振 #INTW #MU #SKUU
📌 When trading, pay attention to whether the candlestick pattern confirms
════════════════════
🟢 $INTW 4-hour bearish signal
⚠️Technical analysis: Daily and 4-hour bearish confluence confirmed! The 4-hour MACD has formed a death cross below zero, with the green bars expanding. Moving averages are bearishly aligned and diverging downward. KDJ has formed a death cross but is not yet oversold. Volume is up 2.4x; the trend favors bears.
════════════════════
🟢 $MU 4-hour bearish signal
⚠️Technical analysis: Bearish confluence across multiple timeframes: the 4-hour MACD has formed a high-volume death cross below zero; EMAs are bearishly aligned and diverging downward; KDJ has formed a death cross but is not oversold. Daily bearish confluence is confirmed, and volume is up 2.3x. Short-term outlook is bearish.
📢Market update: Binance will support Micron Technology (MU) cash dividend distributions through bStocks.
════════════════════
🟢 $SKUU 4-hour bearish signal
⚠️Technical analysis: Daily and 4-hour bearish confluence confirmed! MACD has formed a high-volume death cross, moving averages are bearishly diverging downward, and KDJ shows weak bearish dominance at low levels. Volume is up 1.5x.
════════════════════
🔔 Follow for firsthand market movement updates 🔔
#多周期共振 #INTW #MU #SKUU
📌 When trading, pay attention to whether the candlestick pattern confirms
1
17
·
--
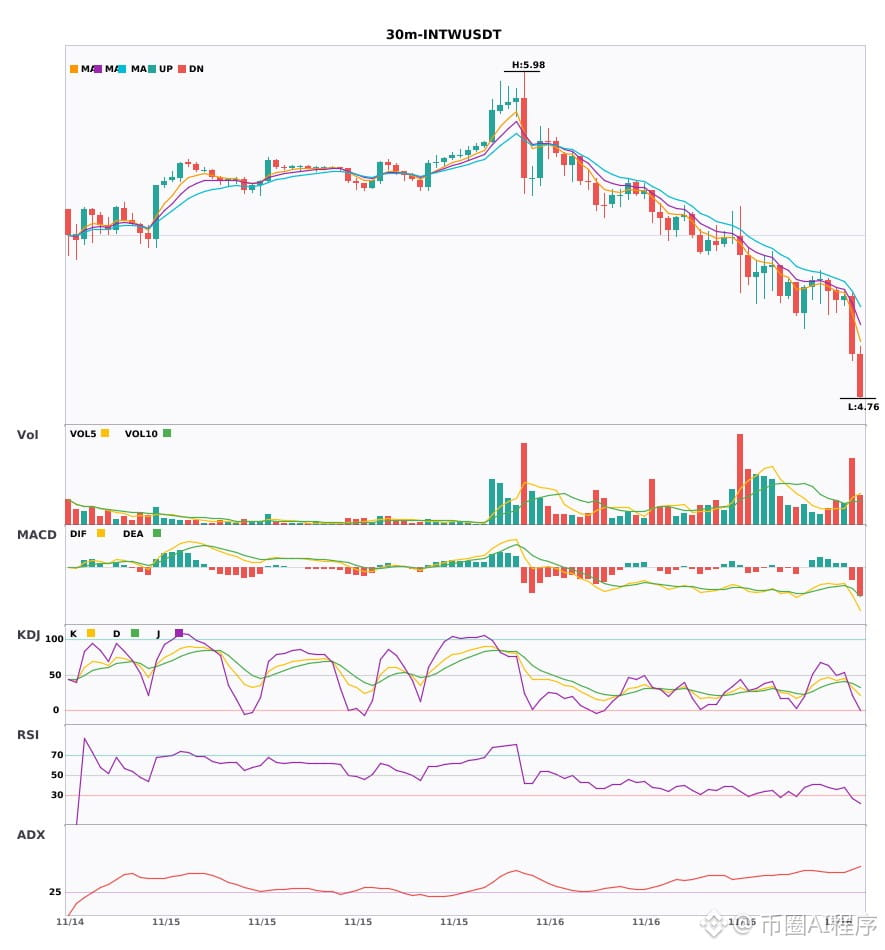
Two assets showing confluence across the 30-minute and 4-hour timeframes—bearish signals are all aligned 🔥
════════════════════
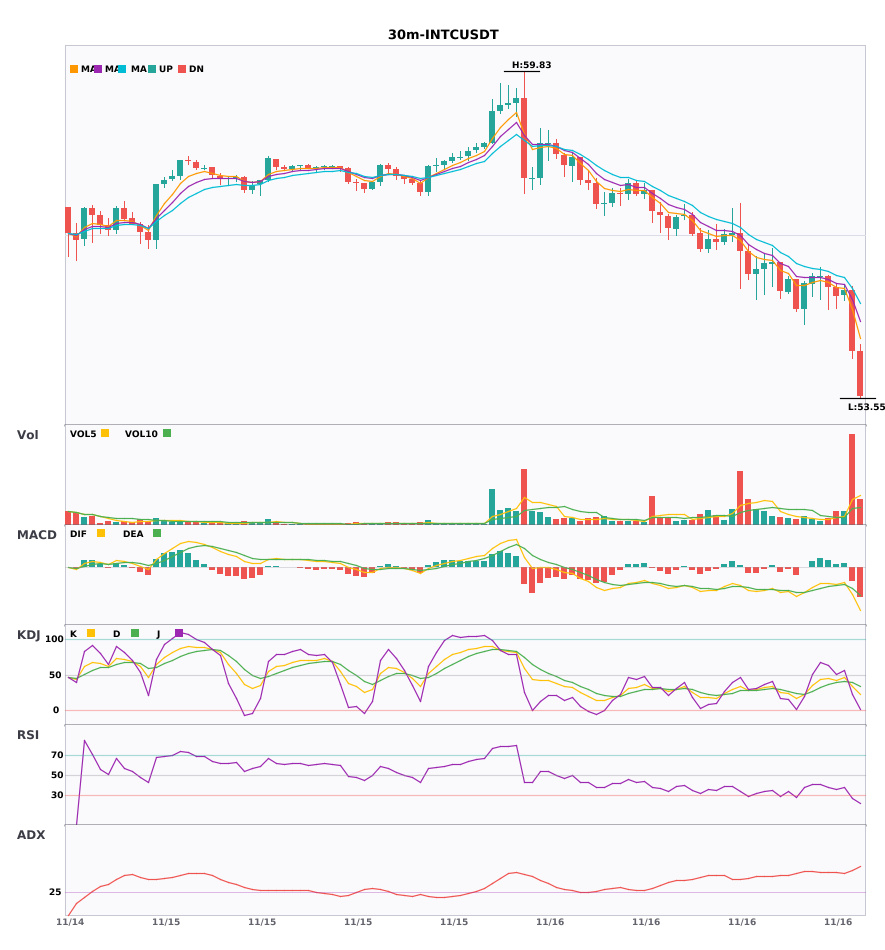
🟢 $INTW 30-minute bearish signal
⚠️ Technical analysis: Bearish confluence on the 4-hour and 30-minute timeframes. MACD has formed a death cross below zero, with expanding volume accelerating the move. Moving averages are bearishly aligned and pointing downward. KDJ has formed a death cross but is not oversold. Trading volume is 2.8 times higher. Bearish outlook.
════════════════════
🟢 $INTC 30-minute bearish signal
⚠️ Technical analysis: The 4-hour bearish trend is reinforced by 30-minute confluence. MACD has formed a death cross, with expanding green bars on the histogram. Moving averages are bearishly aligned, diverging, and pointing downward. KDJ has formed a death cross but is not oversold. Trading volume is 5.7 times higher.
════════════════════
🔔 Follow for first-hand market updates 🔔
#多周期共振 #INTW #INTC
📌 When trading, pay attention to whether the candlestick patterns confirm the signal
Two assets showing confluence across the 30-minute and 4-hour timeframes—bearish signals are all aligned 🔥
════════════════════
🟢 $INTW 30-minute bearish signal
⚠️ Technical analysis: Bearish confluence on the 4-hour and 30-minute timeframes. MACD has formed a death cross below zero, with expanding volume accelerating the move. Moving averages are bearishly aligned and pointing downward. KDJ has formed a death cross but is not oversold. Trading volume is 2.8 times higher. Bearish outlook.
════════════════════
🟢 $INTC 30-minute bearish signal
⚠️ Technical analysis: The 4-hour bearish trend is reinforced by 30-minute confluence. MACD has formed a death cross, with expanding green bars on the histogram. Moving averages are bearishly aligned, diverging, and pointing downward. KDJ has formed a death cross but is not oversold. Trading volume is 5.7 times higher.
════════════════════
🔔 Follow for first-hand market updates 🔔
#多周期共振 #INTW #INTC
📌 When trading, pay attention to whether the candlestick patterns confirm the signal
════════════════════
🟢 $INTW 30-minute bearish signal
⚠️ Technical analysis: Bearish confluence on the 4-hour and 30-minute timeframes. MACD has formed a death cross below zero, with expanding volume accelerating the move. Moving averages are bearishly aligned and pointing downward. KDJ has formed a death cross but is not oversold. Trading volume is 2.8 times higher. Bearish outlook.
════════════════════
🟢 $INTC 30-minute bearish signal
⚠️ Technical analysis: The 4-hour bearish trend is reinforced by 30-minute confluence. MACD has formed a death cross, with expanding green bars on the histogram. Moving averages are bearishly aligned, diverging, and pointing downward. KDJ has formed a death cross but is not oversold. Trading volume is 5.7 times higher.
════════════════════
🔔 Follow for first-hand market updates 🔔
#多周期共振 #INTW #INTC
📌 When trading, pay attention to whether the candlestick patterns confirm the signal
3
$INTW/$INTC 30-minute timeframe dual-coin bearish signal triggered
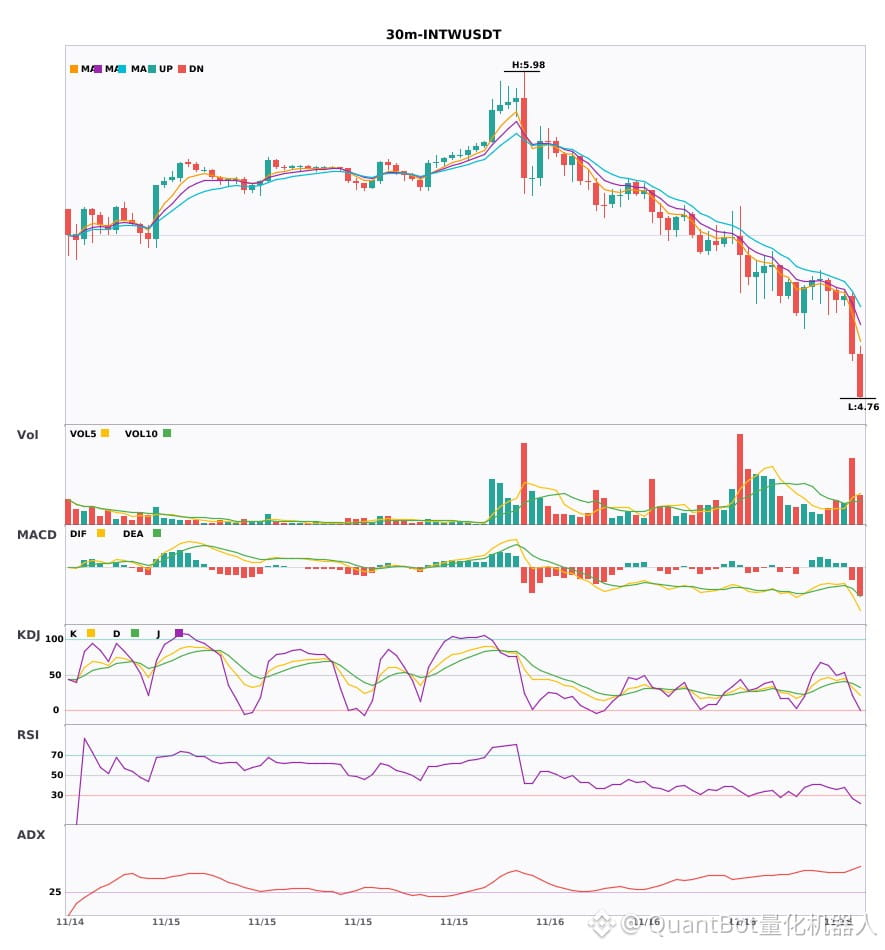
📉 $INTW | 30-minute bearish signal
━━━━━━━━━━━━━━━━━━
Technical analysis: ADX(51) indicates an extremely strong trend; watch for a pullback; MACD bearish cross below zero, bearish momentum accelerating; EMA5/8/13 in bearish alignment; KDJ bearish cross (K32.4,D38.2), short-term outlook bearish; volume up 2.8x.
Price change: -4.2000%
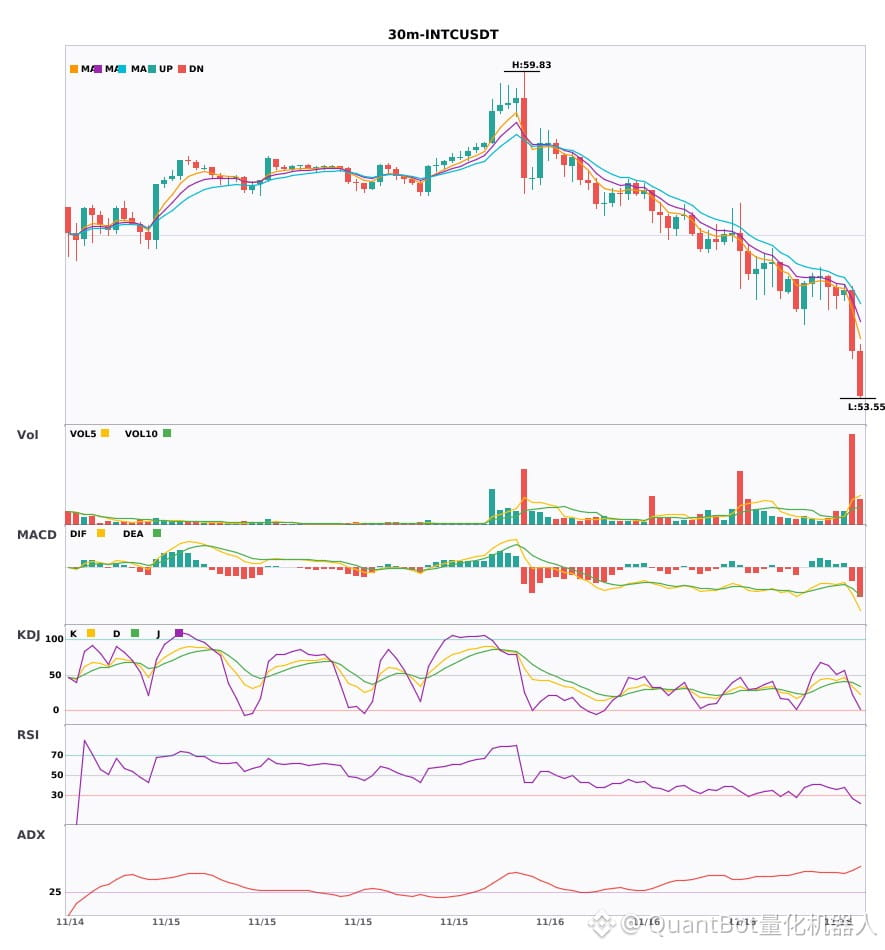
📉 $INTC | 30-minute bearish signal
━━━━━━━━━━━━━━━━━━
Technical analysis: ADX(51) indicates an extremely strong trend; watch for a pullback from overbought conditions; MACD bearish cross below zero, bearish momentum strengthening; EMA5/8/13 in bearish alignment; KDJ bearish cross (K33.4/D38.8), short-term outlook bearish; trading volume up 5.7x.
Price change: -2.1000%
━━━━━━━━━━━━━━━━━━
#技术分析 #INTW #INTC
📌 The above content is for reference only and does not constitute investment advice
$INTW /$INTC 30-minute timeframe dual-coin bearish signal triggered
📉 $INTW | 30-minute bearish signal
━━━━━━━━━━━━━━━━━━
Technical analysis: ADX(51) indicates an extremely strong trend; watch for a pullback; MACD bearish cross below zero, bearish momentum accelerating; EMA5/8/13 in bearish alignment; KDJ bearish cross (K32.4,D38.2), short-term outlook bearish; volume up 2.8x.
Price change: -4.2000%
📉 $INTC | 30-minute bearish signal
━━━━━━━━━━━━━━━━━━
Technical analysis: ADX(51) indicates an extremely strong trend; watch for a pullback from overbought conditions; MACD bearish cross below zero, bearish momentum strengthening; EMA5/8/13 in bearish alignment; KDJ bearish cross (K33.4/D38.8), short-term outlook bearish; trading volume up 5.7x.
Price change: -2.1000%
━━━━━━━━━━━━━━━━━━
#技术分析 #INTW #INTC
📌 The above content is for reference only and does not constitute investment advice
📉 $INTW | 30-minute bearish signal
━━━━━━━━━━━━━━━━━━
Technical analysis: ADX(51) indicates an extremely strong trend; watch for a pullback; MACD bearish cross below zero, bearish momentum accelerating; EMA5/8/13 in bearish alignment; KDJ bearish cross (K32.4,D38.2), short-term outlook bearish; volume up 2.8x.
Price change: -4.2000%
📉 $INTC | 30-minute bearish signal
━━━━━━━━━━━━━━━━━━
Technical analysis: ADX(51) indicates an extremely strong trend; watch for a pullback from overbought conditions; MACD bearish cross below zero, bearish momentum strengthening; EMA5/8/13 in bearish alignment; KDJ bearish cross (K33.4/D38.8), short-term outlook bearish; trading volume up 5.7x.
Price change: -2.1000%
━━━━━━━━━━━━━━━━━━
#技术分析 #INTW #INTC
📌 The above content is for reference only and does not constitute investment advice
20
·
--
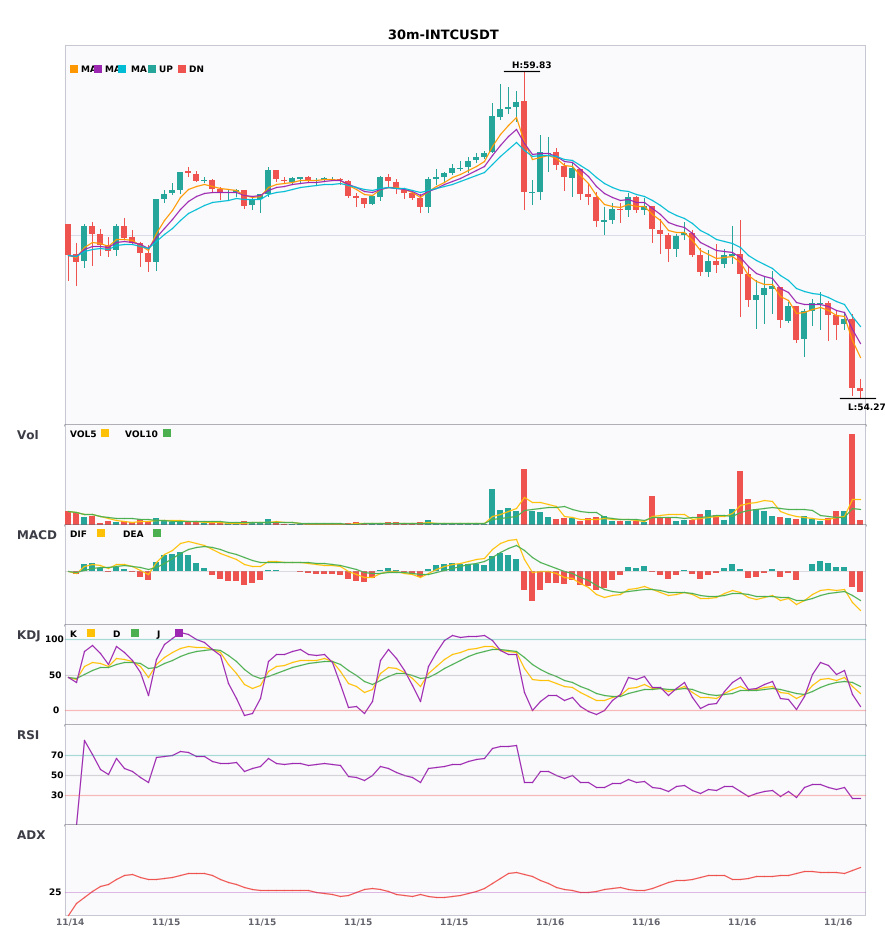
$INTW / $INTC 30-minute bearish bias, still pushing lower in the short term🔥
════════════════════
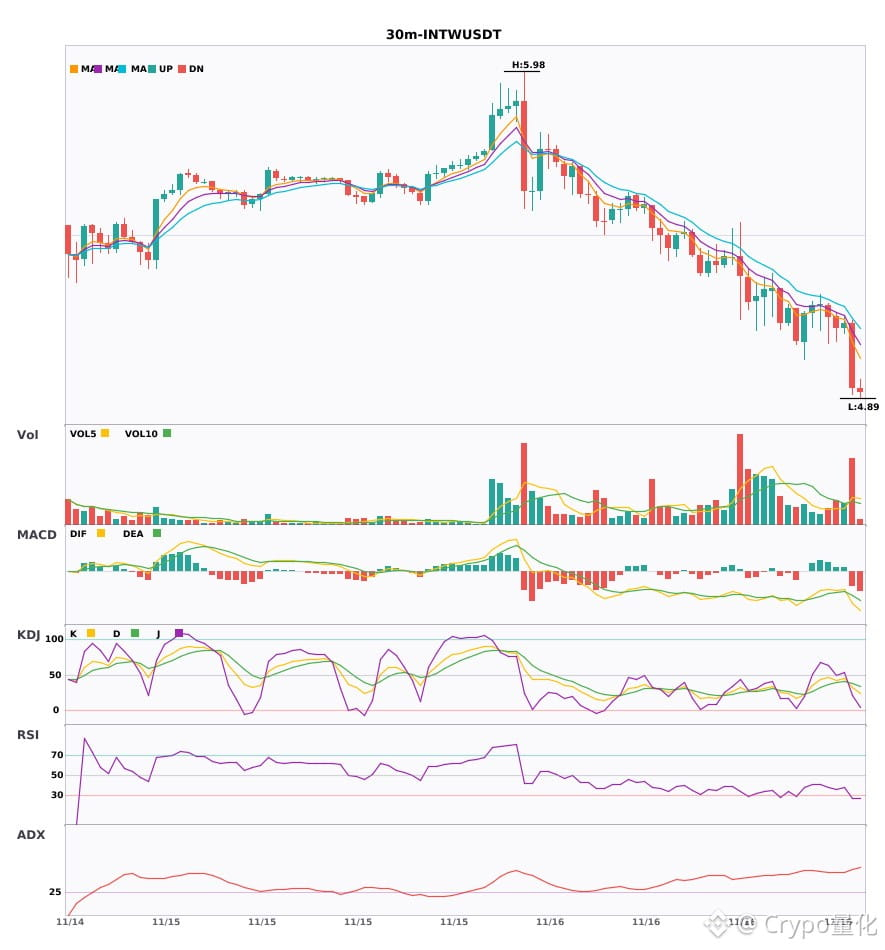
🟢 $INTW 30-minute bearish signal
⚠️Technical analysis: ADX is as high as 51, indicating a very strong trend, but beware of a pullback from overbought conditions. MACD has formed a bearish crossover, and selling pressure is accelerating. Moving averages are in a bearish alignment and trending downward; KDJ has also formed a bearish crossover, suggesting a short-term bearish outlook. Volume surged to 2.8 times its usual level.
════════════════════
🟢 $INTC 30-minute bearish signal
⚠️Technical analysis: The trend is exceptionally strong, but beware of a pullback from overbought conditions; volume increased after the MACD bearish crossover, and the green bars are growing; moving averages have just formed a bearish alignment and are diverging downward; KDJ is bearish after a crossover (K 33.4, D 38.8); volume increased 5.7 times.
════════════════════
🔔 Follow for first-hand market updates 🔔
#技术分析 #INTW #INTC
📌 When trading, watch for whether the candlestick pattern confirms the move
$INTW / $INTC 30-minute bearish bias, still pushing lower in the short term🔥
════════════════════
🟢 $INTW 30-minute bearish signal
⚠️Technical analysis: ADX is as high as 51, indicating a very strong trend, but beware of a pullback from overbought conditions. MACD has formed a bearish crossover, and selling pressure is accelerating. Moving averages are in a bearish alignment and trending downward; KDJ has also formed a bearish crossover, suggesting a short-term bearish outlook. Volume surged to 2.8 times its usual level.
════════════════════
🟢 $INTC 30-minute bearish signal
⚠️Technical analysis: The trend is exceptionally strong, but beware of a pullback from overbought conditions; volume increased after the MACD bearish crossover, and the green bars are growing; moving averages have just formed a bearish alignment and are diverging downward; KDJ is bearish after a crossover (K 33.4, D 38.8); volume increased 5.7 times.
════════════════════
🔔 Follow for first-hand market updates 🔔
#技术分析 #INTW #INTC
📌 When trading, watch for whether the candlestick pattern confirms the move
════════════════════
🟢 $INTW 30-minute bearish signal
⚠️Technical analysis: ADX is as high as 51, indicating a very strong trend, but beware of a pullback from overbought conditions. MACD has formed a bearish crossover, and selling pressure is accelerating. Moving averages are in a bearish alignment and trending downward; KDJ has also formed a bearish crossover, suggesting a short-term bearish outlook. Volume surged to 2.8 times its usual level.
════════════════════
🟢 $INTC 30-minute bearish signal
⚠️Technical analysis: The trend is exceptionally strong, but beware of a pullback from overbought conditions; volume increased after the MACD bearish crossover, and the green bars are growing; moving averages have just formed a bearish alignment and are diverging downward; KDJ is bearish after a crossover (K 33.4, D 38.8); volume increased 5.7 times.
════════════════════
🔔 Follow for first-hand market updates 🔔
#技术分析 #INTW #INTC
📌 When trading, watch for whether the candlestick pattern confirms the move
9

·
--
INTW is down 12.98% over 24 hours, yet aggressive buyers still have the upper hand. That’s where the market is divided right now.
Binance TradFi Perpetuals (traditional finance category, high gap risk outside trading hours) | INTW remains weak intraday; any recovery depends first on whether selling pressure eases. Current price is around 4.959, with 24h trading volume of about 5655.56万; absolute trading volume does not necessarily mean volume is elevated relative to normal. Market positioning: 79% of accounts are long; the aggressive buy/sell ratio is 1.34 (price is falling, but aggressive buyers are dominant); open interest is down 1.0% over 30m.
Reference indicators: The 30m ATR trend-band reference level is 5.47564. Price is below it, indicating a weak structure; watch whether it can reclaim that level. The current Bollinger Band range is roughly 5.068179 - 5.413421. If price continues moving one way along the band, volatility expansion may not be over yet; a return toward the middle band would better suggest sentiment is returning to balance.
Which would you wait for first: whether the aggressive buy/sell ratio of 1.34 can stay above 1 and help stabilize the price, or whether the current price can reclaim the ATR trend-band reference level of 5.47564?
#INTW #UnusualMoveAlert
INTW is down 12.98% over 24 hours, yet aggressive buyers still have the upper hand. That’s where the market is divided right now.
Binance TradFi Perpetuals (traditional finance category, high gap risk outside trading hours) | INTW remains weak intraday; any recovery depends first on whether selling pressure eases. Current price is around 4.959, with 24h trading volume of about 5655.56万; absolute trading volume does not necessarily mean volume is elevated relative to normal. Market positioning: 79% of accounts are long; the aggressive buy/sell ratio is 1.34 (price is falling, but aggressive buyers are dominant); open interest is down 1.0% over 30m.
Reference indicators: The 30m ATR trend-band reference level is 5.47564. Price is below it, indicating a weak structure; watch whether it can reclaim that level. The current Bollinger Band range is roughly 5.068179 - 5.413421. If price continues moving one way along the band, volatility expansion may not be over yet; a return toward the middle band would better suggest sentiment is returning to balance.
Which would you wait for first: whether the aggressive buy/sell ratio of 1.34 can stay above 1 and help stabilize the price, or whether the current price can reclaim the ATR trend-band reference level of 5.47564?
#INTW #UnusualMoveAlert
Binance TradFi Perpetuals (traditional finance category, high gap risk outside trading hours) | INTW remains weak intraday; any recovery depends first on whether selling pressure eases. Current price is around 4.959, with 24h trading volume of about 5655.56万; absolute trading volume does not necessarily mean volume is elevated relative to normal. Market positioning: 79% of accounts are long; the aggressive buy/sell ratio is 1.34 (price is falling, but aggressive buyers are dominant); open interest is down 1.0% over 30m.
Reference indicators: The 30m ATR trend-band reference level is 5.47564. Price is below it, indicating a weak structure; watch whether it can reclaim that level. The current Bollinger Band range is roughly 5.068179 - 5.413421. If price continues moving one way along the band, volatility expansion may not be over yet; a return toward the middle band would better suggest sentiment is returning to balance.
Which would you wait for first: whether the aggressive buy/sell ratio of 1.34 can stay above 1 and help stabilize the price, or whether the current price can reclaim the ATR trend-band reference level of 5.47564?
#INTW #UnusualMoveAlert

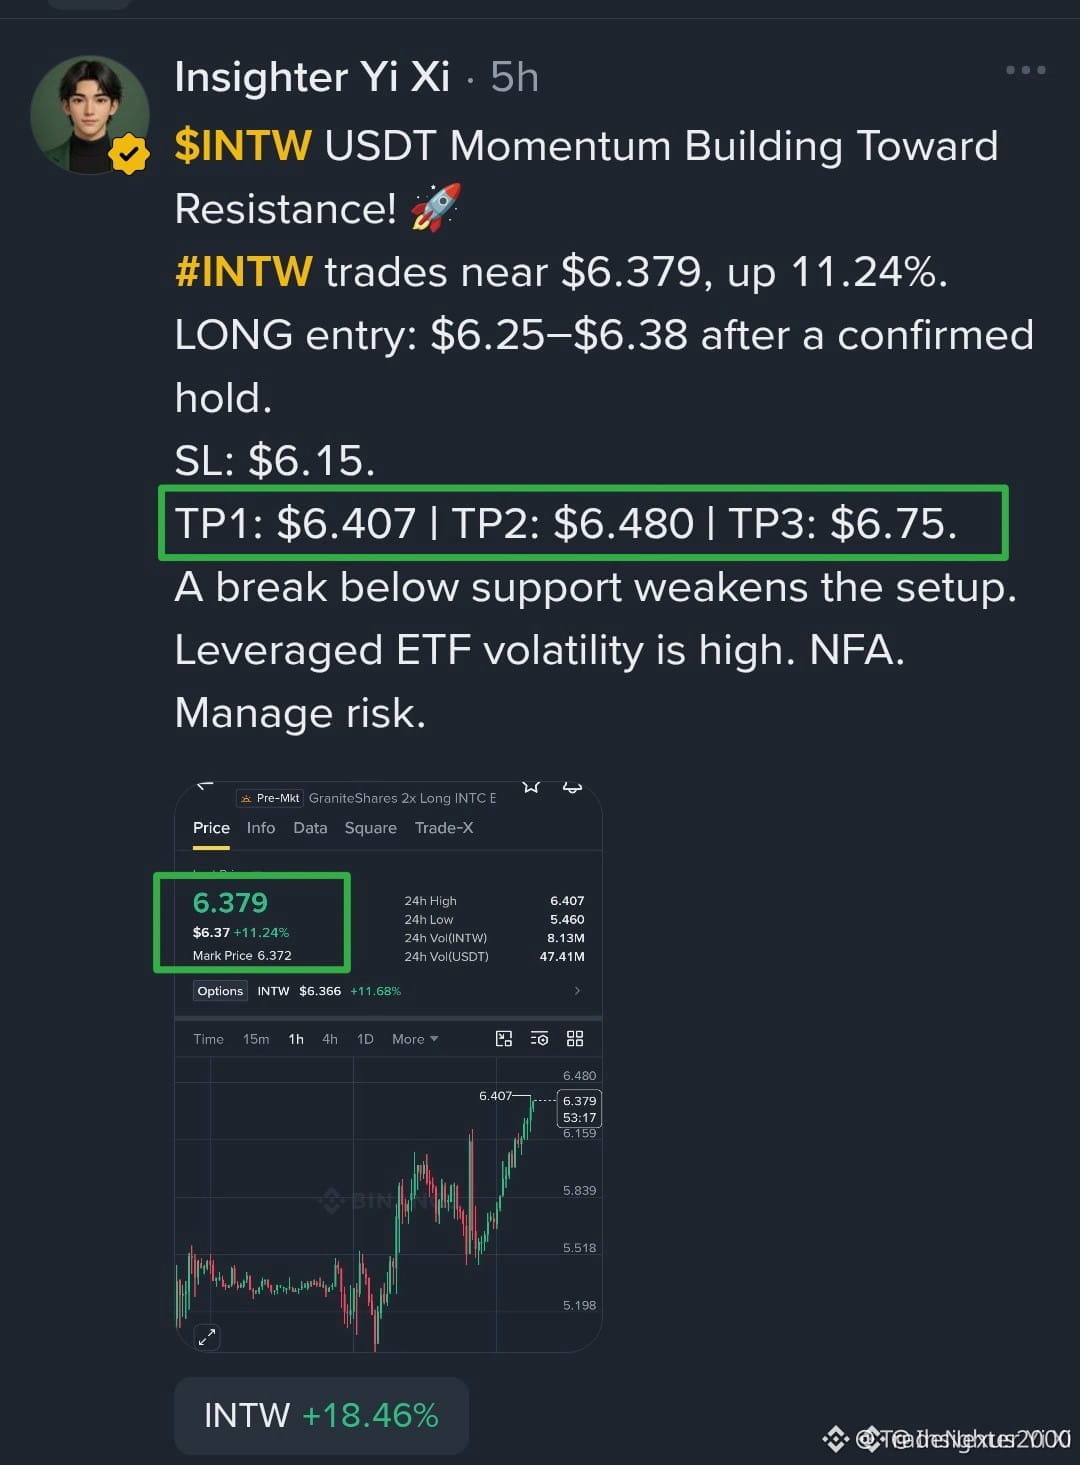
🚨 $INTW TARGETS OBLITERATED AS SMART MONEY MANIFESTS A TEXTBOOK EXPANSION! 💥
The recent price action on $INTW proved that mapping institutional footprints and liquidity pools yields precise results. 📊 Buyers decisively stepped into the premium imbalance zone, completely neutralizing late-stage seller pressure. ⚡
Watching these structured expansion phases validate our directional bias reinforces the power of reading order flow correctly. 💡 When structural resistance gives way under high volume, clean momentum follows. 🌊
💬 Are you locking in profits on this push or leaving a runner for the higher timeframe continuation? 👇
⚠️ Not financial advice. Always manage your risk. 🛡️
🏷️ #INTW #SmartMoney #PriceAction #Crypto #Trading
🔥 💎
🚨 $INTW TARGETS OBLITERATED AS SMART MONEY MANIFESTS A TEXTBOOK EXPANSION! 💥
The recent price action on $INTW proved that mapping institutional footprints and liquidity pools yields precise results. 📊 Buyers decisively stepped into the premium imbalance zone, completely neutralizing late-stage seller pressure. ⚡
Watching these structured expansion phases validate our directional bias reinforces the power of reading order flow correctly. 💡 When structural resistance gives way under high volume, clean momentum follows. 🌊
💬 Are you locking in profits on this push or leaving a runner for the higher timeframe continuation? 👇
⚠️ Not financial advice. Always manage your risk. 🛡️
🏷️ #INTW #SmartMoney #PriceAction #Crypto #Trading
🔥 💎
The recent price action on $INTW proved that mapping institutional footprints and liquidity pools yields precise results. 📊 Buyers decisively stepped into the premium imbalance zone, completely neutralizing late-stage seller pressure. ⚡
Watching these structured expansion phases validate our directional bias reinforces the power of reading order flow correctly. 💡 When structural resistance gives way under high volume, clean momentum follows. 🌊
💬 Are you locking in profits on this push or leaving a runner for the higher timeframe continuation? 👇
⚠️ Not financial advice. Always manage your risk. 🛡️
🏷️ #INTW #SmartMoney #PriceAction #Crypto #Trading
🔥 💎
12
·
--
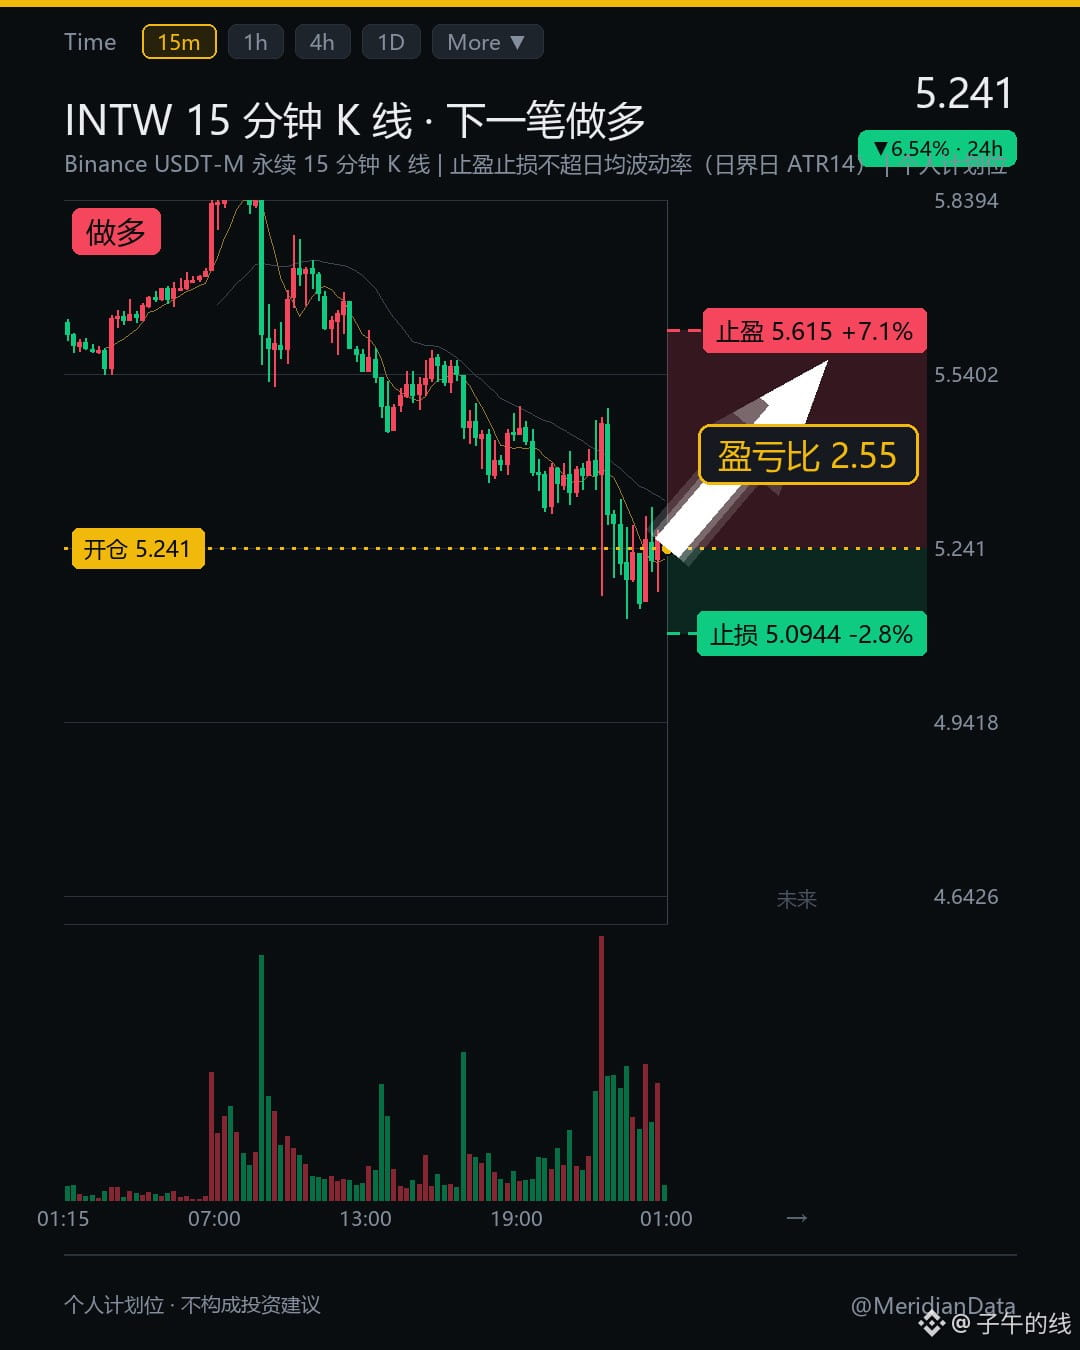
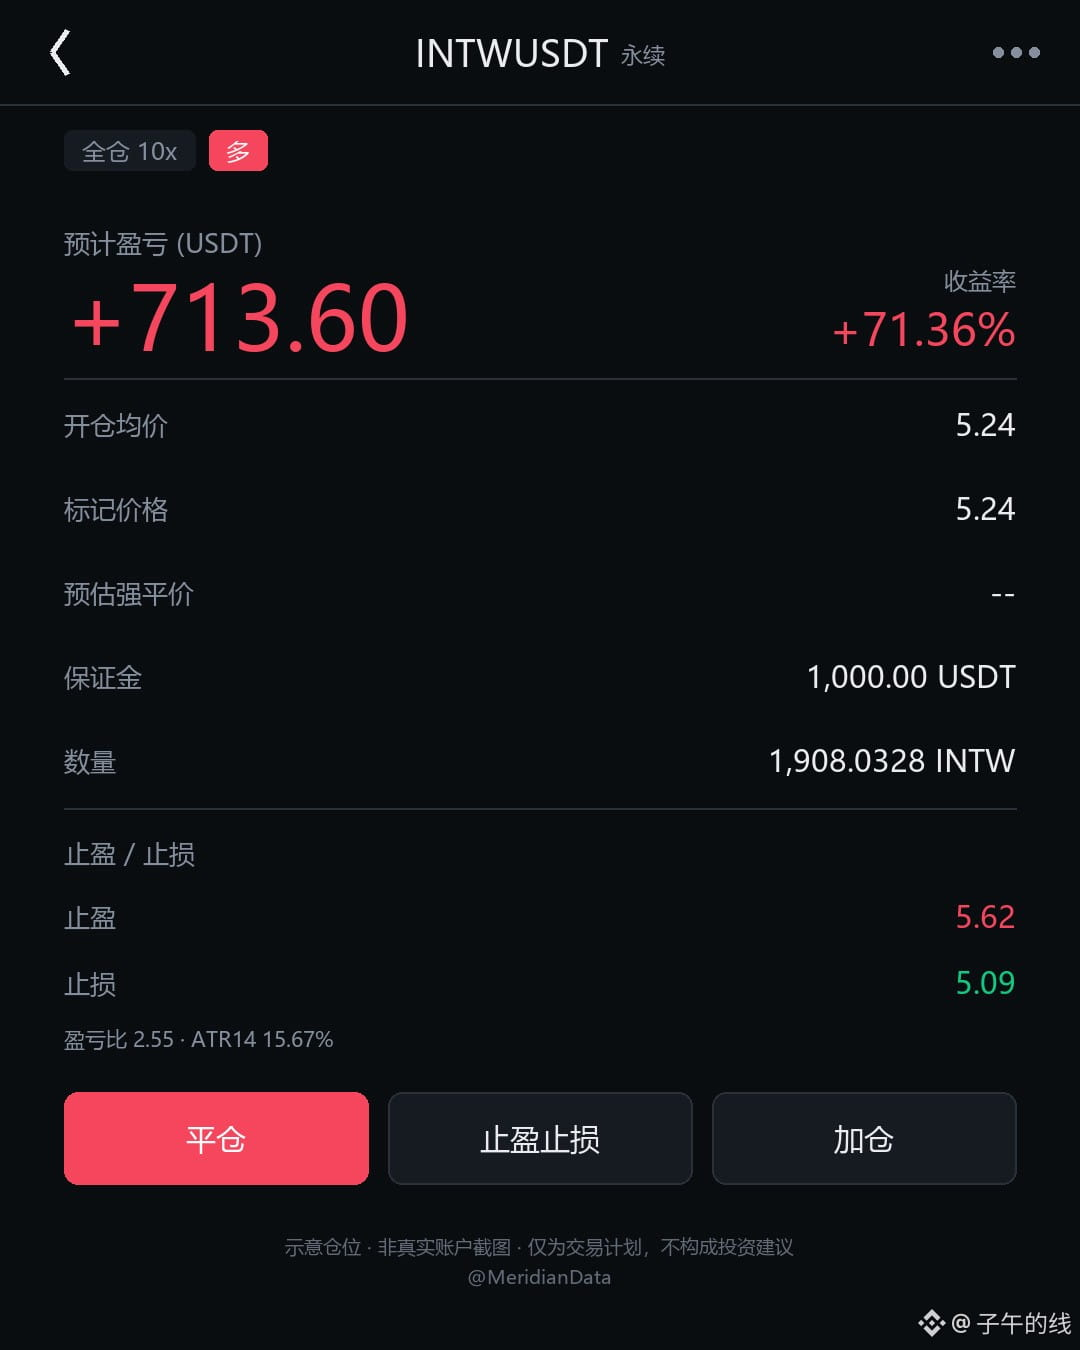
$INTW This long position—here are the levels I’ve set for everyone.
Take profit: 5.615
Stop loss: 5.0944
👇
{future}(INTWUSDT)
You’re probably wondering: why go long here on a token that’s dropped 20%?
First, the price level. The 15-minute candle closed at 5.241. The 20-day range is 4.32 to 19.36,
so the current price is only at the 6.1st percentile—right near the floor.
It’s been hammered down from higher levels for seven days. Most of the holders who were going to cut their losses have probably already done so. Those still holding aren’t willing to let go at this price. What I’m seeing is selling pressure gradually drying up.
At first glance, I thought this was just a pause before another leg down. But after checking twice, I changed my mind: volume hasn’t increased, and the downward momentum is fading.
I’m not chasing a rally here. I’m betting that the bears will have to cover. It’s like a reservoir running nearly dry: the lower the water level, the greater the bounce from even a small refill.
The take-profit is 7.14% from the current price, based on the smaller of the 12-hour countertrend extreme and the average daily volatility. The stop-loss is 2.80% away,
with a small buffer beyond the 6-hour extreme. Average daily volatility is 15.67%, and both levels are within that range.
That’s the positioning discipline I stick to. The risk/reward ratio is about 2.55, which is enough for me to take the trade.
Honestly, with tokens at such low percentiles, I’m not betting on a reversal—I’m betting that the selling pressure will run its course. The market is only so big; whoever’s closest to the pot gets served first. Once the price reaches this level, fresh demand will naturally come in to buy.
$BNB $TRX
What do you think of this trade? Let’s talk in the comments.
#INTW #BNB #Cryptocurrency
The above is a record of my personal trading system and observations of market data, and does not constitute investment advice.
$INTW This long position—here are the levels I’ve set for everyone.
Take profit: 5.615
Stop loss: 5.0944
👇
You’re probably wondering: why go long here on a token that’s dropped 20%?
First, the price level. The 15-minute candle closed at 5.241. The 20-day range is 4.32 to 19.36,
so the current price is only at the 6.1st percentile—right near the floor.
It’s been hammered down from higher levels for seven days. Most of the holders who were going to cut their losses have probably already done so. Those still holding aren’t willing to let go at this price. What I’m seeing is selling pressure gradually drying up.
At first glance, I thought this was just a pause before another leg down. But after checking twice, I changed my mind: volume hasn’t increased, and the downward momentum is fading.
I’m not chasing a rally here. I’m betting that the bears will have to cover. It’s like a reservoir running nearly dry: the lower the water level, the greater the bounce from even a small refill.
The take-profit is 7.14% from the current price, based on the smaller of the 12-hour countertrend extreme and the average daily volatility. The stop-loss is 2.80% away,
with a small buffer beyond the 6-hour extreme. Average daily volatility is 15.67%, and both levels are within that range.
That’s the positioning discipline I stick to. The risk/reward ratio is about 2.55, which is enough for me to take the trade.
Honestly, with tokens at such low percentiles, I’m not betting on a reversal—I’m betting that the selling pressure will run its course. The market is only so big; whoever’s closest to the pot gets served first. Once the price reaches this level, fresh demand will naturally come in to buy.
$BNB $TRX
What do you think of this trade? Let’s talk in the comments.
#INTW #BNB #Cryptocurrency
The above is a record of my personal trading system and observations of market data, and does not constitute investment advice.
Take profit: 5.615
Stop loss: 5.0944
👇
You’re probably wondering: why go long here on a token that’s dropped 20%?
First, the price level. The 15-minute candle closed at 5.241. The 20-day range is 4.32 to 19.36,
so the current price is only at the 6.1st percentile—right near the floor.
It’s been hammered down from higher levels for seven days. Most of the holders who were going to cut their losses have probably already done so. Those still holding aren’t willing to let go at this price. What I’m seeing is selling pressure gradually drying up.
At first glance, I thought this was just a pause before another leg down. But after checking twice, I changed my mind: volume hasn’t increased, and the downward momentum is fading.
I’m not chasing a rally here. I’m betting that the bears will have to cover. It’s like a reservoir running nearly dry: the lower the water level, the greater the bounce from even a small refill.
The take-profit is 7.14% from the current price, based on the smaller of the 12-hour countertrend extreme and the average daily volatility. The stop-loss is 2.80% away,
with a small buffer beyond the 6-hour extreme. Average daily volatility is 15.67%, and both levels are within that range.
That’s the positioning discipline I stick to. The risk/reward ratio is about 2.55, which is enough for me to take the trade.
Honestly, with tokens at such low percentiles, I’m not betting on a reversal—I’m betting that the selling pressure will run its course. The market is only so big; whoever’s closest to the pot gets served first. Once the price reaches this level, fresh demand will naturally come in to buy.
$BNB $TRX
What do you think of this trade? Let’s talk in the comments.
#INTW #BNB #Cryptocurrency
The above is a record of my personal trading system and observations of market data, and does not constitute investment advice.
21
·
--
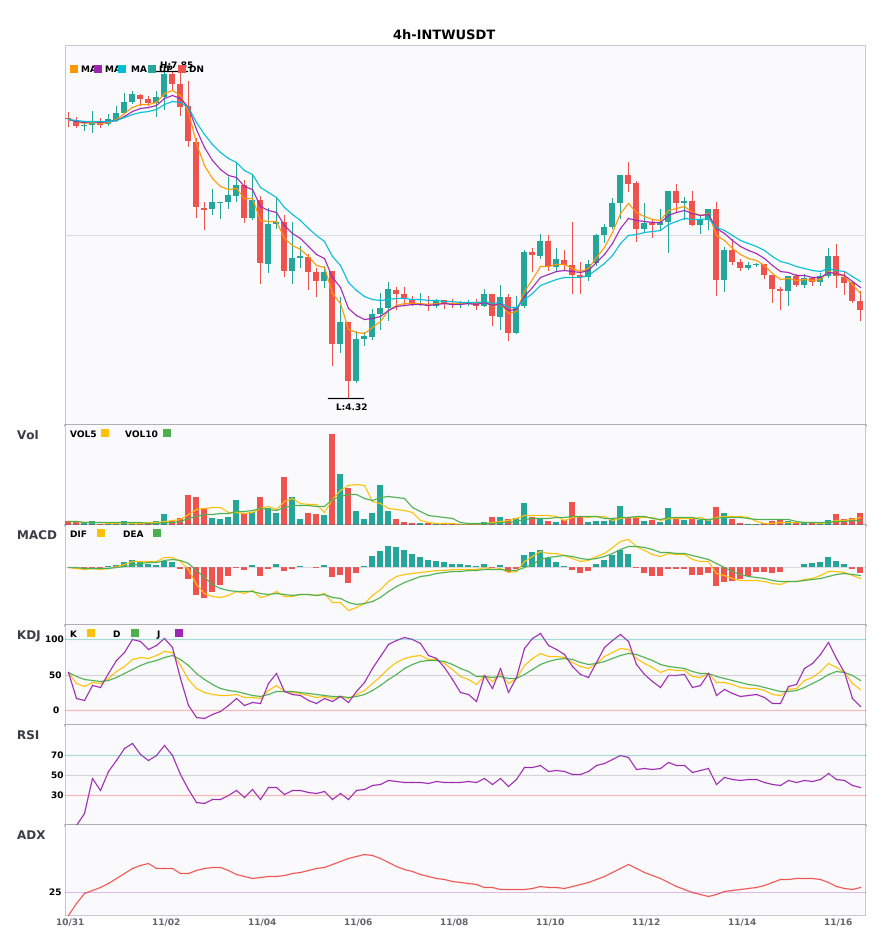
$INTW 4-hour daily moving averages are in a bearish alignment. Short-selling warning—don’t stubbornly hold on 🔥
════════════════════
🟢 $INTW 4-hour bearish signal
⚠️ Technical analysis: Daily and 4-hour charts confirm a bearish confluence: MACD bearish crossover with expanding green bars; moving averages are bearishly aligned and diverging downward; KDJ K has crossed below D but is not oversold; volume is expanding normally.
════════════════════
🔔 Follow for the latest market movements 🔔
#多周期共振 #INTW
📌 When trading, watch for whether the candlestick pattern confirms the setup
$INTW 4-hour daily moving averages are in a bearish alignment. Short-selling warning—don’t stubbornly hold on 🔥
════════════════════
🟢 $INTW 4-hour bearish signal
⚠️ Technical analysis: Daily and 4-hour charts confirm a bearish confluence: MACD bearish crossover with expanding green bars; moving averages are bearishly aligned and diverging downward; KDJ K has crossed below D but is not oversold; volume is expanding normally.
════════════════════
🔔 Follow for the latest market movements 🔔
#多周期共振 #INTW
📌 When trading, watch for whether the candlestick pattern confirms the setup
════════════════════
🟢 $INTW 4-hour bearish signal
⚠️ Technical analysis: Daily and 4-hour charts confirm a bearish confluence: MACD bearish crossover with expanding green bars; moving averages are bearishly aligned and diverging downward; KDJ K has crossed below D but is not oversold; volume is expanding normally.
════════════════════
🔔 Follow for the latest market movements 🔔
#多周期共振 #INTW
📌 When trading, watch for whether the candlestick pattern confirms the setup
9
·
--
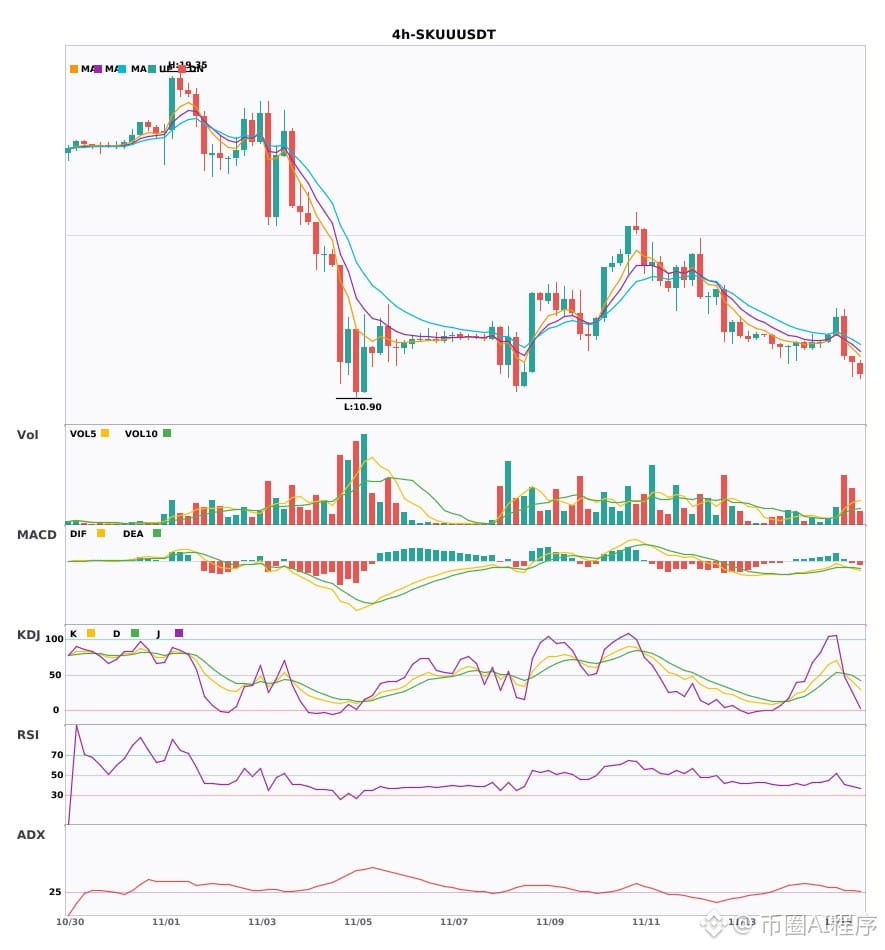
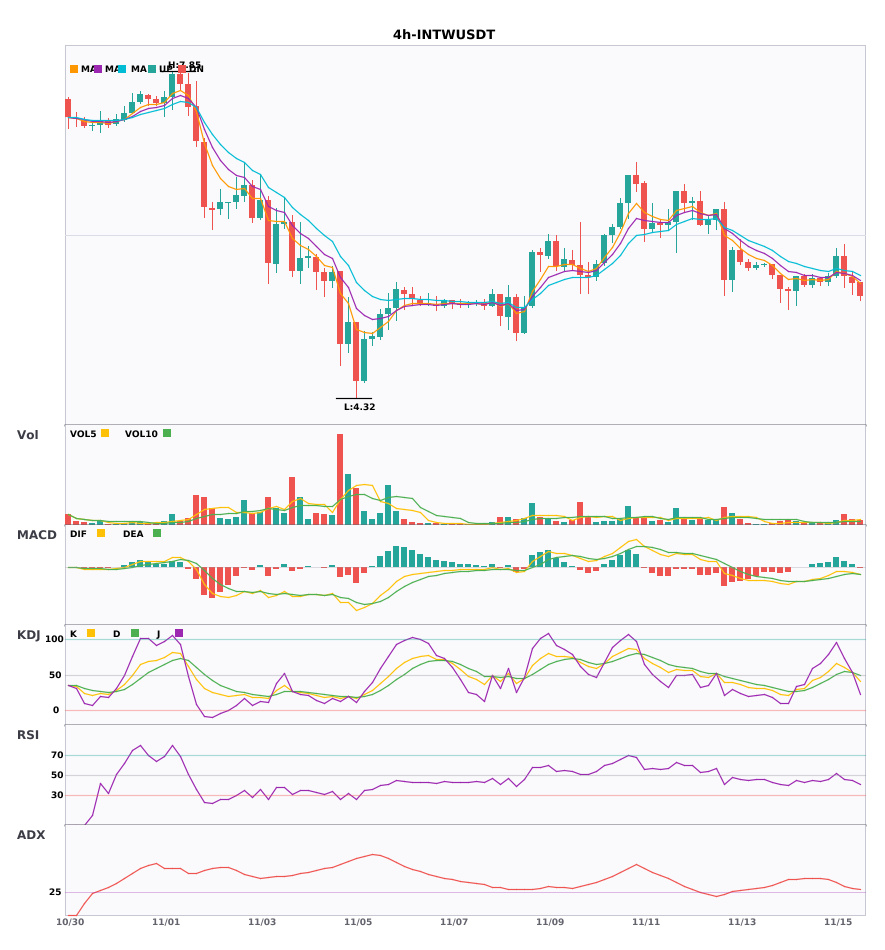
$SKUU / $INTW : 4-hour and daily charts both signal short; multi-timeframe confluence turns bearish 🔥
════════════════════
🟢 $SKUU 4-hour bearish signal
⚠️Technical analysis: After the 4-hour MACD death cross, the green bars are expanding. The moving averages are bearishly aligned and diverging downward. KDJ K has crossed below D but is not oversold. Volume has increased 3.8-fold, and the daily bearish confluence is confirmed. Short.
════════════════════
🟢 $INTW 4-hour bearish signal
⚠️Technical analysis: Daily and 4-hour charts show confluence for a short. On the 4-hour chart, EMA5 has crossed below EMA8, turning bearish. KDJ has formed a death cross but is not oversold. Volume has increased 3.1-fold. Follow the trend and look for further downside.
════════════════════
🔔 Follow for first-hand market updates 🔔
#多周期共振 #SKUU #INTW
📌 When trading, pay attention to whether the candlestick pattern confirms the signal
$SKUU / $INTW : 4-hour and daily charts both signal short; multi-timeframe confluence turns bearish 🔥
════════════════════
🟢 $SKUU 4-hour bearish signal
⚠️Technical analysis: After the 4-hour MACD death cross, the green bars are expanding. The moving averages are bearishly aligned and diverging downward. KDJ K has crossed below D but is not oversold. Volume has increased 3.8-fold, and the daily bearish confluence is confirmed. Short.
════════════════════
🟢 $INTW 4-hour bearish signal
⚠️Technical analysis: Daily and 4-hour charts show confluence for a short. On the 4-hour chart, EMA5 has crossed below EMA8, turning bearish. KDJ has formed a death cross but is not oversold. Volume has increased 3.1-fold. Follow the trend and look for further downside.
════════════════════
🔔 Follow for first-hand market updates 🔔
#多周期共振 #SKUU #INTW
📌 When trading, pay attention to whether the candlestick pattern confirms the signal
════════════════════
🟢 $SKUU 4-hour bearish signal
⚠️Technical analysis: After the 4-hour MACD death cross, the green bars are expanding. The moving averages are bearishly aligned and diverging downward. KDJ K has crossed below D but is not oversold. Volume has increased 3.8-fold, and the daily bearish confluence is confirmed. Short.
════════════════════
🟢 $INTW 4-hour bearish signal
⚠️Technical analysis: Daily and 4-hour charts show confluence for a short. On the 4-hour chart, EMA5 has crossed below EMA8, turning bearish. KDJ has formed a death cross but is not oversold. Volume has increased 3.1-fold. Follow the trend and look for further downside.
════════════════════
🔔 Follow for first-hand market updates 🔔
#多周期共振 #SKUU #INTW
📌 When trading, pay attention to whether the candlestick pattern confirms the signal
9
·
--
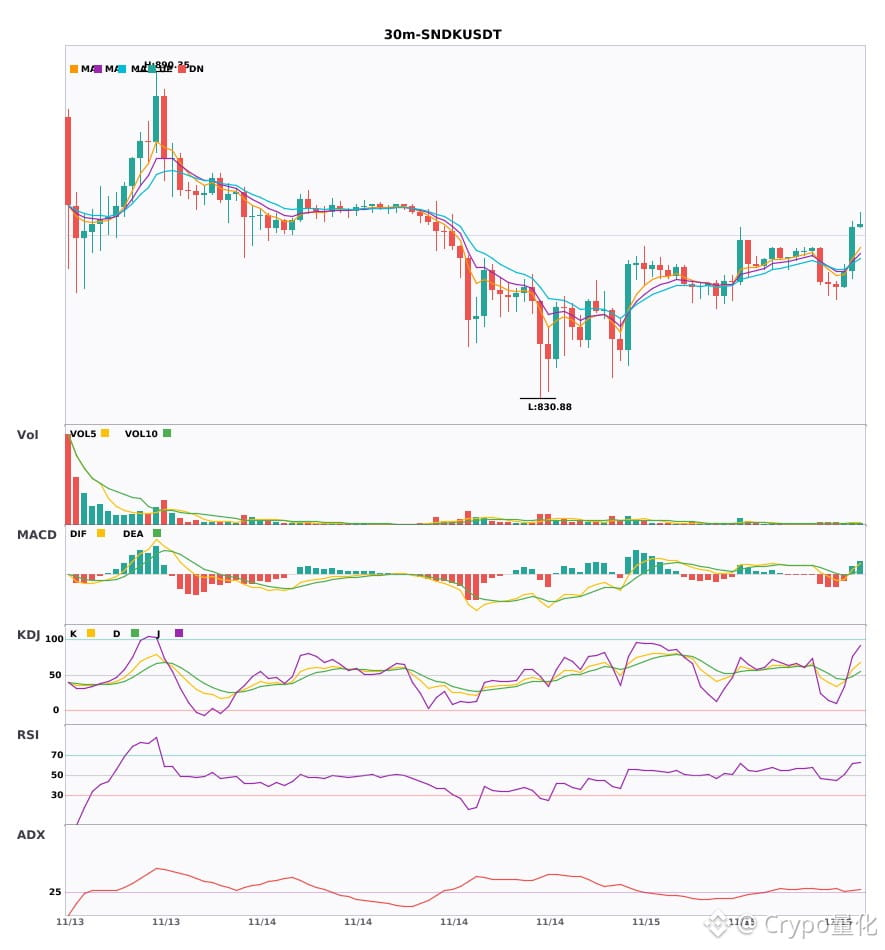
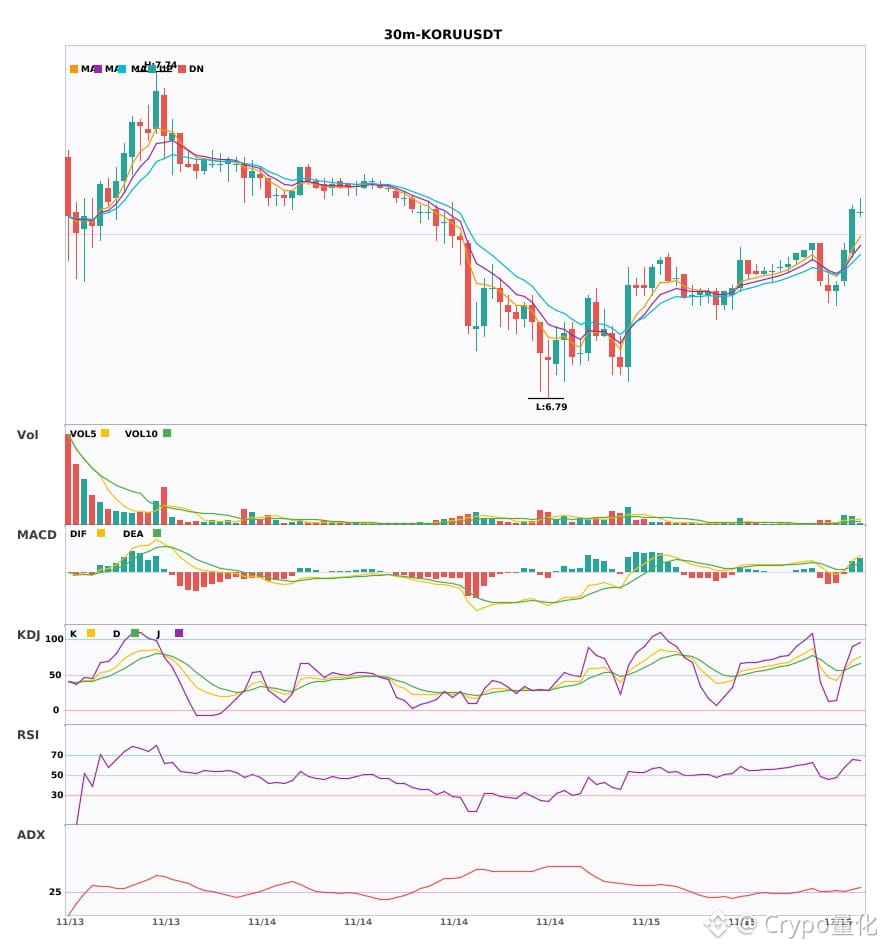
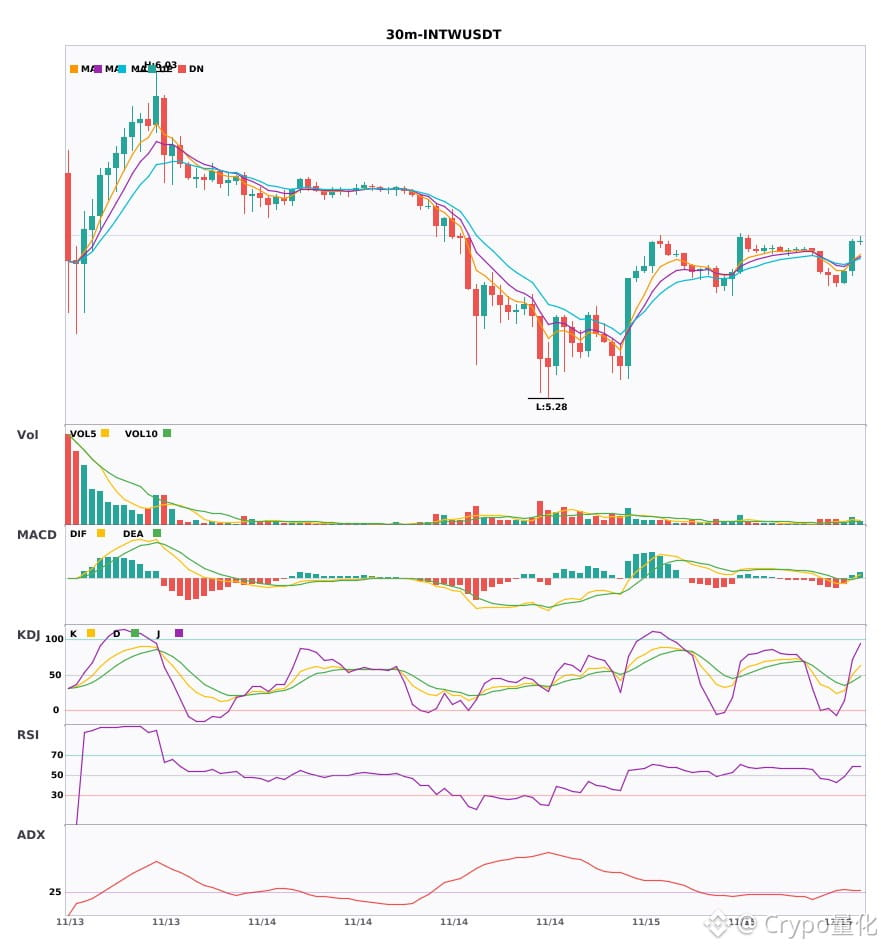
$SNDK $KORU $INTW 30-minute golden-cross confluence turns bullish 🔥
════════════════════
🔴 $SNDK 30-minute bullish signal
⚠️Technical: ADX at 31, trend is clear. MACD golden cross above zero, with expanding red bars. Moving averages have crossed bullishly. K has crossed above D on the KDJ without entering overbought territory. Volume has increased 2-fold.
════════════════════
🔴 $KORU 30-minute bullish signal
⚠️Technical: ADX trend is established and offers an opportunity to participate. MACD has broken above the zero line, turning bullish. Short-term moving averages have just crossed upward. KDJ golden cross, not overbought—bullish outlook. Trading volume has increased 3.5-fold.
════════════════════
🔴 $INTW 30-minute bullish signal
⚠️Technical: ADX is now at 31, and the trend is quite clear. After the MACD golden cross above zero, the red bars continue to expand, showing bulls are gaining strength. EMA5 has just crossed above EMA8, indicating a short-term bullish bias. On KDJ, K has crossed above D and is not yet overbought. Volume has increased 2.4-fold.
════════════════════
🔔 Follow to get real-time market movements first 🔔
#技术分析 #SNDK #KORU #INTW
📌 When trading, pay attention to whether the candlestick pattern confirms the setup
$SNDK $KORU $INTW 30-minute golden-cross confluence turns bullish 🔥
════════════════════
🔴 $SNDK 30-minute bullish signal
⚠️Technical: ADX at 31, trend is clear. MACD golden cross above zero, with expanding red bars. Moving averages have crossed bullishly. K has crossed above D on the KDJ without entering overbought territory. Volume has increased 2-fold.
════════════════════
🔴 $KORU 30-minute bullish signal
⚠️Technical: ADX trend is established and offers an opportunity to participate. MACD has broken above the zero line, turning bullish. Short-term moving averages have just crossed upward. KDJ golden cross, not overbought—bullish outlook. Trading volume has increased 3.5-fold.
════════════════════
🔴 $INTW 30-minute bullish signal
⚠️Technical: ADX is now at 31, and the trend is quite clear. After the MACD golden cross above zero, the red bars continue to expand, showing bulls are gaining strength. EMA5 has just crossed above EMA8, indicating a short-term bullish bias. On KDJ, K has crossed above D and is not yet overbought. Volume has increased 2.4-fold.
════════════════════
🔔 Follow to get real-time market movements first 🔔
#技术分析 #SNDK #KORU #INTW
📌 When trading, pay attention to whether the candlestick pattern confirms the setup
════════════════════
🔴 $SNDK 30-minute bullish signal
⚠️Technical: ADX at 31, trend is clear. MACD golden cross above zero, with expanding red bars. Moving averages have crossed bullishly. K has crossed above D on the KDJ without entering overbought territory. Volume has increased 2-fold.
════════════════════
🔴 $KORU 30-minute bullish signal
⚠️Technical: ADX trend is established and offers an opportunity to participate. MACD has broken above the zero line, turning bullish. Short-term moving averages have just crossed upward. KDJ golden cross, not overbought—bullish outlook. Trading volume has increased 3.5-fold.
════════════════════
🔴 $INTW 30-minute bullish signal
⚠️Technical: ADX is now at 31, and the trend is quite clear. After the MACD golden cross above zero, the red bars continue to expand, showing bulls are gaining strength. EMA5 has just crossed above EMA8, indicating a short-term bullish bias. On KDJ, K has crossed above D and is not yet overbought. Volume has increased 2.4-fold.
════════════════════
🔔 Follow to get real-time market movements first 🔔
#技术分析 #SNDK #KORU #INTW
📌 When trading, pay attention to whether the candlestick pattern confirms the setup
37

·
--
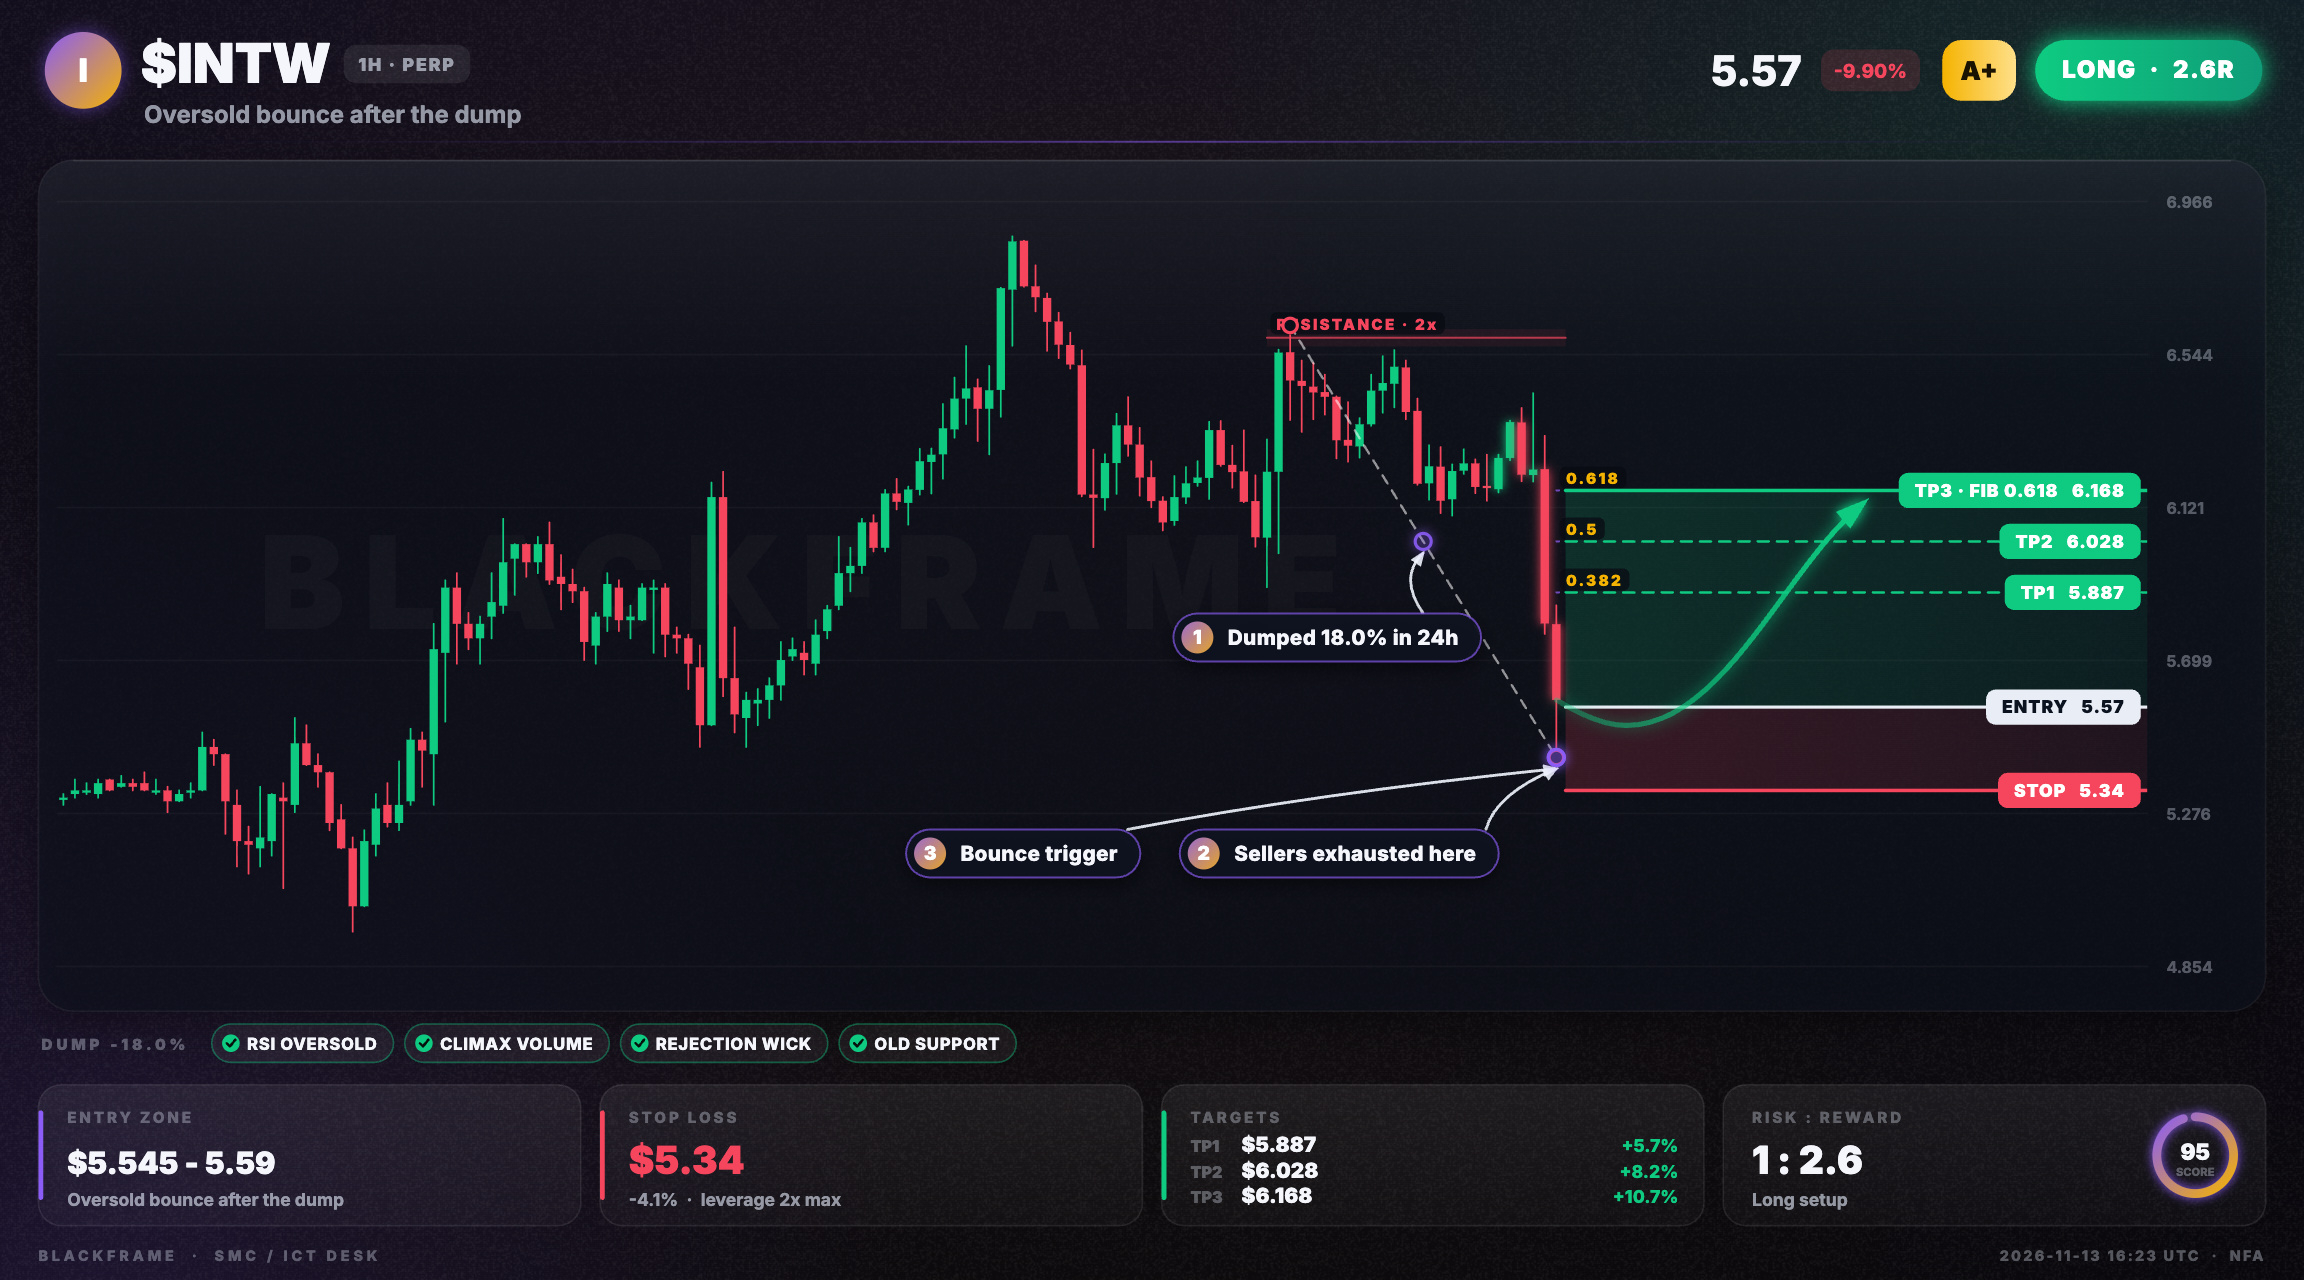
🩸 $INTW dumped -18.0%. Sellers look exhausted
LONG · 1H
Entry: $5.545 - $5.59
TP1: $5.887
TP2: $6.028
TP3: $6.168
SL: $5.34
$INTW dumped -18.0% in the last 24 hours. RSI is deeply oversold on the 1H, volume hit a climax at the extreme and a strong rejection wick formed at the lows. Entry is on the first 15M strength, targets are the 0.382, 0.5 and 0.618 retracements of the dump.
#INTW #Futures · NFA
🩸 $INTW dumped -18.0%. Sellers look exhausted
LONG · 1H
Entry: $5.545 - $5.59
TP1: $5.887
TP2: $6.028
TP3: $6.168
SL: $5.34
$INTW dumped -18.0% in the last 24 hours. RSI is deeply oversold on the 1H, volume hit a climax at the extreme and a strong rejection wick formed at the lows. Entry is on the first 15M strength, targets are the 0.382, 0.5 and 0.618 retracements of the dump.
#INTW #Futures · NFA
LONG · 1H
Entry: $5.545 - $5.59
TP1: $5.887
TP2: $6.028
TP3: $6.168
SL: $5.34
$INTW dumped -18.0% in the last 24 hours. RSI is deeply oversold on the 1H, volume hit a climax at the extreme and a strong rejection wick formed at the lows. Entry is on the first 15M strength, targets are the 0.382, 0.5 and 0.618 retracements of the dump.
#INTW #Futures · NFA
50
Log in to explore more content
Join global crypto users on Binance Square
⚡️ Get latest and useful information about crypto.
💬 Trusted by the world’s largest crypto exchange.
👍 Discover real insights from verified creators.
Email / Phone number
Trending Topics
1
#BitcoinCorePatchesAIDiscoveredVulnerability
7 views
28 Discussing
2
#CanBTCReboundAfterFallingBelow60K?
448,740 views
1,944 Discussing
3
#GlobalStocksFaceLongestLosingStreakSince2023
152,117 views
1,350 Discussing
4
#BlackRockIBITPostsRecord$541MSingleDayOutflow
5,295 views
42 Discussing
5
#AnthropicPlungesTowardIPOPriceonDay2
73,269 views
758 Discussing
6
#TwentyOneCapitalAdds172.25BTC
23,984 views
299 Discussing
7
#HKBillWouldExcludeTokenizedDepositsFromVirtualAssets
2,671 views
31 Discussing
8
#BNBDropsBelow540USDTWith8.46%DailyDecline
42,673 views
371 Discussing
9
#HKBillProposesHK$100KFineForUnauthorizedCryptoTitles
1,500 views
20 Discussing
10
#BitMineFaces$10.1BUnrealizedETHLoss
2,750 views
25 Discussing