
#kda
kda
1.4M views
1,935 Discussing
Hot
Latest

A +17% bounce means nothing when the weekly chart is still carving lower lows. That 24h pump is a blip inside a 48-hour bleed that printed 11 red candles out of 12, including a 35% single-session collapse.
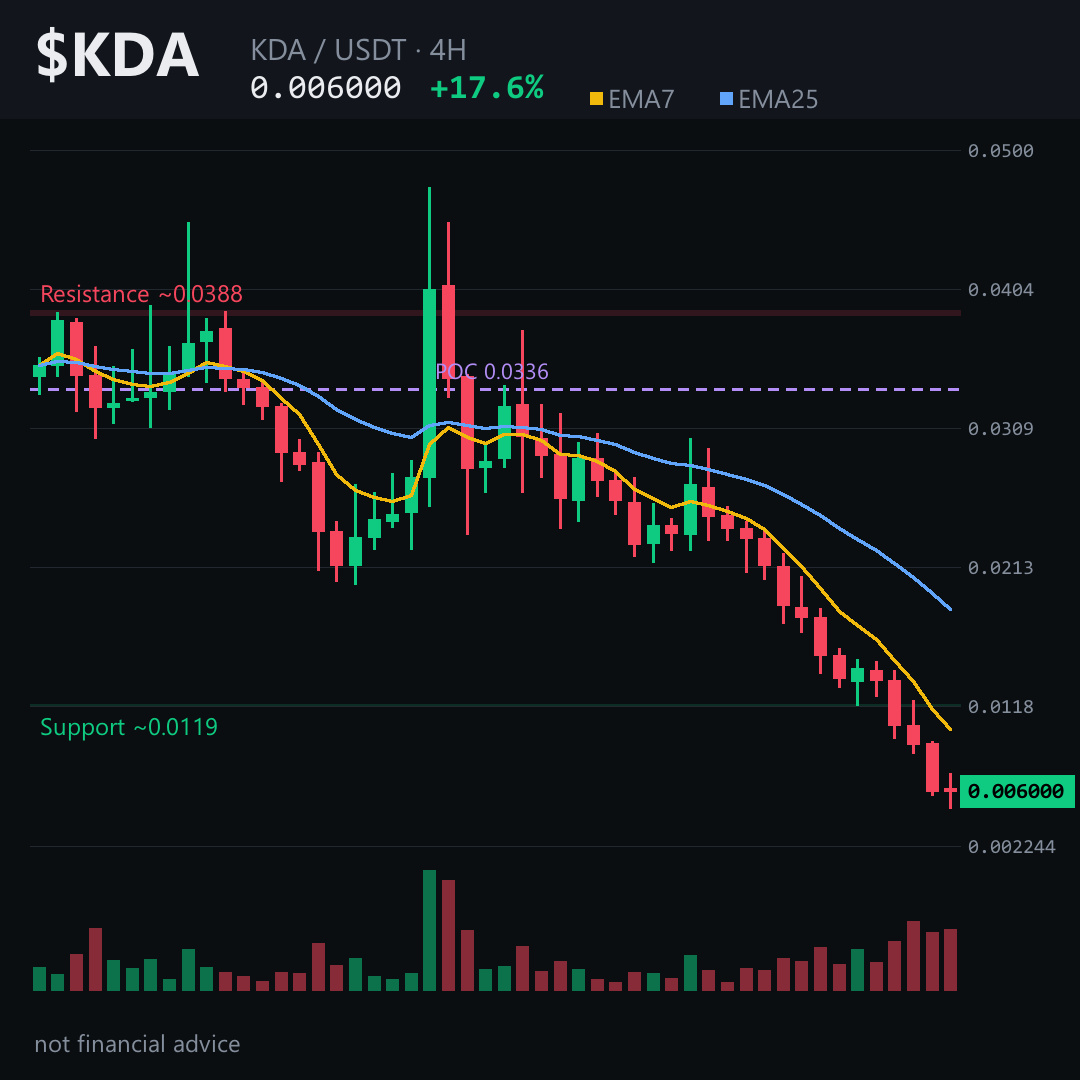
Price sits near 0.0060. RSI on the 4H is buried at 23, daily below 17 — that’s not “oversold and ready to rip,” that’s freefall. Oversold can stay oversold for weeks. The 4H EMAs tell the story: short-term average is barely half the longer one. Trend is down. Hard.
The 1D chart shows the real damage. That bearish gap between roughly 0.0158 and 0.0217 is unfilled — and price is nowhere near it. For $KDA to even think about recovery, it needs to reclaim that entire zone. That’s a 160% climb from here. Not a bounce. A miracle.
As long as price stays under the 0.0063 area on a closing basis, the path of least resistance points lower toward 0.0055, then the macro objective near 0.0038. Lose those and 0.0038 becomes the last line before true capitulation. Reclaim 0.0063 with volume and the read changes — but nothing about this structure suggests that’s likely.
This is a falling knife with a fresh coat of paint. The bounce is real, but weak — risk remains firmly to the downside.
Tap $KDA and pull up the daily yourself. That unfilled gap is the only thing that matters until price proves otherwise.
Follow me — I’ll keep this level on watch and update if 0.0063 flips or fails. What’s the one level you’re watching on $KDA right now? 👇
Not financial advice. DYOR.
#KDA #Kadena #Crypto #BinanceSquare
A +17% bounce means nothing when the weekly chart is still carving lower lows. That 24h pump is a blip inside a 48-hour bleed that printed 11 red candles out of 12, including a 35% single-session collapse.
Price sits near 0.0060. RSI on the 4H is buried at 23, daily below 17 — that’s not “oversold and ready to rip,” that’s freefall. Oversold can stay oversold for weeks. The 4H EMAs tell the story: short-term average is barely half the longer one. Trend is down. Hard.
The 1D chart shows the real damage. That bearish gap between roughly 0.0158 and 0.0217 is unfilled — and price is nowhere near it. For $KDA to even think about recovery, it needs to reclaim that entire zone. That’s a 160% climb from here. Not a bounce. A miracle.
As long as price stays under the 0.0063 area on a closing basis, the path of least resistance points lower toward 0.0055, then the macro objective near 0.0038. Lose those and 0.0038 becomes the last line before true capitulation. Reclaim 0.0063 with volume and the read changes — but nothing about this structure suggests that’s likely.
This is a falling knife with a fresh coat of paint. The bounce is real, but weak — risk remains firmly to the downside.
Tap $KDA and pull up the daily yourself. That unfilled gap is the only thing that matters until price proves otherwise.
Follow me — I’ll keep this level on watch and update if 0.0063 flips or fails. What’s the one level you’re watching on $KDA right now? 👇
Not financial advice. DYOR.
#KDA #Kadena #Crypto #BinanceSquare
Price sits near 0.0060. RSI on the 4H is buried at 23, daily below 17 — that’s not “oversold and ready to rip,” that’s freefall. Oversold can stay oversold for weeks. The 4H EMAs tell the story: short-term average is barely half the longer one. Trend is down. Hard.
The 1D chart shows the real damage. That bearish gap between roughly 0.0158 and 0.0217 is unfilled — and price is nowhere near it. For $KDA to even think about recovery, it needs to reclaim that entire zone. That’s a 160% climb from here. Not a bounce. A miracle.
As long as price stays under the 0.0063 area on a closing basis, the path of least resistance points lower toward 0.0055, then the macro objective near 0.0038. Lose those and 0.0038 becomes the last line before true capitulation. Reclaim 0.0063 with volume and the read changes — but nothing about this structure suggests that’s likely.
This is a falling knife with a fresh coat of paint. The bounce is real, but weak — risk remains firmly to the downside.
Tap $KDA and pull up the daily yourself. That unfilled gap is the only thing that matters until price proves otherwise.
Follow me — I’ll keep this level on watch and update if 0.0063 flips or fails. What’s the one level you’re watching on $KDA right now? 👇
Not financial advice. DYOR.
#KDA #Kadena #Crypto #BinanceSquare
7
Everyone sees "+17.65% Top Gainer" and thinks $KDA is reviving.
Flip it: this is a dead-cat bounce inside a 35% single-candle collapse.
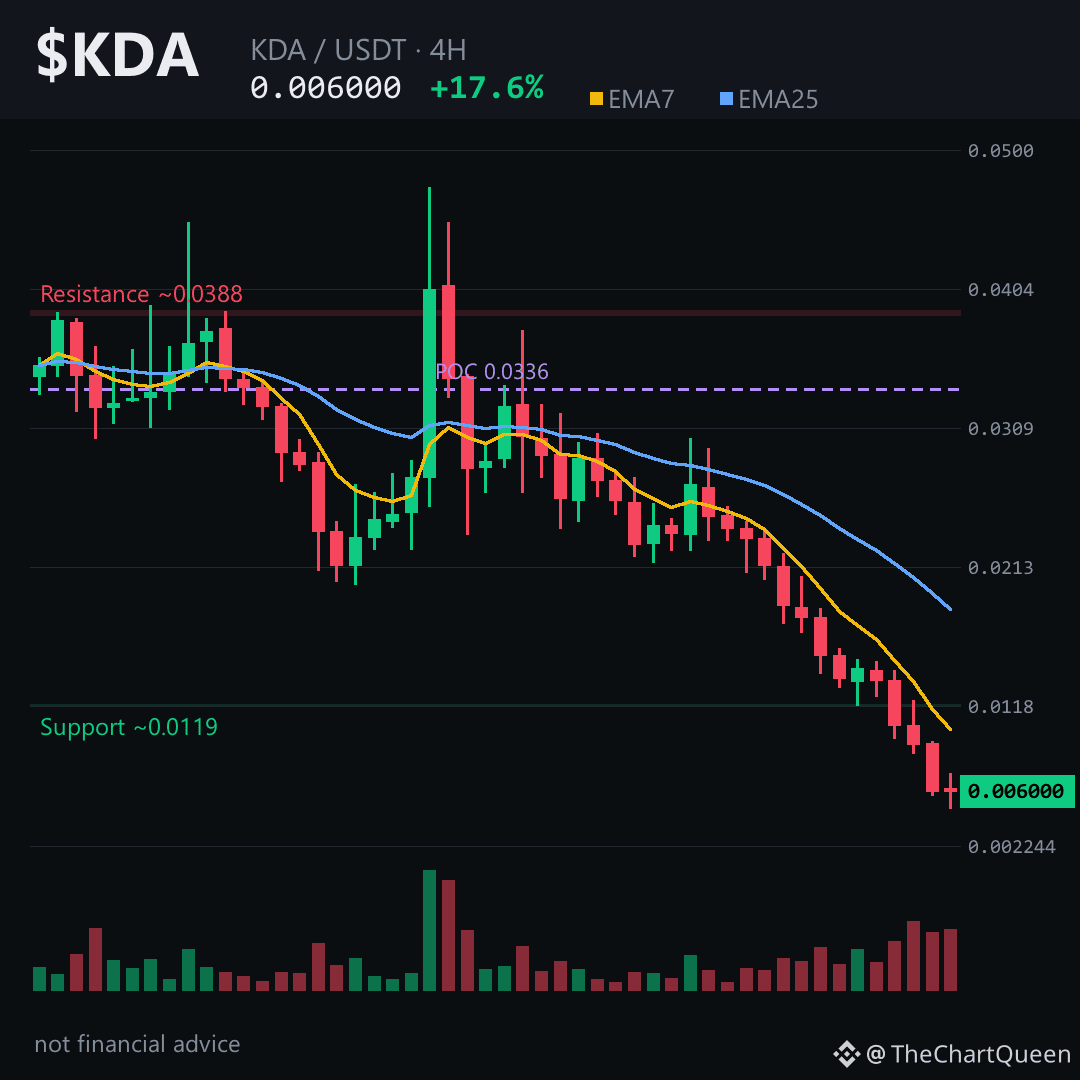
The 4H chart shows 11 red candles out of 12. Price printed a brutal -35.48% candle, then bounced from 0.0048 to 0.0060. That's air, not strength.
RSI sits at 23 — deeply oversold, but oversold in a downtrend is a condition, not a signal.
The real tell: an unfilled bearish gap lingers between 0.0094 and 0.0096. Any bounce toward it likely gets faded.
Here's the level that matters 👇
If $KDA loses ~0.0055 on a 4H close, the next objective sits near 0.0038. Invalidation: a decisive 4H close back above ~0.0063.
Tap $KDA to pull up the chart and read these levels yourself.
My read: the bounce is real but fragile. Path of least resistance remains lower until price holds above 0.0063 with volume.
Follow me for the follow-up if this level breaks or fails — I'll map the next zone.
What level are you watching on KDA right now? 👇
⚠️ Not financial advice. DYOR.
#KDA #Kadena #Crypto #BinanceSquare
Everyone sees "+17.65% Top Gainer" and thinks $KDA is reviving.
Flip it: this is a dead-cat bounce inside a 35% single-candle collapse.
The 4H chart shows 11 red candles out of 12. Price printed a brutal -35.48% candle, then bounced from 0.0048 to 0.0060. That's air, not strength.
RSI sits at 23 — deeply oversold, but oversold in a downtrend is a condition, not a signal.
The real tell: an unfilled bearish gap lingers between 0.0094 and 0.0096. Any bounce toward it likely gets faded.
Here's the level that matters 👇
If $KDA loses ~0.0055 on a 4H close, the next objective sits near 0.0038. Invalidation: a decisive 4H close back above ~0.0063.
Tap $KDA to pull up the chart and read these levels yourself.
My read: the bounce is real but fragile. Path of least resistance remains lower until price holds above 0.0063 with volume.
Follow me for the follow-up if this level breaks or fails — I'll map the next zone.
What level are you watching on KDA right now? 👇
⚠️ Not financial advice. DYOR.
#KDA #Kadena #Crypto #BinanceSquare
Flip it: this is a dead-cat bounce inside a 35% single-candle collapse.
The 4H chart shows 11 red candles out of 12. Price printed a brutal -35.48% candle, then bounced from 0.0048 to 0.0060. That's air, not strength.
RSI sits at 23 — deeply oversold, but oversold in a downtrend is a condition, not a signal.
The real tell: an unfilled bearish gap lingers between 0.0094 and 0.0096. Any bounce toward it likely gets faded.
Here's the level that matters 👇
If $KDA loses ~0.0055 on a 4H close, the next objective sits near 0.0038. Invalidation: a decisive 4H close back above ~0.0063.
Tap $KDA to pull up the chart and read these levels yourself.
My read: the bounce is real but fragile. Path of least resistance remains lower until price holds above 0.0063 with volume.
Follow me for the follow-up if this level breaks or fails — I'll map the next zone.
What level are you watching on KDA right now? 👇
⚠️ Not financial advice. DYOR.
#KDA #Kadena #Crypto #BinanceSquare
5
$0.024 to $0.006 in 48 hours — and it’s still flashing “Top Gainer” today. That’s the trap.
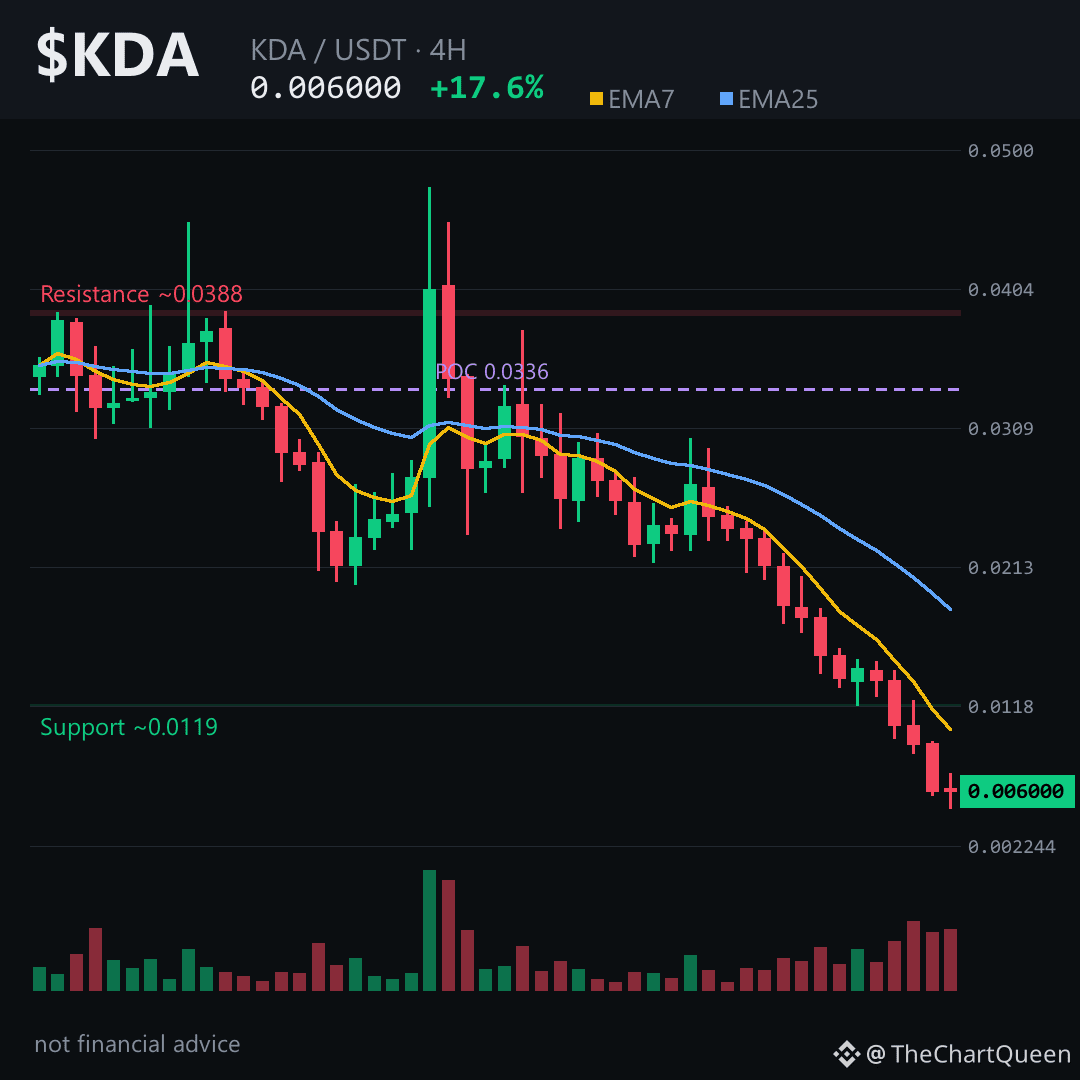
Price is up 17%, but the structure is a falling knife in a bear flag. Volume profile’s point of control sits far above — most recent volume is trapped higher, not supporting this bounce. RSI on the 4H near 23 is often a continuation signal in a downtrend, not a reversal.
The 4H setup is the cleanest read. Price is coiling just above 0.006, and the invalidation sits only a hair higher around 0.0063. If that zone holds as resistance, the path points toward the 0.0055 area — the next liquidity pocket. Lose that, and the unfilled gap lower near 0.0094–0.0096 becomes the magnet. The bounce is real, but it’s fighting a weekly downtrend with no fuel for a squeeze — open interest is flat.
My read: $KDA is in a relief bounce inside a larger breakdown, not a reversal. Tap $KDA to pull up the chart and watch how price behaves around the 0.0063 zone — that’s the line that separates a dead-cat bounce from something more.
Which level are you watching closer — 0.0063 resistance or the 0.0055 support? Drop your read on $KDA 👇
Follow for the next read on this chart.
⚠️ Not financial advice. DYOR.
#KDA #Kadena #Crypto #BinanceSquare
$0.024 to $0.006 in 48 hours — and it’s still flashing “Top Gainer” today. That’s the trap.
Price is up 17%, but the structure is a falling knife in a bear flag. Volume profile’s point of control sits far above — most recent volume is trapped higher, not supporting this bounce. RSI on the 4H near 23 is often a continuation signal in a downtrend, not a reversal.
The 4H setup is the cleanest read. Price is coiling just above 0.006, and the invalidation sits only a hair higher around 0.0063. If that zone holds as resistance, the path points toward the 0.0055 area — the next liquidity pocket. Lose that, and the unfilled gap lower near 0.0094–0.0096 becomes the magnet. The bounce is real, but it’s fighting a weekly downtrend with no fuel for a squeeze — open interest is flat.
My read: $KDA is in a relief bounce inside a larger breakdown, not a reversal. Tap $KDA to pull up the chart and watch how price behaves around the 0.0063 zone — that’s the line that separates a dead-cat bounce from something more.
Which level are you watching closer — 0.0063 resistance or the 0.0055 support? Drop your read on $KDA 👇
Follow for the next read on this chart.
⚠️ Not financial advice. DYOR.
#KDA #Kadena #Crypto #BinanceSquare
Price is up 17%, but the structure is a falling knife in a bear flag. Volume profile’s point of control sits far above — most recent volume is trapped higher, not supporting this bounce. RSI on the 4H near 23 is often a continuation signal in a downtrend, not a reversal.
The 4H setup is the cleanest read. Price is coiling just above 0.006, and the invalidation sits only a hair higher around 0.0063. If that zone holds as resistance, the path points toward the 0.0055 area — the next liquidity pocket. Lose that, and the unfilled gap lower near 0.0094–0.0096 becomes the magnet. The bounce is real, but it’s fighting a weekly downtrend with no fuel for a squeeze — open interest is flat.
My read: $KDA is in a relief bounce inside a larger breakdown, not a reversal. Tap $KDA to pull up the chart and watch how price behaves around the 0.0063 zone — that’s the line that separates a dead-cat bounce from something more.
Which level are you watching closer — 0.0063 resistance or the 0.0055 support? Drop your read on $KDA 👇
Follow for the next read on this chart.
⚠️ Not financial advice. DYOR.
#KDA #Kadena #Crypto #BinanceSquare
6
Everyone sees "+17.65%" and thinks bottom.
The chart says the opposite — that green number is just a dead cat stretching before the next leg down.
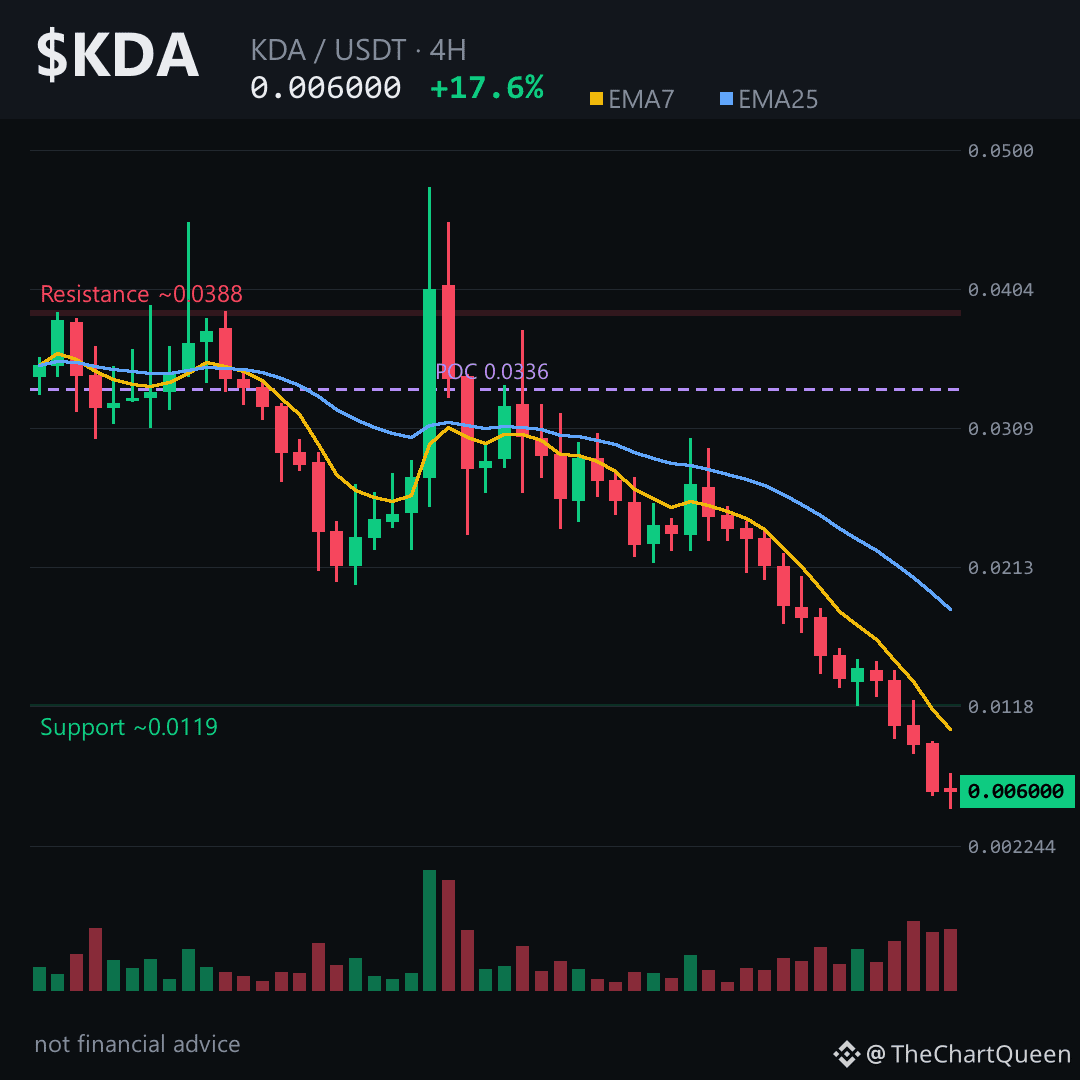
Price tagged 0.0048, bounced to 0.006 — but this is a bear flag on life support. RSI near 23 on a coin in freefall isn't "oversold bounce," it's momentum still bleeding out. 11 red candles out of the last 12, including a -35% monster just hours ago.
As long as $KDA stays below 0.0063, the path of least resistance is lower — toward 0.0055, then a sweep of that 0.0048 low.
Lose 0.0048 on a 4H close and the next real support doesn't arrive until 0.0038.
The trap? That empty futures book — zero funding, zero open interest. The bounce you're seeing is thin air, not conviction.
My read: the bounce is a gift to sellers, not a reversal.
Tap $KDA to pull up the chart and see how clean that rejection from 0.0072 looks.
I'll keep an eye on whether 0.0048 holds or folds — follow so my next breakdown lands in your feed.
What level are you watching on $KDA right now 👇
⚠️ Not financial advice. DYOR.
#KDA #Kadena #Crypto #BinanceSquare
Everyone sees "+17.65%" and thinks bottom.
The chart says the opposite — that green number is just a dead cat stretching before the next leg down.
Price tagged 0.0048, bounced to 0.006 — but this is a bear flag on life support. RSI near 23 on a coin in freefall isn't "oversold bounce," it's momentum still bleeding out. 11 red candles out of the last 12, including a -35% monster just hours ago.
As long as $KDA stays below 0.0063, the path of least resistance is lower — toward 0.0055, then a sweep of that 0.0048 low.
Lose 0.0048 on a 4H close and the next real support doesn't arrive until 0.0038.
The trap? That empty futures book — zero funding, zero open interest. The bounce you're seeing is thin air, not conviction.
My read: the bounce is a gift to sellers, not a reversal.
Tap $KDA to pull up the chart and see how clean that rejection from 0.0072 looks.
I'll keep an eye on whether 0.0048 holds or folds — follow so my next breakdown lands in your feed.
What level are you watching on $KDA right now 👇
⚠️ Not financial advice. DYOR.
#KDA #Kadena #Crypto #BinanceSquare
The chart says the opposite — that green number is just a dead cat stretching before the next leg down.
Price tagged 0.0048, bounced to 0.006 — but this is a bear flag on life support. RSI near 23 on a coin in freefall isn't "oversold bounce," it's momentum still bleeding out. 11 red candles out of the last 12, including a -35% monster just hours ago.
As long as $KDA stays below 0.0063, the path of least resistance is lower — toward 0.0055, then a sweep of that 0.0048 low.
Lose 0.0048 on a 4H close and the next real support doesn't arrive until 0.0038.
The trap? That empty futures book — zero funding, zero open interest. The bounce you're seeing is thin air, not conviction.
My read: the bounce is a gift to sellers, not a reversal.
Tap $KDA to pull up the chart and see how clean that rejection from 0.0072 looks.
I'll keep an eye on whether 0.0048 holds or folds — follow so my next breakdown lands in your feed.
What level are you watching on $KDA right now 👇
⚠️ Not financial advice. DYOR.
#KDA #Kadena #Crypto #BinanceSquare
1
Why did a “Top Gainer” just print 11 red candles out of 12?
This +17% bounce is sitting inside a much bigger downtrend.
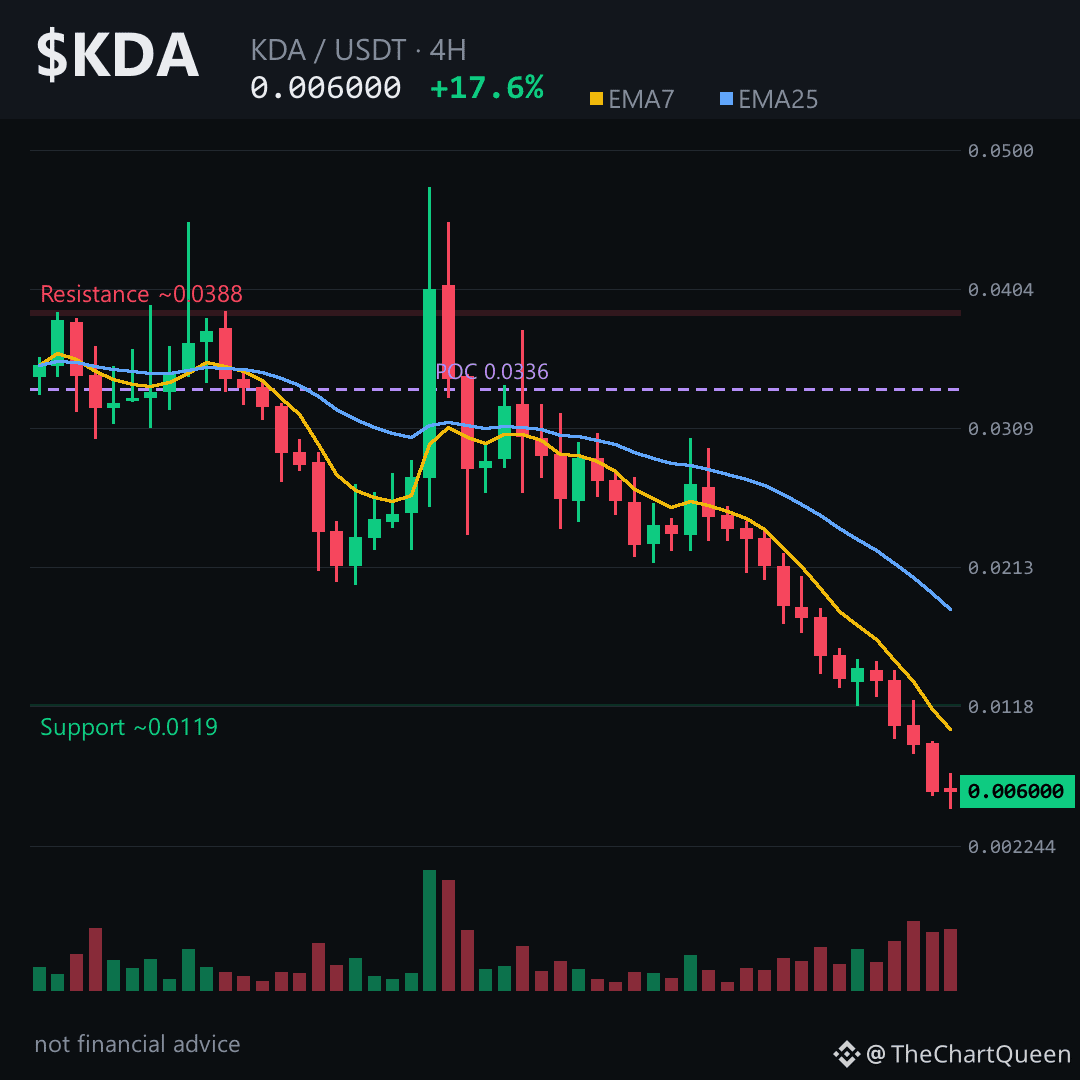
Price on the 4H sits near 0.0060, while the EMA7 is around 0.0102 — still far above. The bounce hasn’t even touched the first major resistance zone. RSI is deeply oversold near 23, but oversold can stay oversold longer than feels logical.
There’s also an unfilled bearish gap at 0.0094–0.0096. Gaps like that often act like a magnet, but from below, they can also act as a ceiling.
The level that matters most on the 4H: the 0.0063 area. If $KDA can’t reclaim and hold that zone, the path of least resistance stays lower — toward 0.0055. A 4H close above 0.0063 would be the first real sign this bounce has more fuel.
My read: weak relief bounce inside a heavy downtrend, not a reversal yet. The real risk is mistaking a short squeeze for a trend change.
Tap $KDA to pull up the chart and check these zones yourself.
Follow me — I’ll update this read if the 0.0063 area gets tested and tells us something new.
Which zone are you watching more closely on $KDA — the 0.0063 ceiling or the 0.0055 floor? 👇
⚠️ Not financial advice. DYOR.
#KDA #Kadena #Crypto #BinanceSquare
Why did a “Top Gainer” just print 11 red candles out of 12?
This +17% bounce is sitting inside a much bigger downtrend.
Price on the 4H sits near 0.0060, while the EMA7 is around 0.0102 — still far above. The bounce hasn’t even touched the first major resistance zone. RSI is deeply oversold near 23, but oversold can stay oversold longer than feels logical.
There’s also an unfilled bearish gap at 0.0094–0.0096. Gaps like that often act like a magnet, but from below, they can also act as a ceiling.
The level that matters most on the 4H: the 0.0063 area. If $KDA can’t reclaim and hold that zone, the path of least resistance stays lower — toward 0.0055. A 4H close above 0.0063 would be the first real sign this bounce has more fuel.
My read: weak relief bounce inside a heavy downtrend, not a reversal yet. The real risk is mistaking a short squeeze for a trend change.
Tap $KDA to pull up the chart and check these zones yourself.
Follow me — I’ll update this read if the 0.0063 area gets tested and tells us something new.
Which zone are you watching more closely on $KDA — the 0.0063 ceiling or the 0.0055 floor? 👇
⚠️ Not financial advice. DYOR.
#KDA #Kadena #Crypto #BinanceSquare
This +17% bounce is sitting inside a much bigger downtrend.
Price on the 4H sits near 0.0060, while the EMA7 is around 0.0102 — still far above. The bounce hasn’t even touched the first major resistance zone. RSI is deeply oversold near 23, but oversold can stay oversold longer than feels logical.
There’s also an unfilled bearish gap at 0.0094–0.0096. Gaps like that often act like a magnet, but from below, they can also act as a ceiling.
The level that matters most on the 4H: the 0.0063 area. If $KDA can’t reclaim and hold that zone, the path of least resistance stays lower — toward 0.0055. A 4H close above 0.0063 would be the first real sign this bounce has more fuel.
My read: weak relief bounce inside a heavy downtrend, not a reversal yet. The real risk is mistaking a short squeeze for a trend change.
Tap $KDA to pull up the chart and check these zones yourself.
Follow me — I’ll update this read if the 0.0063 area gets tested and tells us something new.
Which zone are you watching more closely on $KDA — the 0.0063 ceiling or the 0.0055 floor? 👇
⚠️ Not financial advice. DYOR.
#KDA #Kadena #Crypto #BinanceSquare
2

·
--
It’s the early session, and this $KDA candle has me itching to make a move—the U.S. session sent it straight from 0.00480000 to 0.00720000, and now it’s pulled back to 0.00600000. It’s still up +17.65% over 24 hours, but volume is only 344K. Do you think this is a real breakout or a fake pump? 👀
I’m leaning cautious: a 17.65% gain on 344K in volume looks more like an emotional afterglow from the U.S. session. It couldn’t hold the 0.00720000 high and dropped back, which suggests sellers are waiting above. If volume doesn’t pick up during the Asian session, 0.00600000 could easily turn into a choppy pit stop, and chasing the price here comes with plenty of risk. If I were looking to go long, I’d rather wait for a pullback and confirmation that it holds above 0.00480000 before making a move.
What do you think? Let’s talk in the comments. $KDA #KDA
It’s the early session, and this $KDA candle has me itching to make a move—the U.S. session sent it straight from 0.00480000 to 0.00720000, and now it’s pulled back to 0.00600000. It’s still up +17.65% over 24 hours, but volume is only 344K. Do you think this is a real breakout or a fake pump? 👀
I’m leaning cautious: a 17.65% gain on 344K in volume looks more like an emotional afterglow from the U.S. session. It couldn’t hold the 0.00720000 high and dropped back, which suggests sellers are waiting above. If volume doesn’t pick up during the Asian session, 0.00600000 could easily turn into a choppy pit stop, and chasing the price here comes with plenty of risk. If I were looking to go long, I’d rather wait for a pullback and confirmation that it holds above 0.00480000 before making a move.
What do you think? Let’s talk in the comments. $KDA #KDA
I’m leaning cautious: a 17.65% gain on 344K in volume looks more like an emotional afterglow from the U.S. session. It couldn’t hold the 0.00720000 high and dropped back, which suggests sellers are waiting above. If volume doesn’t pick up during the Asian session, 0.00600000 could easily turn into a choppy pit stop, and chasing the price here comes with plenty of risk. If I were looking to go long, I’d rather wait for a pullback and confirmation that it holds above 0.00480000 before making a move.
What do you think? Let’s talk in the comments. $KDA #KDA
1
Why is a “Top Gainer” trading at the same price it had 12 hours ago after a +17% pump?
That 24h range is a 50% spread, and the last 48 hours show 11 red candles against 1 green. The bounce is real, but it’s happening inside a much larger downtrend.
4H structure: short-term MA still below the longer one — classic bearish. RSI at 23 means deeply oversold, which is why you’re seeing this bounce. But oversold can stay oversold in a downtrend.
Price is hovering near 0.006. If it loses that zone, next meaningful support is around 0.0055 — that’s the next decision point. For the bearish read to be wrong, price needs to reclaim and hold above roughly 0.0063 on a 4H close. That’s the line that flips the script.
There’s also an unfilled bearish gap lower around 0.0096 to 0.0094. Gaps often act as magnets later, but not always immediately.
My read: the bounce is real but fragile. The risk isn’t a sudden crash — it’s that any strength gets sold back into this downtrend until the structure genuinely shifts.
Tap $KDA to pull up the chart and see these zones yourself. I’ll keep tracking whether that 0.006 area holds or folds — follow so you don’t miss the update.
Which zone are you watching more closely — 0.0055 or 0.0063 on $KDA? 👇
⚠️ Not financial advice. DYOR.
#KDA #Kadena #Crypto #BinanceSquare
Why is a “Top Gainer” trading at the same price it had 12 hours ago after a +17% pump?
That 24h range is a 50% spread, and the last 48 hours show 11 red candles against 1 green. The bounce is real, but it’s happening inside a much larger downtrend.
4H structure: short-term MA still below the longer one — classic bearish. RSI at 23 means deeply oversold, which is why you’re seeing this bounce. But oversold can stay oversold in a downtrend.
Price is hovering near 0.006. If it loses that zone, next meaningful support is around 0.0055 — that’s the next decision point. For the bearish read to be wrong, price needs to reclaim and hold above roughly 0.0063 on a 4H close. That’s the line that flips the script.
There’s also an unfilled bearish gap lower around 0.0096 to 0.0094. Gaps often act as magnets later, but not always immediately.
My read: the bounce is real but fragile. The risk isn’t a sudden crash — it’s that any strength gets sold back into this downtrend until the structure genuinely shifts.
Tap $KDA to pull up the chart and see these zones yourself. I’ll keep tracking whether that 0.006 area holds or folds — follow so you don’t miss the update.
Which zone are you watching more closely — 0.0055 or 0.0063 on $KDA? 👇
⚠️ Not financial advice. DYOR.
#KDA #Kadena #Crypto #BinanceSquare
That 24h range is a 50% spread, and the last 48 hours show 11 red candles against 1 green. The bounce is real, but it’s happening inside a much larger downtrend.
4H structure: short-term MA still below the longer one — classic bearish. RSI at 23 means deeply oversold, which is why you’re seeing this bounce. But oversold can stay oversold in a downtrend.
Price is hovering near 0.006. If it loses that zone, next meaningful support is around 0.0055 — that’s the next decision point. For the bearish read to be wrong, price needs to reclaim and hold above roughly 0.0063 on a 4H close. That’s the line that flips the script.
There’s also an unfilled bearish gap lower around 0.0096 to 0.0094. Gaps often act as magnets later, but not always immediately.
My read: the bounce is real but fragile. The risk isn’t a sudden crash — it’s that any strength gets sold back into this downtrend until the structure genuinely shifts.
Tap $KDA to pull up the chart and see these zones yourself. I’ll keep tracking whether that 0.006 area holds or folds — follow so you don’t miss the update.
Which zone are you watching more closely — 0.0055 or 0.0063 on $KDA? 👇
⚠️ Not financial advice. DYOR.
#KDA #Kadena #Crypto #BinanceSquare
9

·
--
$KDA (Kadena) — Is Momentum Building?
$KDA is catching attention with a strong market move!
📈 Bullish momentum is getting noticed. Trading activity is worth watching. Buyers are watching the next resistance. A strong breakout could bring more attention.
But remember: confirmation is more important than chasing a pump.
What do you think? Can KDA continue its bullish move?
#KDA #Kadena #Crypto #BinanceSquare #Altcoins
$KDA (Kadena) — Is Momentum Building?
$KDA is catching attention with a strong market move!
📈 Bullish momentum is getting noticed. Trading activity is worth watching. Buyers are watching the next resistance. A strong breakout could bring more attention.
But remember: confirmation is more important than chasing a pump.
What do you think? Can KDA continue its bullish move?
#KDA #Kadena #Crypto #BinanceSquare #Altcoins
$KDA is catching attention with a strong market move!
📈 Bullish momentum is getting noticed. Trading activity is worth watching. Buyers are watching the next resistance. A strong breakout could bring more attention.
But remember: confirmation is more important than chasing a pump.
What do you think? Can KDA continue its bullish move?
#KDA #Kadena #Crypto #BinanceSquare #Altcoins

110
Everyone sees +17% and thinks $KDA is bouncing. They’re reading the headline, not the chart.
That green 4H candle is a corpse bounce inside an 11-of-12 red candle cascade. Price didn’t reclaim structure — it just paused at the bottom of a waterfall. And the daily picture is worse: price sits miles below both key averages, with momentum pinned near the floor. This is not accumulation. This is a falling knife taking a breath.
The 4H read is the cleanest: the pivot zone near 0.0060 is the only thing holding. Lose that on a 4H close and the next obvious destination is the unfilled gap below — the 0.0055 area, roughly where the last 35% collapse ran out of sellers. Invalidation sits just above, around 0.0063. If price can’t even reclaim that tiny ledge, the bounce is already over.
Tap $KDA to pull up the chart and see how thin this bounce really is.
My read: the +17% is noise inside a much larger downtrend. The risk isn’t missing the bottom — it’s mistaking a dead-cat twitch for a reversal.
If this zone fails, I’ll map the next support where liquidity actually sits. Follow so that read lands on your feed.
Which level are you trusting more on $KDA — the bounce zone or the gap below? 👇
⚠️ Not financial advice. DYOR.
#KDA #Kadena #Crypto #BinanceSquare
Everyone sees +17% and thinks $KDA is bouncing. They’re reading the headline, not the chart.
That green 4H candle is a corpse bounce inside an 11-of-12 red candle cascade. Price didn’t reclaim structure — it just paused at the bottom of a waterfall. And the daily picture is worse: price sits miles below both key averages, with momentum pinned near the floor. This is not accumulation. This is a falling knife taking a breath.
The 4H read is the cleanest: the pivot zone near 0.0060 is the only thing holding. Lose that on a 4H close and the next obvious destination is the unfilled gap below — the 0.0055 area, roughly where the last 35% collapse ran out of sellers. Invalidation sits just above, around 0.0063. If price can’t even reclaim that tiny ledge, the bounce is already over.
Tap $KDA to pull up the chart and see how thin this bounce really is.
My read: the +17% is noise inside a much larger downtrend. The risk isn’t missing the bottom — it’s mistaking a dead-cat twitch for a reversal.
If this zone fails, I’ll map the next support where liquidity actually sits. Follow so that read lands on your feed.
Which level are you trusting more on $KDA — the bounce zone or the gap below? 👇
⚠️ Not financial advice. DYOR.
#KDA #Kadena #Crypto #BinanceSquare
That green 4H candle is a corpse bounce inside an 11-of-12 red candle cascade. Price didn’t reclaim structure — it just paused at the bottom of a waterfall. And the daily picture is worse: price sits miles below both key averages, with momentum pinned near the floor. This is not accumulation. This is a falling knife taking a breath.
The 4H read is the cleanest: the pivot zone near 0.0060 is the only thing holding. Lose that on a 4H close and the next obvious destination is the unfilled gap below — the 0.0055 area, roughly where the last 35% collapse ran out of sellers. Invalidation sits just above, around 0.0063. If price can’t even reclaim that tiny ledge, the bounce is already over.
Tap $KDA to pull up the chart and see how thin this bounce really is.
My read: the +17% is noise inside a much larger downtrend. The risk isn’t missing the bottom — it’s mistaking a dead-cat twitch for a reversal.
If this zone fails, I’ll map the next support where liquidity actually sits. Follow so that read lands on your feed.
Which level are you trusting more on $KDA — the bounce zone or the gap below? 👇
⚠️ Not financial advice. DYOR.
#KDA #Kadena #Crypto #BinanceSquare
22
·
--
$KDA is currently at 0.00600000 USDT, up 17.65% over 24h. The intraday range ran from a low of 0.00480000 to a high of 0.00720000, a 50% swing—typical of a high-volume impulsive candlestick. The daily chart shows a solid bullish candle with upper and lower wicks. The upper wick reached 0.00720000 before being pushed back, indicating selling pressure at higher levels. However, the close held around 0.00600000, so the bulls have not given back all of their gains.
Looking at volume and price, 24h volume of 344K alongside a nearly 18% gain indicates rising price on rising volume, not a low-volume, unsupported rally. The price should now be above MA5 and approaching MA20, with signs of an MA5 crossover above MA20 strengthening. From a Bollinger Bands perspective, the price moved directly from the lower-band area to above the middle band, and the bands appear to be widening, indicating increased volatility.
Key levels: support around 0.00550000 (a pullback that holds here can be considered a strong consolidation); stronger support is the intraday low of 0.00480000. Resistance is the intraday high of 0.00720000; only a decisive breakout would open up further upside.
The short-term outlook leans bullish, but the area between 0.00600000 and 0.00720000 is dense with profit-taking, so chasing the price carries considerable risk. A safer approach would be to wait for a pullback to around 0.00550000 and enter after it stabilizes. A break below 0.00480000 would invalidate the bullish thesis, so exit. $KDA is a small-cap, highly volatile asset, so position sizing should come first.#KDA #Altcoins
$KDA is currently at 0.00600000 USDT, up 17.65% over 24h. The intraday range ran from a low of 0.00480000 to a high of 0.00720000, a 50% swing—typical of a high-volume impulsive candlestick. The daily chart shows a solid bullish candle with upper and lower wicks. The upper wick reached 0.00720000 before being pushed back, indicating selling pressure at higher levels. However, the close held around 0.00600000, so the bulls have not given back all of their gains.
Looking at volume and price, 24h volume of 344K alongside a nearly 18% gain indicates rising price on rising volume, not a low-volume, unsupported rally. The price should now be above MA5 and approaching MA20, with signs of an MA5 crossover above MA20 strengthening. From a Bollinger Bands perspective, the price moved directly from the lower-band area to above the middle band, and the bands appear to be widening, indicating increased volatility.
Key levels: support around 0.00550000 (a pullback that holds here can be considered a strong consolidation); stronger support is the intraday low of 0.00480000. Resistance is the intraday high of 0.00720000; only a decisive breakout would open up further upside.
The short-term outlook leans bullish, but the area between 0.00600000 and 0.00720000 is dense with profit-taking, so chasing the price carries considerable risk. A safer approach would be to wait for a pullback to around 0.00550000 and enter after it stabilizes. A break below 0.00480000 would invalidate the bullish thesis, so exit. $KDA is a small-cap, highly volatile asset, so position sizing should come first.#KDA #Altcoins
Looking at volume and price, 24h volume of 344K alongside a nearly 18% gain indicates rising price on rising volume, not a low-volume, unsupported rally. The price should now be above MA5 and approaching MA20, with signs of an MA5 crossover above MA20 strengthening. From a Bollinger Bands perspective, the price moved directly from the lower-band area to above the middle band, and the bands appear to be widening, indicating increased volatility.
Key levels: support around 0.00550000 (a pullback that holds here can be considered a strong consolidation); stronger support is the intraday low of 0.00480000. Resistance is the intraday high of 0.00720000; only a decisive breakout would open up further upside.
The short-term outlook leans bullish, but the area between 0.00600000 and 0.00720000 is dense with profit-taking, so chasing the price carries considerable risk. A safer approach would be to wait for a pullback to around 0.00550000 and enter after it stabilizes. A break below 0.00480000 would invalidate the bullish thesis, so exit. $KDA is a small-cap, highly volatile asset, so position sizing should come first.#KDA #Altcoins
3
The 0.00633 barrier is the line in the sand for $KDA — once it cracks, the downside story flips. 👀
Price is hugging the 4‑hour pivot, EMA7 is well under EMA25, and RSI sits at 23 — deeply oversold but still bearish. A fresh unmitigated bearish gap sits just above the current price, suggesting the pressure isn’t done yet.
On the 4H chart the key zones are:
‑ Pivot around 0.0060, the current trading area.
‑ Invalidating zone just above ≈ 0.00633; if $KDA loses that level the bearish premise collapses.
‑ Potential downside target near ≈ 0.0055 if the move stays on script.
My read: the chart is warning that a slip below the 0.00633 area could open a path toward the 0.0055 zone.
If you want to see these levels live, tap $KDA and pull up the chart.
Follow me for the next breakdown when KDA tests the next barrier – I’ll map the new shape as it unfolds. What level are you watching most closely on KDA? 👇
⚠️ Not financial advice. DYOR.
#KDA #Kadena #Crypto #BinanceSquare
The 0.00633 barrier is the line in the sand for $KDA — once it cracks, the downside story flips. 👀
Price is hugging the 4‑hour pivot, EMA7 is well under EMA25, and RSI sits at 23 — deeply oversold but still bearish. A fresh unmitigated bearish gap sits just above the current price, suggesting the pressure isn’t done yet.
On the 4H chart the key zones are:
‑ Pivot around 0.0060, the current trading area.
‑ Invalidating zone just above ≈ 0.00633; if $KDA loses that level the bearish premise collapses.
‑ Potential downside target near ≈ 0.0055 if the move stays on script.
My read: the chart is warning that a slip below the 0.00633 area could open a path toward the 0.0055 zone.
If you want to see these levels live, tap $KDA and pull up the chart.
Follow me for the next breakdown when KDA tests the next barrier – I’ll map the new shape as it unfolds. What level are you watching most closely on KDA? 👇
⚠️ Not financial advice. DYOR.
#KDA #Kadena #Crypto #BinanceSquare
Price is hugging the 4‑hour pivot, EMA7 is well under EMA25, and RSI sits at 23 — deeply oversold but still bearish. A fresh unmitigated bearish gap sits just above the current price, suggesting the pressure isn’t done yet.
On the 4H chart the key zones are:
‑ Pivot around 0.0060, the current trading area.
‑ Invalidating zone just above ≈ 0.00633; if $KDA loses that level the bearish premise collapses.
‑ Potential downside target near ≈ 0.0055 if the move stays on script.
My read: the chart is warning that a slip below the 0.00633 area could open a path toward the 0.0055 zone.
If you want to see these levels live, tap $KDA and pull up the chart.
Follow me for the next breakdown when KDA tests the next barrier – I’ll map the new shape as it unfolds. What level are you watching most closely on KDA? 👇
⚠️ Not financial advice. DYOR.
#KDA #Kadena #Crypto #BinanceSquare
25
·
--
Is this $KDA move a genuine breakout or a fake pump? 🤔 A quick look at the market at midday: $KDA is currently at 0.00600000 USDT, up 17.65% over 24 hours. It peaked at 0.00720000 and dipped to 0.00480000, with a trading volume of 344K. My take: the price climbed from a low of 0.00480000 to a high of 0.00720000, making for an intraday range of 50%. This kind of volatility looks more like concentrated short-term buying. The price has now pulled back to around 0.00600000, suggesting some traders are taking profits near the highs, so chasing the rally carries considerable risk. A volume of 344K isn't particularly strong given the size of the gain. A genuine breakout usually needs sustained volume to confirm it, so for now this looks more like a sentiment-driven spike. Whether it can hold above 0.00600000 is the key thing to watch. At this level, I’d rather watch than act and wait to see if it stabilizes after a pullback. What do you think? Let’s talk in the comments #KDA #Layer1 🚀
Is this $KDA move a genuine breakout or a fake pump? 🤔 A quick look at the market at midday: $KDA is currently at 0.00600000 USDT, up 17.65% over 24 hours. It peaked at 0.00720000 and dipped to 0.00480000, with a trading volume of 344K. My take: the price climbed from a low of 0.00480000 to a high of 0.00720000, making for an intraday range of 50%. This kind of volatility looks more like concentrated short-term buying. The price has now pulled back to around 0.00600000, suggesting some traders are taking profits near the highs, so chasing the rally carries considerable risk. A volume of 344K isn't particularly strong given the size of the gain. A genuine breakout usually needs sustained volume to confirm it, so for now this looks more like a sentiment-driven spike. Whether it can hold above 0.00600000 is the key thing to watch. At this level, I’d rather watch than act and wait to see if it stabilizes after a pullback. What do you think? Let’s talk in the comments #KDA #Layer1 🚀
5
A 35% single-candle collapse on the 4H. And the 24h change still reads +17%. That is not a recovery. That is a rug in slow motion.
Price is trading near 0.006, miles below the volume pocket around 0.033 and the daily point of control near 0.053. The entire profile above is now dead weight. Every bounce is being sold before it can breathe.
The 4H RSI is pinned near 23. On most coins that screams "oversold bounce." Here it just confirms velocity — this thing is falling faster than the indicators can reset. The EMA7 is less than half the EMA25. Trend is not just down. It is vertical.
The level that matters on the 4H is around 0.0063. That is where any short-term reversion attempt loses credibility. As long as $KDA stays below it, the path of least resistance points toward the low 0.005s — a zone that has already been tested once in the last 24 hours and barely held.
The only thing missing from this collapse is leverage. Funding is flat at zero and open interest is basically nonexistent. That means no short squeeze fuel, no liquidation cascade to reverse the move. Just organic abandonment. Futures traders have already left the building.
My read: this is a falling knife with no crowd to catch it. The 4H close below 0.006 would be another structural break, not a signal. Real risk lives in trying to catch a bottom that has no volume behind it.
I watch this level until it either reclaims 0.0063 or loses 0.0054 — follow me and I’ll keep the read updated as the 4H prints.
What level on $KDA are you watching most closely right now 👇
Not financial advice. DYOR.
#KDA #Kadena #Crypto #BinanceSquare
A 35% single-candle collapse on the 4H. And the 24h change still reads +17%. That is not a recovery. That is a rug in slow motion.
Price is trading near 0.006, miles below the volume pocket around 0.033 and the daily point of control near 0.053. The entire profile above is now dead weight. Every bounce is being sold before it can breathe.
The 4H RSI is pinned near 23. On most coins that screams "oversold bounce." Here it just confirms velocity — this thing is falling faster than the indicators can reset. The EMA7 is less than half the EMA25. Trend is not just down. It is vertical.
The level that matters on the 4H is around 0.0063. That is where any short-term reversion attempt loses credibility. As long as $KDA stays below it, the path of least resistance points toward the low 0.005s — a zone that has already been tested once in the last 24 hours and barely held.
The only thing missing from this collapse is leverage. Funding is flat at zero and open interest is basically nonexistent. That means no short squeeze fuel, no liquidation cascade to reverse the move. Just organic abandonment. Futures traders have already left the building.
My read: this is a falling knife with no crowd to catch it. The 4H close below 0.006 would be another structural break, not a signal. Real risk lives in trying to catch a bottom that has no volume behind it.
I watch this level until it either reclaims 0.0063 or loses 0.0054 — follow me and I’ll keep the read updated as the 4H prints.
What level on $KDA are you watching most closely right now 👇
Not financial advice. DYOR.
#KDA #Kadena #Crypto #BinanceSquare
Price is trading near 0.006, miles below the volume pocket around 0.033 and the daily point of control near 0.053. The entire profile above is now dead weight. Every bounce is being sold before it can breathe.
The 4H RSI is pinned near 23. On most coins that screams "oversold bounce." Here it just confirms velocity — this thing is falling faster than the indicators can reset. The EMA7 is less than half the EMA25. Trend is not just down. It is vertical.
The level that matters on the 4H is around 0.0063. That is where any short-term reversion attempt loses credibility. As long as $KDA stays below it, the path of least resistance points toward the low 0.005s — a zone that has already been tested once in the last 24 hours and barely held.
The only thing missing from this collapse is leverage. Funding is flat at zero and open interest is basically nonexistent. That means no short squeeze fuel, no liquidation cascade to reverse the move. Just organic abandonment. Futures traders have already left the building.
My read: this is a falling knife with no crowd to catch it. The 4H close below 0.006 would be another structural break, not a signal. Real risk lives in trying to catch a bottom that has no volume behind it.
I watch this level until it either reclaims 0.0063 or loses 0.0054 — follow me and I’ll keep the read updated as the 4H prints.
What level on $KDA are you watching most closely right now 👇
Not financial advice. DYOR.
#KDA #Kadena #Crypto #BinanceSquare
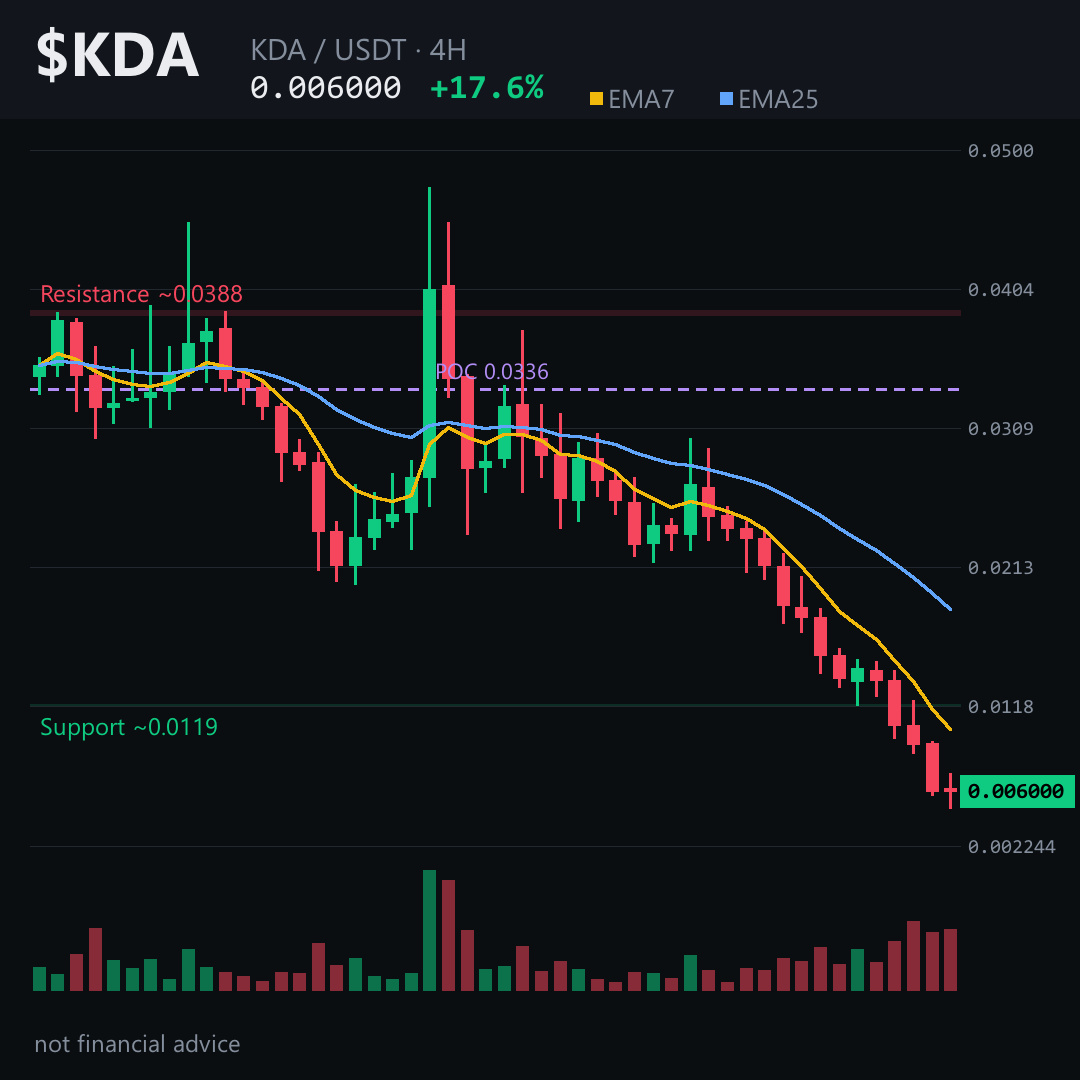
22
Only 1 green candle in the last 48 hours – the market has turned red 11 times straight. The 4‑hour EMA7 sits at 0.0102, barely half the EMA25 at 0.0185, and RSI is stuck at 23.5, hinting at deeper pressure. Read on 👇
Price is hovering just below the 4‑hour pivot around 0.0060. While the bearish EMA spread and ultra‑low RSI suggest further downside, the unfilled bearish FVG at 0.0095‑0.0094 whispers a hidden supply pocket that could accelerate the slide.
On the 4‑hour chart the critical zone sits near 0.0060. The invalidation line sits just above at ~0.00633 – a break above would nullify the bearish case. Failing that, the price may drift toward the objective zone around 0.0055. If $KDA loses the ~0.00633 area on a 4H close, this read is off the table. Tap $KDA to pull up the chart and verify these zones yourself.
The structure points to a continued slide toward the mid‑0.005 range, with the real risk lying if the market manages to retest the ~0.00633 ceiling.
I'll break down the next move once the price tests the 0.0063 barrier, so hit follow to stay updated. How do you interpret the $KDA 4‑hour structure? 👇
⚠️ Not financial advice. DYOR.
#KDA #Kadena #Crypto #BinanceSquare
Only 1 green candle in the last 48 hours – the market has turned red 11 times straight. The 4‑hour EMA7 sits at 0.0102, barely half the EMA25 at 0.0185, and RSI is stuck at 23.5, hinting at deeper pressure. Read on 👇
Price is hovering just below the 4‑hour pivot around 0.0060. While the bearish EMA spread and ultra‑low RSI suggest further downside, the unfilled bearish FVG at 0.0095‑0.0094 whispers a hidden supply pocket that could accelerate the slide.
On the 4‑hour chart the critical zone sits near 0.0060. The invalidation line sits just above at ~0.00633 – a break above would nullify the bearish case. Failing that, the price may drift toward the objective zone around 0.0055. If $KDA loses the ~0.00633 area on a 4H close, this read is off the table. Tap $KDA to pull up the chart and verify these zones yourself.
The structure points to a continued slide toward the mid‑0.005 range, with the real risk lying if the market manages to retest the ~0.00633 ceiling.
I'll break down the next move once the price tests the 0.0063 barrier, so hit follow to stay updated. How do you interpret the $KDA 4‑hour structure? 👇
⚠️ Not financial advice. DYOR.
#KDA #Kadena #Crypto #BinanceSquare
Price is hovering just below the 4‑hour pivot around 0.0060. While the bearish EMA spread and ultra‑low RSI suggest further downside, the unfilled bearish FVG at 0.0095‑0.0094 whispers a hidden supply pocket that could accelerate the slide.
On the 4‑hour chart the critical zone sits near 0.0060. The invalidation line sits just above at ~0.00633 – a break above would nullify the bearish case. Failing that, the price may drift toward the objective zone around 0.0055. If $KDA loses the ~0.00633 area on a 4H close, this read is off the table. Tap $KDA to pull up the chart and verify these zones yourself.
The structure points to a continued slide toward the mid‑0.005 range, with the real risk lying if the market manages to retest the ~0.00633 ceiling.
I'll break down the next move once the price tests the 0.0063 barrier, so hit follow to stay updated. How do you interpret the $KDA 4‑hour structure? 👇
⚠️ Not financial advice. DYOR.
#KDA #Kadena #Crypto #BinanceSquare
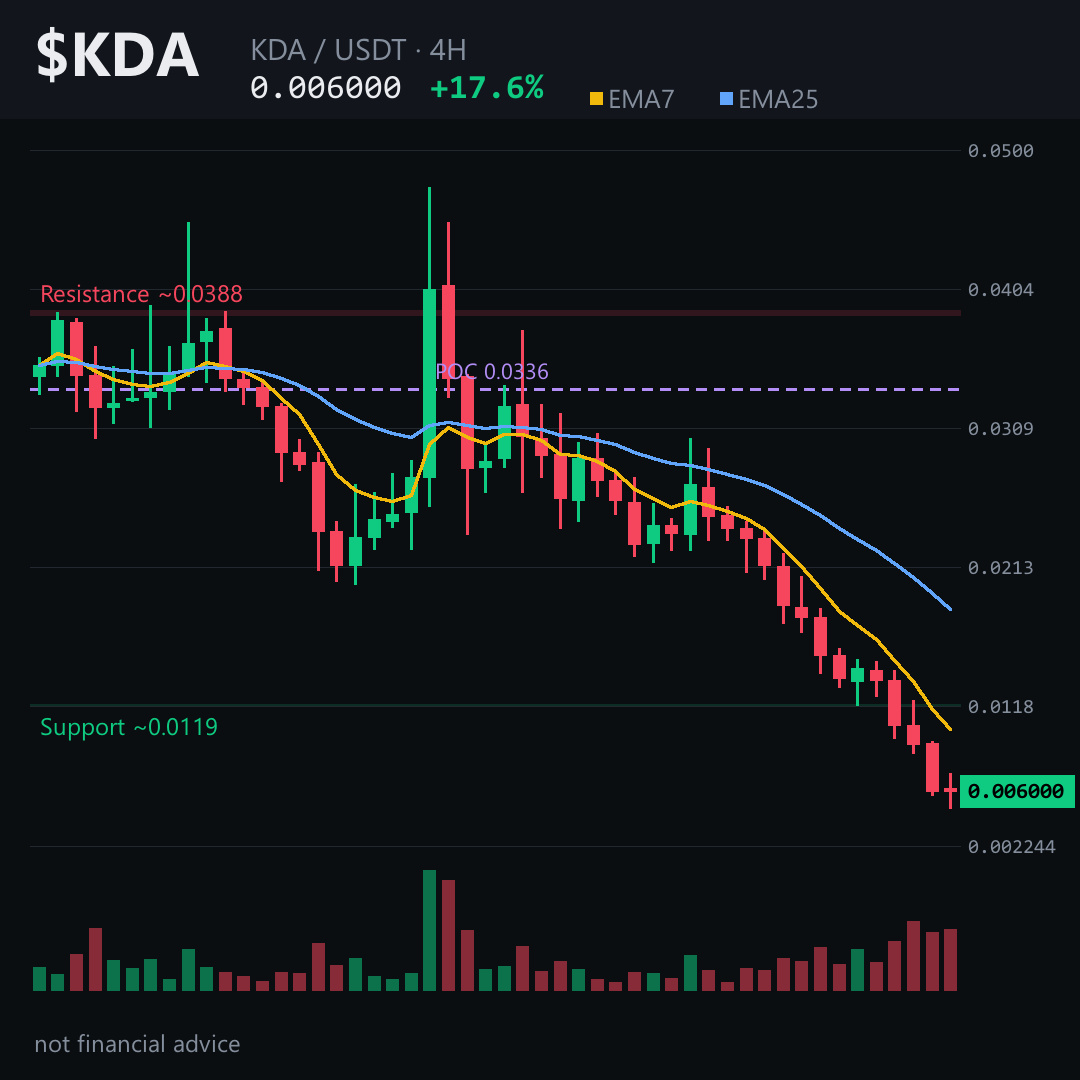
6
All eyes are on the 17% surge and the hype that $KDA will rocket higher.
The 4‑hour chart, however, is carving a quiet path toward the low‑60s.
The levels don’t lie 👇
Price sits under the EMA7/EMA25 cross and RSI is trapped in the low‑20s – classic oversold pressure. A bearish unfilled gap lingers just below the current price, while a flat funding rate signals no fresh long‑side firepower.
On the 4‑hour picture the pivot hovers around the 0.0060 area. Lose the ~0.00633 zone on a 4H close and the bearish premise collapses. If $KDA respects that barrier, the next likely destination is the ~0.0055 zone, a clear objective for sellers. Tap $KDA to pull up the chart and see these zones yourself.
The chart is screaming lower; the real risk is a break below the 0.00633 level, which would open the path to the 0.0055 area.
I’ll break down the weekly macro picture once price tests that 0.0055 region — follow for the next layer of analysis.
Which zone are you watching on KDA? 👇
⚠️ Not financial advice. DYOR.
#KDA #Kadena #Crypto #BinanceSquare
All eyes are on the 17% surge and the hype that $KDA will rocket higher.
The 4‑hour chart, however, is carving a quiet path toward the low‑60s.
The levels don’t lie 👇
Price sits under the EMA7/EMA25 cross and RSI is trapped in the low‑20s – classic oversold pressure. A bearish unfilled gap lingers just below the current price, while a flat funding rate signals no fresh long‑side firepower.
On the 4‑hour picture the pivot hovers around the 0.0060 area. Lose the ~0.00633 zone on a 4H close and the bearish premise collapses. If $KDA respects that barrier, the next likely destination is the ~0.0055 zone, a clear objective for sellers. Tap $KDA to pull up the chart and see these zones yourself.
The chart is screaming lower; the real risk is a break below the 0.00633 level, which would open the path to the 0.0055 area.
I’ll break down the weekly macro picture once price tests that 0.0055 region — follow for the next layer of analysis.
Which zone are you watching on KDA? 👇
⚠️ Not financial advice. DYOR.
#KDA #Kadena #Crypto #BinanceSquare
The 4‑hour chart, however, is carving a quiet path toward the low‑60s.
The levels don’t lie 👇
Price sits under the EMA7/EMA25 cross and RSI is trapped in the low‑20s – classic oversold pressure. A bearish unfilled gap lingers just below the current price, while a flat funding rate signals no fresh long‑side firepower.
On the 4‑hour picture the pivot hovers around the 0.0060 area. Lose the ~0.00633 zone on a 4H close and the bearish premise collapses. If $KDA respects that barrier, the next likely destination is the ~0.0055 zone, a clear objective for sellers. Tap $KDA to pull up the chart and see these zones yourself.
The chart is screaming lower; the real risk is a break below the 0.00633 level, which would open the path to the 0.0055 area.
I’ll break down the weekly macro picture once price tests that 0.0055 region — follow for the next layer of analysis.
Which zone are you watching on KDA? 👇
⚠️ Not financial advice. DYOR.
#KDA #Kadena #Crypto #BinanceSquare
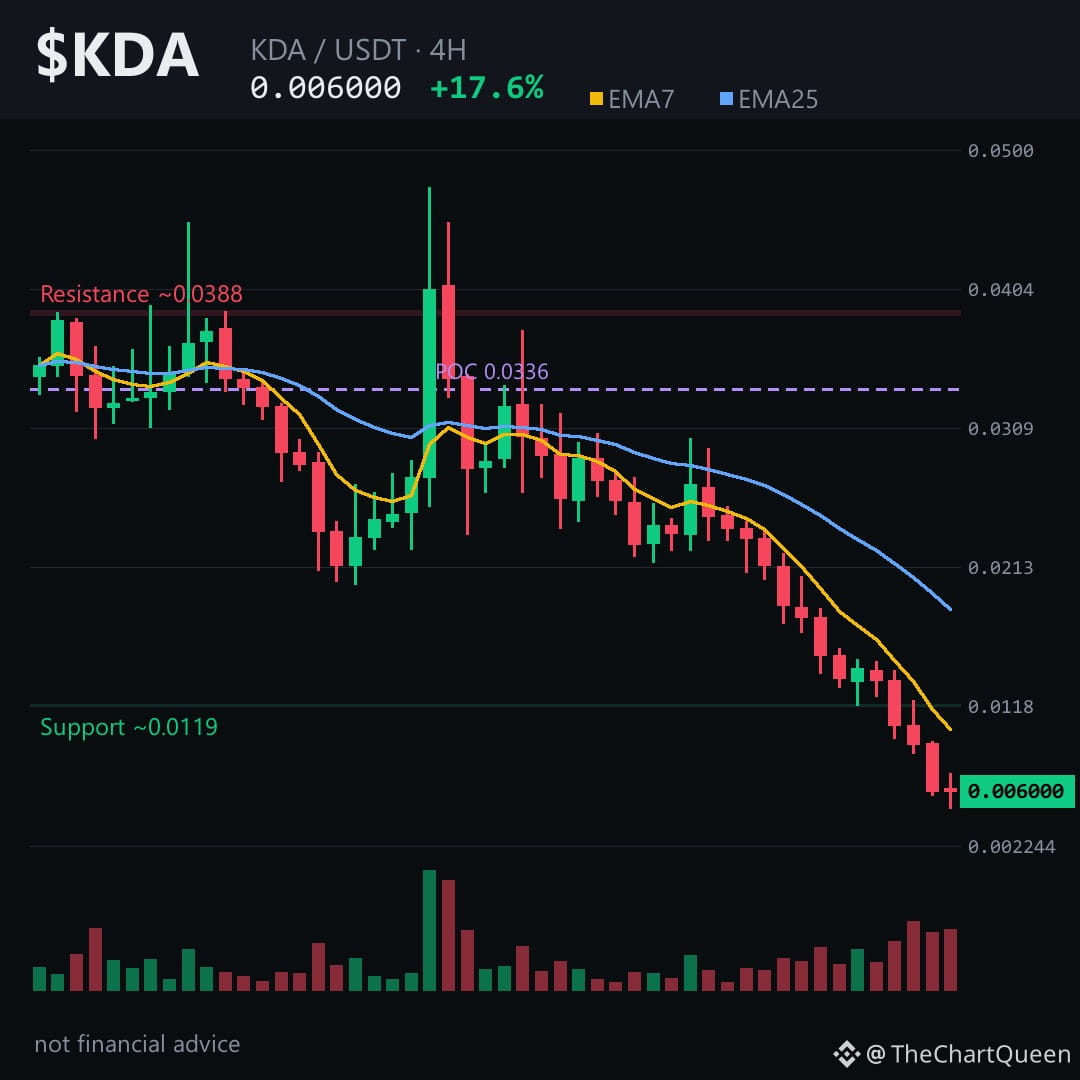
4
-35.48% in a single 4H candle.
That is not a pump. That is a liquidation cascade with a dead-cat bounce wearing a "+17.65%" costume.
Eleven of the last twelve candles closed red. Price fell from 0.024 to 0.006 in two days. The bounce off the lows is barely a retrace of the most recent leg down.
Price sits near 0.0060, just above the objective zone at 0.0055. The invalidation sits around 0.0063 — less than five percent away. A 4H close back above that would tell me the bounce has more fuel than the tape suggests.
Below, an unfilled gap runs from 0.0096 down to 0.0094. Gaps act as magnets. The path of least resistance stays lower until that zone gets tested or the invalidation clears.
RSI on the 4H is 23 — oversold, but in a downtrend this steep, oversold can stay oversold for days.
My read: the bounce is real but fragile. The risk is mistaking a relief rally for a reversal. If $KDA fails to reclaim 0.0063, the 0.0055 zone is the next logical magnet. Tap $KDA to pull up the chart and see the gap for yourself.
I will update this read if the invalidation clears or the gap gets filled — follow so you do not have to hunt for it.
Which zone are you watching closer on $KDA — the gap above or the objective below? 👇
⚠️ Not financial advice. DYOR.
#KDA #Kadena #Crypto #BinanceSquare
-35.48% in a single 4H candle.
That is not a pump. That is a liquidation cascade with a dead-cat bounce wearing a "+17.65%" costume.
Eleven of the last twelve candles closed red. Price fell from 0.024 to 0.006 in two days. The bounce off the lows is barely a retrace of the most recent leg down.
Price sits near 0.0060, just above the objective zone at 0.0055. The invalidation sits around 0.0063 — less than five percent away. A 4H close back above that would tell me the bounce has more fuel than the tape suggests.
Below, an unfilled gap runs from 0.0096 down to 0.0094. Gaps act as magnets. The path of least resistance stays lower until that zone gets tested or the invalidation clears.
RSI on the 4H is 23 — oversold, but in a downtrend this steep, oversold can stay oversold for days.
My read: the bounce is real but fragile. The risk is mistaking a relief rally for a reversal. If $KDA fails to reclaim 0.0063, the 0.0055 zone is the next logical magnet. Tap $KDA to pull up the chart and see the gap for yourself.
I will update this read if the invalidation clears or the gap gets filled — follow so you do not have to hunt for it.
Which zone are you watching closer on $KDA — the gap above or the objective below? 👇
⚠️ Not financial advice. DYOR.
#KDA #Kadena #Crypto #BinanceSquare
That is not a pump. That is a liquidation cascade with a dead-cat bounce wearing a "+17.65%" costume.
Eleven of the last twelve candles closed red. Price fell from 0.024 to 0.006 in two days. The bounce off the lows is barely a retrace of the most recent leg down.
Price sits near 0.0060, just above the objective zone at 0.0055. The invalidation sits around 0.0063 — less than five percent away. A 4H close back above that would tell me the bounce has more fuel than the tape suggests.
Below, an unfilled gap runs from 0.0096 down to 0.0094. Gaps act as magnets. The path of least resistance stays lower until that zone gets tested or the invalidation clears.
RSI on the 4H is 23 — oversold, but in a downtrend this steep, oversold can stay oversold for days.
My read: the bounce is real but fragile. The risk is mistaking a relief rally for a reversal. If $KDA fails to reclaim 0.0063, the 0.0055 zone is the next logical magnet. Tap $KDA to pull up the chart and see the gap for yourself.
I will update this read if the invalidation clears or the gap gets filled — follow so you do not have to hunt for it.
Which zone are you watching closer on $KDA — the gap above or the objective below? 👇
⚠️ Not financial advice. DYOR.
#KDA #Kadena #Crypto #BinanceSquare
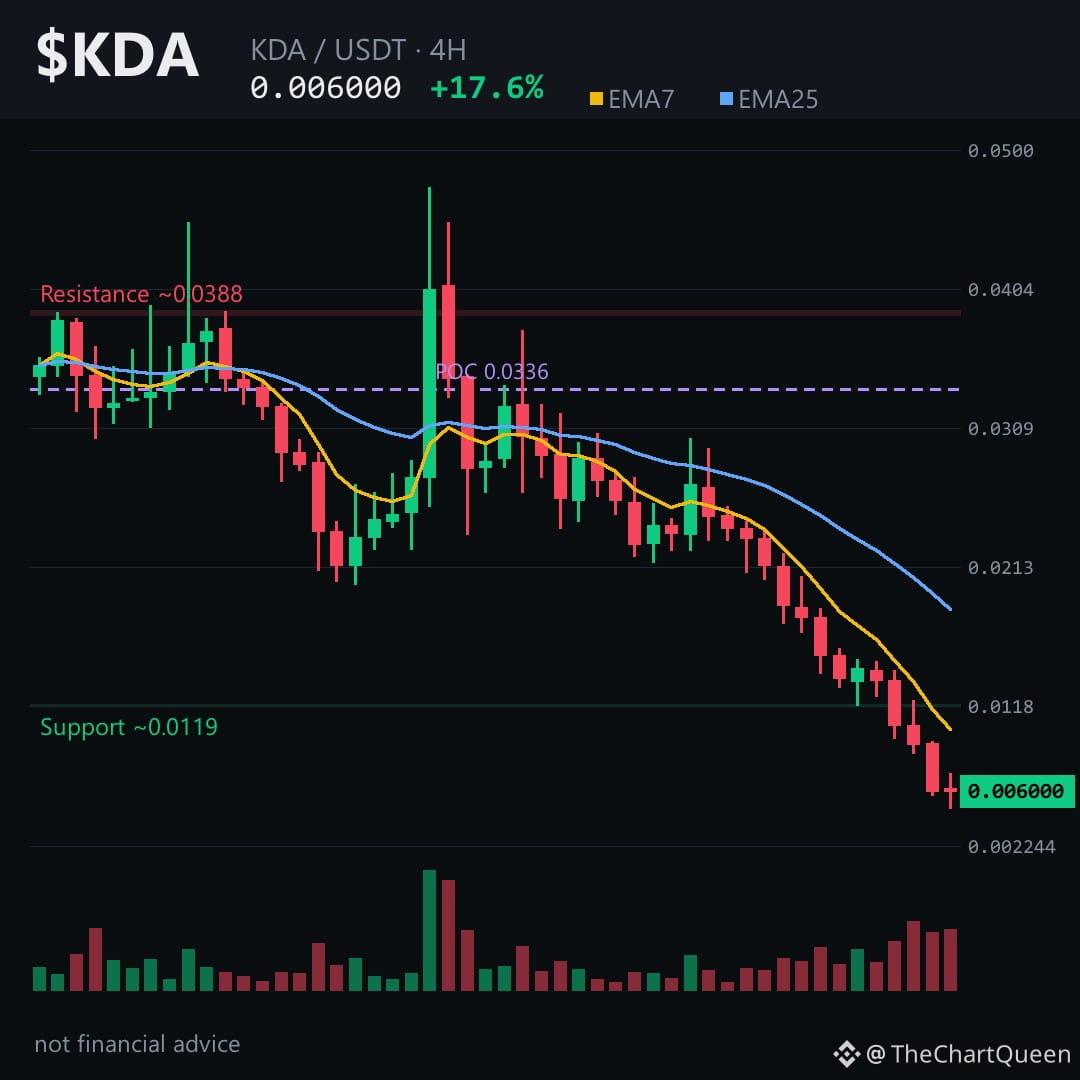
20
🚨 Warning: $KDA is on the verge of a massive drop 📉. Full setup below 👇
Current price action looks bearish, but the internal data reveals a hidden trap: smart money is quietly accumulating while retail is trapped. The window for this trade is closing fast.
Scalp Setup (4H): Entry: $0.00609000 | SL: $0.00639450 | TP: $0.00563325 | Leverage: 10x Cross
Swing Setup (1D): Entry: $0.00624000 | SL: $0.00698880 | TP: $0.00474240 | Leverage: 10x Cross
Position Setup (3D): Entry: $0.00648000 | SL: $0.00764640 | TP: $0.00356400 | Leverage: 3x Cross
Macro Setup (1W/1M): Entry: $0.00690000 | SL: $0.00862500 | TP: $0.00345000 | Leverage: Spot (No Leverage)
I'm trading this setup. R:R is too good to ignore.
I've analyzed 150 charts tonight and this one stands out. Support my caffeine addiction with a Binance Square Tip if this hits TP. FOLLOW and SAVE this post so you won't regret missing the pump. LONG or SHORT $KDA here? Let me know below! 👇
⚠️ Not financial advice. DYOR.
#KDA #Crypto #BinanceSquare
🚨 Warning: $KDA is on the verge of a massive drop 📉. Full setup below 👇
Current price action looks bearish, but the internal data reveals a hidden trap: smart money is quietly accumulating while retail is trapped. The window for this trade is closing fast.
Scalp Setup (4H): Entry: $0.00609000 | SL: $0.00639450 | TP: $0.00563325 | Leverage: 10x Cross
Swing Setup (1D): Entry: $0.00624000 | SL: $0.00698880 | TP: $0.00474240 | Leverage: 10x Cross
Position Setup (3D): Entry: $0.00648000 | SL: $0.00764640 | TP: $0.00356400 | Leverage: 3x Cross
Macro Setup (1W/1M): Entry: $0.00690000 | SL: $0.00862500 | TP: $0.00345000 | Leverage: Spot (No Leverage)
I'm trading this setup. R:R is too good to ignore.
I've analyzed 150 charts tonight and this one stands out. Support my caffeine addiction with a Binance Square Tip if this hits TP. FOLLOW and SAVE this post so you won't regret missing the pump. LONG or SHORT $KDA here? Let me know below! 👇
⚠️ Not financial advice. DYOR.
#KDA #Crypto #BinanceSquare
Current price action looks bearish, but the internal data reveals a hidden trap: smart money is quietly accumulating while retail is trapped. The window for this trade is closing fast.
Scalp Setup (4H): Entry: $0.00609000 | SL: $0.00639450 | TP: $0.00563325 | Leverage: 10x Cross
Swing Setup (1D): Entry: $0.00624000 | SL: $0.00698880 | TP: $0.00474240 | Leverage: 10x Cross
Position Setup (3D): Entry: $0.00648000 | SL: $0.00764640 | TP: $0.00356400 | Leverage: 3x Cross
Macro Setup (1W/1M): Entry: $0.00690000 | SL: $0.00862500 | TP: $0.00345000 | Leverage: Spot (No Leverage)
I'm trading this setup. R:R is too good to ignore.
I've analyzed 150 charts tonight and this one stands out. Support my caffeine addiction with a Binance Square Tip if this hits TP. FOLLOW and SAVE this post so you won't regret missing the pump. LONG or SHORT $KDA here? Let me know below! 👇
⚠️ Not financial advice. DYOR.
#KDA #Crypto #BinanceSquare
20
🚨 Warning: $KDA's 17.65% surge may be a trap 🚨. Full setup below 👇
Price looks bullish, but internal data reveals a hidden weakness... Funding Rate is 0%, indicating a lack of conviction from longs. Open Interest is $0, suggesting smart money is not yet invested. Long/Short Ratio is 0, implying a contrarian signal.
THE GOLDEN SLOT: Break $0.0065 -> Target $0.0090. Entry: $0.0062 | SL: $0.0055 | TP1: $0.0075 | Leverage: 10x Cross
I'm trading this setup. R:R is too good to ignore.
Daily free signals for followers. Save this post before it's gone. If you don't follow, you'll wonder 'what if' in 48h. LONG or SHORT $KDA here? Comment below! 👇
⚠️ Not financial advice. DYOR. #KDA #Crypto #BinanceSquare
🚨 Warning: $KDA's 17.65% surge may be a trap 🚨. Full setup below 👇
Price looks bullish, but internal data reveals a hidden weakness... Funding Rate is 0%, indicating a lack of conviction from longs. Open Interest is $0, suggesting smart money is not yet invested. Long/Short Ratio is 0, implying a contrarian signal.
THE GOLDEN SLOT: Break $0.0065 -> Target $0.0090. Entry: $0.0062 | SL: $0.0055 | TP1: $0.0075 | Leverage: 10x Cross
I'm trading this setup. R:R is too good to ignore.
Daily free signals for followers. Save this post before it's gone. If you don't follow, you'll wonder 'what if' in 48h. LONG or SHORT $KDA here? Comment below! 👇
⚠️ Not financial advice. DYOR. #KDA #Crypto #BinanceSquare
Price looks bullish, but internal data reveals a hidden weakness... Funding Rate is 0%, indicating a lack of conviction from longs. Open Interest is $0, suggesting smart money is not yet invested. Long/Short Ratio is 0, implying a contrarian signal.
THE GOLDEN SLOT: Break $0.0065 -> Target $0.0090. Entry: $0.0062 | SL: $0.0055 | TP1: $0.0075 | Leverage: 10x Cross
I'm trading this setup. R:R is too good to ignore.
Daily free signals for followers. Save this post before it's gone. If you don't follow, you'll wonder 'what if' in 48h. LONG or SHORT $KDA here? Comment below! 👇
⚠️ Not financial advice. DYOR. #KDA #Crypto #BinanceSquare
19
🚨 Warning: $KDA's 17.65% pump may be a trap 🚨. Full setup below 👇
Price looks bullish, but internal data reveals a hidden weakness. Market is not over-leveraged, but the lack of open interest and extreme long/short ratio indicate a potential contrarian signal. The window for this trade is closing fast.
Break $0.0065 -> Target $0.0080. Entry: $0.0062 | SL: $0.0055 | TP1: $0.0070 | Leverage: 10x Cross
I'm trading this setup. R:R is too good to ignore.
I've analyzed 12 charts tonight and this one stands out. Support my caffeine addiction with a tip if this hits TP. FOLLOW and SAVE this post to avoid FOMO. LONG or SHORT $KDA here? Let me know below! 👇
⚠️ Not financial advice. DYOR.
#KDA #Crypto #BinanceSquare
🚨 Warning: $KDA's 17.65% pump may be a trap 🚨. Full setup below 👇
Price looks bullish, but internal data reveals a hidden weakness. Market is not over-leveraged, but the lack of open interest and extreme long/short ratio indicate a potential contrarian signal. The window for this trade is closing fast.
Break $0.0065 -> Target $0.0080. Entry: $0.0062 | SL: $0.0055 | TP1: $0.0070 | Leverage: 10x Cross
I'm trading this setup. R:R is too good to ignore.
I've analyzed 12 charts tonight and this one stands out. Support my caffeine addiction with a tip if this hits TP. FOLLOW and SAVE this post to avoid FOMO. LONG or SHORT $KDA here? Let me know below! 👇
⚠️ Not financial advice. DYOR.
#KDA #Crypto #BinanceSquare
Price looks bullish, but internal data reveals a hidden weakness. Market is not over-leveraged, but the lack of open interest and extreme long/short ratio indicate a potential contrarian signal. The window for this trade is closing fast.
Break $0.0065 -> Target $0.0080. Entry: $0.0062 | SL: $0.0055 | TP1: $0.0070 | Leverage: 10x Cross
I'm trading this setup. R:R is too good to ignore.
I've analyzed 12 charts tonight and this one stands out. Support my caffeine addiction with a tip if this hits TP. FOLLOW and SAVE this post to avoid FOMO. LONG or SHORT $KDA here? Let me know below! 👇
⚠️ Not financial advice. DYOR.
#KDA #Crypto #BinanceSquare
14
$KDA is making headlines as a top gainer, but here’s the brutal truth: this +17% bounce is a deadly trap, not a recovery. The market is showing a classic dead cat bounce before the next leg down. Full setup below 👇
Price looks like a bargain, but the internal data screams danger. The total absence of futures metrics—zero open interest, flat funding—means professional traders have completely abandoned this chart. There's no smart money to support a reversal; it's just low-volume noise. On the 4H, RSI is deeply oversold, but in a strong downtrend, that's a continuation signal, not a buy. The unmitigated bearish FVG above is a magnet, but price needs to fill below first. The window to catch this next drop is closing fast.
Scalp Setup (4H): Entry: $0.00609000 | SL: $0.00639450 | TP: $0.00563325 | Leverage: 10x Cross
Swing Setup (1D): Entry: $0.00624000 | SL: $0.00698880 | TP: $0.00474240 | Leverage: 10x Cross
Position Setup (3D): Entry: $0.00648000 | SL: $0.00764640 | TP: $0.00356400 | Leverage: 3x Cross
Macro Setup (1W/1M): Entry: $0.00690000 | SL: $0.00862500 | TP: $0.00345000 | Leverage: Spot (No Leverage)
I’m shorting this relief rally. The risk-to-reward is asymmetric to the downside.
Just spent hours dissecting order books across timeframes to map this liquidity hunt. If this breakdown saves your capital, hit that Binance Square Tip—it fuels more deep dives. Definitely FOLLOW and SAVE this post so you don’t miss the next leg down. Are you fading this pump with a SHORT, or getting trapped LONG? Drop your call below! 👇
⚠️ Not financial advice. DYOR.
#KDA #Crypto #BinanceSquare
$KDA is making headlines as a top gainer, but here’s the brutal truth: this +17% bounce is a deadly trap, not a recovery. The market is showing a classic dead cat bounce before the next leg down. Full setup below 👇
Price looks like a bargain, but the internal data screams danger. The total absence of futures metrics—zero open interest, flat funding—means professional traders have completely abandoned this chart. There's no smart money to support a reversal; it's just low-volume noise. On the 4H, RSI is deeply oversold, but in a strong downtrend, that's a continuation signal, not a buy. The unmitigated bearish FVG above is a magnet, but price needs to fill below first. The window to catch this next drop is closing fast.
Scalp Setup (4H): Entry: $0.00609000 | SL: $0.00639450 | TP: $0.00563325 | Leverage: 10x Cross
Swing Setup (1D): Entry: $0.00624000 | SL: $0.00698880 | TP: $0.00474240 | Leverage: 10x Cross
Position Setup (3D): Entry: $0.00648000 | SL: $0.00764640 | TP: $0.00356400 | Leverage: 3x Cross
Macro Setup (1W/1M): Entry: $0.00690000 | SL: $0.00862500 | TP: $0.00345000 | Leverage: Spot (No Leverage)
I’m shorting this relief rally. The risk-to-reward is asymmetric to the downside.
Just spent hours dissecting order books across timeframes to map this liquidity hunt. If this breakdown saves your capital, hit that Binance Square Tip—it fuels more deep dives. Definitely FOLLOW and SAVE this post so you don’t miss the next leg down. Are you fading this pump with a SHORT, or getting trapped LONG? Drop your call below! 👇
⚠️ Not financial advice. DYOR.
#KDA #Crypto #BinanceSquare
Price looks like a bargain, but the internal data screams danger. The total absence of futures metrics—zero open interest, flat funding—means professional traders have completely abandoned this chart. There's no smart money to support a reversal; it's just low-volume noise. On the 4H, RSI is deeply oversold, but in a strong downtrend, that's a continuation signal, not a buy. The unmitigated bearish FVG above is a magnet, but price needs to fill below first. The window to catch this next drop is closing fast.
Scalp Setup (4H): Entry: $0.00609000 | SL: $0.00639450 | TP: $0.00563325 | Leverage: 10x Cross
Swing Setup (1D): Entry: $0.00624000 | SL: $0.00698880 | TP: $0.00474240 | Leverage: 10x Cross
Position Setup (3D): Entry: $0.00648000 | SL: $0.00764640 | TP: $0.00356400 | Leverage: 3x Cross
Macro Setup (1W/1M): Entry: $0.00690000 | SL: $0.00862500 | TP: $0.00345000 | Leverage: Spot (No Leverage)
I’m shorting this relief rally. The risk-to-reward is asymmetric to the downside.
Just spent hours dissecting order books across timeframes to map this liquidity hunt. If this breakdown saves your capital, hit that Binance Square Tip—it fuels more deep dives. Definitely FOLLOW and SAVE this post so you don’t miss the next leg down. Are you fading this pump with a SHORT, or getting trapped LONG? Drop your call below! 👇
⚠️ Not financial advice. DYOR.
#KDA #Crypto #BinanceSquare
11
Log in to explore more content
Join global crypto users on Binance Square
⚡️ Get latest and useful information about crypto.
💬 Trusted by the world’s largest crypto exchange.
👍 Discover real insights from verified creators.
Email / Phone number
Trending Topics
1
#NvidiaLoses$2.7TrillionInMonthAndAHalf
4,784 views
67 Discussing
2
#CanBTCReboundAfterFallingBelow60K?
605,630 views
2,590 Discussing
3
#GlobalStocksFaceLongestLosingStreakSince2023
211,695 views
1,780 Discussing
4
#BlackRockIBITPostsRecord$541MSingleDayOutflow
20,371 views
62 Discussing
5
#AnthropicPlungesTowardIPOPriceonDay2
105,133 views
1,055 Discussing
6
#TwentyOneCapitalAdds172.25BTC
44,285 views
539 Discussing
7
#HKBillWouldExcludeTokenizedDepositsFromVirtualAssets
4,880 views
48 Discussing
8
#BNBDropsBelow540USDTWith8.46%DailyDecline
60,267 views
557 Discussing
9
#HKBillProposesHK$100KFineForUnauthorizedCryptoTitles
2,014 views
20 Discussing
10
#BitMineFaces$10.1BUnrealizedETHLoss
4,273 views
25 Discussing