
#layer1
layer1
5.2M views
28,774 Discussing
Hot
Latest

·
--
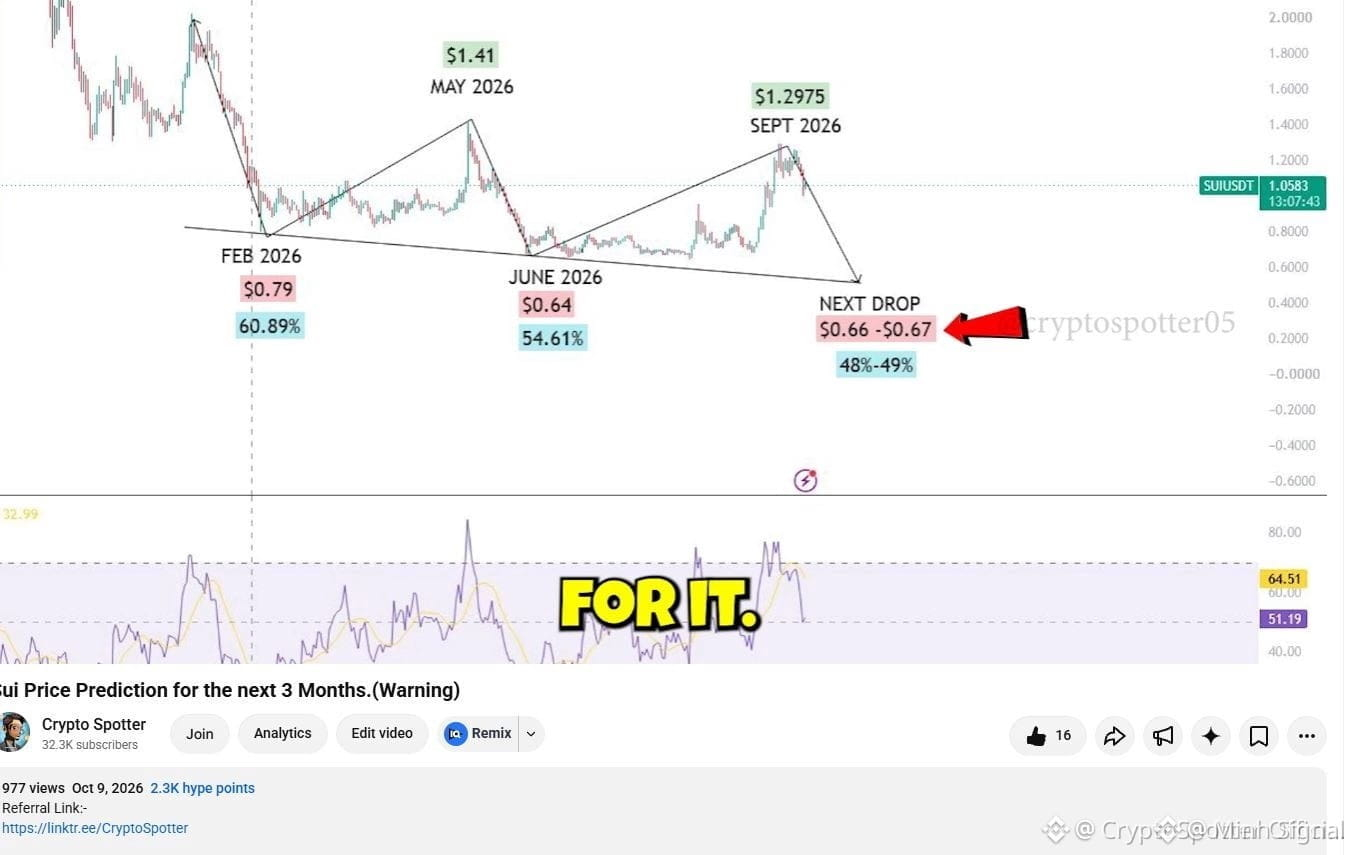
$SUI has now slipped to $0.6545, slightly below the old $0.66–$0.67 downside zone. The warning was directionally right, but momentum is stretched: 4h RSI sits at 29 while volume runs 1.6x the 20-day average. With price under both key MAs and funding at -0.009%, shorts are crowded. Relief bounce or deeper flush? #SUI 🚨 #Crypto #Layer1
Inspired by CryptoSpotter Official on Binance Square.
$SUI has now slipped to $0.6545, slightly below the old $0.66–$0.67 downside zone. The warning was directionally right, but momentum is stretched: 4h RSI sits at 29 while volume runs 1.6x the 20-day average. With price under both key MAs and funding at -0.009%, shorts are crowded. Relief bounce or deeper flush? #SUI 🚨 #Crypto #Layer1
Inspired by CryptoSpotter Official on Binance Square.
Inspired by CryptoSpotter Official on Binance Square.
156

·
--
Is $SOL still the king of high-throughput Layer-1s? 👑📊
While other networks talk about scaling, Solana is actively handling massive on-chain volume without breaking a sweat:
🔹 Ultra-low latency ideal for high-frequency DeFi
🔹 Near-zero gas costs onboarding millions of retail users
🔹 Thriving developer activity across gaming and payments
Speed + liquidity = adoption. 💡
Your turn: Where do you see $SOL heading next—new highs or consolidation first? Share your chart thoughts below! 👇📈
#Solana #SOL #Layer1
Is $SOL still the king of high-throughput Layer-1s? 👑📊
While other networks talk about scaling, Solana is actively handling massive on-chain volume without breaking a sweat:
🔹 Ultra-low latency ideal for high-frequency DeFi
🔹 Near-zero gas costs onboarding millions of retail users
🔹 Thriving developer activity across gaming and payments
Speed + liquidity = adoption. 💡
Your turn: Where do you see $SOL heading next—new highs or consolidation first? Share your chart thoughts below! 👇📈
#Solana #SOL #Layer1
While other networks talk about scaling, Solana is actively handling massive on-chain volume without breaking a sweat:
🔹 Ultra-low latency ideal for high-frequency DeFi
🔹 Near-zero gas costs onboarding millions of retail users
🔹 Thriving developer activity across gaming and payments
Speed + liquidity = adoption. 💡
Your turn: Where do you see $SOL heading next—new highs or consolidation first? Share your chart thoughts below! 👇📈
#Solana #SOL #Layer1

1
19

·
--
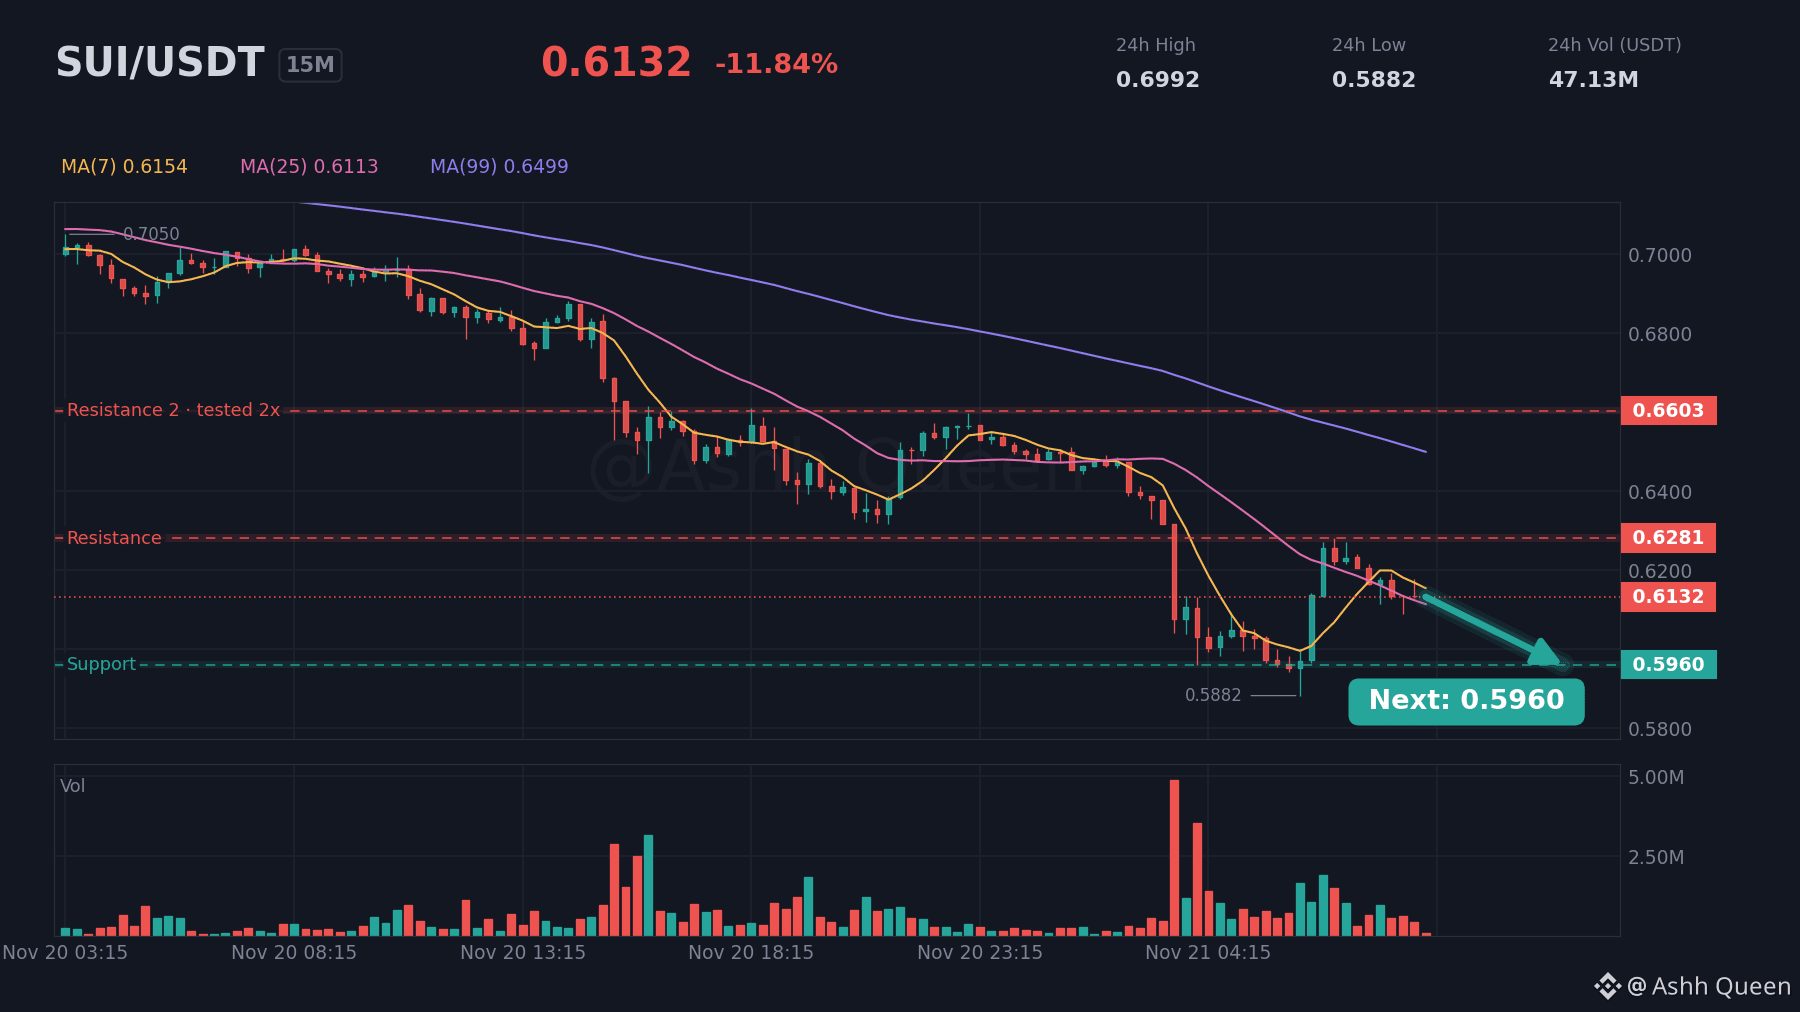
Why is $SUI failing to reclaim its previous momentum? 🧐
The market is showing a mild bearish lean as the price struggles under key hurdles. I am watching how the price interacts with these specific levels to determine if the current downward pressure will hold.
- Next resistance at 0.6603
- Resistance at 0.6281
- Price now at 0.6133
- Support at 0.5960
The data leans toward the sellers. A break below support at 0.5960 would confirm the bearish bias. ⚠️
Are you expecting a recovery or a deeper test? 🛡️
#SUI #Layer1 #TechnicalAnalysis #BinanceSquare
DYOR. Size positions carefully and never trade with money you cannot afford to lose.
Why is $SUI failing to reclaim its previous momentum? 🧐
The market is showing a mild bearish lean as the price struggles under key hurdles. I am watching how the price interacts with these specific levels to determine if the current downward pressure will hold.
- Next resistance at 0.6603
- Resistance at 0.6281
- Price now at 0.6133
- Support at 0.5960
The data leans toward the sellers. A break below support at 0.5960 would confirm the bearish bias. ⚠️
Are you expecting a recovery or a deeper test? 🛡️
#SUI #Layer1 #TechnicalAnalysis #BinanceSquare
DYOR. Size positions carefully and never trade with money you cannot afford to lose.
The market is showing a mild bearish lean as the price struggles under key hurdles. I am watching how the price interacts with these specific levels to determine if the current downward pressure will hold.
- Next resistance at 0.6603
- Resistance at 0.6281
- Price now at 0.6133
- Support at 0.5960
The data leans toward the sellers. A break below support at 0.5960 would confirm the bearish bias. ⚠️
Are you expecting a recovery or a deeper test? 🛡️
#SUI #Layer1 #TechnicalAnalysis #BinanceSquare
DYOR. Size positions carefully and never trade with money you cannot afford to lose.
8

📉 $NEAR GETS CUT IN HALF TO THREE DOLLARS WHILE UTILITY SURGES! ⚡
Market sentiment loves to punish charts while the actual engine rooms roar. $NEAR just took a brutal fifty percent haircut, bleeding down from six dollars to three over the past month. 📊 Yet beneath the surface chop, network activity tells a completely different story.
Daily volume on NEAR Intents actually expanded to one hundred thirty-four million dollars, outstripping October figures. When underlying demand climbs while price compresses, smart money usually sniffs out a deep value mismatch. 💡 Are you treating this flush as a trap or quietly accumulating ahead of the rotation? 👇
⚠️ Not financial advice. Always manage your risk. 🛡️
🏷️ #NEAR #Layer1 #Crypto #Accumulation
🦈 💎
📉 $NEAR GETS CUT IN HALF TO THREE DOLLARS WHILE UTILITY SURGES! ⚡
Market sentiment loves to punish charts while the actual engine rooms roar. $NEAR just took a brutal fifty percent haircut, bleeding down from six dollars to three over the past month. 📊 Yet beneath the surface chop, network activity tells a completely different story.
Daily volume on NEAR Intents actually expanded to one hundred thirty-four million dollars, outstripping October figures. When underlying demand climbs while price compresses, smart money usually sniffs out a deep value mismatch. 💡 Are you treating this flush as a trap or quietly accumulating ahead of the rotation? 👇
⚠️ Not financial advice. Always manage your risk. 🛡️
🏷️ #NEAR #Layer1 #Crypto #Accumulation
🦈 💎
Market sentiment loves to punish charts while the actual engine rooms roar. $NEAR just took a brutal fifty percent haircut, bleeding down from six dollars to three over the past month. 📊 Yet beneath the surface chop, network activity tells a completely different story.
Daily volume on NEAR Intents actually expanded to one hundred thirty-four million dollars, outstripping October figures. When underlying demand climbs while price compresses, smart money usually sniffs out a deep value mismatch. 💡 Are you treating this flush as a trap or quietly accumulating ahead of the rotation? 👇
⚠️ Not financial advice. Always manage your risk. 🛡️
🏷️ #NEAR #Layer1 #Crypto #Accumulation
🦈 💎
20

·
--
Capital rotation into high-conviction altcoins is picking up pace, and volume is confirming the move.
1. Layer-1 Momentum: $SOL and $AVAX are attracting steady spot demand as liquidity shifts toward scalable ecosystems with active developer and DeFi traction.
2. Ecosystem Depth: $BNB continues to anchor exchange and DeFi liquidity, supporting infrastructure plays breaking out on genuine volume expansion.
3. Confirmation Matters: Watch for rising spot volume alongside neutral funding rates—thin, leverage-driven spikes remain vulnerable to sharp pullbacks.
Stay disciplined with risk management as volatility expands. Which altcoin sector looks strongest on your radar right now?
#Altcoins #Layer1 #DeFi
Capital rotation into high-conviction altcoins is picking up pace, and volume is confirming the move.
1. Layer-1 Momentum: $SOL and $AVAX are attracting steady spot demand as liquidity shifts toward scalable ecosystems with active developer and DeFi traction.
2. Ecosystem Depth: $BNB continues to anchor exchange and DeFi liquidity, supporting infrastructure plays breaking out on genuine volume expansion.
3. Confirmation Matters: Watch for rising spot volume alongside neutral funding rates—thin, leverage-driven spikes remain vulnerable to sharp pullbacks.
Stay disciplined with risk management as volatility expands. Which altcoin sector looks strongest on your radar right now?
#Altcoins #Layer1 #DeFi
1. Layer-1 Momentum: $SOL and $AVAX are attracting steady spot demand as liquidity shifts toward scalable ecosystems with active developer and DeFi traction.
2. Ecosystem Depth: $BNB continues to anchor exchange and DeFi liquidity, supporting infrastructure plays breaking out on genuine volume expansion.
3. Confirmation Matters: Watch for rising spot volume alongside neutral funding rates—thin, leverage-driven spikes remain vulnerable to sharp pullbacks.
Stay disciplined with risk management as volatility expands. Which altcoin sector looks strongest on your radar right now?
#Altcoins #Layer1 #DeFi
94



Ethereum developers are eyeing a December target for the upcoming Glamsterdam testnet. While around 200 findings have been flagged for review, this highlights the rigorous vetting process required before major network shifts. Timelines in protocol development often flex to prioritize stability and long-term security over speed. It is a vital reminder of how complex coordination underpins layer-1 upgrades as the ecosystem continually evolves. $ETH #Ethereum #Layer1 #CryptoNews
Ethereum developers are eyeing a December target for the upcoming Glamsterdam testnet. While around 200 findings have been flagged for review, this highlights the rigorous vetting process required before major network shifts. Timelines in protocol development often flex to prioritize stability and long-term security over speed. It is a vital reminder of how complex coordination underpins layer-1 upgrades as the ecosystem continually evolves. $ETH #Ethereum #Layer1 #CryptoNews
4

·
--
Bearish
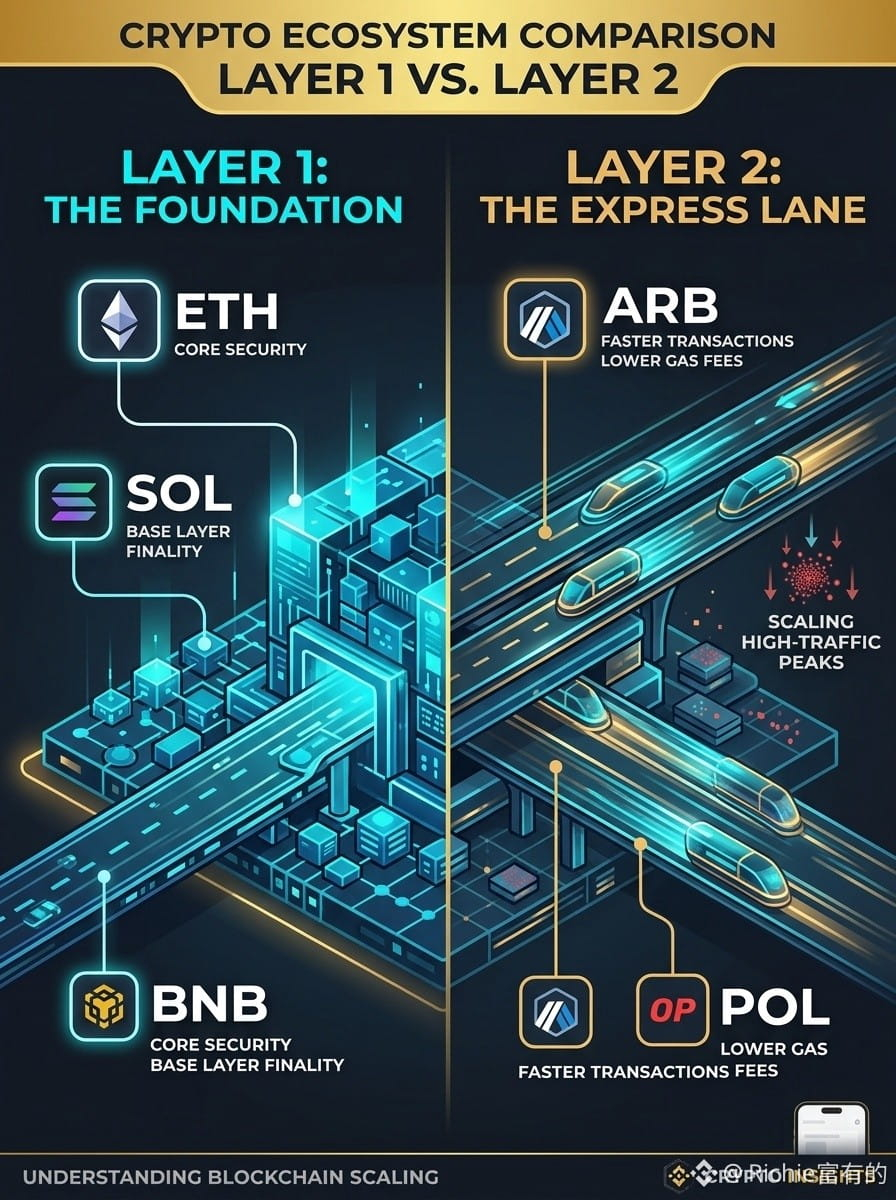
📉 Layer 1 vs. Layer 2: Why the Whole Market Moves Together 🔴
Looking at the futures board today, both Layer 1s and Layer 2s are feeling the pressure—from \(ETH (-4.26\%) and\)NEAR (-11.10%) to \(ARB (-8.44\%) and\)ZK (-6.07%).
If you’re trading this volatility, understanding how these two layers interact gives you an edge:
🔹 Layer 1 (The Foundation): Independent base blockchains like $ETH , $SOL , and $BNB . They handle core security, consensus, and final settlement. Think of them as the main highway.
🔹 Layer 2 (The Express Lane): Scaling networks built on top of Layer 1s—like $ARB, OP, and POL. They bundle transactions off-chain to deliver faster speeds and lower gas fees.
💡 The Market Impact:
Because Layer 2s rely on Layer 1s for security, their price action is tightly linked to the base layer. Layer 2 tokens often act as high-beta plays—meaning steeper dips during market corrections, and sharper rebounds when momentum flips bullish.
Are you accumulating foundational Layer 1s on this dip, or hunting for high-beta Layer 2 plays? Drop your watchlist below! 👇
#CryptoTrading #Layer1 #Layer2Revolution #Altcoins #MarketPullback
📉 Layer 1 vs. Layer 2: Why the Whole Market Moves Together 🔴
Looking at the futures board today, both Layer 1s and Layer 2s are feeling the pressure—from \(ETH (-4.26\%) and\)NEAR (-11.10%) to \(ARB (-8.44\%) and\)ZK (-6.07%).
If you’re trading this volatility, understanding how these two layers interact gives you an edge:
🔹 Layer 1 (The Foundation): Independent base blockchains like $ETH , $SOL , and $BNB . They handle core security, consensus, and final settlement. Think of them as the main highway.
🔹 Layer 2 (The Express Lane): Scaling networks built on top of Layer 1s—like $ARB, OP, and POL. They bundle transactions off-chain to deliver faster speeds and lower gas fees.
💡 The Market Impact:
Because Layer 2s rely on Layer 1s for security, their price action is tightly linked to the base layer. Layer 2 tokens often act as high-beta plays—meaning steeper dips during market corrections, and sharper rebounds when momentum flips bullish.
Are you accumulating foundational Layer 1s on this dip, or hunting for high-beta Layer 2 plays? Drop your watchlist below! 👇
#CryptoTrading #Layer1 #Layer2Revolution #Altcoins #MarketPullback
Looking at the futures board today, both Layer 1s and Layer 2s are feeling the pressure—from \(ETH (-4.26\%) and\)NEAR (-11.10%) to \(ARB (-8.44\%) and\)ZK (-6.07%).
If you’re trading this volatility, understanding how these two layers interact gives you an edge:
🔹 Layer 1 (The Foundation): Independent base blockchains like $ETH , $SOL , and $BNB . They handle core security, consensus, and final settlement. Think of them as the main highway.
🔹 Layer 2 (The Express Lane): Scaling networks built on top of Layer 1s—like $ARB, OP, and POL. They bundle transactions off-chain to deliver faster speeds and lower gas fees.
💡 The Market Impact:
Because Layer 2s rely on Layer 1s for security, their price action is tightly linked to the base layer. Layer 2 tokens often act as high-beta plays—meaning steeper dips during market corrections, and sharper rebounds when momentum flips bullish.
Are you accumulating foundational Layer 1s on this dip, or hunting for high-beta Layer 2 plays? Drop your watchlist below! 👇
#CryptoTrading #Layer1 #Layer2Revolution #Altcoins #MarketPullback
1
68
·
--
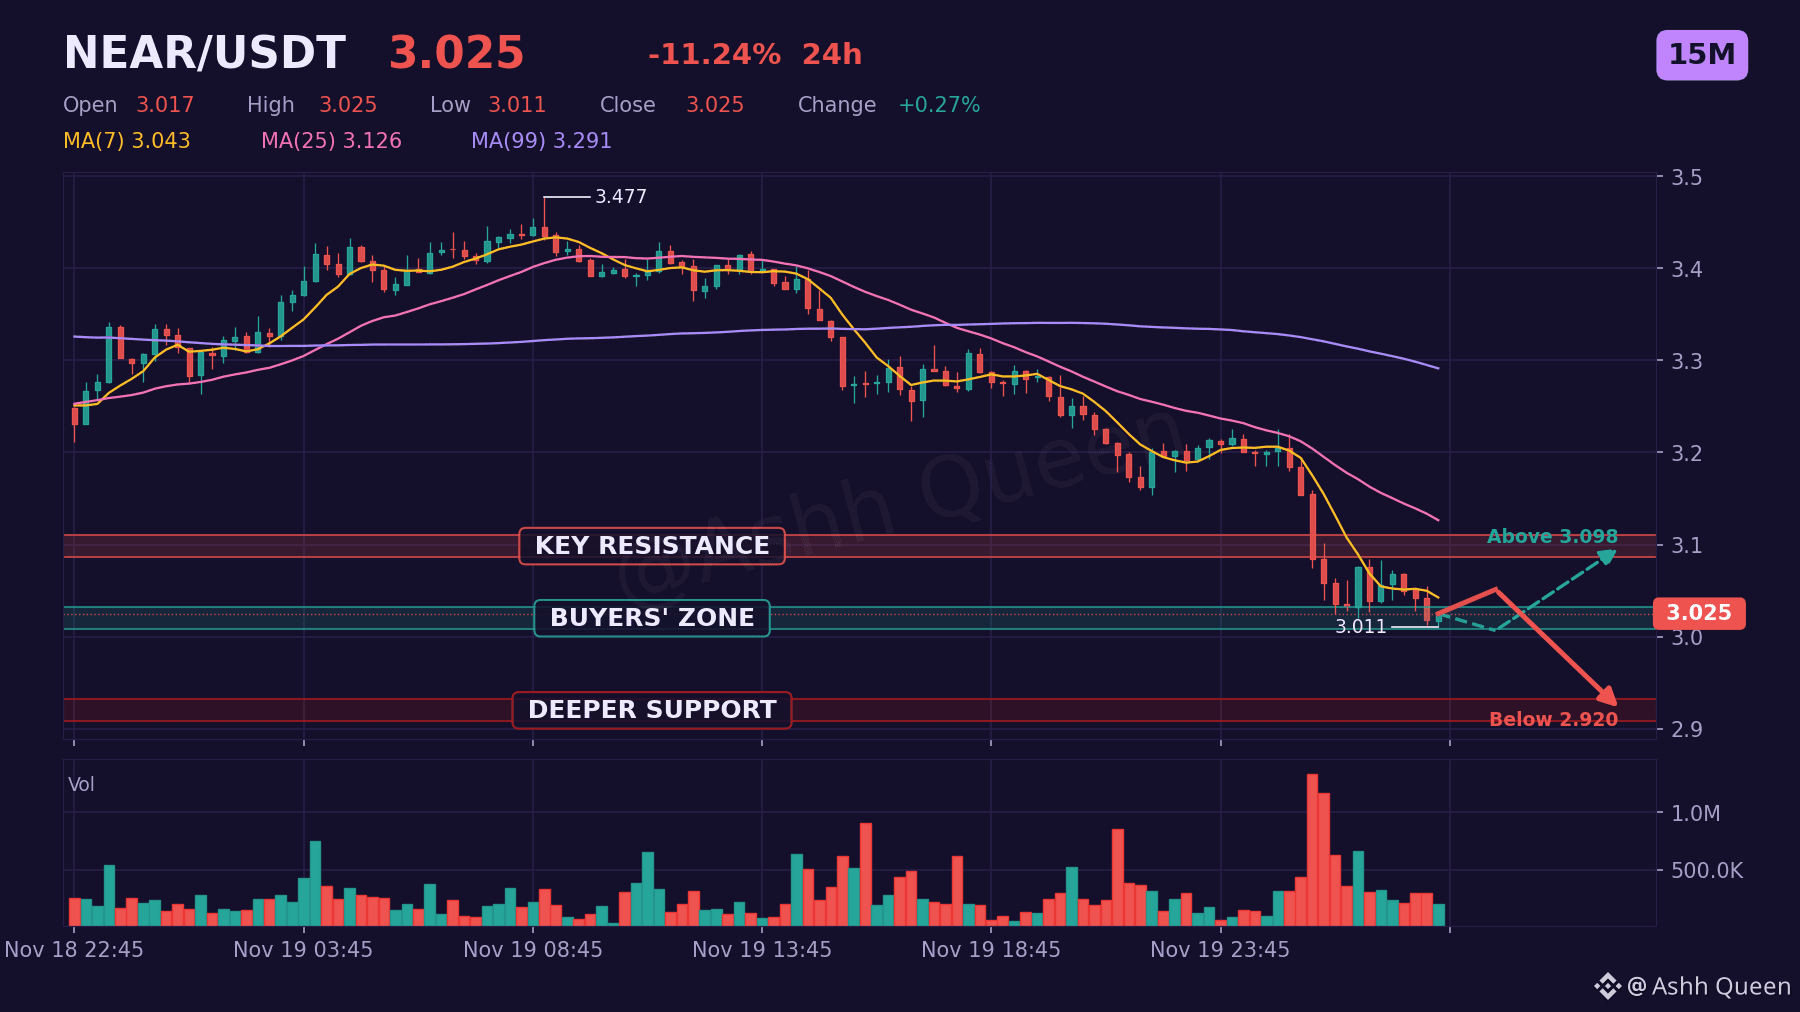
$NEAR is sliding toward the cliff edge on 15m.
Price at 3.025 remains trapped below EMA50 at 3.174 and VWAP at 3.090. Negative funding rate at -0.0019% with open interest at 54,622,944 suggests the market is leaning into a bearish trend, but sellers might be getting exhausted.
If support at 3.020 fails, look for further downward pressure. If it holds, a recovery toward resistance at 3.098 becomes the scenario to watch. 📊 📉
Do you prefer trading these bearish setups on the short or the longer timeframe?
#NEAR #Layer1 #NEARProtocol
This is analysis, not a recommendation. Manage risk first, profit second.
$NEAR is sliding toward the cliff edge on 15m.
Price at 3.025 remains trapped below EMA50 at 3.174 and VWAP at 3.090. Negative funding rate at -0.0019% with open interest at 54,622,944 suggests the market is leaning into a bearish trend, but sellers might be getting exhausted.
If support at 3.020 fails, look for further downward pressure. If it holds, a recovery toward resistance at 3.098 becomes the scenario to watch. 📊 📉
Do you prefer trading these bearish setups on the short or the longer timeframe?
#NEAR #Layer1 #NEARProtocol
This is analysis, not a recommendation. Manage risk first, profit second.
Price at 3.025 remains trapped below EMA50 at 3.174 and VWAP at 3.090. Negative funding rate at -0.0019% with open interest at 54,622,944 suggests the market is leaning into a bearish trend, but sellers might be getting exhausted.
If support at 3.020 fails, look for further downward pressure. If it holds, a recovery toward resistance at 3.098 becomes the scenario to watch. 📊 📉
Do you prefer trading these bearish setups on the short or the longer timeframe?
#NEAR #Layer1 #NEARProtocol
This is analysis, not a recommendation. Manage risk first, profit second.
62
·
--
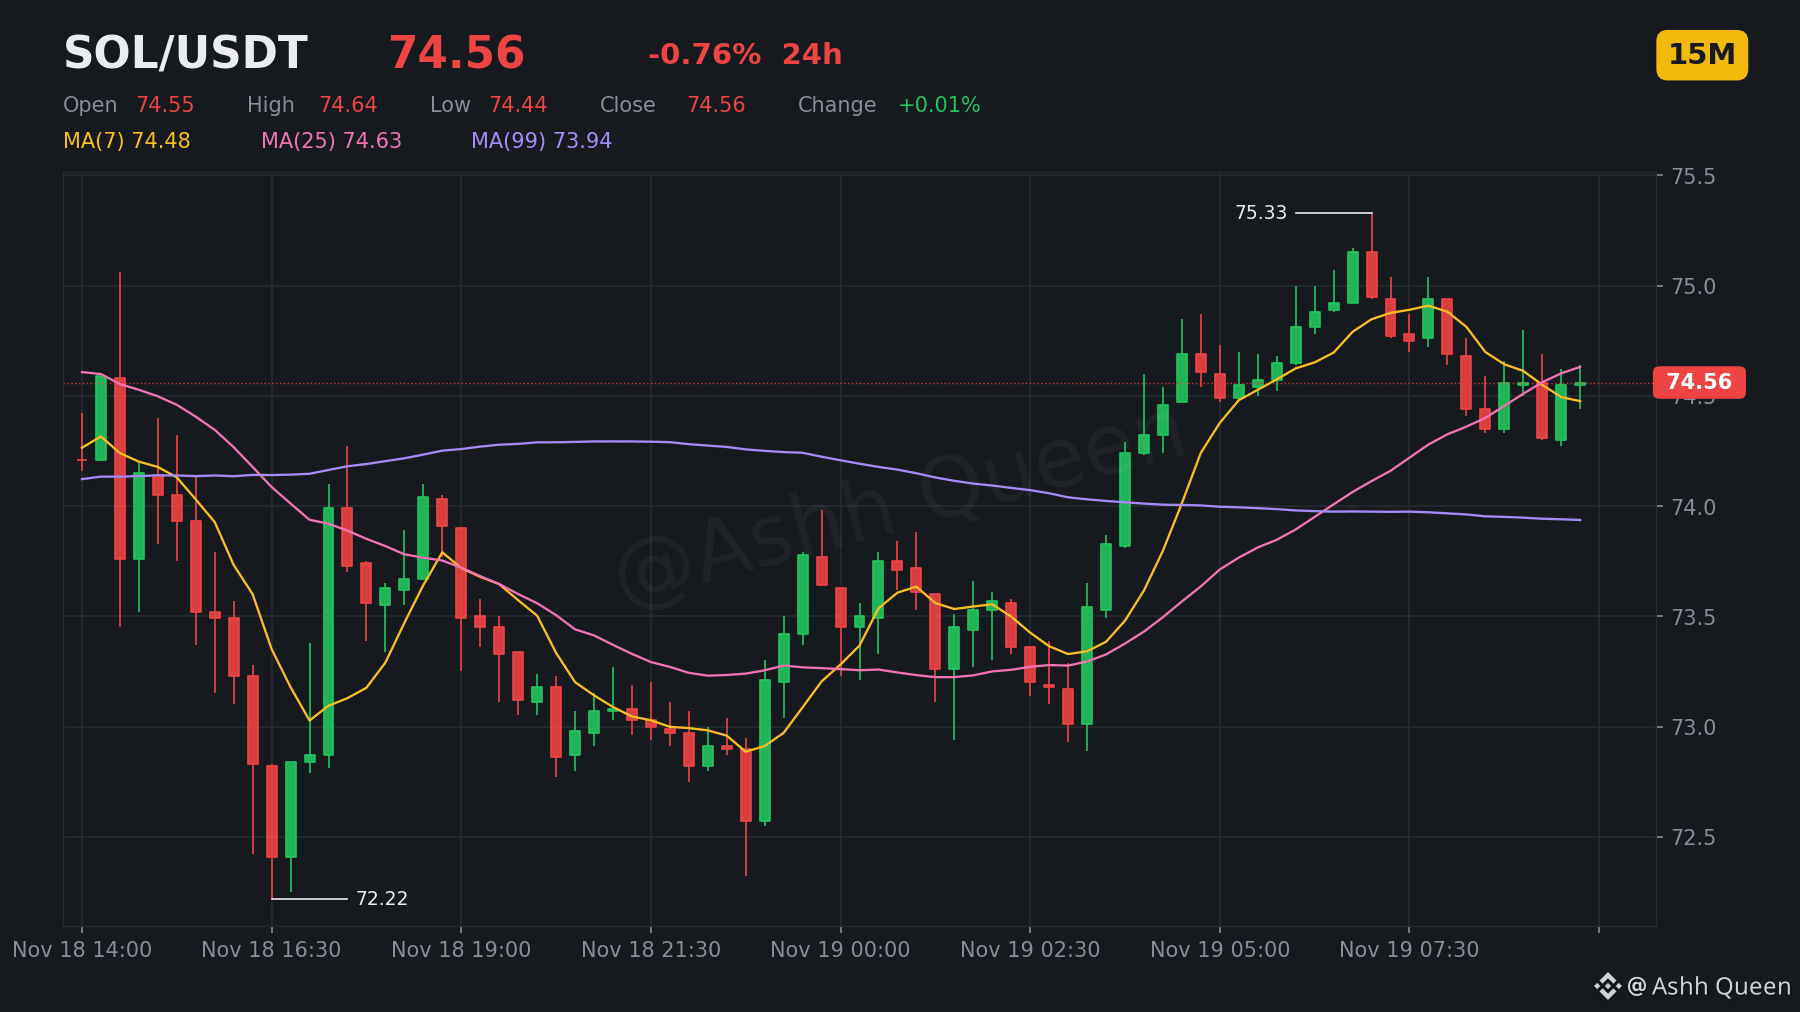
⚠️ $SOL is resting on a knife edge of technicals.
Price at 74.56 remains above EMA20 (74.51) and VWAP (74.09), keeping the structural trend intact for now. However, the lack of momentum in the MACD histogram suggests a mild cooling period.
If support at 74.31 holds, we could see a retest of resistance at 74.60. If $SOL breaks below, we look toward the Fib 74.14 level. 🧐
Risk management is the priority here 🛡️. Do you typically analyze this setup on the 15m or a longer timeframe?
#SOL #Layer1 #RiskManagement
Personal market view, not advice. Always do your own research before any trade.
⚠️ $SOL is resting on a knife edge of technicals.
Price at 74.56 remains above EMA20 (74.51) and VWAP (74.09), keeping the structural trend intact for now. However, the lack of momentum in the MACD histogram suggests a mild cooling period.
If support at 74.31 holds, we could see a retest of resistance at 74.60. If $SOL breaks below, we look toward the Fib 74.14 level. 🧐
Risk management is the priority here 🛡️. Do you typically analyze this setup on the 15m or a longer timeframe?
#SOL #Layer1 #RiskManagement
Personal market view, not advice. Always do your own research before any trade.
Price at 74.56 remains above EMA20 (74.51) and VWAP (74.09), keeping the structural trend intact for now. However, the lack of momentum in the MACD histogram suggests a mild cooling period.
If support at 74.31 holds, we could see a retest of resistance at 74.60. If $SOL breaks below, we look toward the Fib 74.14 level. 🧐
Risk management is the priority here 🛡️. Do you typically analyze this setup on the 15m or a longer timeframe?
#SOL #Layer1 #RiskManagement
Personal market view, not advice. Always do your own research before any trade.
2
·
--
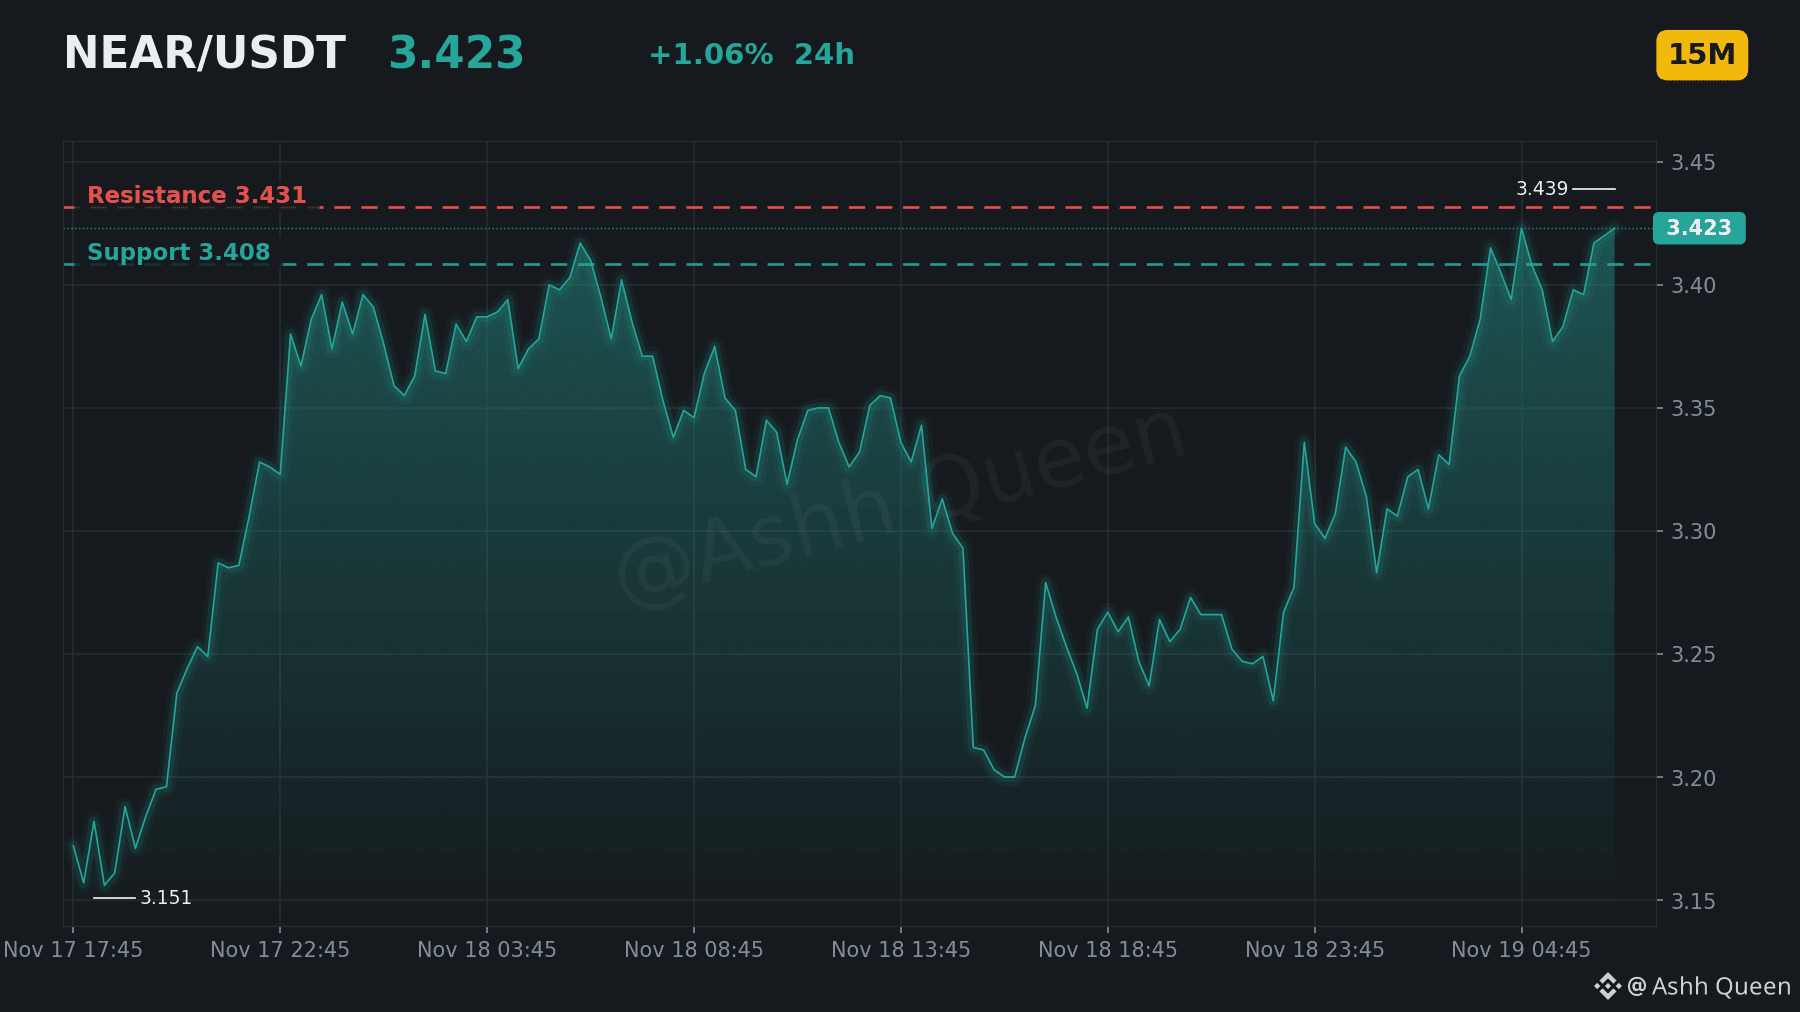
Most traders expect a cooldown on $NEAR, but the data suggests moderate bullish momentum is building instead. 🎯
Trend: Bullish above EMA50 (3.344).
Momentum: MACD histogram is positive with RSI at 64.99.
Key levels: Resistance at 3.431 and support at 3.408.
Opportunity: A breakout above resistance at 3.431 expands the upside.
Risk: A move below VWAP at 3.368 would invalidate the current setup for holders.
$NEAR is clearly respecting the trend, but the market remains cautious. 👀
Are you looking for a test of resistance at 3.431 or a pullback to support at 3.408? 🧭
#NEAR #Layer1 #BinanceSquare #NEARProtocol
Risk note: leverage magnifies losses. Plan the exit before the entry.
Most traders expect a cooldown on $NEAR , but the data suggests moderate bullish momentum is building instead. 🎯
Trend: Bullish above EMA50 (3.344).
Momentum: MACD histogram is positive with RSI at 64.99.
Key levels: Resistance at 3.431 and support at 3.408.
Opportunity: A breakout above resistance at 3.431 expands the upside.
Risk: A move below VWAP at 3.368 would invalidate the current setup for holders.
$NEAR is clearly respecting the trend, but the market remains cautious. 👀
Are you looking for a test of resistance at 3.431 or a pullback to support at 3.408? 🧭
#NEAR #Layer1 #BinanceSquare #NEARProtocol
Risk note: leverage magnifies losses. Plan the exit before the entry.
Trend: Bullish above EMA50 (3.344).
Momentum: MACD histogram is positive with RSI at 64.99.
Key levels: Resistance at 3.431 and support at 3.408.
Opportunity: A breakout above resistance at 3.431 expands the upside.
Risk: A move below VWAP at 3.368 would invalidate the current setup for holders.
$NEAR is clearly respecting the trend, but the market remains cautious. 👀
Are you looking for a test of resistance at 3.431 or a pullback to support at 3.408? 🧭
#NEAR #Layer1 #BinanceSquare #NEARProtocol
Risk note: leverage magnifies losses. Plan the exit before the entry.
7

$LUNC SURGES +23%! OVER 5.5M VOL LAYER 1 / LAYER 2 GAINER WITH STRONG TRAILING SAR SUPPORT AT $0.00004546 — RSI AT 66.45 TARGETING A BREAKOUT PAST $0.00004949 PEAK HIGH FOR $0.00005200+ EXPANSION?
Binance Layer 1 / Layer 2 top gainers are maintaining strong bullish momentum in today's mid-day session! LUNC (Terra Classic) has logged an impressive +23.49% daily surge, backed by 5.58M USDT (126.35B $LUNC) in 24-hour trading volume!
After bottoming at 0.00003814 and holding higher-low swing support at 0.00004196, price action launched a strong stair-step green rally to test a 24-hour peak high of 0.00004949. Following a brief healthy higher-low pullback, $LUNC is holding firm bullish momentum right near the top of its range at 0.00004820.
Master Scalp Setup & Strategic Levels:
Trade Bias: Strong Bullish Continuation / Scalp Long
Accumulation Entry Zone: 0.00004641 – 0.00004820 (Trailing SAR dynamic support range)
Key Targets: 0.00004949 ➡️ 0.00005150 ➡️ 0.00005400 (24h Peak Breakout & Psychological $0.000050+ Expansion)
Stop Loss: Below 0.00004500
Why This Setup is Primed for Expansion:
Dynamic Parabolic SAR Trailing Support: Parabolic SAR dots on the 15m chart continue to lock firm dynamic trailing support directly beneath price candles at 0.00004546, confirming strong upward trend structure.
Healthy RSI Bullish Momentum: The 15m RSI (6) sits at a super strong 66.45, maintaining solid buying momentum without extreme overbought exhaustion. A decisive 15m candle close above 0.00004949 clears the psychological $0.00005000 barrier for rapid expansion toward $0.00005150+.
Are you taking a long scalp entry on LUNC at this $0.00004641–$0.00004820 support base, or waiting for a breakout close above $0.00004949? Share your strategy in the comments below!
Trade Now $LUNC
{spot}(LUNCUSDT)
#LUNC #TerraClassic #Layer1
$LUNC SURGES +23%! OVER 5.5M VOL LAYER 1 / LAYER 2 GAINER WITH STRONG TRAILING SAR SUPPORT AT $0.00004546 — RSI AT 66.45 TARGETING A BREAKOUT PAST $0.00004949 PEAK HIGH FOR $0.00005200+ EXPANSION?
Binance Layer 1 / Layer 2 top gainers are maintaining strong bullish momentum in today's mid-day session! LUNC (Terra Classic) has logged an impressive +23.49% daily surge, backed by 5.58M USDT (126.35B $LUNC ) in 24-hour trading volume!
After bottoming at 0.00003814 and holding higher-low swing support at 0.00004196, price action launched a strong stair-step green rally to test a 24-hour peak high of 0.00004949. Following a brief healthy higher-low pullback, $LUNC is holding firm bullish momentum right near the top of its range at 0.00004820.
Master Scalp Setup & Strategic Levels:
Trade Bias: Strong Bullish Continuation / Scalp Long
Accumulation Entry Zone: 0.00004641 – 0.00004820 (Trailing SAR dynamic support range)
Key Targets: 0.00004949 ➡️ 0.00005150 ➡️ 0.00005400 (24h Peak Breakout & Psychological $0.000050+ Expansion)
Stop Loss: Below 0.00004500
Why This Setup is Primed for Expansion:
Dynamic Parabolic SAR Trailing Support: Parabolic SAR dots on the 15m chart continue to lock firm dynamic trailing support directly beneath price candles at 0.00004546, confirming strong upward trend structure.
Healthy RSI Bullish Momentum: The 15m RSI (6) sits at a super strong 66.45, maintaining solid buying momentum without extreme overbought exhaustion. A decisive 15m candle close above 0.00004949 clears the psychological $0.00005000 barrier for rapid expansion toward $0.00005150+.
Are you taking a long scalp entry on LUNC at this $0.00004641–$0.00004820 support base, or waiting for a breakout close above $0.00004949? Share your strategy in the comments below!
Trade Now $LUNC
#LUNC #TerraClassic #Layer1
Binance Layer 1 / Layer 2 top gainers are maintaining strong bullish momentum in today's mid-day session! LUNC (Terra Classic) has logged an impressive +23.49% daily surge, backed by 5.58M USDT (126.35B $LUNC ) in 24-hour trading volume!
After bottoming at 0.00003814 and holding higher-low swing support at 0.00004196, price action launched a strong stair-step green rally to test a 24-hour peak high of 0.00004949. Following a brief healthy higher-low pullback, $LUNC is holding firm bullish momentum right near the top of its range at 0.00004820.
Master Scalp Setup & Strategic Levels:
Trade Bias: Strong Bullish Continuation / Scalp Long
Accumulation Entry Zone: 0.00004641 – 0.00004820 (Trailing SAR dynamic support range)
Key Targets: 0.00004949 ➡️ 0.00005150 ➡️ 0.00005400 (24h Peak Breakout & Psychological $0.000050+ Expansion)
Stop Loss: Below 0.00004500
Why This Setup is Primed for Expansion:
Dynamic Parabolic SAR Trailing Support: Parabolic SAR dots on the 15m chart continue to lock firm dynamic trailing support directly beneath price candles at 0.00004546, confirming strong upward trend structure.
Healthy RSI Bullish Momentum: The 15m RSI (6) sits at a super strong 66.45, maintaining solid buying momentum without extreme overbought exhaustion. A decisive 15m candle close above 0.00004949 clears the psychological $0.00005000 barrier for rapid expansion toward $0.00005150+.
Are you taking a long scalp entry on LUNC at this $0.00004641–$0.00004820 support base, or waiting for a breakout close above $0.00004949? Share your strategy in the comments below!
Trade Now $LUNC
#LUNC #TerraClassic #Layer1
1
1
366
Institutional portfolio adjustments are always fascinating to watch unfold. CoinShares recently trimming its entire Ethereum position alongside half its Solana holdings highlights a distinct strategic pivot. Rather than signaling a lack of long-term faith, moves like this often reflect aggressive rebalancing to lock in gains, manage risk, or fund fresh market opportunities. Large players constantly rotate capital to stay nimble. How are you adjusting your own strategy as institutional capital shifts across major layer-1 networks this month? $ETH $SOL #Ethereum #CryptoTrading #Layer1
Institutional portfolio adjustments are always fascinating to watch unfold. CoinShares recently trimming its entire Ethereum position alongside half its Solana holdings highlights a distinct strategic pivot. Rather than signaling a lack of long-term faith, moves like this often reflect aggressive rebalancing to lock in gains, manage risk, or fund fresh market opportunities. Large players constantly rotate capital to stay nimble. How are you adjusting your own strategy as institutional capital shifts across major layer-1 networks this month? $ETH $SOL #Ethereum #CryptoTrading #Layer1
62

·
--
🔥 YOU HAVE $10,000 TO INVEST IN ONE LAYER 1 PROJECT FOR THE NEXT 3 YEARS! 🚀
Which one would you bet on for the biggest potential growth?
🔹 $SOL
🔹 $SUI
🔹 $AVAX
🔹 $NEAR
🔹 $SEI
👀 No splitting. No second choice. Just ONE winner!
Which coin gets your entire $10K allocation? 💰👇
#Crypto #Altcoins #Layer1 #BinanceSquare
🔥 YOU HAVE $10,000 TO INVEST IN ONE LAYER 1 PROJECT FOR THE NEXT 3 YEARS! 🚀
Which one would you bet on for the biggest potential growth?
🔹 $SOL
🔹 $SUI
🔹 $AVAX
🔹 $NEAR
🔹 $SEI
👀 No splitting. No second choice. Just ONE winner!
Which coin gets your entire $10K allocation? 💰👇
#Crypto #Altcoins #Layer1 #BinanceSquare
Which one would you bet on for the biggest potential growth?
🔹 $SOL
🔹 $SUI
🔹 $AVAX
🔹 $NEAR
🔹 $SEI
👀 No splitting. No second choice. Just ONE winner!
Which coin gets your entire $10K allocation? 💰👇
#Crypto #Altcoins #Layer1 #BinanceSquare

2
188

·
--
Bullish
🐉 $ETH at $1,766, the Layer 1 leader sitting 64% below its ATH. Is this the fear zone bottom, or just a pause?
👉 Ethereum is the largest smart contract platform, home to most DeFi, stablecoins and tokenized assets.
👉 Price $1,768.87, down 2.18% in 24h, down 13.96% in 7 days and down 26.27% in 30 days.
👉 Market cap $216.2B, rank 2, fully diluted valuation equal to market cap with the full 122.2M supply circulating.
👉 24h volume $10.91B, 24h range $1,753.07 to $1,832.10.
👉 ATH $4,946.05 (Aug 2025), current price 64.24% below it.
👉 Strengths: deepest liquidity among altcoins, the settlement layer for stablecoins and RWAs, and institutional exposure through spot ETFs.
Entry: $1,766
TP1: $1,942.60
TP2: $2,119.20
TP3: $2,295.80
TP4: $2,472.40
TP5: $2,649.00
SL: $1,600
#BinanceSquare #Ethereum #Layer1
{future}(ETHUSDT)
🐉 $ETH at $1,766, the Layer 1 leader sitting 64% below its ATH. Is this the fear zone bottom, or just a pause?
👉 Ethereum is the largest smart contract platform, home to most DeFi, stablecoins and tokenized assets.
👉 Price $1,768.87, down 2.18% in 24h, down 13.96% in 7 days and down 26.27% in 30 days.
👉 Market cap $216.2B, rank 2, fully diluted valuation equal to market cap with the full 122.2M supply circulating.
👉 24h volume $10.91B, 24h range $1,753.07 to $1,832.10.
👉 ATH $4,946.05 (Aug 2025), current price 64.24% below it.
👉 Strengths: deepest liquidity among altcoins, the settlement layer for stablecoins and RWAs, and institutional exposure through spot ETFs.
Entry: $1,766
TP1: $1,942.60
TP2: $2,119.20
TP3: $2,295.80
TP4: $2,472.40
TP5: $2,649.00
SL: $1,600
#BinanceSquare #Ethereum #Layer1
👉 Ethereum is the largest smart contract platform, home to most DeFi, stablecoins and tokenized assets.
👉 Price $1,768.87, down 2.18% in 24h, down 13.96% in 7 days and down 26.27% in 30 days.
👉 Market cap $216.2B, rank 2, fully diluted valuation equal to market cap with the full 122.2M supply circulating.
👉 24h volume $10.91B, 24h range $1,753.07 to $1,832.10.
👉 ATH $4,946.05 (Aug 2025), current price 64.24% below it.
👉 Strengths: deepest liquidity among altcoins, the settlement layer for stablecoins and RWAs, and institutional exposure through spot ETFs.
Entry: $1,766
TP1: $1,942.60
TP2: $2,119.20
TP3: $2,295.80
TP4: $2,472.40
TP5: $2,649.00
SL: $1,600
#BinanceSquare #Ethereum #Layer1
802

NEAR Holds Steady Above 3.35 as Buyers Defend the Dip
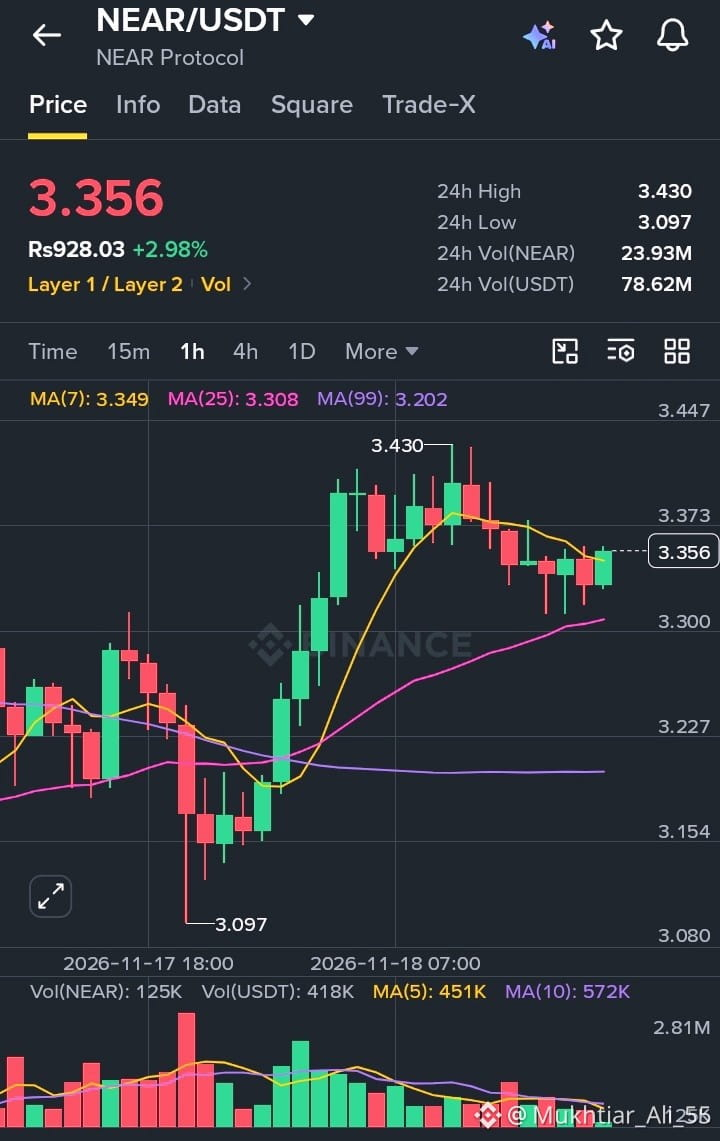
NEAR Protocol is showing a calmer, more controlled move compared to the wild swings elsewhere in the market today. NEAR/USDT is trading at 3.356, up 2.98% over the last 24 hours, and the 1-hour chart shows a market that is consolidating rather than panicking.
The 24h range sits between a low of 3.097 and a high of 3.430. Trading activity remains healthy, with 23.93M NEAR changing hands, roughly 78.62M USDT in volume.
What stands out on the chart:
A clean recovery from the lows. After dipping to 3.097, NEAR bounced hard with a run of strong green candles, pushing price up to the 3.430 high.
Price is respecting the moving averages. The MA(7) at 3.349 is right at the current price, while the MA(25) at 3.308 and MA(99) at 3.202 sit below, which keeps the short-term structure bullish.
Healthy cooling, not a collapse. The recent candles are small, and price has pulled back only slightly from the high. Volume has also eased, which usually points to consolidation rather than aggressive selling.
My take: The key area to watch is the 3.30 to 3.31 zone, where the MA(25) is acting as support. If buyers keep defending it, another test of 3.43 is possible, and a clean break above could open the door to higher levels. If it fails, a drop back toward 3.20 would be the next area of interest. Patience is the best strategy here, so let the price confirm its direction before making a move.
#NEAR #NEARProtocol #Binance #CryptoTrading #Layer1
$NEAR
{spot}(NEARUSDT)
NEAR Holds Steady Above 3.35 as Buyers Defend the Dip
NEAR Protocol is showing a calmer, more controlled move compared to the wild swings elsewhere in the market today. NEAR/USDT is trading at 3.356, up 2.98% over the last 24 hours, and the 1-hour chart shows a market that is consolidating rather than panicking.
The 24h range sits between a low of 3.097 and a high of 3.430. Trading activity remains healthy, with 23.93M NEAR changing hands, roughly 78.62M USDT in volume.
What stands out on the chart:
A clean recovery from the lows. After dipping to 3.097, NEAR bounced hard with a run of strong green candles, pushing price up to the 3.430 high.
Price is respecting the moving averages. The MA(7) at 3.349 is right at the current price, while the MA(25) at 3.308 and MA(99) at 3.202 sit below, which keeps the short-term structure bullish.
Healthy cooling, not a collapse. The recent candles are small, and price has pulled back only slightly from the high. Volume has also eased, which usually points to consolidation rather than aggressive selling.
My take: The key area to watch is the 3.30 to 3.31 zone, where the MA(25) is acting as support. If buyers keep defending it, another test of 3.43 is possible, and a clean break above could open the door to higher levels. If it fails, a drop back toward 3.20 would be the next area of interest. Patience is the best strategy here, so let the price confirm its direction before making a move.
#NEAR #NEARProtocol #Binance #CryptoTrading #Layer1
$NEAR
NEAR Protocol is showing a calmer, more controlled move compared to the wild swings elsewhere in the market today. NEAR/USDT is trading at 3.356, up 2.98% over the last 24 hours, and the 1-hour chart shows a market that is consolidating rather than panicking.
The 24h range sits between a low of 3.097 and a high of 3.430. Trading activity remains healthy, with 23.93M NEAR changing hands, roughly 78.62M USDT in volume.
What stands out on the chart:
A clean recovery from the lows. After dipping to 3.097, NEAR bounced hard with a run of strong green candles, pushing price up to the 3.430 high.
Price is respecting the moving averages. The MA(7) at 3.349 is right at the current price, while the MA(25) at 3.308 and MA(99) at 3.202 sit below, which keeps the short-term structure bullish.
Healthy cooling, not a collapse. The recent candles are small, and price has pulled back only slightly from the high. Volume has also eased, which usually points to consolidation rather than aggressive selling.
My take: The key area to watch is the 3.30 to 3.31 zone, where the MA(25) is acting as support. If buyers keep defending it, another test of 3.43 is possible, and a clean break above could open the door to higher levels. If it fails, a drop back toward 3.20 would be the next area of interest. Patience is the best strategy here, so let the price confirm its direction before making a move.
#NEAR #NEARProtocol #Binance #CryptoTrading #Layer1
$NEAR
1
49

·
--
Layer 1 blockchains differ in how they achieve consensus and scale. $BTC uses Proof of Work with 10-minute blocks and roughly 7 transactions per second. Its design prioritizes security and decentralization above throughput. $ETH moved to Proof of Stake in 2022. The base layer handles about 15 transactions per second. Scaling now happens through rollups like Arbitrum and Optimism, which bundle hundreds of transactions into one proof. $SOL uses Proof of History combined with Proof of Stake. This timestamps transactions before consensus, enabling 65,000 theoretical transactions per second with 400-millisecond block times. The trade-off is higher hardware requirements for validators. Near Protocol shards its chain into chunks, processing transactions in parallel. Each shard produces blocks every second. Avalanche uses a novel consensus called Snowman that reaches finality in under two seconds across three built-in chains. Each architecture makes different trade-offs between decentralization, security, and scalability. No single design solves everything. Blockchain #Layer1 #Consensus #Scaling
Layer 1 blockchains differ in how they achieve consensus and scale. $BTC uses Proof of Work with 10-minute blocks and roughly 7 transactions per second. Its design prioritizes security and decentralization above throughput. $ETH moved to Proof of Stake in 2022. The base layer handles about 15 transactions per second. Scaling now happens through rollups like Arbitrum and Optimism, which bundle hundreds of transactions into one proof. $SOL uses Proof of History combined with Proof of Stake. This timestamps transactions before consensus, enabling 65,000 theoretical transactions per second with 400-millisecond block times. The trade-off is higher hardware requirements for validators. Near Protocol shards its chain into chunks, processing transactions in parallel. Each shard produces blocks every second. Avalanche uses a novel consensus called Snowman that reaches finality in under two seconds across three built-in chains. Each architecture makes different trade-offs between decentralization, security, and scalability. No single design solves everything. Blockchain #Layer1 #Consensus #Scaling
38
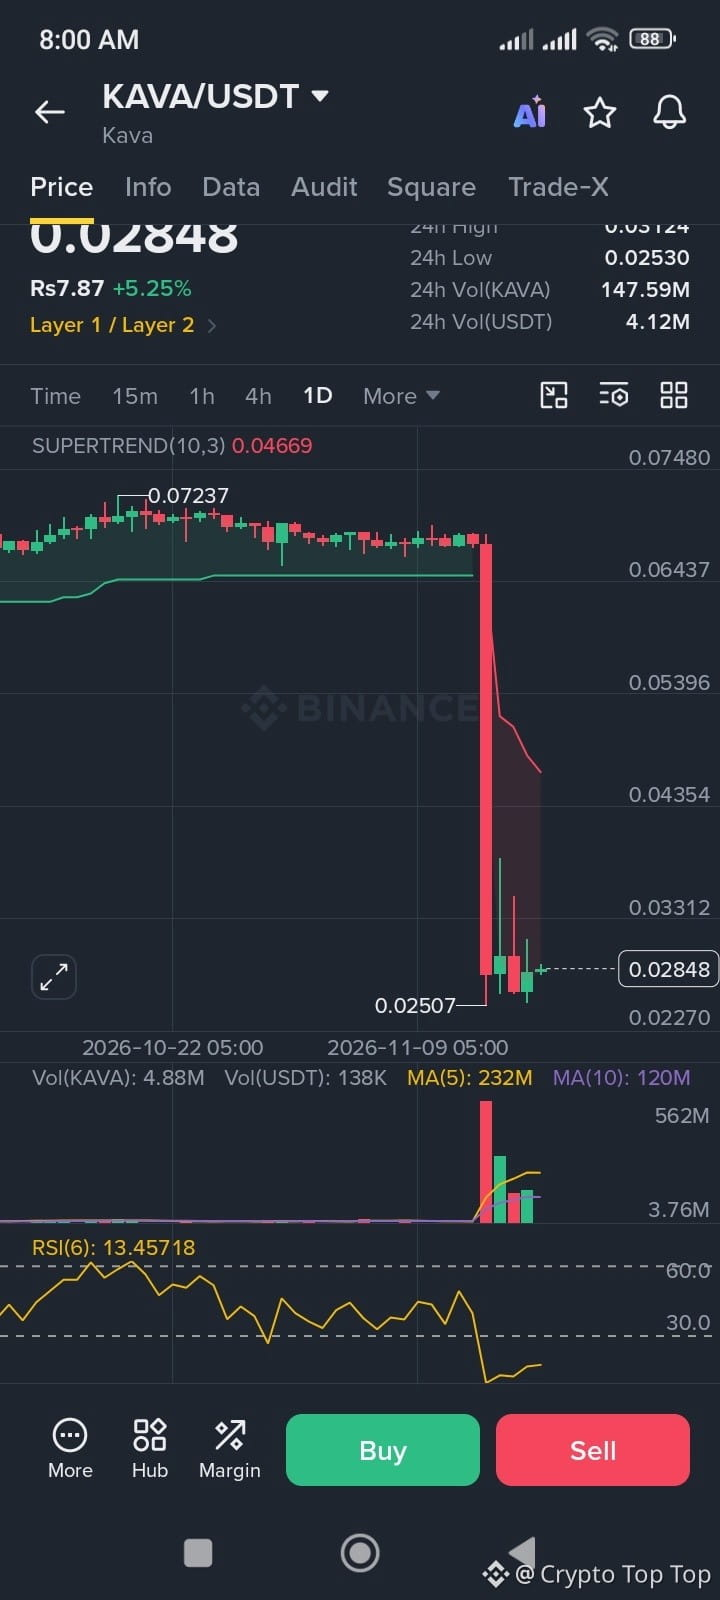
⚡ Kava ($KAVA ) Market Update: Post-Crash Stabilization & Oversold Bounce
Kava ($KAVA ) is attempting to stabilize around $0.02848 (+5.25%) after suffering a steep capitulation drop from the $0.065 zone to a fresh low of $0.02507. Heavy volume and extreme oversold readings are drawing short-term bounce traders to the chart.
🔍 Project Overview:
Kava is a decentralized Layer-1 blockchain combining the speed and interoperability of the Cosmos SDK with the developer power of Ethereum (EVM) via its unique co-chain architecture. Backed by zero-inflation tokenomics, $KAVA powers network security, governance, DeFi liquidity, and expanding decentralized AI infrastructure.
📊 Key Metrics & Technicals (1D):
Current Price: $0.02848
24h Low / Vol: $0.02530 / 4.12M USDT (147.59M KAVA)
Chart Setup: Following the sharp sell-off, daily RSI(6) sits deep in oversold territory at ~13.45, signaling seller exhaustion and room for a relief bounce. Holding the $0.0250 support base is critical, while Supertrend resistance looms overhead at $0.04669.
Trade the volatility carefully, watch key support levels, and always DYOR!
#KAVA #KAVA #Layer1
{spot}(KAVAUSDT)
#BinanceSquare #CryptoAnalysis
⚡ Kava ($KAVA ) Market Update: Post-Crash Stabilization & Oversold Bounce
Kava ($KAVA ) is attempting to stabilize around $0.02848 (+5.25%) after suffering a steep capitulation drop from the $0.065 zone to a fresh low of $0.02507. Heavy volume and extreme oversold readings are drawing short-term bounce traders to the chart.
🔍 Project Overview:
Kava is a decentralized Layer-1 blockchain combining the speed and interoperability of the Cosmos SDK with the developer power of Ethereum (EVM) via its unique co-chain architecture. Backed by zero-inflation tokenomics, $KAVA powers network security, governance, DeFi liquidity, and expanding decentralized AI infrastructure.
📊 Key Metrics & Technicals (1D):
Current Price: $0.02848
24h Low / Vol: $0.02530 / 4.12M USDT (147.59M KAVA)
Chart Setup: Following the sharp sell-off, daily RSI(6) sits deep in oversold territory at ~13.45, signaling seller exhaustion and room for a relief bounce. Holding the $0.0250 support base is critical, while Supertrend resistance looms overhead at $0.04669.
Trade the volatility carefully, watch key support levels, and always DYOR!
#KAVA #KAVA #Layer1
#BinanceSquare #CryptoAnalysis
Kava ($KAVA ) is attempting to stabilize around $0.02848 (+5.25%) after suffering a steep capitulation drop from the $0.065 zone to a fresh low of $0.02507. Heavy volume and extreme oversold readings are drawing short-term bounce traders to the chart.
🔍 Project Overview:
Kava is a decentralized Layer-1 blockchain combining the speed and interoperability of the Cosmos SDK with the developer power of Ethereum (EVM) via its unique co-chain architecture. Backed by zero-inflation tokenomics, $KAVA powers network security, governance, DeFi liquidity, and expanding decentralized AI infrastructure.
📊 Key Metrics & Technicals (1D):
Current Price: $0.02848
24h Low / Vol: $0.02530 / 4.12M USDT (147.59M KAVA)
Chart Setup: Following the sharp sell-off, daily RSI(6) sits deep in oversold territory at ~13.45, signaling seller exhaustion and room for a relief bounce. Holding the $0.0250 support base is critical, while Supertrend resistance looms overhead at $0.04669.
Trade the volatility carefully, watch key support levels, and always DYOR!
#KAVA #KAVA #Layer1
#BinanceSquare #CryptoAnalysis
642

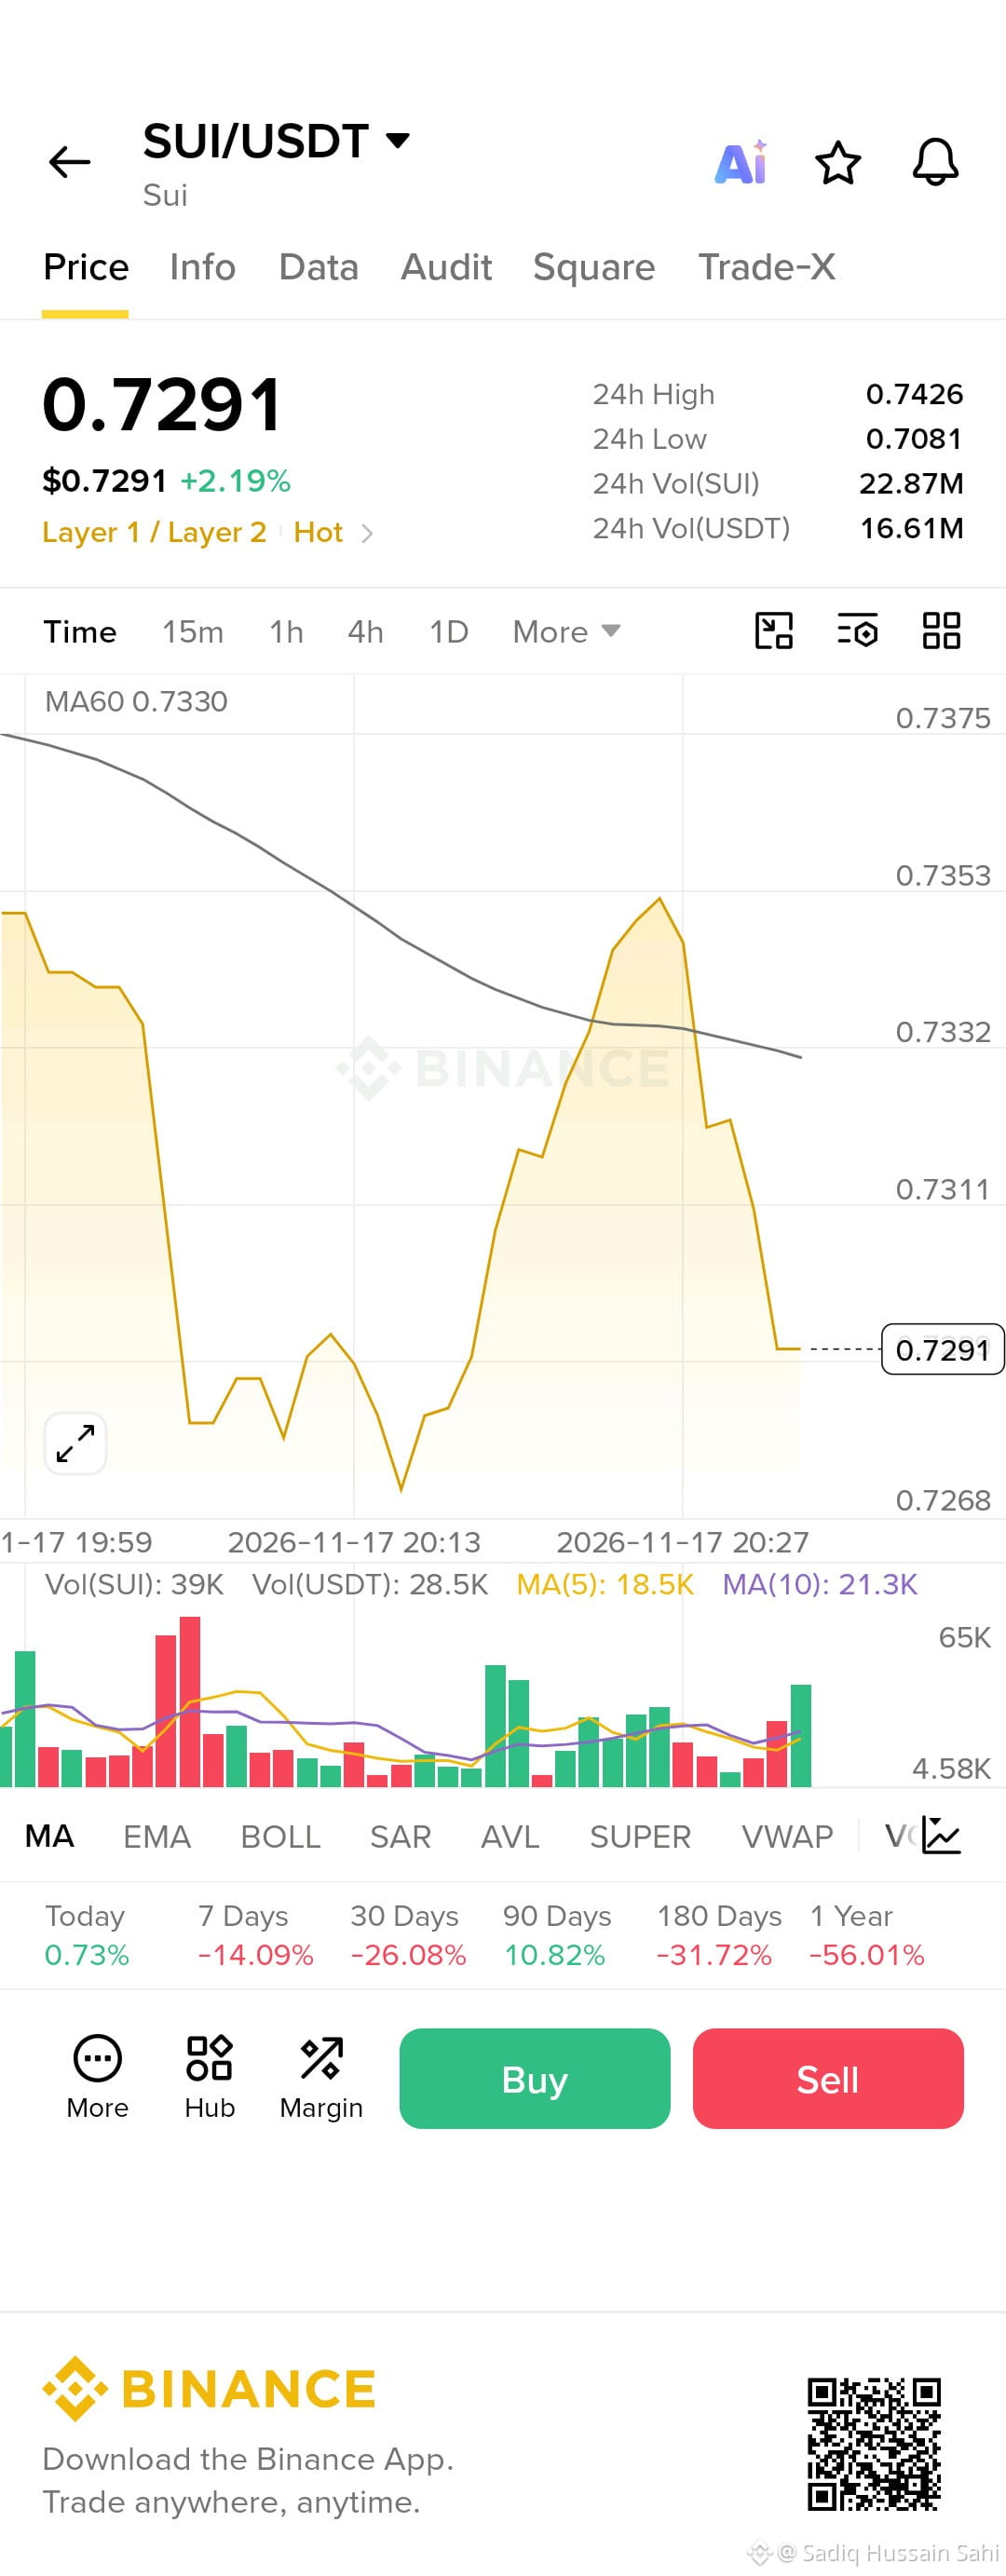
🚨🔥 $SUI IS MOVING... ARE YOU WATCHING? 💧
Price: $0.7291 (+2.19% in 24h) 🟢
📊 24h High: 0.7426 | Low: 0.7081
💰 24h Volume: 16.61M USDT
📈 What the chart says:
🔹 Strong bounce from the 0.7268 zone
🔹 Buyers pushed price up to 0.7353 before profit-taking
🔹 Volume spikes on green candles = buyers are active 👀
🔹 MA60 at 0.7330 is the key level to reclaim
⚠️ Reality check:
7D: -14.09% | 30D: -26.08% 🔴
But 90D: +10.82% 🟢. The bigger picture is still a battle between bulls and bears!
🎯 Reclaim 0.7330 = bullish momentum could build 🚀
🛑 Lose 0.7081 = bears take control 🐻
💡 Smart traders watch levels, not emotions.
⚠️ Don't FOMO. Always DYOR and manage your risk. Not financial advice.
💬 Bullish or Bearish on $SUI? Drop your target below! 👇
#crypto #CryptoTrading #Altcoins #Layer1 #Investing
{spot}(SUIUSDT)
🚨🔥 $SUI IS MOVING... ARE YOU WATCHING? 💧
Price: $0.7291 (+2.19% in 24h) 🟢
📊 24h High: 0.7426 | Low: 0.7081
💰 24h Volume: 16.61M USDT
📈 What the chart says:
🔹 Strong bounce from the 0.7268 zone
🔹 Buyers pushed price up to 0.7353 before profit-taking
🔹 Volume spikes on green candles = buyers are active 👀
🔹 MA60 at 0.7330 is the key level to reclaim
⚠️ Reality check:
7D: -14.09% | 30D: -26.08% 🔴
But 90D: +10.82% 🟢. The bigger picture is still a battle between bulls and bears!
🎯 Reclaim 0.7330 = bullish momentum could build 🚀
🛑 Lose 0.7081 = bears take control 🐻
💡 Smart traders watch levels, not emotions.
⚠️ Don't FOMO. Always DYOR and manage your risk. Not financial advice.
💬 Bullish or Bearish on $SUI ? Drop your target below! 👇
#crypto #CryptoTrading #Altcoins #Layer1 #Investing
Price: $0.7291 (+2.19% in 24h) 🟢
📊 24h High: 0.7426 | Low: 0.7081
💰 24h Volume: 16.61M USDT
📈 What the chart says:
🔹 Strong bounce from the 0.7268 zone
🔹 Buyers pushed price up to 0.7353 before profit-taking
🔹 Volume spikes on green candles = buyers are active 👀
🔹 MA60 at 0.7330 is the key level to reclaim
⚠️ Reality check:
7D: -14.09% | 30D: -26.08% 🔴
But 90D: +10.82% 🟢. The bigger picture is still a battle between bulls and bears!
🎯 Reclaim 0.7330 = bullish momentum could build 🚀
🛑 Lose 0.7081 = bears take control 🐻
💡 Smart traders watch levels, not emotions.
⚠️ Don't FOMO. Always DYOR and manage your risk. Not financial advice.
💬 Bullish or Bearish on $SUI ? Drop your target below! 👇
#crypto #CryptoTrading #Altcoins #Layer1 #Investing
149

·
--
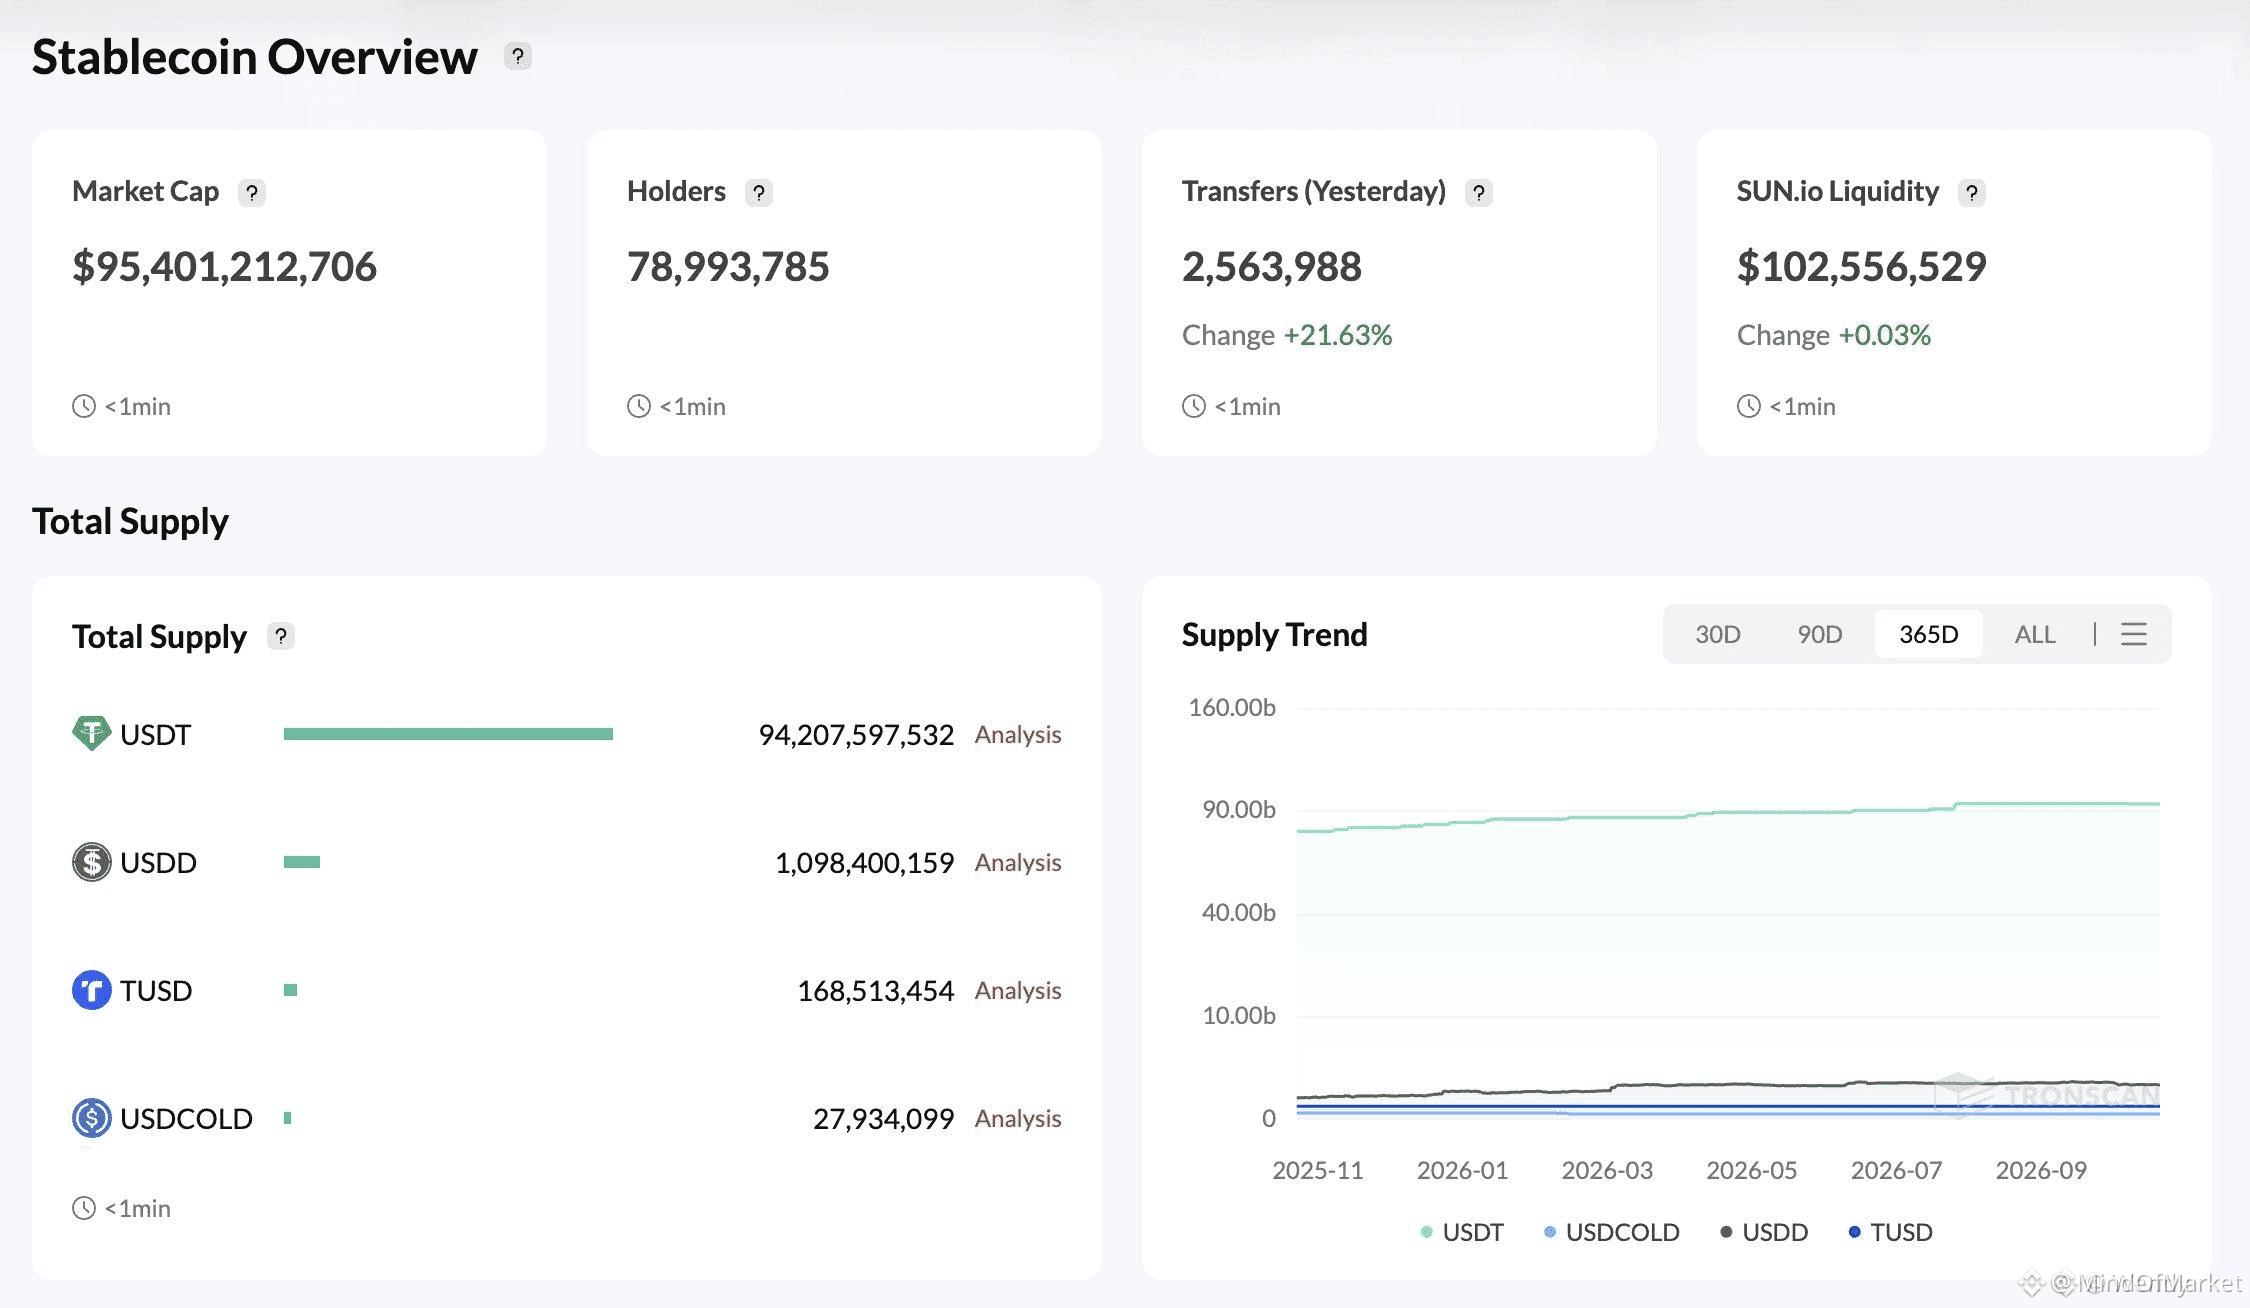
🦈 $TRX NETWORK LIQUIDITY SURGES PAST 95 BILLION IN ACTIVE STABLECOIN CAPITAL! 🚀
Institutional capital concentration on the network is telling a clear structural story, with total stablecoin settlement velocity expanding aggressively alongside 2.56 million daily transfers up over twenty percent. 📊
This continuous liquidity expansion across ninety-five billion in active supply highlights robust organic utility rather than speculative froth, cementing deep institutional settlement footprints. 💡
Are you positioning your portfolio around layer-1 networks capturing real structural volume, or sticking to high-beta speculation? 🤔
⚠️ Not financial advice. Always manage your risk. 🛡️
🏷️ #TRX #Stablecoins #Crypto #Layer1
🦈 ⚖️
🦈 $TRX NETWORK LIQUIDITY SURGES PAST 95 BILLION IN ACTIVE STABLECOIN CAPITAL! 🚀
Institutional capital concentration on the network is telling a clear structural story, with total stablecoin settlement velocity expanding aggressively alongside 2.56 million daily transfers up over twenty percent. 📊
This continuous liquidity expansion across ninety-five billion in active supply highlights robust organic utility rather than speculative froth, cementing deep institutional settlement footprints. 💡
Are you positioning your portfolio around layer-1 networks capturing real structural volume, or sticking to high-beta speculation? 🤔
⚠️ Not financial advice. Always manage your risk. 🛡️
🏷️ #TRX #Stablecoins #Crypto #Layer1
🦈 ⚖️
Institutional capital concentration on the network is telling a clear structural story, with total stablecoin settlement velocity expanding aggressively alongside 2.56 million daily transfers up over twenty percent. 📊
This continuous liquidity expansion across ninety-five billion in active supply highlights robust organic utility rather than speculative froth, cementing deep institutional settlement footprints. 💡
Are you positioning your portfolio around layer-1 networks capturing real structural volume, or sticking to high-beta speculation? 🤔
⚠️ Not financial advice. Always manage your risk. 🛡️
🏷️ #TRX #Stablecoins #Crypto #Layer1
🦈 ⚖️
5
Log in to explore more content
Join global crypto users on Binance Square
⚡️ Get latest and useful information about crypto.
💬 Trusted by the world’s largest crypto exchange.
👍 Discover real insights from verified creators.
Email / Phone number
Trending Topics
1
#CanBTCReboundAfterFallingBelow60K?
388,957 views
1,699 Discussing
2
#GlobalStocksFaceLongestLosingStreakSince2023
129,378 views
1,180 Discussing
3
#BlackRockIBITPostsRecord$541MSingleDayOutflow
1,028 views
32 Discussing
4
#AnthropicPlungesTowardIPOPriceonDay2
61,498 views
656 Discussing
5
#TwentyOneCapitalAdds172.25BTC
14,326 views
209 Discussing
6
#HKBillWouldExcludeTokenizedDepositsFromVirtualAssets
1,432 views
19 Discussing
7
#BNBDropsBelow540USDTWith8.46%DailyDecline
34,954 views
317 Discussing
8
#HKBillProposesHK$100KFineForUnauthorizedCryptoTitles
1,141 views
17 Discussing
9
#BitMineFaces$10.1BUnrealizedETHLoss
2,166 views
20 Discussing
10
#StrategyReports$35BNetReserves
2,128 views
18 Discussing