
#kripto
kripto
86,283 views
412 Discussing
Hot
Latest

📚 The importance of crypto safety — 21 Nov 2026, 09:54 WIB
⚠️ Crypto is volatile: prices can suddenly rise or fall. Before trading, understand these five things:
1️⃣ volatility — prices can move quickly.
2️⃣ liquidity risk — how to withdraw assets from an exchange.
3️⃣ leverage — how borrowing affects losses/profits.
4️⃣ trading methods — how to use your account on the platform you choose.
5️⃣ managing emotions — why fear or panic sets in when prices fluctuate.
💡 Quick guide:
• Start with an account balance sufficient for your daily trades.
• Disable access when you’re not active.
• Don’t store passwords in plain documents or chats.
#Edukasi #Kripto $BTC
ℹ️ Disclaimer: For educational purposes, not investment advice.
📚 The importance of crypto safety — 21 Nov 2026, 09:54 WIB
⚠️ Crypto is volatile: prices can suddenly rise or fall. Before trading, understand these five things:
1️⃣ volatility — prices can move quickly.
2️⃣ liquidity risk — how to withdraw assets from an exchange.
3️⃣ leverage — how borrowing affects losses/profits.
4️⃣ trading methods — how to use your account on the platform you choose.
5️⃣ managing emotions — why fear or panic sets in when prices fluctuate.
💡 Quick guide:
• Start with an account balance sufficient for your daily trades.
• Disable access when you’re not active.
• Don’t store passwords in plain documents or chats.
#Edukasi #Kripto $BTC
ℹ️ Disclaimer: For educational purposes, not investment advice.
⚠️ Crypto is volatile: prices can suddenly rise or fall. Before trading, understand these five things:
1️⃣ volatility — prices can move quickly.
2️⃣ liquidity risk — how to withdraw assets from an exchange.
3️⃣ leverage — how borrowing affects losses/profits.
4️⃣ trading methods — how to use your account on the platform you choose.
5️⃣ managing emotions — why fear or panic sets in when prices fluctuate.
💡 Quick guide:
• Start with an account balance sufficient for your daily trades.
• Disable access when you’re not active.
• Don’t store passwords in plain documents or chats.
#Edukasi #Kripto $BTC
ℹ️ Disclaimer: For educational purposes, not investment advice.
47
🔒 How to Detect Fake Phishing Sites
💡 Why is this important?
Phishing often comes in the form of SMS messages or emails that imitate the look of banking services. Check 3 things: (1) the website domain—does it contain unusual spelling or redirect you elsewhere? (2) the URL before logging in—make sure the page is on the official domain, not a suspicious one; (3) never click links in support emails that ask for your credentials. Use a bookmark or search instead.
💡 Practical steps:
• Use a TOTP app (authenticator), rather than SMS, if possible.
• Check the website domain before logging in — don't click suspicious emails.
• Never share your credentials or recovery phrase.
ℹ️ A secure account helps protect your assets and your creator reputation. Reorganized for clarity. *Don't share personal information.
#CryptoSecurity #Edukasi #Kripto $BTC
ℹ️ Disclaimer: security education, not investment advice.
🔒 How to Detect Fake Phishing Sites
💡 Why is this important?
Phishing often comes in the form of SMS messages or emails that imitate the look of banking services. Check 3 things: (1) the website domain—does it contain unusual spelling or redirect you elsewhere? (2) the URL before logging in—make sure the page is on the official domain, not a suspicious one; (3) never click links in support emails that ask for your credentials. Use a bookmark or search instead.
💡 Practical steps:
• Use a TOTP app (authenticator), rather than SMS, if possible.
• Check the website domain before logging in — don't click suspicious emails.
• Never share your credentials or recovery phrase.
ℹ️ A secure account helps protect your assets and your creator reputation. Reorganized for clarity. *Don't share personal information.
#CryptoSecurity #Edukasi #Kripto $BTC
ℹ️ Disclaimer: security education, not investment advice.
💡 Why is this important?
Phishing often comes in the form of SMS messages or emails that imitate the look of banking services. Check 3 things: (1) the website domain—does it contain unusual spelling or redirect you elsewhere? (2) the URL before logging in—make sure the page is on the official domain, not a suspicious one; (3) never click links in support emails that ask for your credentials. Use a bookmark or search instead.
💡 Practical steps:
• Use a TOTP app (authenticator), rather than SMS, if possible.
• Check the website domain before logging in — don't click suspicious emails.
• Never share your credentials or recovery phrase.
ℹ️ A secure account helps protect your assets and your creator reputation. Reorganized for clarity. *Don't share personal information.
#CryptoSecurity #Edukasi #Kripto $BTC
ℹ️ Disclaimer: security education, not investment advice.
104

·
--
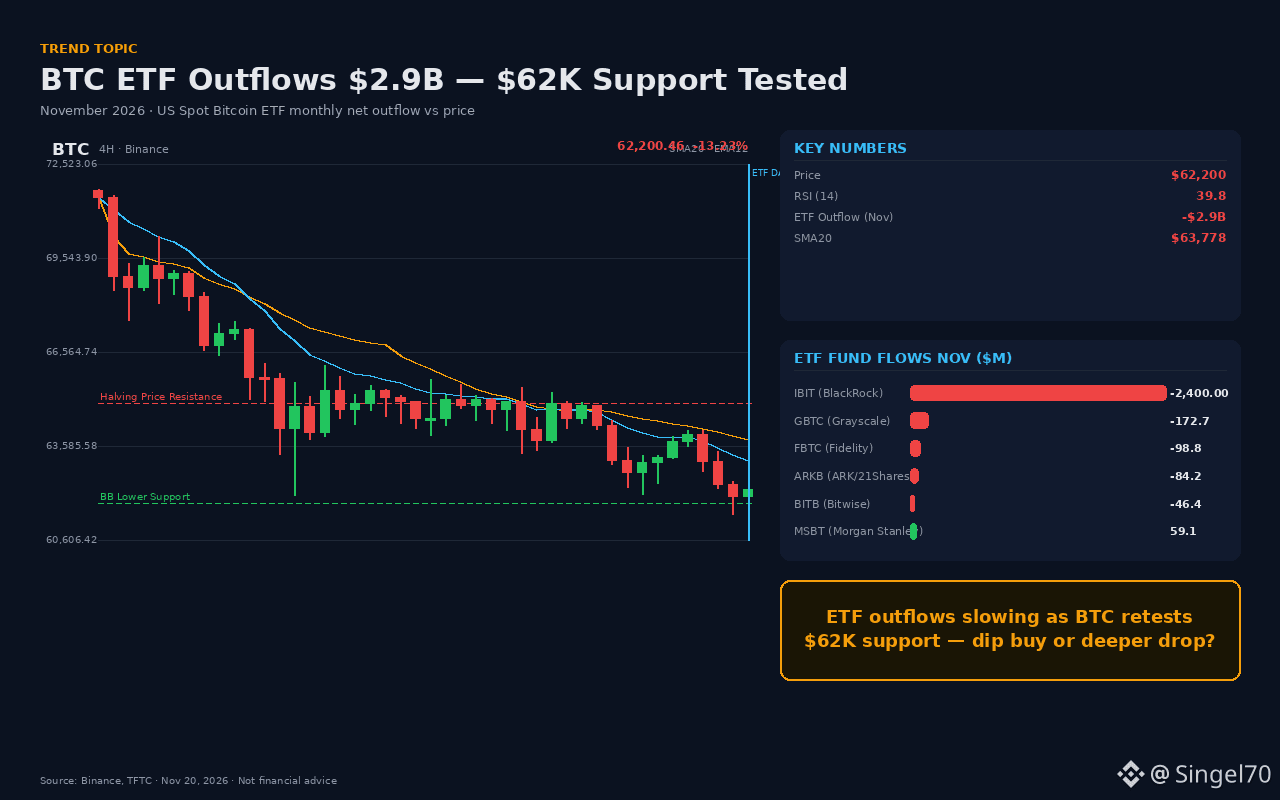
#BTCETFCikisi Bitcoin returned to the 62K level in November amid $2.9 billion in ETF outflows. Is this just panic, or an opportunity?
📌 Real Numbers (Source: Binance, TFTC · 20 Nov 2026)
• BTC price: $62,200 (24h -0.79%)
• 4h RSI: 39.8 (near oversold)
• SMA20: $63,778 (above price)
• November ETF net outflows: -$2.9B (13 days, 11 outflow days)
• Largest single-day outflow: -$430.2M (5 Nov)
• Lower BB band: $61,771 (immediate support)
• Halving-day price: $64,940 (resistance)
📉 Technical Analysis
BTC's price has reached the lower BB band ($61,771) on the 4h chart, with an RSI of 39.8 moving toward oversold territory. Closing below the SMA20 ($63,778) signals short-term pressure. If $61,428 (24h low) breaks, there is risk of a deeper decline.
🐋 Flow / News Evidence
US spot Bitcoin ETFs recorded total net outflows of -$2.9B in November (IBIT alone: -$2.4B). The outflow streak coincided with $2B+ in leveraged liquidations. As BTC approaches its 2024 halving-day price ($64,940), comparisons with the winter of 2022 are emerging.
🎯 Clear Plan
Stronger bias: Negative in the short term, but the $61,771–$61,428 zone is a buying area with limited risk. Entry: $62,000–61,428 · Stop: $61,000 · Target 1: $63,778 (SMA20) · Target 2: $64,940. The pace of ETF outflows is slowing (daily average: -$222M), which could ease pressure.
📌 Closing
If ETF outflows stop, could BTC return to 64K? We look forward to your comments.
#BTCETFCikisi $BTC #Bitcoin #ETF #Crypto
This is not financial advice.
#BTCETFCikisi Bitcoin returned to the 62K level in November amid $2.9 billion in ETF outflows. Is this just panic, or an opportunity?
📌 Real Numbers (Source: Binance, TFTC · 20 Nov 2026)
• BTC price: $62,200 (24h -0.79%)
• 4h RSI: 39.8 (near oversold)
• SMA20: $63,778 (above price)
• November ETF net outflows: -$2.9B (13 days, 11 outflow days)
• Largest single-day outflow: -$430.2M (5 Nov)
• Lower BB band: $61,771 (immediate support)
• Halving-day price: $64,940 (resistance)
📉 Technical Analysis
BTC's price has reached the lower BB band ($61,771) on the 4h chart, with an RSI of 39.8 moving toward oversold territory. Closing below the SMA20 ($63,778) signals short-term pressure. If $61,428 (24h low) breaks, there is risk of a deeper decline.
🐋 Flow / News Evidence
US spot Bitcoin ETFs recorded total net outflows of -$2.9B in November (IBIT alone: -$2.4B). The outflow streak coincided with $2B+ in leveraged liquidations. As BTC approaches its 2024 halving-day price ($64,940), comparisons with the winter of 2022 are emerging.
🎯 Clear Plan
Stronger bias: Negative in the short term, but the $61,771–$61,428 zone is a buying area with limited risk. Entry: $62,000–61,428 · Stop: $61,000 · Target 1: $63,778 (SMA20) · Target 2: $64,940. The pace of ETF outflows is slowing (daily average: -$222M), which could ease pressure.
📌 Closing
If ETF outflows stop, could BTC return to 64K? We look forward to your comments.
#BTCETFCikisi $BTC #Bitcoin #ETF #Crypto
This is not financial advice.
📌 Real Numbers (Source: Binance, TFTC · 20 Nov 2026)
• BTC price: $62,200 (24h -0.79%)
• 4h RSI: 39.8 (near oversold)
• SMA20: $63,778 (above price)
• November ETF net outflows: -$2.9B (13 days, 11 outflow days)
• Largest single-day outflow: -$430.2M (5 Nov)
• Lower BB band: $61,771 (immediate support)
• Halving-day price: $64,940 (resistance)
📉 Technical Analysis
BTC's price has reached the lower BB band ($61,771) on the 4h chart, with an RSI of 39.8 moving toward oversold territory. Closing below the SMA20 ($63,778) signals short-term pressure. If $61,428 (24h low) breaks, there is risk of a deeper decline.
🐋 Flow / News Evidence
US spot Bitcoin ETFs recorded total net outflows of -$2.9B in November (IBIT alone: -$2.4B). The outflow streak coincided with $2B+ in leveraged liquidations. As BTC approaches its 2024 halving-day price ($64,940), comparisons with the winter of 2022 are emerging.
🎯 Clear Plan
Stronger bias: Negative in the short term, but the $61,771–$61,428 zone is a buying area with limited risk. Entry: $62,000–61,428 · Stop: $61,000 · Target 1: $63,778 (SMA20) · Target 2: $64,940. The pace of ETF outflows is slowing (daily average: -$222M), which could ease pressure.
📌 Closing
If ETF outflows stop, could BTC return to 64K? We look forward to your comments.
#BTCETFCikisi $BTC #Bitcoin #ETF #Crypto
This is not financial advice.
BTC-2.99%
IBITETF-4.95%
89
[Decrypt] Crypto News
Bitcoin ETF Reserves Surge: $2.1 Billion in Early November, According to Decrypt
📈 Latest BTC price: 64590.01 USDT
📈 24 hours: -1.16% (up/down)
📊 24-hour range: 63336.00 - 65534.94 USDT
📊 24-hour volume: +/-1842.45 million USDT
#CryptoNews #BinanceSquare #Crypto
Disclaimer: This is news content, not a buy/sell recommendation. Digital asset prices are volatile and risky. Please do your own research before making any decisions.
[Decrypt] Crypto News
Bitcoin ETF Reserves Surge: $2.1 Billion in Early November, According to Decrypt
📈 Latest BTC price: 64590.01 USDT
📈 24 hours: -1.16% (up/down)
📊 24-hour range: 63336.00 - 65534.94 USDT
📊 24-hour volume: +/-1842.45 million USDT
#CryptoNews #BinanceSquare #Crypto
Disclaimer: This is news content, not a buy/sell recommendation. Digital asset prices are volatile and risky. Please do your own research before making any decisions.
Bitcoin ETF Reserves Surge: $2.1 Billion in Early November, According to Decrypt
📈 Latest BTC price: 64590.01 USDT
📈 24 hours: -1.16% (up/down)
📊 24-hour range: 63336.00 - 65534.94 USDT
📊 24-hour volume: +/-1842.45 million USDT
#CryptoNews #BinanceSquare #Crypto
Disclaimer: This is news content, not a buy/sell recommendation. Digital asset prices are volatile and risky. Please do your own research before making any decisions.
58

·
--
Something strange is happening with $LUNC in the last hour: volume came in at 13.9 times the hourly average, with 1.75 million USDT in a single hour. I couldn't find any news behind it, and there's no official announcement either. This is pure money flow 👀
57% of the buys are coming from active buyers, meaning someone is chasing the price, not just waiting for sellers. The day is up +14.91%, and the price is currently 0.00004016.
The ceiling is clear: 0.00004388. It touched that level once today and got pushed back. If it closes above that level, this volume wasn't for nothing. Below, there's 0.00003700, the 4-hour support. If that breaks, this pump will have been nothing more than a wick—no need to be stubborn 🔥
#LUNC #Binance #Crypto
Something strange is happening with $LUNC in the last hour: volume came in at 13.9 times the hourly average, with 1.75 million USDT in a single hour. I couldn't find any news behind it, and there's no official announcement either. This is pure money flow 👀
57% of the buys are coming from active buyers, meaning someone is chasing the price, not just waiting for sellers. The day is up +14.91%, and the price is currently 0.00004016.
The ceiling is clear: 0.00004388. It touched that level once today and got pushed back. If it closes above that level, this volume wasn't for nothing. Below, there's 0.00003700, the 4-hour support. If that breaks, this pump will have been nothing more than a wick—no need to be stubborn 🔥
#LUNC #Binance #Crypto
57% of the buys are coming from active buyers, meaning someone is chasing the price, not just waiting for sellers. The day is up +14.91%, and the price is currently 0.00004016.
The ceiling is clear: 0.00004388. It touched that level once today and got pushed back. If it closes above that level, this volume wasn't for nothing. Below, there's 0.00003700, the 4-hour support. If that breaks, this pump will have been nothing more than a wick—no need to be stubborn 🔥
#LUNC #Binance #Crypto
3
456
·
--
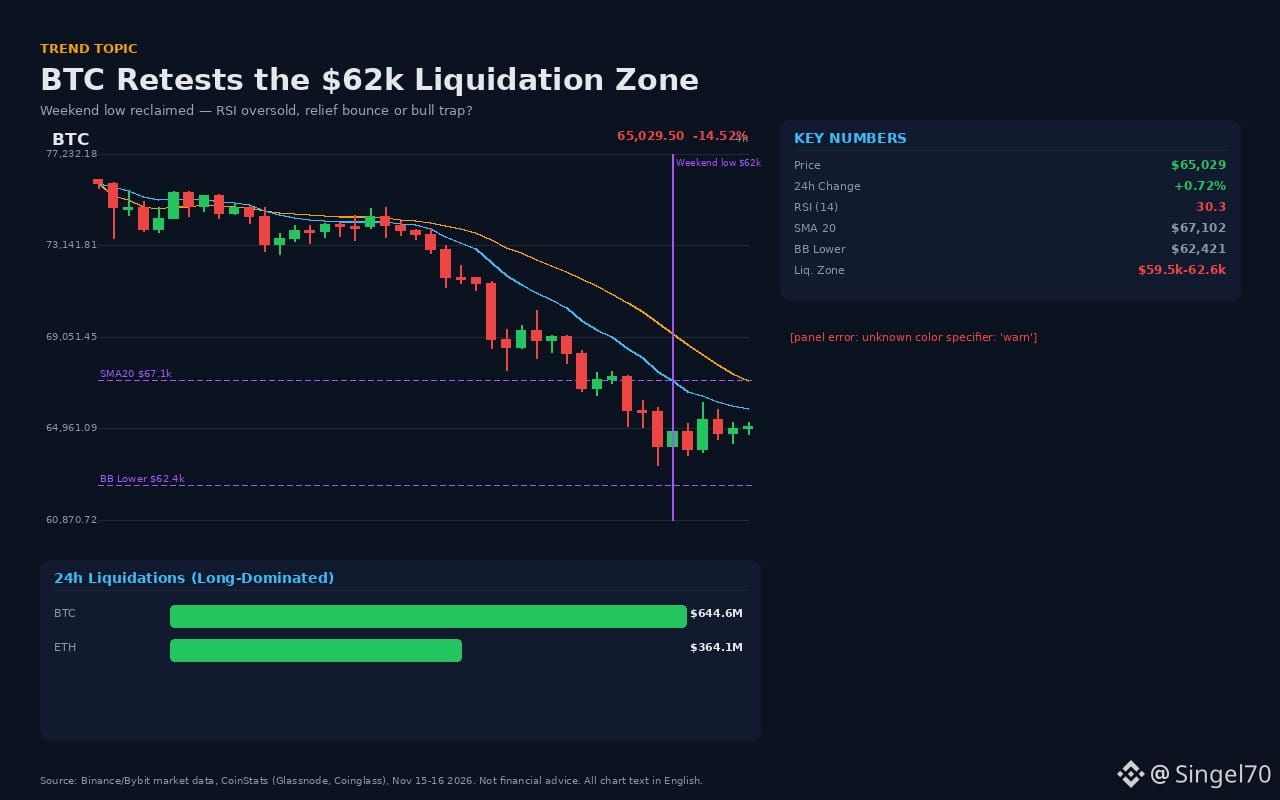
#BTC Testing the $62k liquidation zone — opportunity or a trap?
📌 Real figures (Sources: Bybit market data, CoinStats/Glassnode, Coinglass; Nov 15–16, 2026)
• Price: ~$65,029 (24h: +0.72%), 24h low: ~$61,999
• RSI (14): 30.3 — oversold
• SMA 20: $67,102 | Lower BB: $62,421
• Glassnode liquidation zone: $59,500–$62,600
• 24h liquidations: BTC $644.6M, ETH $364.1M (mostly longs)
• Spot BTC ETF: 7th consecutive day of net outflows, $185.4M (Nov 13)
📈 Technical analysis: Price is recovering from the weekend low of $62k but remains below the SMA20 ($67,102). RSI is oversold at 30.3; if the $62,421 lower Bollinger Band support holds, price could make a run toward $67k.
🐋 Whale evidence: 80% of the $644.6M in BTC liquidations came from longs; open interest fell 9.30% in two days ($43.9B). Longs have been flushed out, and selling pressure is easing. ETF outflows, however, continue.
🎯 Plan: Buy on a reclaim above $62,421, targeting $67,102 (SMA20), with a stop at $59,500 (below the liquidation zone). If price breaks lower, $59,500 is the first level to watch.
📌 If $62k support is tested again, would you buy or wait for $59,500?
#BTC #Kripto #Analiz #Likiditasyon $BTC $ETH
Not financial advice. Do your own research.
#BTC Testing the $62k liquidation zone — opportunity or a trap?
📌 Real figures (Sources: Bybit market data, CoinStats/Glassnode, Coinglass; Nov 15–16, 2026)
• Price: ~$65,029 (24h: +0.72%), 24h low: ~$61,999
• RSI (14): 30.3 — oversold
• SMA 20: $67,102 | Lower BB: $62,421
• Glassnode liquidation zone: $59,500–$62,600
• 24h liquidations: BTC $644.6M, ETH $364.1M (mostly longs)
• Spot BTC ETF: 7th consecutive day of net outflows, $185.4M (Nov 13)
📈 Technical analysis: Price is recovering from the weekend low of $62k but remains below the SMA20 ($67,102). RSI is oversold at 30.3; if the $62,421 lower Bollinger Band support holds, price could make a run toward $67k.
🐋 Whale evidence: 80% of the $644.6M in BTC liquidations came from longs; open interest fell 9.30% in two days ($43.9B). Longs have been flushed out, and selling pressure is easing. ETF outflows, however, continue.
🎯 Plan: Buy on a reclaim above $62,421, targeting $67,102 (SMA20), with a stop at $59,500 (below the liquidation zone). If price breaks lower, $59,500 is the first level to watch.
📌 If $62k support is tested again, would you buy or wait for $59,500?
#BTC #Kripto #Analiz #Likiditasyon $BTC $ETH
Not financial advice. Do your own research.
📌 Real figures (Sources: Bybit market data, CoinStats/Glassnode, Coinglass; Nov 15–16, 2026)
• Price: ~$65,029 (24h: +0.72%), 24h low: ~$61,999
• RSI (14): 30.3 — oversold
• SMA 20: $67,102 | Lower BB: $62,421
• Glassnode liquidation zone: $59,500–$62,600
• 24h liquidations: BTC $644.6M, ETH $364.1M (mostly longs)
• Spot BTC ETF: 7th consecutive day of net outflows, $185.4M (Nov 13)
📈 Technical analysis: Price is recovering from the weekend low of $62k but remains below the SMA20 ($67,102). RSI is oversold at 30.3; if the $62,421 lower Bollinger Band support holds, price could make a run toward $67k.
🐋 Whale evidence: 80% of the $644.6M in BTC liquidations came from longs; open interest fell 9.30% in two days ($43.9B). Longs have been flushed out, and selling pressure is easing. ETF outflows, however, continue.
🎯 Plan: Buy on a reclaim above $62,421, targeting $67,102 (SMA20), with a stop at $59,500 (below the liquidation zone). If price breaks lower, $59,500 is the first level to watch.
📌 If $62k support is tested again, would you buy or wait for $59,500?
#BTC #Kripto #Analiz #Likiditasyon $BTC $ETH
Not financial advice. Do your own research.
80

·
--
The claim “SEC officially classifies XRP, BTC, and SOL as commodities” is circulating again today — and it’s FALSE. #FactCheck
The claim: The SEC supposedly officially classified XRP, Bitcoin, and SOL as commodities under the Nasdaq Texas Commodity Trusts framework.
The facts: The document being cited is SEC Order No. 34-106268, dated September 3, 2026 — more than two months ago, not breaking news. And it doesn’t establish a federal classification: the order approved changes to the listing standards of ONE exchange, Nasdaq Texas (Rule 5711(d)), including a 15% buffer for assets that don’t meet the requirements.
The four coins — BTC, ETH, SOL, XRP — appear only in a hypothetical calculation example in the order: a trust worth 95 million dollars. The phrase “eligible commodities” there has a narrow meaning: coins that meet that exchange’s listing test (at least 6 months of futures trading on an ISG market + an ETF with at least 40% exposure). That’s a market surveillance standard, not a determination of federal legal status.
The order’s definition of “digital commodity” also refers to SEC-CFTC joint guidance from March 2026 and is temporary until there’s legislation. What’s actually new this week is something else: the SEC approved Nasdaq ISE’s listing of options on digital commodity ETPs (Nov. 10) — that, too, is an exchange rule, not a federal classification.
My conclusion: FALSE. There is no new federal commodity classification for XRP, SOL, or BTC today. This “the SEC has recognized them” narrative has made the rounds twice since September.
XRP is still below 1 dollar this afternoon, at around 0.99 — this claim hasn’t moved the price either.
Why do you think claims like this go viral so easily, even though the original documents are easy to check?
Not financial advice — always DYOR.
#CekFakta #Regulasi #Kripto $XRP $SOL $BTC
The claim “SEC officially classifies XRP, BTC, and SOL as commodities” is circulating again today — and it’s FALSE. #FactCheck
The claim: The SEC supposedly officially classified XRP, Bitcoin, and SOL as commodities under the Nasdaq Texas Commodity Trusts framework.
The facts: The document being cited is SEC Order No. 34-106268, dated September 3, 2026 — more than two months ago, not breaking news. And it doesn’t establish a federal classification: the order approved changes to the listing standards of ONE exchange, Nasdaq Texas (Rule 5711(d)), including a 15% buffer for assets that don’t meet the requirements.
The four coins — BTC, ETH, SOL, XRP — appear only in a hypothetical calculation example in the order: a trust worth 95 million dollars. The phrase “eligible commodities” there has a narrow meaning: coins that meet that exchange’s listing test (at least 6 months of futures trading on an ISG market + an ETF with at least 40% exposure). That’s a market surveillance standard, not a determination of federal legal status.
The order’s definition of “digital commodity” also refers to SEC-CFTC joint guidance from March 2026 and is temporary until there’s legislation. What’s actually new this week is something else: the SEC approved Nasdaq ISE’s listing of options on digital commodity ETPs (Nov. 10) — that, too, is an exchange rule, not a federal classification.
My conclusion: FALSE. There is no new federal commodity classification for XRP, SOL, or BTC today. This “the SEC has recognized them” narrative has made the rounds twice since September.
XRP is still below 1 dollar this afternoon, at around 0.99 — this claim hasn’t moved the price either.
Why do you think claims like this go viral so easily, even though the original documents are easy to check?
Not financial advice — always DYOR.
#CekFakta #Regulasi #Kripto $XRP $SOL $BTC
The claim: The SEC supposedly officially classified XRP, Bitcoin, and SOL as commodities under the Nasdaq Texas Commodity Trusts framework.
The facts: The document being cited is SEC Order No. 34-106268, dated September 3, 2026 — more than two months ago, not breaking news. And it doesn’t establish a federal classification: the order approved changes to the listing standards of ONE exchange, Nasdaq Texas (Rule 5711(d)), including a 15% buffer for assets that don’t meet the requirements.
The four coins — BTC, ETH, SOL, XRP — appear only in a hypothetical calculation example in the order: a trust worth 95 million dollars. The phrase “eligible commodities” there has a narrow meaning: coins that meet that exchange’s listing test (at least 6 months of futures trading on an ISG market + an ETF with at least 40% exposure). That’s a market surveillance standard, not a determination of federal legal status.
The order’s definition of “digital commodity” also refers to SEC-CFTC joint guidance from March 2026 and is temporary until there’s legislation. What’s actually new this week is something else: the SEC approved Nasdaq ISE’s listing of options on digital commodity ETPs (Nov. 10) — that, too, is an exchange rule, not a federal classification.
My conclusion: FALSE. There is no new federal commodity classification for XRP, SOL, or BTC today. This “the SEC has recognized them” narrative has made the rounds twice since September.
XRP is still below 1 dollar this afternoon, at around 0.99 — this claim hasn’t moved the price either.
Why do you think claims like this go viral so easily, even though the original documents are easy to check?
Not financial advice — always DYOR.
#CekFakta #Regulasi #Kripto $XRP $SOL $BTC
2
·
--
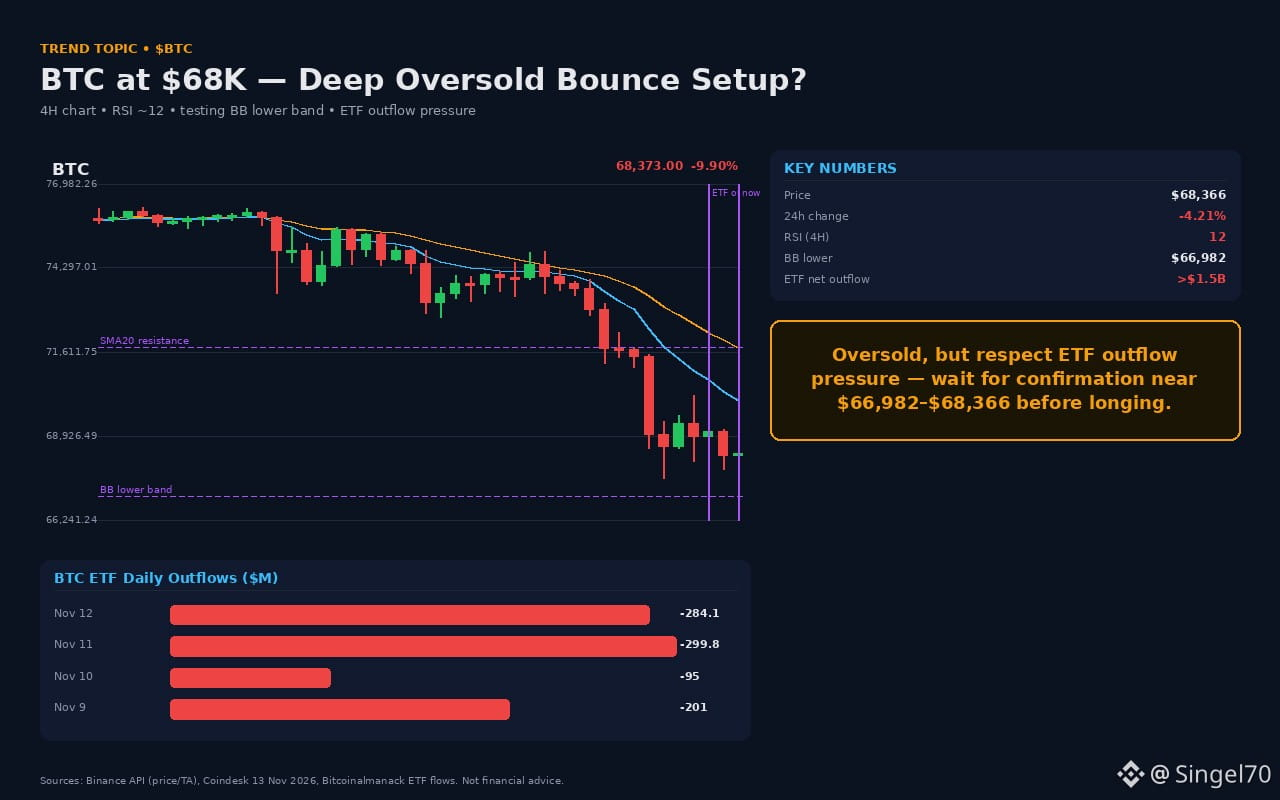
#BTC It stopped at $68K — is this a good rebound opportunity?
📌 Real numbers (Binance API, Coindesk, Bitcoinalmanack • Nov 14, 2026)
• Price: $68,366 (-4.21% in 24 hours)
• 4H RSI: ~12 (oversold)
• Lower Bollinger Band: $66,982
• SMA20: $71,745 (well above the price)
• BTC ETF net flows: -$1.5 billion and above (Coindesk, Nov 13); daily flows are negative
📉 Technical analysis: Price is well below the SMA20, with 4H RSI at ~12 and stochastic at ~11 — in oversold territory. It is very close to the lower BB ($66,982). This could create a rebound opportunity, but ETF selling pressure continues.
🐋 Flow evidence: Cumulative net outflows from BTC spot ETFs have exceeded $1.5 billion (Coindesk, Nov 13, 2026). IBIT saw heavy outflows over the last two trading days (Bitcoinalmanack). Institutional flows are moving in the opposite direction.
🎯 Plan: Small position in the $66,982–$68,366 zone, stop below $66,000, target 1 $70,000 (EMA12), target 2 $71,745 (SMA20). Going long before ETF outflows stop would be premature; first wait for a bounce from the lower BB and for the RSI to rise above 30. Direction: wait-and-see in the short term.
📌 Will BTC break below $66K, or rebound from $68K? I look forward to your comments.
#BTC $BTC #Kripto #MarketAnalysis
This is not financial advice.
#BTC It stopped at $68K — is this a good rebound opportunity?
📌 Real numbers (Binance API, Coindesk, Bitcoinalmanack • Nov 14, 2026)
• Price: $68,366 (-4.21% in 24 hours)
• 4H RSI: ~12 (oversold)
• Lower Bollinger Band: $66,982
• SMA20: $71,745 (well above the price)
• BTC ETF net flows: -$1.5 billion and above (Coindesk, Nov 13); daily flows are negative
📉 Technical analysis: Price is well below the SMA20, with 4H RSI at ~12 and stochastic at ~11 — in oversold territory. It is very close to the lower BB ($66,982). This could create a rebound opportunity, but ETF selling pressure continues.
🐋 Flow evidence: Cumulative net outflows from BTC spot ETFs have exceeded $1.5 billion (Coindesk, Nov 13, 2026). IBIT saw heavy outflows over the last two trading days (Bitcoinalmanack). Institutional flows are moving in the opposite direction.
🎯 Plan: Small position in the $66,982–$68,366 zone, stop below $66,000, target 1 $70,000 (EMA12), target 2 $71,745 (SMA20). Going long before ETF outflows stop would be premature; first wait for a bounce from the lower BB and for the RSI to rise above 30. Direction: wait-and-see in the short term.
📌 Will BTC break below $66K, or rebound from $68K? I look forward to your comments.
#BTC $BTC #Kripto #MarketAnalysis
This is not financial advice.
📌 Real numbers (Binance API, Coindesk, Bitcoinalmanack • Nov 14, 2026)
• Price: $68,366 (-4.21% in 24 hours)
• 4H RSI: ~12 (oversold)
• Lower Bollinger Band: $66,982
• SMA20: $71,745 (well above the price)
• BTC ETF net flows: -$1.5 billion and above (Coindesk, Nov 13); daily flows are negative
📉 Technical analysis: Price is well below the SMA20, with 4H RSI at ~12 and stochastic at ~11 — in oversold territory. It is very close to the lower BB ($66,982). This could create a rebound opportunity, but ETF selling pressure continues.
🐋 Flow evidence: Cumulative net outflows from BTC spot ETFs have exceeded $1.5 billion (Coindesk, Nov 13, 2026). IBIT saw heavy outflows over the last two trading days (Bitcoinalmanack). Institutional flows are moving in the opposite direction.
🎯 Plan: Small position in the $66,982–$68,366 zone, stop below $66,000, target 1 $70,000 (EMA12), target 2 $71,745 (SMA20). Going long before ETF outflows stop would be premature; first wait for a bounce from the lower BB and for the RSI to rise above 30. Direction: wait-and-see in the short term.
📌 Will BTC break below $66K, or rebound from $68K? I look forward to your comments.
#BTC $BTC #Kripto #MarketAnalysis
This is not financial advice.
94

·
--
BTC broke below 72,000 last night and is still parked at 71,100 this morning — tonight’s PPI will determine whether it continues or takes a pause.
Last night & this morning: BTC fell 3.5% in 24 hours. Yesterday’s 19:00 WIB 4H candle plunged to 71,218 on surging volume, then briefly touched 70,644 this morning before bouncing back to around 71,100. ETH was more dramatic: it wicked down to 1,983.82 yesterday and was shaky right at 2,000 this morning. SOL also weakened to 81.6. Total crypto market capitalization fell 5.8% to $2.41 trillion, with Fear & Greed at 28 — the market is still fearful.
Levels I’m watching today:
• BTC: upside 72,194 / 72,930 — downside 71,079 / 70,644, then the psychological 70,000
• ETH: upside 2,022 / 2,027 — downside 2,000 / 1,983, then 1,850
• SOL: upside 81.8 / 82.2 — downside 81.09 / 80.42
Today’s agenda: US PPI + Core PPI at 20:30 WIB (High) — forecasts are 0.4% and 0.3%, versus 1.3% and 0.7% previously. This is the final inflation release before the market closes out the week.
My bias today: cautious, leaning defensive while BTC is below 72,194. This view is invalidated by a 4H close above 72,930.
This is my analysis, not financial advice — always DYOR.
Do you think tonight’s PPI is more likely to trigger a bounce or instead break below 70,000?
#Bitcoin #Kripto $BTC $ETH $SOL
BTC broke below 72,000 last night and is still parked at 71,100 this morning — tonight’s PPI will determine whether it continues or takes a pause.
Last night & this morning: BTC fell 3.5% in 24 hours. Yesterday’s 19:00 WIB 4H candle plunged to 71,218 on surging volume, then briefly touched 70,644 this morning before bouncing back to around 71,100. ETH was more dramatic: it wicked down to 1,983.82 yesterday and was shaky right at 2,000 this morning. SOL also weakened to 81.6. Total crypto market capitalization fell 5.8% to $2.41 trillion, with Fear & Greed at 28 — the market is still fearful.
Levels I’m watching today:
• BTC: upside 72,194 / 72,930 — downside 71,079 / 70,644, then the psychological 70,000
• ETH: upside 2,022 / 2,027 — downside 2,000 / 1,983, then 1,850
• SOL: upside 81.8 / 82.2 — downside 81.09 / 80.42
Today’s agenda: US PPI + Core PPI at 20:30 WIB (High) — forecasts are 0.4% and 0.3%, versus 1.3% and 0.7% previously. This is the final inflation release before the market closes out the week.
My bias today: cautious, leaning defensive while BTC is below 72,194. This view is invalidated by a 4H close above 72,930.
This is my analysis, not financial advice — always DYOR.
Do you think tonight’s PPI is more likely to trigger a bounce or instead break below 70,000?
#Bitcoin #Kripto $BTC $ETH $SOL
Last night & this morning: BTC fell 3.5% in 24 hours. Yesterday’s 19:00 WIB 4H candle plunged to 71,218 on surging volume, then briefly touched 70,644 this morning before bouncing back to around 71,100. ETH was more dramatic: it wicked down to 1,983.82 yesterday and was shaky right at 2,000 this morning. SOL also weakened to 81.6. Total crypto market capitalization fell 5.8% to $2.41 trillion, with Fear & Greed at 28 — the market is still fearful.
Levels I’m watching today:
• BTC: upside 72,194 / 72,930 — downside 71,079 / 70,644, then the psychological 70,000
• ETH: upside 2,022 / 2,027 — downside 2,000 / 1,983, then 1,850
• SOL: upside 81.8 / 82.2 — downside 81.09 / 80.42
Today’s agenda: US PPI + Core PPI at 20:30 WIB (High) — forecasts are 0.4% and 0.3%, versus 1.3% and 0.7% previously. This is the final inflation release before the market closes out the week.
My bias today: cautious, leaning defensive while BTC is below 72,194. This view is invalidated by a 4H close above 72,930.
This is my analysis, not financial advice — always DYOR.
Do you think tonight’s PPI is more likely to trigger a bounce or instead break below 70,000?
#Bitcoin #Kripto $BTC $ETH $SOL
51
·
--
Japan’s largest brokerage wants to offload its crypto unit—and the reason isn’t about prices, but losses that are spreading.
The facts: Nomura Holdings is exploring the sale of Laser Digital, its Zurich-based crypto subsidiary, according to a Bloomberg report on Wednesday, Nov. 11. Marex Group is among the potential buyers it has spoken with, but no final decision has been made—Nomura could still keep the business. The trigger: losses at Laser Digital pushed Nomura’s European operations into their fourth consecutive quarterly loss, with a pretax loss of 7.4 billion yen (about $46.5 million) for the quarter ended Sept. 30, 2026. Laser Digital was founded in 2022 for institutional trading, asset management, and venture investing. Ironically, just last August, Laser Digital Japan secured the first new crypto exchange license in Japan in four years.
My take: this isn’t about one unprofitable unit—it’s about an institution’s patience being tested. When a crypto unit can drag an entire region into the red for four straight quarters, banks will choose to retreat rather than keep plugging the holes. The backdrop is tough: BTC is below $74,000, more than 40% off its peak, and Japanese crypto trading volume fell by more than half to 17.2 trillion yen in the first nine months of 2026.
What I’m watching next: whether an official buyer emerges or Nomura makes a final decision, and whether other banks also tighten their crypto exposure—or whether some see this as a chance to enter at a discount.
What do you think—is this the start of a wave of banks retreating from crypto, or an opening for more patient players?
This is my analysis, not financial advice—always DYOR.
#Nomura #LaserDigital #Crypto
Japan’s largest brokerage wants to offload its crypto unit—and the reason isn’t about prices, but losses that are spreading.
The facts: Nomura Holdings is exploring the sale of Laser Digital, its Zurich-based crypto subsidiary, according to a Bloomberg report on Wednesday, Nov. 11. Marex Group is among the potential buyers it has spoken with, but no final decision has been made—Nomura could still keep the business. The trigger: losses at Laser Digital pushed Nomura’s European operations into their fourth consecutive quarterly loss, with a pretax loss of 7.4 billion yen (about $46.5 million) for the quarter ended Sept. 30, 2026. Laser Digital was founded in 2022 for institutional trading, asset management, and venture investing. Ironically, just last August, Laser Digital Japan secured the first new crypto exchange license in Japan in four years.
My take: this isn’t about one unprofitable unit—it’s about an institution’s patience being tested. When a crypto unit can drag an entire region into the red for four straight quarters, banks will choose to retreat rather than keep plugging the holes. The backdrop is tough: BTC is below $74,000, more than 40% off its peak, and Japanese crypto trading volume fell by more than half to 17.2 trillion yen in the first nine months of 2026.
What I’m watching next: whether an official buyer emerges or Nomura makes a final decision, and whether other banks also tighten their crypto exposure—or whether some see this as a chance to enter at a discount.
What do you think—is this the start of a wave of banks retreating from crypto, or an opening for more patient players?
This is my analysis, not financial advice—always DYOR.
#Nomura #LaserDigital #Crypto
The facts: Nomura Holdings is exploring the sale of Laser Digital, its Zurich-based crypto subsidiary, according to a Bloomberg report on Wednesday, Nov. 11. Marex Group is among the potential buyers it has spoken with, but no final decision has been made—Nomura could still keep the business. The trigger: losses at Laser Digital pushed Nomura’s European operations into their fourth consecutive quarterly loss, with a pretax loss of 7.4 billion yen (about $46.5 million) for the quarter ended Sept. 30, 2026. Laser Digital was founded in 2022 for institutional trading, asset management, and venture investing. Ironically, just last August, Laser Digital Japan secured the first new crypto exchange license in Japan in four years.
My take: this isn’t about one unprofitable unit—it’s about an institution’s patience being tested. When a crypto unit can drag an entire region into the red for four straight quarters, banks will choose to retreat rather than keep plugging the holes. The backdrop is tough: BTC is below $74,000, more than 40% off its peak, and Japanese crypto trading volume fell by more than half to 17.2 trillion yen in the first nine months of 2026.
What I’m watching next: whether an official buyer emerges or Nomura makes a final decision, and whether other banks also tighten their crypto exposure—or whether some see this as a chance to enter at a discount.
What do you think—is this the start of a wave of banks retreating from crypto, or an opening for more patient players?
This is my analysis, not financial advice—always DYOR.
#Nomura #LaserDigital #Crypto
12

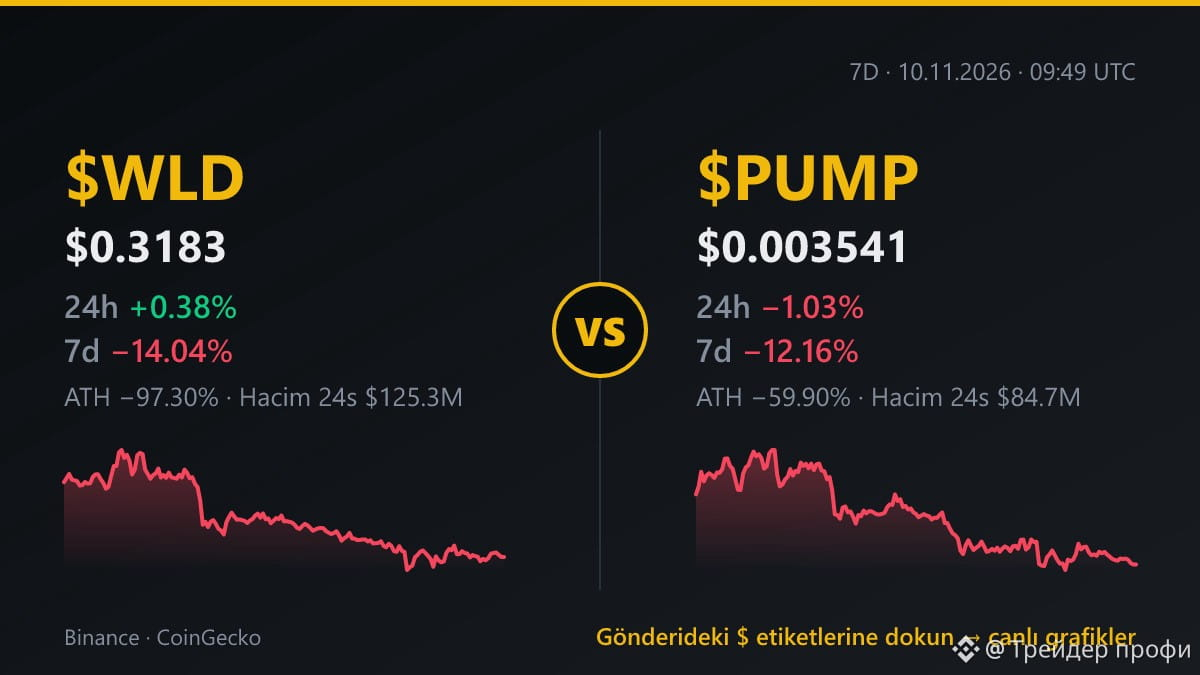
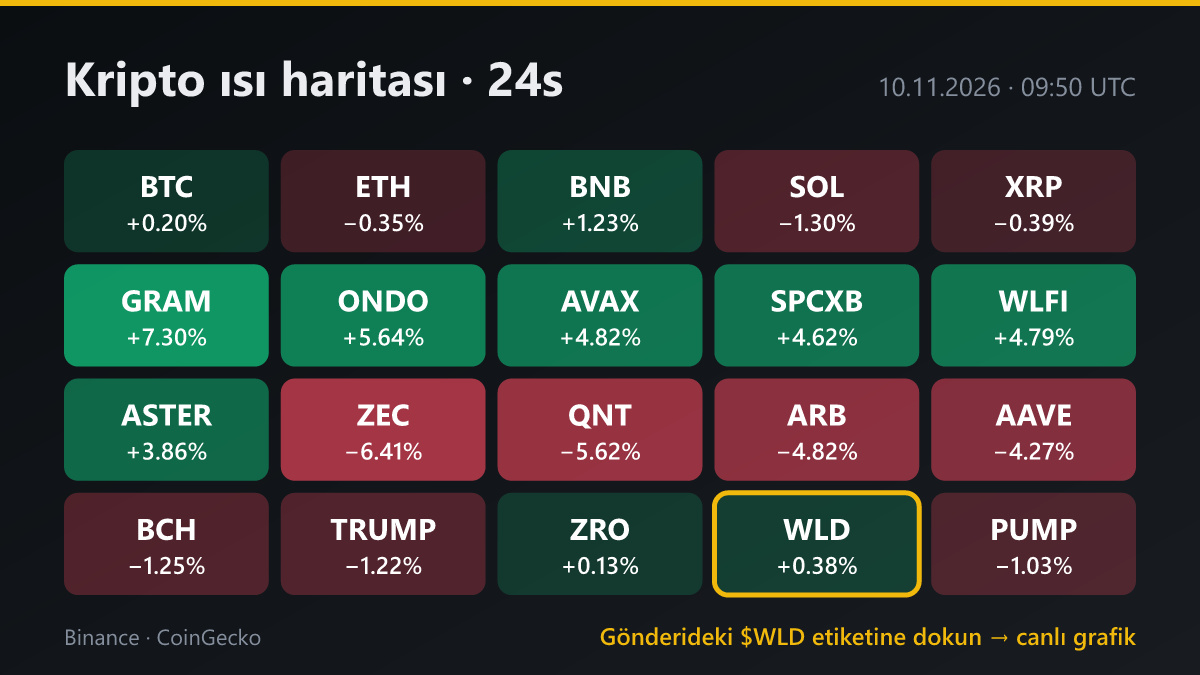
Down %97.3 from its ATH, $WLD is trying to hold on today with a gain of %0.38.
Let’s take a closer look and compare $WLD and $PUMP . 🔍
WLD is up %0.38 over the past 24 hours, while PUMP is down %1.03. But looking at the 7-day picture, WLD is down %14.04, while PUMP is showing slightly more resilience with a loss of %12.16.
WLD leads in trading volume at $125M. However, being %97.3 below its peak shows the scale of the risk; PUMP is %59.9 below its peak. I think PUMP looks structurally less battered. ⚖️
Now, let’s move to the $WLD chart and watch the $0.3133 low together. 📉
Taking a step in the altcoin market without managing risk is dangerous.
NFA. Do your own research (DYOR).
#WLD #Crypto
Down %97.3 from its ATH, $WLD is trying to hold on today with a gain of %0.38.
Let’s take a closer look and compare $WLD and $PUMP . 🔍
WLD is up %0.38 over the past 24 hours, while PUMP is down %1.03. But looking at the 7-day picture, WLD is down %14.04, while PUMP is showing slightly more resilience with a loss of %12.16.
WLD leads in trading volume at $125M. However, being %97.3 below its peak shows the scale of the risk; PUMP is %59.9 below its peak. I think PUMP looks structurally less battered. ⚖️
Now, let’s move to the $WLD chart and watch the $0.3133 low together. 📉
Taking a step in the altcoin market without managing risk is dangerous.
NFA. Do your own research (DYOR).
#WLD #Crypto
Let’s take a closer look and compare $WLD and $PUMP . 🔍
WLD is up %0.38 over the past 24 hours, while PUMP is down %1.03. But looking at the 7-day picture, WLD is down %14.04, while PUMP is showing slightly more resilience with a loss of %12.16.
WLD leads in trading volume at $125M. However, being %97.3 below its peak shows the scale of the risk; PUMP is %59.9 below its peak. I think PUMP looks structurally less battered. ⚖️
Now, let’s move to the $WLD chart and watch the $0.3133 low together. 📉
Taking a step in the altcoin market without managing risk is dangerous.
NFA. Do your own research (DYOR).
#WLD #Crypto
77
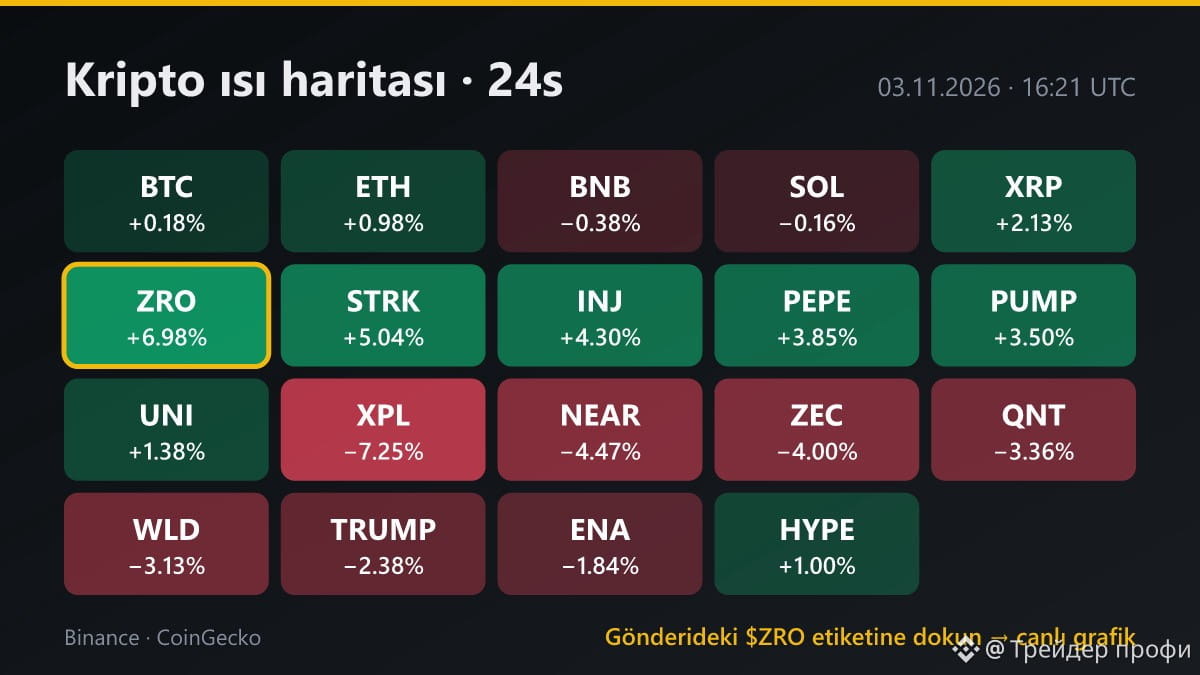
🌙 Daily Summary: $ZRO rose 6.98%, defying the market.
While total market capitalization fell by 2.49%, $ZRO posted the best performance of the day. After recovering from an intraday low of $1.68, the asset reached a high of $1.92. 📈 Meanwhile, $BTC traded sideways at $77,560.
You can open the live chart for $ZRO to check current levels. Stay tuned for our watchlist tomorrow morning; what do you think today's close signals?
NFA. Do your own research (DYOR).
#ZRO #Crypto
🌙 Daily Summary: $ZRO rose 6.98%, defying the market.
While total market capitalization fell by 2.49%, $ZRO posted the best performance of the day. After recovering from an intraday low of $1.68, the asset reached a high of $1.92. 📈 Meanwhile, $BTC traded sideways at $77,560.
You can open the live chart for $ZRO to check current levels. Stay tuned for our watchlist tomorrow morning; what do you think today's close signals?
NFA. Do your own research (DYOR).
#ZRO #Crypto
While total market capitalization fell by 2.49%, $ZRO posted the best performance of the day. After recovering from an intraday low of $1.68, the asset reached a high of $1.92. 📈 Meanwhile, $BTC traded sideways at $77,560.
You can open the live chart for $ZRO to check current levels. Stay tuned for our watchlist tomorrow morning; what do you think today's close signals?
NFA. Do your own research (DYOR).
#ZRO #Crypto
58
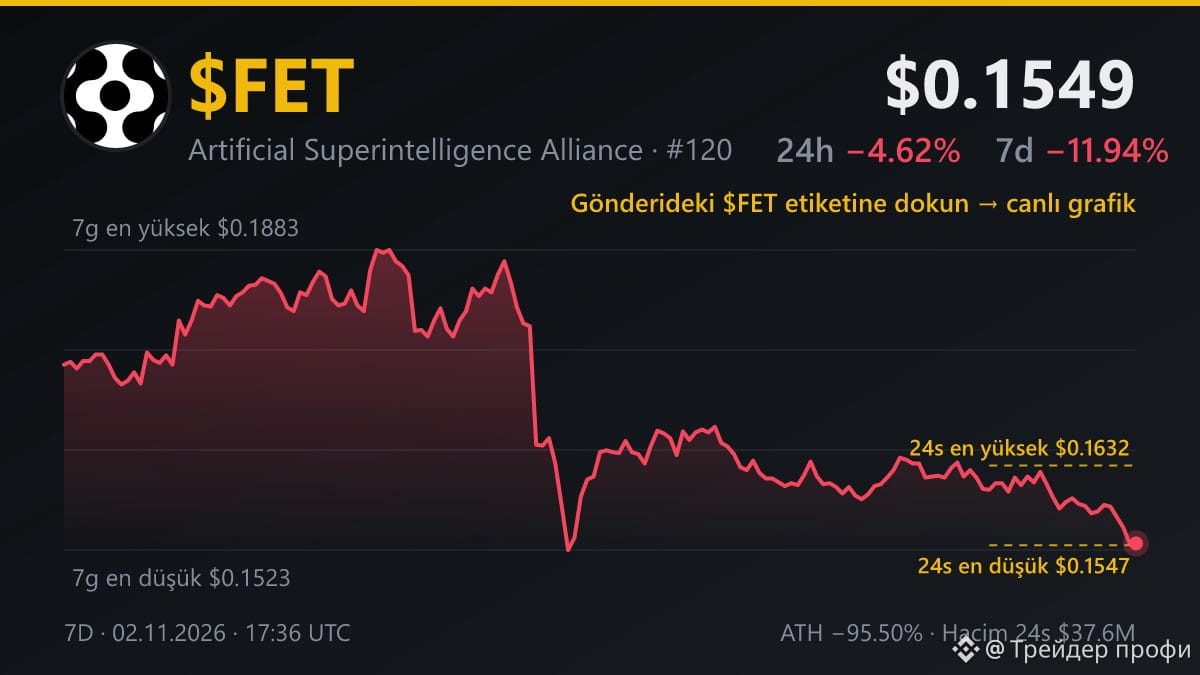
With a 7-day range as wide as 23.6%, it is prompting $FET investors to proceed cautiously.
The asset, which moved between $0.1523 and $0.1883 over the past week, fell to $0.1549 after a 4.62% decline in 24 hours. 🤖
The daily range tested a low of $0.1547 and a high of $0.1632, with trading volume at $37.5M. A potential drop below the 7-day floor of $0.1523 could increase risks, while a move above $0.1883 may be worth watching for a trend reversal.
Now at $0.1549, will $FET turn upward from this range?
High volatility leaves the door open to sudden moves.
This is not investment advice. DYOR.
#FET #Crypto
With a 7-day range as wide as 23.6%, it is prompting $FET investors to proceed cautiously.
The asset, which moved between $0.1523 and $0.1883 over the past week, fell to $0.1549 after a 4.62% decline in 24 hours. 🤖
The daily range tested a low of $0.1547 and a high of $0.1632, with trading volume at $37.5M. A potential drop below the 7-day floor of $0.1523 could increase risks, while a move above $0.1883 may be worth watching for a trend reversal.
Now at $0.1549, will $FET turn upward from this range?
High volatility leaves the door open to sudden moves.
This is not investment advice. DYOR.
#FET #Crypto
The asset, which moved between $0.1523 and $0.1883 over the past week, fell to $0.1549 after a 4.62% decline in 24 hours. 🤖
The daily range tested a low of $0.1547 and a high of $0.1632, with trading volume at $37.5M. A potential drop below the 7-day floor of $0.1523 could increase risks, while a move above $0.1883 may be worth watching for a trend reversal.
Now at $0.1549, will $FET turn upward from this range?
High volatility leaves the door open to sudden moves.
This is not investment advice. DYOR.
#FET #Crypto
27
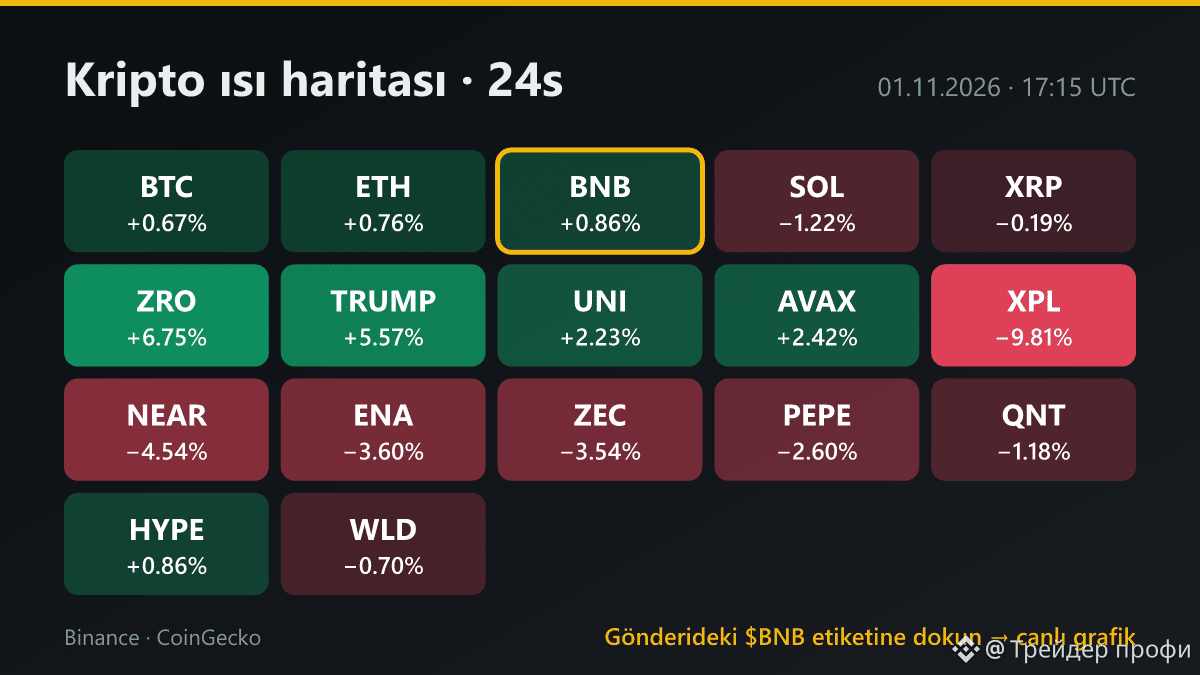
🌙 Evening Summary: $BNB managed to stay afloat while the market was in the red!
As the total value of the crypto market fell by 3.15% over the past 24 hours, let's take a closer look at today's results. Among the assets on our morning watchlist, $BNB stood out: its price rose from $706.89 in the morning to $711.86, marking a 0.7% gain.
Meanwhile, AVAX has fallen 1.57% since this morning to $8.75, while MORPHO is trading at $2.29, down 0.87%.
The day's top gainer was ZRO, with a 24-hour gain of 6.75% and a peak of $1.93. During this period, $BTC 77,450 traded sideways between $78,285.
Open the $BNB chart now to see the latest levels.
Follow the account for tomorrow morning's watchlist. Do you think BNB will hold these levels?
This is not investment advice. DYOR.
#BNB #Crypto
🌙 Evening Summary: $BNB managed to stay afloat while the market was in the red!
As the total value of the crypto market fell by 3.15% over the past 24 hours, let's take a closer look at today's results. Among the assets on our morning watchlist, $BNB stood out: its price rose from $706.89 in the morning to $711.86, marking a 0.7% gain.
Meanwhile, AVAX has fallen 1.57% since this morning to $8.75, while MORPHO is trading at $2.29, down 0.87%.
The day's top gainer was ZRO, with a 24-hour gain of 6.75% and a peak of $1.93. During this period, $BTC 77,450 traded sideways between $78,285.
Open the $BNB chart now to see the latest levels.
Follow the account for tomorrow morning's watchlist. Do you think BNB will hold these levels?
This is not investment advice. DYOR.
#BNB #Crypto
As the total value of the crypto market fell by 3.15% over the past 24 hours, let's take a closer look at today's results. Among the assets on our morning watchlist, $BNB stood out: its price rose from $706.89 in the morning to $711.86, marking a 0.7% gain.
Meanwhile, AVAX has fallen 1.57% since this morning to $8.75, while MORPHO is trading at $2.29, down 0.87%.
The day's top gainer was ZRO, with a 24-hour gain of 6.75% and a peak of $1.93. During this period, $BTC 77,450 traded sideways between $78,285.
Open the $BNB chart now to see the latest levels.
Follow the account for tomorrow morning's watchlist. Do you think BNB will hold these levels?
This is not investment advice. DYOR.
#BNB #Crypto
23
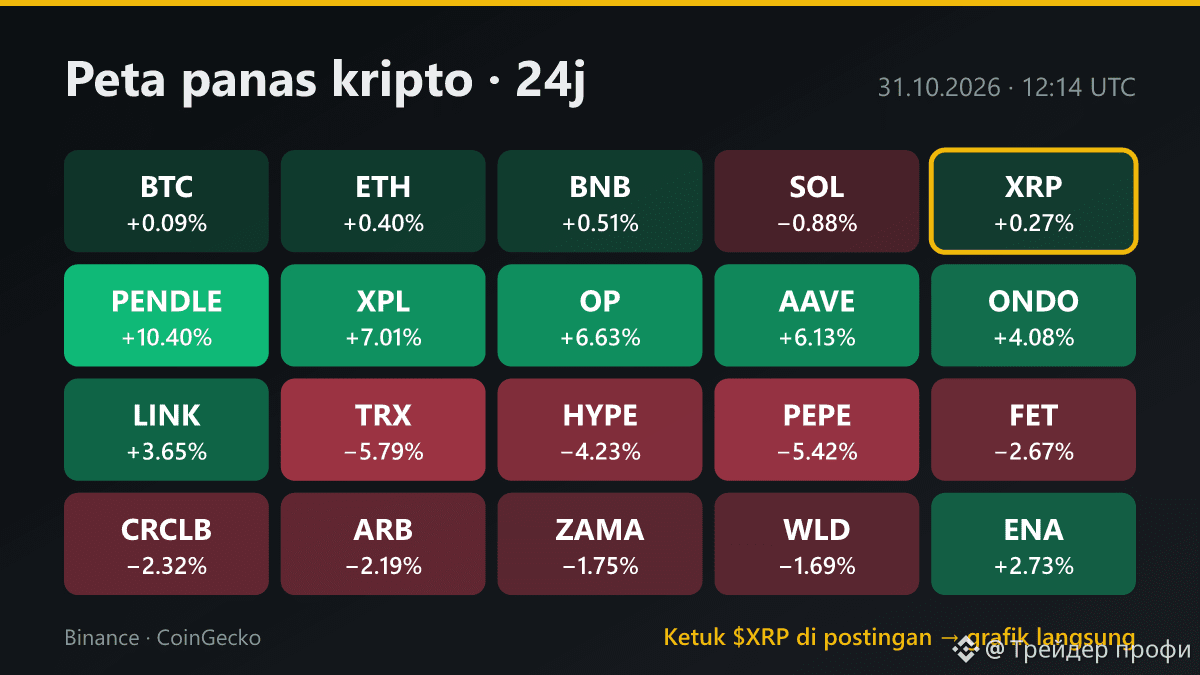
🌙 Evening Summary: $XRP
Morning watchlist review: $ONDO weakened 3.06% from $0.4209 to $0.408. $BTC was relatively flat (+0.03% from $77,606 to $77,629), and AAVE rose 1.49% to $133.81. 📉
The biggest market mover today was LSK, with a +35.9% surge. $XRP moved slowly at $1.25 within a daily range of $1.23–$1.26.
Check the $XRP chart directly to see its price direction.
Follow this account for daily market updates.
Not financial advice. DYOR.
#XRP #CryptoIndonesia #Crypto
🌙 Evening Summary: $XRP
Morning watchlist review: $ONDO weakened 3.06% from $0.4209 to $0.408. $BTC was relatively flat (+0.03% from $77,606 to $77,629), and AAVE rose 1.49% to $133.81. 📉
The biggest market mover today was LSK, with a +35.9% surge. $XRP moved slowly at $1.25 within a daily range of $1.23–$1.26.
Check the $XRP chart directly to see its price direction.
Follow this account for daily market updates.
Not financial advice. DYOR.
#XRP #CryptoIndonesia #Crypto
Morning watchlist review: $ONDO weakened 3.06% from $0.4209 to $0.408. $BTC was relatively flat (+0.03% from $77,606 to $77,629), and AAVE rose 1.49% to $133.81. 📉
The biggest market mover today was LSK, with a +35.9% surge. $XRP moved slowly at $1.25 within a daily range of $1.23–$1.26.
Check the $XRP chart directly to see its price direction.
Follow this account for daily market updates.
Not financial advice. DYOR.
#XRP #CryptoIndonesia #Crypto
3


⚡️LINK: myth or reality? 💭
$LINK Long
Entry: 11.545–11.563
Stop Loss: 11.320
TP1: 11.806
TP2: 12.050
TP3: 12.293
TP4: 12.537
TP5: 12.780
So, does this crypto bear the signs of a genuine rally or just a myth? 📈 The data shows positive signals from some indicators, but the direction remains uncertain. Still, it’s wise to remain cautious.
This is not investment advice.
#LINK #kripto #yazılımtalimat #Write2Earn
⚡️LINK: myth or reality? 💭
$LINK Long
Entry: 11.545–11.563
Stop Loss: 11.320
TP1: 11.806
TP2: 12.050
TP3: 12.293
TP4: 12.537
TP5: 12.780
So, does this crypto bear the signs of a genuine rally or just a myth? 📈 The data shows positive signals from some indicators, but the direction remains uncertain. Still, it’s wise to remain cautious.
This is not investment advice.
#LINK #kripto #yazılımtalimat #Write2Earn
$LINK Long
Entry: 11.545–11.563
Stop Loss: 11.320
TP1: 11.806
TP2: 12.050
TP3: 12.293
TP4: 12.537
TP5: 12.780
So, does this crypto bear the signs of a genuine rally or just a myth? 📈 The data shows positive signals from some indicators, but the direction remains uncertain. Still, it’s wise to remain cautious.
This is not investment advice.
#LINK #kripto #yazılımtalimat #Write2Earn
164
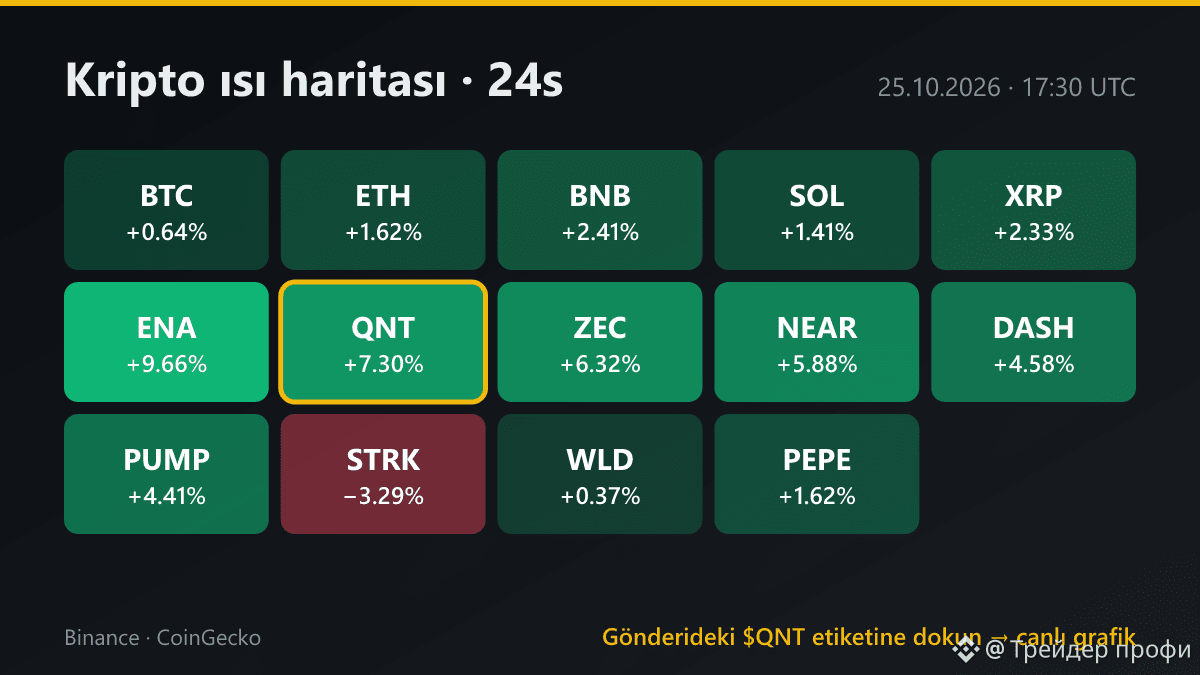
🌙 Daily Summary: $QNT
Looking at the moves on our morning watchlist, we can see that the market doesn’t reward every prediction.
ENA, which was at $0.191 in the morning, made the strongest move of the day, rising 7.54% to $0.2054 and meeting expectations. By contrast, AAVE rose just 2.01%, moving from $135.38 to $138.1. The plan didn’t work out for BNB; it rose only 0.54%, from $738.82 to $742.78, and remained stuck in a sideways range.
ENA posted the day’s strongest performance, gaining 9.66% in 24 hours. While at $BTC 80,760 dollars, $QNT recorded a 7.30% gain in the $176.11–$192 range.
Click the $QNT pair to view the live chart.
You can follow the account to get tomorrow morning’s watchlist; do you think these gains will last?
This is not investment advice — make your own decisions based on your research (DYOR).
#QNT #Kripto #Altcoin
🌙 Daily Summary: $QNT
Looking at the moves on our morning watchlist, we can see that the market doesn’t reward every prediction.
ENA, which was at $0.191 in the morning, made the strongest move of the day, rising 7.54% to $0.2054 and meeting expectations. By contrast, AAVE rose just 2.01%, moving from $135.38 to $138.1. The plan didn’t work out for BNB; it rose only 0.54%, from $738.82 to $742.78, and remained stuck in a sideways range.
ENA posted the day’s strongest performance, gaining 9.66% in 24 hours. While at $BTC 80,760 dollars, $QNT recorded a 7.30% gain in the $176.11–$192 range.
Click the $QNT pair to view the live chart.
You can follow the account to get tomorrow morning’s watchlist; do you think these gains will last?
This is not investment advice — make your own decisions based on your research (DYOR).
#QNT #Kripto #Altcoin
Looking at the moves on our morning watchlist, we can see that the market doesn’t reward every prediction.
ENA, which was at $0.191 in the morning, made the strongest move of the day, rising 7.54% to $0.2054 and meeting expectations. By contrast, AAVE rose just 2.01%, moving from $135.38 to $138.1. The plan didn’t work out for BNB; it rose only 0.54%, from $738.82 to $742.78, and remained stuck in a sideways range.
ENA posted the day’s strongest performance, gaining 9.66% in 24 hours. While at $BTC 80,760 dollars, $QNT recorded a 7.30% gain in the $176.11–$192 range.
Click the $QNT pair to view the live chart.
You can follow the account to get tomorrow morning’s watchlist; do you think these gains will last?
This is not investment advice — make your own decisions based on your research (DYOR).
#QNT #Kripto #Altcoin
350
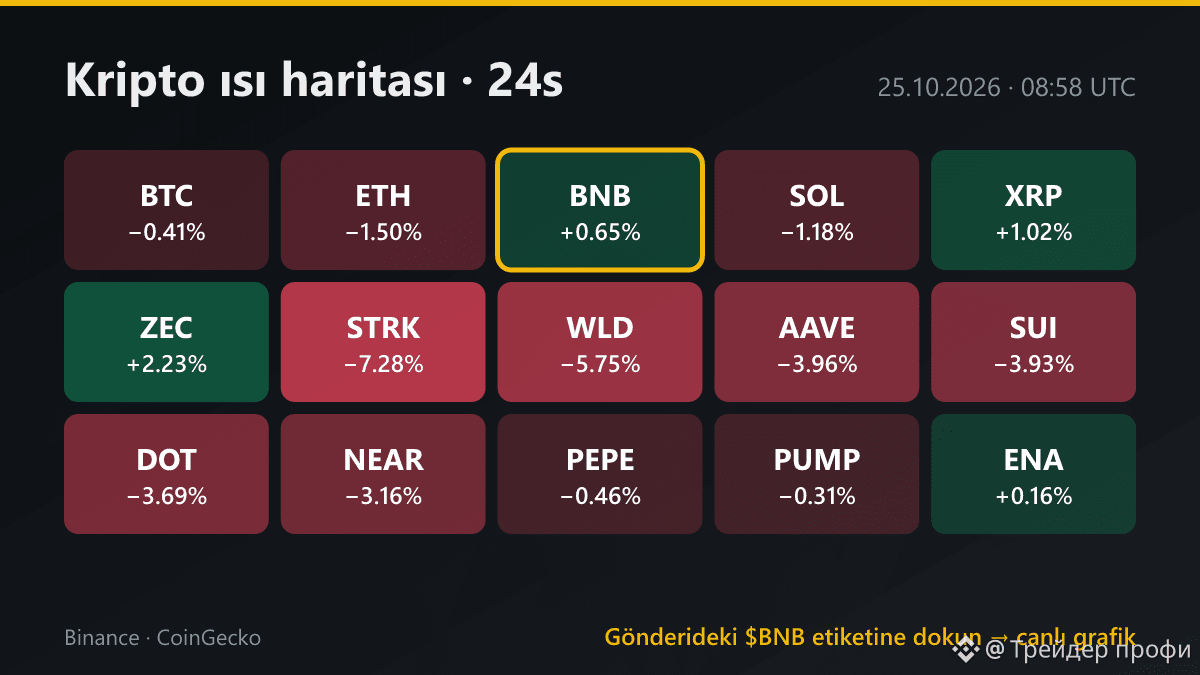
☀️ Morning Watchlist: $BNB started the day in the green.
Here are three assets on my radar today and the key levels I’ll be watching:
1. $BNB: Trading at $738.82, up 0.65% over the past 24 hours. The key range I’m watching today is $718 to $748.65.
2. $ENA: Holding steady, up 0.16% at $0.191. The $0.1839 low stands out as support, while the upper band is $0.1973.
3. $AAVE: One of the day’s decliners, down 3.96% to $135.38. It’s important to hold the 24-hour low of $134.
Tap the $BNB icon to view the live chart.
Follow the account for our end-of-day review this evening.
This is not investment advice. DYOR.
#BNB #Kripto #Binance
☀️ Morning Watchlist: $BNB started the day in the green.
Here are three assets on my radar today and the key levels I’ll be watching:
1. $BNB : Trading at $738.82, up 0.65% over the past 24 hours. The key range I’m watching today is $718 to $748.65.
2. $ENA : Holding steady, up 0.16% at $0.191. The $0.1839 low stands out as support, while the upper band is $0.1973.
3. $AAVE : One of the day’s decliners, down 3.96% to $135.38. It’s important to hold the 24-hour low of $134.
Tap the $BNB icon to view the live chart.
Follow the account for our end-of-day review this evening.
This is not investment advice. DYOR.
#BNB #Kripto #Binance
Here are three assets on my radar today and the key levels I’ll be watching:
1. $BNB : Trading at $738.82, up 0.65% over the past 24 hours. The key range I’m watching today is $718 to $748.65.
2. $ENA : Holding steady, up 0.16% at $0.191. The $0.1839 low stands out as support, while the upper band is $0.1973.
3. $AAVE : One of the day’s decliners, down 3.96% to $135.38. It’s important to hold the 24-hour low of $134.
Tap the $BNB icon to view the live chart.
Follow the account for our end-of-day review this evening.
This is not investment advice. DYOR.
#BNB #Kripto #Binance
193
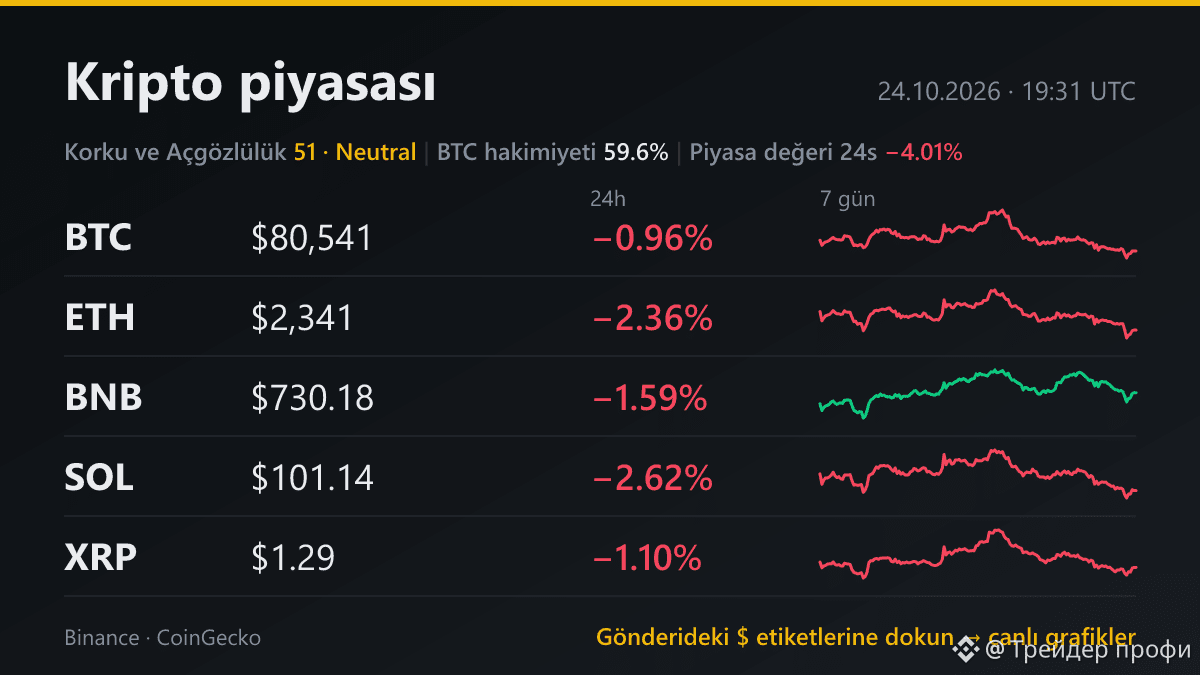
$SOL is currently testing the $101.14 level and the $98.62 support zone. 📉
As the market bleeds, the majors’ distance from their all-time highs paints a surprising picture. $BTC is holding up the best, 36.2% below its ATH, while $BNB ranks second with a 46.8% loss.
$SOL , meanwhile, is still 65.5% below its peak. With the price squeezed between $98.62 and $104.12, the real surprise is that the Layer 1 projects furthest from their peaks are moving fastest in the rebound.
Open the live chart for $SOL to see whether the $98.62 support holds. 🔍
Which major do you think will be the first to recover from this level?
Not financial advice. Do your own research (DYOR).
#SOL #Crypto
$SOL is currently testing the $101.14 level and the $98.62 support zone. 📉
As the market bleeds, the majors’ distance from their all-time highs paints a surprising picture. $BTC is holding up the best, 36.2% below its ATH, while $BNB ranks second with a 46.8% loss.
$SOL , meanwhile, is still 65.5% below its peak. With the price squeezed between $98.62 and $104.12, the real surprise is that the Layer 1 projects furthest from their peaks are moving fastest in the rebound.
Open the live chart for $SOL to see whether the $98.62 support holds. 🔍
Which major do you think will be the first to recover from this level?
Not financial advice. Do your own research (DYOR).
#SOL #Crypto
As the market bleeds, the majors’ distance from their all-time highs paints a surprising picture. $BTC is holding up the best, 36.2% below its ATH, while $BNB ranks second with a 46.8% loss.
$SOL , meanwhile, is still 65.5% below its peak. With the price squeezed between $98.62 and $104.12, the real surprise is that the Layer 1 projects furthest from their peaks are moving fastest in the rebound.
Open the live chart for $SOL to see whether the $98.62 support holds. 🔍
Which major do you think will be the first to recover from this level?
Not financial advice. Do your own research (DYOR).
#SOL #Crypto
1
Log in to explore more content
Join global crypto users on Binance Square
⚡️ Get latest and useful information about crypto.
💬 Trusted by the world’s largest crypto exchange.
👍 Discover real insights from verified creators.
Email / Phone number
Trending Topics
1
#NvidiaLoses$2.7TrillionInMonthAndAHalf
0 views
0 Discussing
2
#CanBTCReboundAfterFallingBelow60K?
448,740 views
1,965 Discussing
3
#GlobalStocksFaceLongestLosingStreakSince2023
152,117 views
1,373 Discussing
4
#BlackRockIBITPostsRecord$541MSingleDayOutflow
5,295 views
43 Discussing
5
#AnthropicPlungesTowardIPOPriceonDay2
73,269 views
781 Discussing
6
#TwentyOneCapitalAdds172.25BTC
23,984 views
316 Discussing
7
#HKBillWouldExcludeTokenizedDepositsFromVirtualAssets
2,671 views
37 Discussing
8
#BNBDropsBelow540USDTWith8.46%DailyDecline
42,673 views
380 Discussing
9
#HKBillProposesHK$100KFineForUnauthorizedCryptoTitles
1,500 views
20 Discussing
10
#BitMineFaces$10.1BUnrealizedETHLoss
2,750 views
25 Discussing