
#linkanalysis
linkanalysis
14,227 views
64 Discussing
Hot
Latest

🔥 $LINK - Where Are We Now?
Chainlink is currently sitting at $9.263 zone.
LINK is the backbone of DeFi! Chainlink's oracle network powers hundreds of blockchain projects worldwide. The most essential infrastructure in crypto! 💪
📌 Key Levels to Watch:
Support: $8.50 - $9.00 zone 👀
Resistance: $10.00 - $11.00 zone
Do you think $LINK will hit $20 again soon?
Drop your thoughts in the comments! 👇🚀
$LINK $BTC $ETH
#LINK K #Crypto #BinanceSquareFamily re #LINKAnalysis
🔥 $LINK - Where Are We Now?
Chainlink is currently sitting at $9.263 zone.
LINK is the backbone of DeFi! Chainlink's oracle network powers hundreds of blockchain projects worldwide. The most essential infrastructure in crypto! 💪
📌 Key Levels to Watch:
Support: $8.50 - $9.00 zone 👀
Resistance: $10.00 - $11.00 zone
Do you think $LINK will hit $20 again soon?
Drop your thoughts in the comments! 👇🚀
$LINK $BTC $ETH
#LINK K #Crypto #BinanceSquareFamily re #LINKAnalysis
Chainlink is currently sitting at $9.263 zone.
LINK is the backbone of DeFi! Chainlink's oracle network powers hundreds of blockchain projects worldwide. The most essential infrastructure in crypto! 💪
📌 Key Levels to Watch:
Support: $8.50 - $9.00 zone 👀
Resistance: $10.00 - $11.00 zone
Do you think $LINK will hit $20 again soon?
Drop your thoughts in the comments! 👇🚀
$LINK $BTC $ETH
#LINK K #Crypto #BinanceSquareFamily re #LINKAnalysis
64

Verified
What's it take for good news to stop mattering? $LINK just banked two of its biggest adoption headlines in a year — and fell anyway.
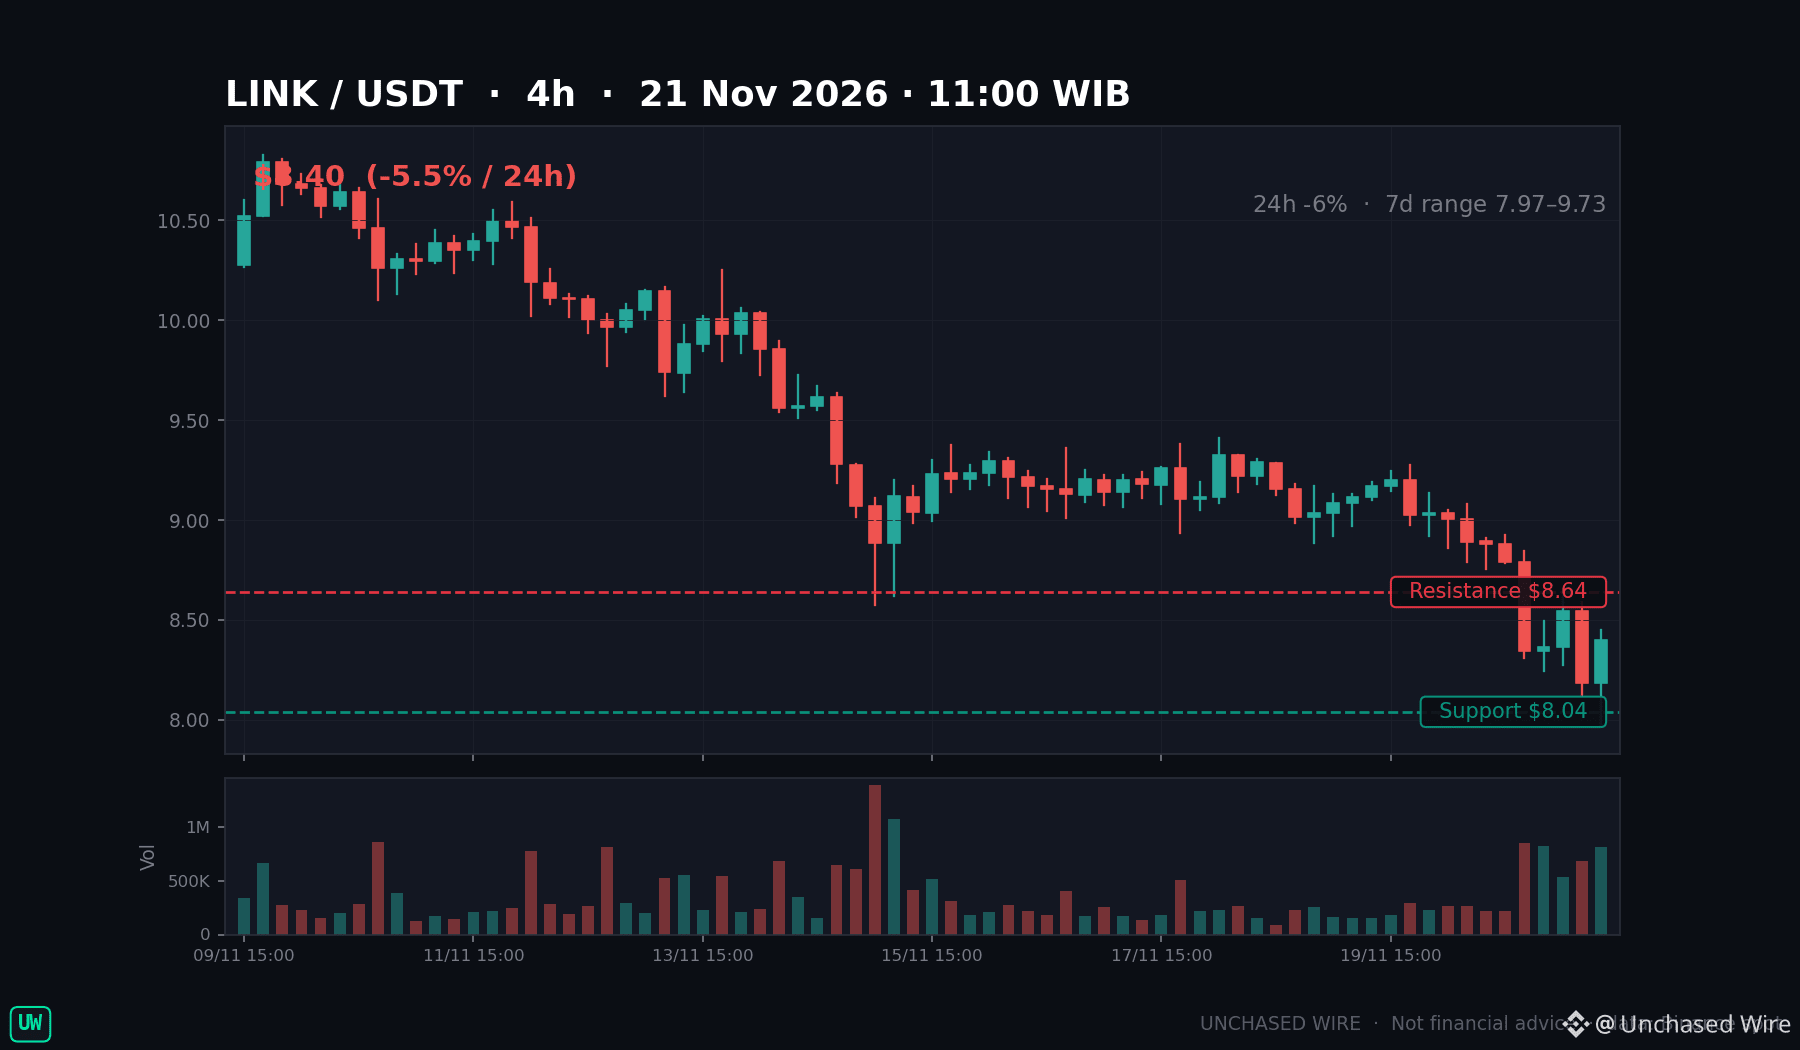
On Thursday, UBS announced a production pilot running tokenized structured notes on Chainlink's Runtime Environment. On Friday, the REX-Osprey LINK ETF registration took effect. Real plumbing, real paperwork — and LINK slid to near $8.40, down about 6% on the day, RSI 26.
The part that keeps me from getting comfortable: the tape outweighs the headlines. Bitcoin lost $60,000, and Chainlink itself is switching off CCIP support on 11 chains on November 30. Adoption is arriving while the market is leaving.
But here's what matters most: $8.04. It is the line the last candles are sitting on, just above the seven-day low of $7.97. Hold it and the $8.64 reclaim is back in play, then $9.00. Lose it on a daily close and the next stops are $7.60, then the 52-week low at $7.19.
Two prints, two stories — which comes first, $8.64 or $7.19?
DYOR — not financial advice.
$LINK #Altcoins #Chainlink #ETF #LINKAnalysis #CryptoTrading
What's it take for good news to stop mattering? $LINK just banked two of its biggest adoption headlines in a year — and fell anyway.
On Thursday, UBS announced a production pilot running tokenized structured notes on Chainlink's Runtime Environment. On Friday, the REX-Osprey LINK ETF registration took effect. Real plumbing, real paperwork — and LINK slid to near $8.40, down about 6% on the day, RSI 26.
The part that keeps me from getting comfortable: the tape outweighs the headlines. Bitcoin lost $60,000, and Chainlink itself is switching off CCIP support on 11 chains on November 30. Adoption is arriving while the market is leaving.
But here's what matters most: $8.04. It is the line the last candles are sitting on, just above the seven-day low of $7.97. Hold it and the $8.64 reclaim is back in play, then $9.00. Lose it on a daily close and the next stops are $7.60, then the 52-week low at $7.19.
Two prints, two stories — which comes first, $8.64 or $7.19?
DYOR — not financial advice.
$LINK #Altcoins #Chainlink #ETF #LINKAnalysis #CryptoTrading
On Thursday, UBS announced a production pilot running tokenized structured notes on Chainlink's Runtime Environment. On Friday, the REX-Osprey LINK ETF registration took effect. Real plumbing, real paperwork — and LINK slid to near $8.40, down about 6% on the day, RSI 26.
The part that keeps me from getting comfortable: the tape outweighs the headlines. Bitcoin lost $60,000, and Chainlink itself is switching off CCIP support on 11 chains on November 30. Adoption is arriving while the market is leaving.
But here's what matters most: $8.04. It is the line the last candles are sitting on, just above the seven-day low of $7.97. Hold it and the $8.64 reclaim is back in play, then $9.00. Lose it on a daily close and the next stops are $7.60, then the 52-week low at $7.19.
Two prints, two stories — which comes first, $8.64 or $7.19?
DYOR — not financial advice.
$LINK #Altcoins #Chainlink #ETF #LINKAnalysis #CryptoTrading
99

Article
LINK / USD - Complete Analysis
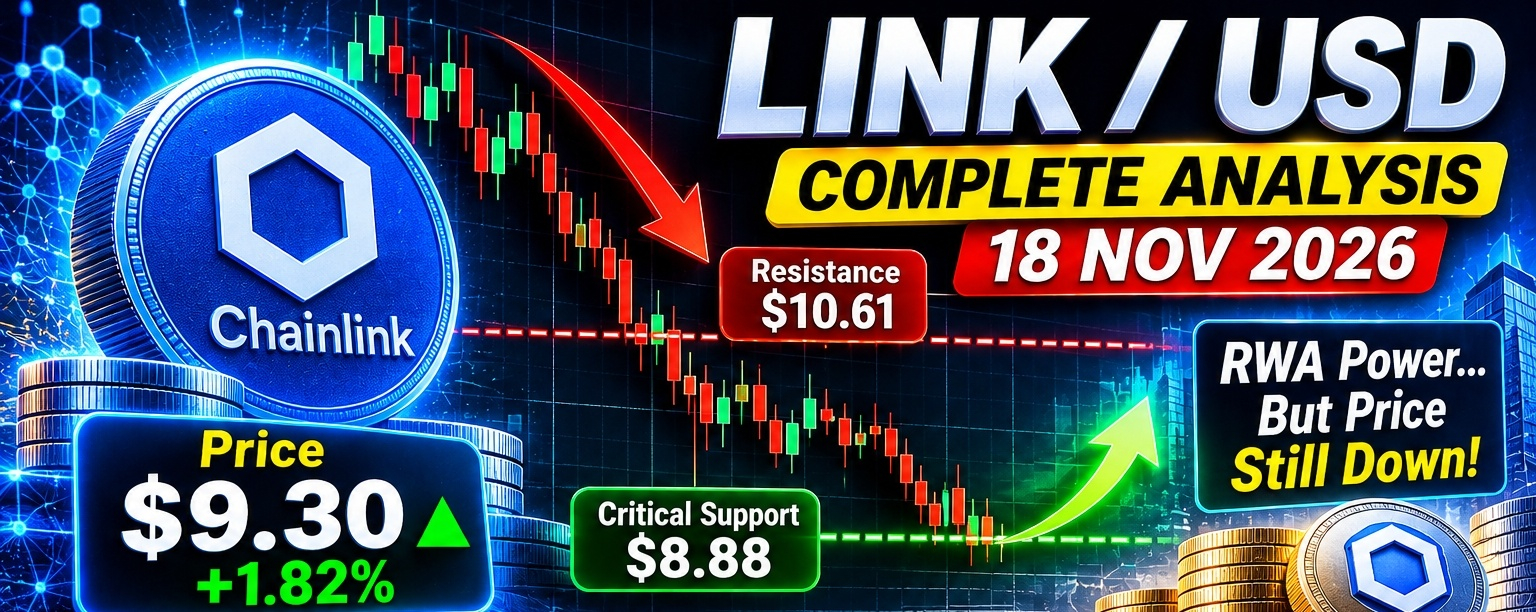
18 Nov 2026 | Price: ∼$9.30$LINK / USD - Complete Analysis
18 Nov 2026 | Price: ∼$9.30
LINK is in a bearish breakdown, testing a make-or-break support zone. It has lost its long-term support at $10.61, fallen -22.2% in 30 days, and is now fighting to hold $8.88 - $9.00.
Fundamentally, Chainlink has never been stronger - it's becoming the standard for tokenized real-world assets. But price is not following fundamentals right now. That divergence is the whole story.
{spot}(LINKUSDT)
This is not financial advice.
1. Live Market Snapshot
| Metric | Value |
| --- | --- |
| Current Price | $9.30 |
| 24h Range | $8.95 - $9.38 |
| 24h Change | +1.82% to +1.95% |
| Market Cap Rank | #17 |
| 24h Forecast Range | $8.86 - $9.60, average ~$9.23 |
| Circulating Supply | ∼657M LINK (of 1B max) |
| All-Time High | $52.88 (May 2021) - now -82.4% below ATH |
Performance:
30 days: -22.2%
Recent: Fell from above $11.00 earlier in November to ∼$9.30 now
1-day technical sentiment: 34% Bullish / 66% Bearish
Sentiment: Neutral 62% in AI trackers, but market-wide Fear & Greed is Extreme Fear. LINK is not panicking alone, it's being dragged down.
## 2. What Just Happened?
LINK fell below the long-term swing support of $10.61 - a level that held for months.
That breakdown triggered a fast drop to $8.95 low. Now it's bouncing slightly to $9.30, but still below all major moving averages.
Analysts call $8.88 the make-or-break test.
3. Technical Analysis
Trend: Strong Bearish
LINK trades below short-, medium-, and long-term moving averages with high volatility, facing strong selling pressure.
MA-20 (hourly): $9.72
MA-50 (hourly): $9.87
MA-200 (daily): $10.11
200-day SMA: $10.10
Price at $9.30 is below ALL of them. Every rally will hit resistance.
Technical rating: Strong Bearish / Strong Sell
Momentum: Weak, Approaching Oversold
RSI: 34.62 - 36.1
Stochastic RSI: 40.42
CCI: -92.53
RSI near 34 means heavy selling, but not yet deeply oversold like XRP was at 17. Still room to fall if $8.88 breaks.
Key Levels
| Type | Level | Why it matters |
| --- | --- | --- |
| CRITICAL Support | $8.88 | 78.6% Fibonacci retracement inside Fair Value Gap. Make-or-break. A bullish reaction here = strong reversal signal |
| Support 1 | $9.1769 - $9.28 | Nearest support, only 0.2-0.5% below |
| Support 2 | $8.652 | Classic strong support / next floor if $8.88 fails |
| Support 3 | $7.482 - $7.71 | 7-day range low, capitulation zone |
| Resistance 1 | $9.47 - $9.6291 | Nearest resistance, +1.8% to +4.4% above |
| Resistance 2 | $9.88 | Ichimoku Kijun - immediate barrier |
| Resistance 3 | $10.44 - $10.61 | Old support turned resistance. Must reclaim to flip bullish |
| Major Resistance | $10.915 - $11.13 | 200-day + breakout zone |
| Breakout Target | $12.74 - $14.40 | If $11 breaks, next targets |
Near-term range: $8.94 - $9.57, with consolidation expected between $8.77 - $9.68 in base case (45% probability).
7-day range: $7.71 - $10.70
Buy zone concept: Some traders are watching $9.00 - $9.20 as accumulation, with stop below $8.65.
4. Fundamental Analysis - Why LINK Is Different
Chainlink launched in 2017 with 1B LINK tokens - 35% public, 35% node operators/ecosystem, 30% Chainlink Labs.
It is a Decentralized Oracle Network (DON) - it bridges real-world data (prices, weather, reserves, etc.) with blockchain smart contracts. Without oracles, DeFi cannot work.
Bullish Fundamentals - Strongest Ever
1. RWA Tokenization - The #1 Institutional Narrative
Total tokenized real-world assets hit $39.2B in Oct 2026, up from ∼$21B at start of year. Chainlink is positioned as the infrastructure for this.
2. CCIP - Cross-Chain Interoperability Protocol
CCIP lets data and assets move between blockchains. According to Chainlink's Q3 2026 review, more than $15B in token value migrated to CCIP during 2026, while the protocol secured over $85B in value.
3. Gold Token + Compliance - Oct 27, 2026
Two big institutional integrations:
Plan to bring Hong Kong Gold Exchange's HKGX gold-backed XGZ token to CCIP via GoldZip and Midas Labs
Automated Compliance Engine (ACE) selected by ADQ-backed Further Asset Management for tokenized funds
4. Japan Expansion - Oct 18, 2026
Pacific Meta selected CCIP as its preferred solution for cross-chain interoperability to enable institutional tokenization in Japan.
5. Stellar Integration - Oct 14, 2026
Chainlink Data Feeds and Data Streams went live on Stellar, which hosts $4B+ of tokenized RWAs, giving Stellar DeFi apps access to Chainlink oracles. LINK rose 3.7% on that news.
6. Robinhood Chain + TradFi
Chainlink is working with Robinhood Chain (broker's public L2 for trading) and other TradFi players. RWA tokenisation is driving demand for data services, custody, and automated collateral management.
Bearish / Risk Factors
1. CCIP Adoption Still Tiny
CCIP's total distributed asset value has fallen to $322M, only 0.8% of the ∼$40B RWA market. Huge potential, but also shows adoption is early.
2. LINK Token Utility Question
Chainlink secures $85B+, but LINK token itself is mainly used for paying node operators and staking. Critics ask: does usage directly drive LINK price? Not always.
3. Token Unlocks / Supply
Team / ecosystem still holds large supply. Selling pressure from node operator payments is constant.
4. Correlation to Market
Even with great news, LINK fell -22% in a month because BTC / ETH fell. Fundamentals don't protect short-term price.
5. Scenarios - What to Watch
🟢 Bullish Scenario (30% probability)
Trigger: Hold $8.88, daily close back above $9.88 (Kijun), then $10.61
Target: $10.44 -> $11.13 -> $12.74 -> $14.40
Analyst CryptoTanx sees a possible double bottom in $9 - $11 zone.
November forecast: $9.02 - $12.74, average $10.61, +15.00% upside if recovery holds.
1-month model target: $11.77
🟡 Base / Sideways Scenario (45% probability - Most Likely)
Range: $8.77 - $9.68
LINK consolidates, builds a base at $8.88 - $9.30, RSI recovers. No breakout yet, but no breakdown either. This is accumulation time for long-term holders.
🔴 Bearish Scenario (25% probability)
Trigger: Daily close below $8.88 with volume, especially below $8.65
Target: $7.71 -> $7.48 -> $6.38
This would confirm the breakdown from $10.61 was real and open a deeper capitulation. A bullish reversal is not confirmed yet.
6. Long-Term Outlook
| Period | Forecast |
| --- | --- |
| Nov 2026 | $9.43 - $11.10, target ~$10.25 |
| End of 2026 | $11.68 in historical models |
| 2027 | $15 - $18 range in many models (if RWA grows) |
| 2030 | $30 - $50 if CCIP becomes standard |
| Can it reclaim $50? | Only if RWA market goes from $39B to $500B+ AND LINK captures value via staking/fees. Possible, but not in 2026. |
Ignore $100+ hype targets for now - focus on reclaiming $10.61 first.
7. Strategy Summary (Not Advice)
For Traders:
Key level is $8.88. This is your line in the sand.
Long idea: Buy near $9.00 - $9.20, Stop below $8.65, Target $9.88 -> $10.61
Short / Avoid: Below $8.88, momentum is down
Next 24h range to trade: $8.95 - $9.35
For Long-Term Holders / DCA:
Current zone $9 - $11 is historically a strong accumulation zone (double bottom forming)
Fundamentals (CCIP + RWA + TradFi) are the best in LINK's history
But price can stay low for months even with good news - DCA slowly, don't all-in at one level
Staking LINK earns yield and reduces circulating supply - consider if you hold long-term
LINK vs $XRP vs $TRX Quick Comparison:
| | LINK | XRP | TRX |
| --- | --- | --- | --- |
| Price | $9.30 | $0.977 | $0.307 |
| YTD / 30D | -22% / 30D | -48% YTD | +6.5% YTD |
| Strength | Oracle / RWA infra | Payments / ETF | USDT settlement |
| Volatility | High | Very High | Very Low |
| Risk | Adoption slow | ETF outflows | Centralization |
Want me to do:
LINK vs XRP vs TRX - which to buy now head-to-head portfolio?
LINK 1H / 4H scalp levels with exact entry / SL / TP?
LINK staking + CCIP revenue - how LINK actually makes money?
#LINK🔥🔥🔥 #LINKUpdates #LINKAnalysis #LINKUSDT #TrendingPredictions
LINK / USD - Complete Analysis 18 Nov 2026 | Price: ∼$9.30
$LINK / USD - Complete Analysis
18 Nov 2026 | Price: ∼$9.30
LINK is in a bearish breakdown, testing a make-or-break support zone. It has lost its long-term support at $10.61, fallen -22.2% in 30 days, and is now fighting to hold $8.88 - $9.00.
Fundamentally, Chainlink has never been stronger - it's becoming the standard for tokenized real-world assets. But price is not following fundamentals right now. That divergence is the whole story.
This is not financial advice.
1. Live Market Snapshot
| Metric | Value |
| --- | --- |
| Current Price | $9.30 |
| 24h Range | $8.95 - $9.38 |
| 24h Change | +1.82% to +1.95% |
| Market Cap Rank | #17 |
| 24h Forecast Range | $8.86 - $9.60, average ~$9.23 |
| Circulating Supply | ∼657M LINK (of 1B max) |
| All-Time High | $52.88 (May 2021) - now -82.4% below ATH |
Performance:
30 days: -22.2%
Recent: Fell from above $11.00 earlier in November to ∼$9.30 now
1-day technical sentiment: 34% Bullish / 66% Bearish
Sentiment: Neutral 62% in AI trackers, but market-wide Fear & Greed is Extreme Fear. LINK is not panicking alone, it's being dragged down.
## 2. What Just Happened?
LINK fell below the long-term swing support of $10.61 - a level that held for months.
That breakdown triggered a fast drop to $8.95 low. Now it's bouncing slightly to $9.30, but still below all major moving averages.
Analysts call $8.88 the make-or-break test.
3. Technical Analysis
Trend: Strong Bearish
LINK trades below short-, medium-, and long-term moving averages with high volatility, facing strong selling pressure.
MA-20 (hourly): $9.72
MA-50 (hourly): $9.87
MA-200 (daily): $10.11
200-day SMA: $10.10
Price at $9.30 is below ALL of them. Every rally will hit resistance.
Technical rating: Strong Bearish / Strong Sell
Momentum: Weak, Approaching Oversold
RSI: 34.62 - 36.1
Stochastic RSI: 40.42
CCI: -92.53
RSI near 34 means heavy selling, but not yet deeply oversold like XRP was at 17. Still room to fall if $8.88 breaks.
Key Levels
| Type | Level | Why it matters |
| --- | --- | --- |
| CRITICAL Support | $8.88 | 78.6% Fibonacci retracement inside Fair Value Gap. Make-or-break. A bullish reaction here = strong reversal signal |
| Support 1 | $9.1769 - $9.28 | Nearest support, only 0.2-0.5% below |
| Support 2 | $8.652 | Classic strong support / next floor if $8.88 fails |
| Support 3 | $7.482 - $7.71 | 7-day range low, capitulation zone |
| Resistance 1 | $9.47 - $9.6291 | Nearest resistance, +1.8% to +4.4% above |
| Resistance 2 | $9.88 | Ichimoku Kijun - immediate barrier |
| Resistance 3 | $10.44 - $10.61 | Old support turned resistance. Must reclaim to flip bullish |
| Major Resistance | $10.915 - $11.13 | 200-day + breakout zone |
| Breakout Target | $12.74 - $14.40 | If $11 breaks, next targets |
Near-term range: $8.94 - $9.57, with consolidation expected between $8.77 - $9.68 in base case (45% probability).
7-day range: $7.71 - $10.70
Buy zone concept: Some traders are watching $9.00 - $9.20 as accumulation, with stop below $8.65.
4. Fundamental Analysis - Why LINK Is Different
Chainlink launched in 2017 with 1B LINK tokens - 35% public, 35% node operators/ecosystem, 30% Chainlink Labs.
It is a Decentralized Oracle Network (DON) - it bridges real-world data (prices, weather, reserves, etc.) with blockchain smart contracts. Without oracles, DeFi cannot work.
Bullish Fundamentals - Strongest Ever
1. RWA Tokenization - The #1 Institutional Narrative
Total tokenized real-world assets hit $39.2B in Oct 2026, up from ∼$21B at start of year. Chainlink is positioned as the infrastructure for this.
2. CCIP - Cross-Chain Interoperability Protocol
CCIP lets data and assets move between blockchains. According to Chainlink's Q3 2026 review, more than $15B in token value migrated to CCIP during 2026, while the protocol secured over $85B in value.
3. Gold Token + Compliance - Oct 27, 2026
Two big institutional integrations:
Plan to bring Hong Kong Gold Exchange's HKGX gold-backed XGZ token to CCIP via GoldZip and Midas Labs
Automated Compliance Engine (ACE) selected by ADQ-backed Further Asset Management for tokenized funds
4. Japan Expansion - Oct 18, 2026
Pacific Meta selected CCIP as its preferred solution for cross-chain interoperability to enable institutional tokenization in Japan.
5. Stellar Integration - Oct 14, 2026
Chainlink Data Feeds and Data Streams went live on Stellar, which hosts $4B+ of tokenized RWAs, giving Stellar DeFi apps access to Chainlink oracles. LINK rose 3.7% on that news.
6. Robinhood Chain + TradFi
Chainlink is working with Robinhood Chain (broker's public L2 for trading) and other TradFi players. RWA tokenisation is driving demand for data services, custody, and automated collateral management.
Bearish / Risk Factors
1. CCIP Adoption Still Tiny
CCIP's total distributed asset value has fallen to $322M, only 0.8% of the ∼$40B RWA market. Huge potential, but also shows adoption is early.
2. LINK Token Utility Question
Chainlink secures $85B+, but LINK token itself is mainly used for paying node operators and staking. Critics ask: does usage directly drive LINK price? Not always.
3. Token Unlocks / Supply
Team / ecosystem still holds large supply. Selling pressure from node operator payments is constant.
4. Correlation to Market
Even with great news, LINK fell -22% in a month because BTC / ETH fell. Fundamentals don't protect short-term price.
5. Scenarios - What to Watch
🟢 Bullish Scenario (30% probability)
Trigger: Hold $8.88, daily close back above $9.88 (Kijun), then $10.61
Target: $10.44 -> $11.13 -> $12.74 -> $14.40
Analyst CryptoTanx sees a possible double bottom in $9 - $11 zone.
November forecast: $9.02 - $12.74, average $10.61, +15.00% upside if recovery holds.
1-month model target: $11.77
🟡 Base / Sideways Scenario (45% probability - Most Likely)
Range: $8.77 - $9.68
LINK consolidates, builds a base at $8.88 - $9.30, RSI recovers. No breakout yet, but no breakdown either. This is accumulation time for long-term holders.
🔴 Bearish Scenario (25% probability)
Trigger: Daily close below $8.88 with volume, especially below $8.65
Target: $7.71 -> $7.48 -> $6.38
This would confirm the breakdown from $10.61 was real and open a deeper capitulation. A bullish reversal is not confirmed yet.
6. Long-Term Outlook
| Period | Forecast |
| --- | --- |
| Nov 2026 | $9.43 - $11.10, target ~$10.25 |
| End of 2026 | $11.68 in historical models |
| 2027 | $15 - $18 range in many models (if RWA grows) |
| 2030 | $30 - $50 if CCIP becomes standard |
| Can it reclaim $50? | Only if RWA market goes from $39B to $500B+ AND LINK captures value via staking/fees. Possible, but not in 2026. |
Ignore $100+ hype targets for now - focus on reclaiming $10.61 first.
7. Strategy Summary (Not Advice)
For Traders:
Key level is $8.88. This is your line in the sand.
Long idea: Buy near $9.00 - $9.20, Stop below $8.65, Target $9.88 -> $10.61
Short / Avoid: Below $8.88, momentum is down
Next 24h range to trade: $8.95 - $9.35
For Long-Term Holders / DCA:
Current zone $9 - $11 is historically a strong accumulation zone (double bottom forming)
Fundamentals (CCIP + RWA + TradFi) are the best in LINK's history
But price can stay low for months even with good news - DCA slowly, don't all-in at one level
Staking LINK earns yield and reduces circulating supply - consider if you hold long-term
LINK vs $XRP vs $TRX Quick Comparison:
| | LINK | XRP | TRX |
| --- | --- | --- | --- |
| Price | $9.30 | $0.977 | $0.307 |
| YTD / 30D | -22% / 30D | -48% YTD | +6.5% YTD |
| Strength | Oracle / RWA infra | Payments / ETF | USDT settlement |
| Volatility | High | Very High | Very Low |
| Risk | Adoption slow | ETF outflows | Centralization |
Want me to do:
LINK vs XRP vs TRX - which to buy now head-to-head portfolio?
LINK 1H / 4H scalp levels with exact entry / SL / TP?
LINK staking + CCIP revenue - how LINK actually makes money?
#LINK🔥🔥🔥 #LINKUpdates #LINKAnalysis #LINKUSDT #TrendingPredictions
18 Nov 2026 | Price: ∼$9.30
LINK is in a bearish breakdown, testing a make-or-break support zone. It has lost its long-term support at $10.61, fallen -22.2% in 30 days, and is now fighting to hold $8.88 - $9.00.
Fundamentally, Chainlink has never been stronger - it's becoming the standard for tokenized real-world assets. But price is not following fundamentals right now. That divergence is the whole story.
This is not financial advice.
1. Live Market Snapshot
| Metric | Value |
| --- | --- |
| Current Price | $9.30 |
| 24h Range | $8.95 - $9.38 |
| 24h Change | +1.82% to +1.95% |
| Market Cap Rank | #17 |
| 24h Forecast Range | $8.86 - $9.60, average ~$9.23 |
| Circulating Supply | ∼657M LINK (of 1B max) |
| All-Time High | $52.88 (May 2021) - now -82.4% below ATH |
Performance:
30 days: -22.2%
Recent: Fell from above $11.00 earlier in November to ∼$9.30 now
1-day technical sentiment: 34% Bullish / 66% Bearish
Sentiment: Neutral 62% in AI trackers, but market-wide Fear & Greed is Extreme Fear. LINK is not panicking alone, it's being dragged down.
## 2. What Just Happened?
LINK fell below the long-term swing support of $10.61 - a level that held for months.
That breakdown triggered a fast drop to $8.95 low. Now it's bouncing slightly to $9.30, but still below all major moving averages.
Analysts call $8.88 the make-or-break test.
3. Technical Analysis
Trend: Strong Bearish
LINK trades below short-, medium-, and long-term moving averages with high volatility, facing strong selling pressure.
MA-20 (hourly): $9.72
MA-50 (hourly): $9.87
MA-200 (daily): $10.11
200-day SMA: $10.10
Price at $9.30 is below ALL of them. Every rally will hit resistance.
Technical rating: Strong Bearish / Strong Sell
Momentum: Weak, Approaching Oversold
RSI: 34.62 - 36.1
Stochastic RSI: 40.42
CCI: -92.53
RSI near 34 means heavy selling, but not yet deeply oversold like XRP was at 17. Still room to fall if $8.88 breaks.
Key Levels
| Type | Level | Why it matters |
| --- | --- | --- |
| CRITICAL Support | $8.88 | 78.6% Fibonacci retracement inside Fair Value Gap. Make-or-break. A bullish reaction here = strong reversal signal |
| Support 1 | $9.1769 - $9.28 | Nearest support, only 0.2-0.5% below |
| Support 2 | $8.652 | Classic strong support / next floor if $8.88 fails |
| Support 3 | $7.482 - $7.71 | 7-day range low, capitulation zone |
| Resistance 1 | $9.47 - $9.6291 | Nearest resistance, +1.8% to +4.4% above |
| Resistance 2 | $9.88 | Ichimoku Kijun - immediate barrier |
| Resistance 3 | $10.44 - $10.61 | Old support turned resistance. Must reclaim to flip bullish |
| Major Resistance | $10.915 - $11.13 | 200-day + breakout zone |
| Breakout Target | $12.74 - $14.40 | If $11 breaks, next targets |
Near-term range: $8.94 - $9.57, with consolidation expected between $8.77 - $9.68 in base case (45% probability).
7-day range: $7.71 - $10.70
Buy zone concept: Some traders are watching $9.00 - $9.20 as accumulation, with stop below $8.65.
4. Fundamental Analysis - Why LINK Is Different
Chainlink launched in 2017 with 1B LINK tokens - 35% public, 35% node operators/ecosystem, 30% Chainlink Labs.
It is a Decentralized Oracle Network (DON) - it bridges real-world data (prices, weather, reserves, etc.) with blockchain smart contracts. Without oracles, DeFi cannot work.
Bullish Fundamentals - Strongest Ever
1. RWA Tokenization - The #1 Institutional Narrative
Total tokenized real-world assets hit $39.2B in Oct 2026, up from ∼$21B at start of year. Chainlink is positioned as the infrastructure for this.
2. CCIP - Cross-Chain Interoperability Protocol
CCIP lets data and assets move between blockchains. According to Chainlink's Q3 2026 review, more than $15B in token value migrated to CCIP during 2026, while the protocol secured over $85B in value.
3. Gold Token + Compliance - Oct 27, 2026
Two big institutional integrations:
Plan to bring Hong Kong Gold Exchange's HKGX gold-backed XGZ token to CCIP via GoldZip and Midas Labs
Automated Compliance Engine (ACE) selected by ADQ-backed Further Asset Management for tokenized funds
4. Japan Expansion - Oct 18, 2026
Pacific Meta selected CCIP as its preferred solution for cross-chain interoperability to enable institutional tokenization in Japan.
5. Stellar Integration - Oct 14, 2026
Chainlink Data Feeds and Data Streams went live on Stellar, which hosts $4B+ of tokenized RWAs, giving Stellar DeFi apps access to Chainlink oracles. LINK rose 3.7% on that news.
6. Robinhood Chain + TradFi
Chainlink is working with Robinhood Chain (broker's public L2 for trading) and other TradFi players. RWA tokenisation is driving demand for data services, custody, and automated collateral management.
Bearish / Risk Factors
1. CCIP Adoption Still Tiny
CCIP's total distributed asset value has fallen to $322M, only 0.8% of the ∼$40B RWA market. Huge potential, but also shows adoption is early.
2. LINK Token Utility Question
Chainlink secures $85B+, but LINK token itself is mainly used for paying node operators and staking. Critics ask: does usage directly drive LINK price? Not always.
3. Token Unlocks / Supply
Team / ecosystem still holds large supply. Selling pressure from node operator payments is constant.
4. Correlation to Market
Even with great news, LINK fell -22% in a month because BTC / ETH fell. Fundamentals don't protect short-term price.
5. Scenarios - What to Watch
🟢 Bullish Scenario (30% probability)
Trigger: Hold $8.88, daily close back above $9.88 (Kijun), then $10.61
Target: $10.44 -> $11.13 -> $12.74 -> $14.40
Analyst CryptoTanx sees a possible double bottom in $9 - $11 zone.
November forecast: $9.02 - $12.74, average $10.61, +15.00% upside if recovery holds.
1-month model target: $11.77
🟡 Base / Sideways Scenario (45% probability - Most Likely)
Range: $8.77 - $9.68
LINK consolidates, builds a base at $8.88 - $9.30, RSI recovers. No breakout yet, but no breakdown either. This is accumulation time for long-term holders.
🔴 Bearish Scenario (25% probability)
Trigger: Daily close below $8.88 with volume, especially below $8.65
Target: $7.71 -> $7.48 -> $6.38
This would confirm the breakdown from $10.61 was real and open a deeper capitulation. A bullish reversal is not confirmed yet.
6. Long-Term Outlook
| Period | Forecast |
| --- | --- |
| Nov 2026 | $9.43 - $11.10, target ~$10.25 |
| End of 2026 | $11.68 in historical models |
| 2027 | $15 - $18 range in many models (if RWA grows) |
| 2030 | $30 - $50 if CCIP becomes standard |
| Can it reclaim $50? | Only if RWA market goes from $39B to $500B+ AND LINK captures value via staking/fees. Possible, but not in 2026. |
Ignore $100+ hype targets for now - focus on reclaiming $10.61 first.
7. Strategy Summary (Not Advice)
For Traders:
Key level is $8.88. This is your line in the sand.
Long idea: Buy near $9.00 - $9.20, Stop below $8.65, Target $9.88 -> $10.61
Short / Avoid: Below $8.88, momentum is down
Next 24h range to trade: $8.95 - $9.35
For Long-Term Holders / DCA:
Current zone $9 - $11 is historically a strong accumulation zone (double bottom forming)
Fundamentals (CCIP + RWA + TradFi) are the best in LINK's history
But price can stay low for months even with good news - DCA slowly, don't all-in at one level
Staking LINK earns yield and reduces circulating supply - consider if you hold long-term
LINK vs $XRP vs $TRX Quick Comparison:
| | LINK | XRP | TRX |
| --- | --- | --- | --- |
| Price | $9.30 | $0.977 | $0.307 |
| YTD / 30D | -22% / 30D | -48% YTD | +6.5% YTD |
| Strength | Oracle / RWA infra | Payments / ETF | USDT settlement |
| Volatility | High | Very High | Very Low |
| Risk | Adoption slow | ETF outflows | Centralization |
Want me to do:
LINK vs XRP vs TRX - which to buy now head-to-head portfolio?
LINK 1H / 4H scalp levels with exact entry / SL / TP?
LINK staking + CCIP revenue - how LINK actually makes money?
#LINK🔥🔥🔥 #LINKUpdates #LINKAnalysis #LINKUSDT #TrendingPredictions
209
Article
LINK/USD – Complete Chainlink Technical & Fundamental Analysis 15 November 2026$LINK /USD – Complete Chainlink Technical & Fundamental Analysis 15 November 2026
Current LINK market overview
$LINK /USDT
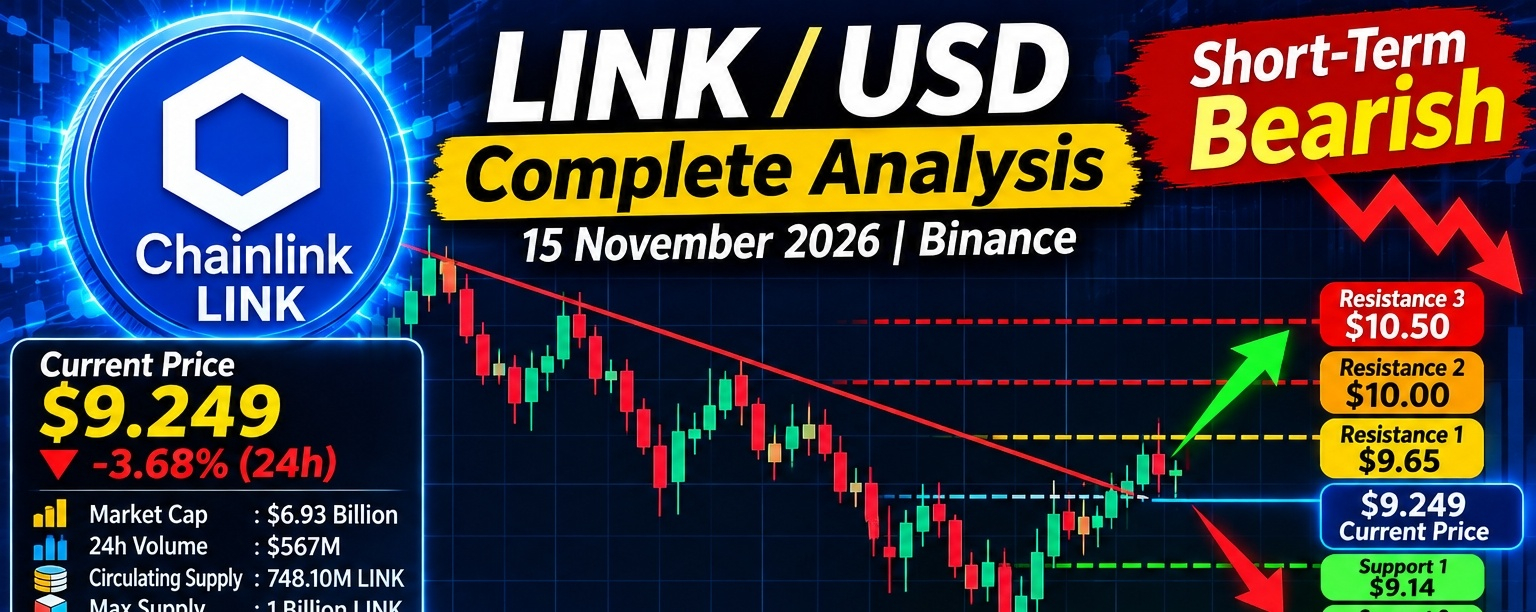
### $9.249
24-hour change: -3.68%
{spot}(LINKUSDT)
| Market metric | Latest reported |
| --------------------- | -------------------- |
| Market capitalization | $6.93 billion |
| 24h trading range | $8.566–$9.630 |
| Circulating supply | 748.10 million LINK |
| Maximum supply | 1 billion LINK |
| All-time high | $52.876 |
| Distance from ATH | Approximately -82.5% |
Market snapshot from CoinGlass, updated November 15, 2026. CoinGlass
Market interpretation: $LINK is experiencing selling pressure alongside broader cryptocurrency weakness. Its short-term recovery depends on defending nearby support and reclaiming resistance. CoinMarketCap
### 2\. Technical analysis
* Short-term trend: Bearish.
* 4-hour outlook: Recovery attempt needs confirmation.
* Daily outlook: Weak momentum.
* Buyer interest: Watch the $8.95–$9.14 area.
* Breakout confirmation: Above $9.65.
### 3\. Important support and resistance levels
Resistance levels
$10.50
Major resistance
$10.00
Strong resistance
$9.65
Immediate resistance
CURRENT MARKET PRICE
### $9.249
Support levels
$9.14
First support
$8.95
Important support
$8.63
Major support
Support and resistance levels are based on recent market analysis, not guaranteed price barriers. CoinGlass +1
### 4\. Bullish and bearish scenarios
Bullish scenario
Recovery possible
* LINK holds $9.14.
* Buyers reclaim $9.45.
* Breakout above $9.65.
* Next targets: $10.00 and $10.50.
Bullish confirmation: sustained breakout above $9.65.
Bearish scenario
Downside risk
* LINK loses $9.14.
* Price breaks below $8.95.
* Next support: $8.63.
* Further weakness possible if $8.63 fails.
Bearish confirmation: sustained breakdown below $8.95.
Sideways scenario
LINK consolidates between $8.95 and $9.65 while traders wait for a breakout.
### 5\. Fundamental analysis
Chainlink is a decentralized oracle network that connects blockchain smart contracts with real-world information and external systems.
Major strengths:
* Decentralized data feeds.
* Cross-Chain Interoperability Protocol (CCIP).
* Real-world asset tokenization.
* Institutional blockchain infrastructure.
* Smart contract security and data services.
Important developments: Chainlink expanded its collaboration with S&P Global Ratings in October 2026 to bring risk-assessment information on-chain. This could support institutional adoption. S&P Partnership Expansion
Main risks:
* Broader cryptocurrency market weakness.
* Competition from other oracle networks.
* Token price volatility.
* Regulatory uncertainty.
* Market-wide liquidity reductions.
### 6\. Binance trading strategy
Illustrative trading setup
| Trading parameter | Price |
| -------------------- | ----------- |
| Potential entry zone | $8.95–$9.15 |
| Breakout entry | Above $9.65 |
| Stop loss | Below $8.80 |
| Target 1 | $9.65 |
| Target 2 | $10.00 |
| Target 3 | $10.50 |
Trading advice:
* Avoid buying during strong selling pressure.
* Wait for a bullish candle confirmation.
* Monitor Bitcoin before opening an altcoin position.
* Keep stop-loss protection.
* Avoid excessive futures leverage.
### 7\. Short-term price prediction
These are conditional scenarios, not guaranteed forecasts.
| Scenario | LINK price |
| --------------- | ----------- |
| Bearish | $8.63 |
| Neutral | $8.95–$9.65 |
| Bullish | $10.00 |
| Strong recovery | $10.50 |
### 8\. Overall market outlook
### Bearish – short term
My trading assessment
* 1-hour: Watch for stabilization.
* 4-hour: Recovery needs confirmation.
* Daily: Selling pressure remains.
* Long term: Fundamental potential remains interesting.
Most important levels
Above $9.65
Bullish signal
$8.95–$9.65
Consolidation
Below $8.95
Bearish signal
### 9\. Final verdict
Chainlink has strong long-term utility through its oracle infrastructure, CCIP and institutional adoption opportunities. However, its short-term chart remains under pressure.
My recommendation: Wait for LINK to reclaim $9.65 before considering a stronger bullish trade. If $8.95 breaks, protect your capital and watch $8.63.
This is educational market analysis, not financ
ial advice. Cryptocurrency trading involves substantial risk.
I can also create a detailed LINK/USD Binance trading infographic with entry, stop-loss, targets, support and resistance levels for your next article.
#LINK🔥🔥🔥 #LINKAnalysis #LINKUSDT #TrendingTopic #viralpost
LINK/USD – Complete Chainlink Technical & Fundamental Analysis 15 November 2026
$LINK /USD – Complete Chainlink Technical & Fundamental Analysis 15 November 2026
Current LINK market overview
$LINK /USDT
### $9.249
24-hour change: -3.68%
| Market metric | Latest reported |
| --------------------- | -------------------- |
| Market capitalization | $6.93 billion |
| 24h trading range | $8.566–$9.630 |
| Circulating supply | 748.10 million LINK |
| Maximum supply | 1 billion LINK |
| All-time high | $52.876 |
| Distance from ATH | Approximately -82.5% |
Market snapshot from CoinGlass, updated November 15, 2026. CoinGlass
Market interpretation: $LINK is experiencing selling pressure alongside broader cryptocurrency weakness. Its short-term recovery depends on defending nearby support and reclaiming resistance. CoinMarketCap
### 2\. Technical analysis
* Short-term trend: Bearish.
* 4-hour outlook: Recovery attempt needs confirmation.
* Daily outlook: Weak momentum.
* Buyer interest: Watch the $8.95–$9.14 area.
* Breakout confirmation: Above $9.65.
### 3\. Important support and resistance levels
Resistance levels
$10.50
Major resistance
$10.00
Strong resistance
$9.65
Immediate resistance
CURRENT MARKET PRICE
### $9.249
Support levels
$9.14
First support
$8.95
Important support
$8.63
Major support
Support and resistance levels are based on recent market analysis, not guaranteed price barriers. CoinGlass +1
### 4\. Bullish and bearish scenarios
Bullish scenario
Recovery possible
* LINK holds $9.14.
* Buyers reclaim $9.45.
* Breakout above $9.65.
* Next targets: $10.00 and $10.50.
Bullish confirmation: sustained breakout above $9.65.
Bearish scenario
Downside risk
* LINK loses $9.14.
* Price breaks below $8.95.
* Next support: $8.63.
* Further weakness possible if $8.63 fails.
Bearish confirmation: sustained breakdown below $8.95.
Sideways scenario
LINK consolidates between $8.95 and $9.65 while traders wait for a breakout.
### 5\. Fundamental analysis
Chainlink is a decentralized oracle network that connects blockchain smart contracts with real-world information and external systems.
Major strengths:
* Decentralized data feeds.
* Cross-Chain Interoperability Protocol (CCIP).
* Real-world asset tokenization.
* Institutional blockchain infrastructure.
* Smart contract security and data services.
Important developments: Chainlink expanded its collaboration with S&P Global Ratings in October 2026 to bring risk-assessment information on-chain. This could support institutional adoption. S&P Partnership Expansion
Main risks:
* Broader cryptocurrency market weakness.
* Competition from other oracle networks.
* Token price volatility.
* Regulatory uncertainty.
* Market-wide liquidity reductions.
### 6\. Binance trading strategy
Illustrative trading setup
| Trading parameter | Price |
| -------------------- | ----------- |
| Potential entry zone | $8.95–$9.15 |
| Breakout entry | Above $9.65 |
| Stop loss | Below $8.80 |
| Target 1 | $9.65 |
| Target 2 | $10.00 |
| Target 3 | $10.50 |
Trading advice:
* Avoid buying during strong selling pressure.
* Wait for a bullish candle confirmation.
* Monitor Bitcoin before opening an altcoin position.
* Keep stop-loss protection.
* Avoid excessive futures leverage.
### 7\. Short-term price prediction
These are conditional scenarios, not guaranteed forecasts.
| Scenario | LINK price |
| --------------- | ----------- |
| Bearish | $8.63 |
| Neutral | $8.95–$9.65 |
| Bullish | $10.00 |
| Strong recovery | $10.50 |
### 8\. Overall market outlook
### Bearish – short term
My trading assessment
* 1-hour: Watch for stabilization.
* 4-hour: Recovery needs confirmation.
* Daily: Selling pressure remains.
* Long term: Fundamental potential remains interesting.
Most important levels
Above $9.65
Bullish signal
$8.95–$9.65
Consolidation
Below $8.95
Bearish signal
### 9\. Final verdict
Chainlink has strong long-term utility through its oracle infrastructure, CCIP and institutional adoption opportunities. However, its short-term chart remains under pressure.
My recommendation: Wait for LINK to reclaim $9.65 before considering a stronger bullish trade. If $8.95 breaks, protect your capital and watch $8.63.
This is educational market analysis, not financ
ial advice. Cryptocurrency trading involves substantial risk.
I can also create a detailed LINK/USD Binance trading infographic with entry, stop-loss, targets, support and resistance levels for your next article.
#LINK🔥🔥🔥 #LINKAnalysis #LINKUSDT #TrendingTopic #viralpost
Current LINK market overview
$LINK /USDT
### $9.249
24-hour change: -3.68%
| Market metric | Latest reported |
| --------------------- | -------------------- |
| Market capitalization | $6.93 billion |
| 24h trading range | $8.566–$9.630 |
| Circulating supply | 748.10 million LINK |
| Maximum supply | 1 billion LINK |
| All-time high | $52.876 |
| Distance from ATH | Approximately -82.5% |
Market snapshot from CoinGlass, updated November 15, 2026. CoinGlass
Market interpretation: $LINK is experiencing selling pressure alongside broader cryptocurrency weakness. Its short-term recovery depends on defending nearby support and reclaiming resistance. CoinMarketCap
### 2\. Technical analysis
* Short-term trend: Bearish.
* 4-hour outlook: Recovery attempt needs confirmation.
* Daily outlook: Weak momentum.
* Buyer interest: Watch the $8.95–$9.14 area.
* Breakout confirmation: Above $9.65.
### 3\. Important support and resistance levels
Resistance levels
$10.50
Major resistance
$10.00
Strong resistance
$9.65
Immediate resistance
CURRENT MARKET PRICE
### $9.249
Support levels
$9.14
First support
$8.95
Important support
$8.63
Major support
Support and resistance levels are based on recent market analysis, not guaranteed price barriers. CoinGlass +1
### 4\. Bullish and bearish scenarios
Bullish scenario
Recovery possible
* LINK holds $9.14.
* Buyers reclaim $9.45.
* Breakout above $9.65.
* Next targets: $10.00 and $10.50.
Bullish confirmation: sustained breakout above $9.65.
Bearish scenario
Downside risk
* LINK loses $9.14.
* Price breaks below $8.95.
* Next support: $8.63.
* Further weakness possible if $8.63 fails.
Bearish confirmation: sustained breakdown below $8.95.
Sideways scenario
LINK consolidates between $8.95 and $9.65 while traders wait for a breakout.
### 5\. Fundamental analysis
Chainlink is a decentralized oracle network that connects blockchain smart contracts with real-world information and external systems.
Major strengths:
* Decentralized data feeds.
* Cross-Chain Interoperability Protocol (CCIP).
* Real-world asset tokenization.
* Institutional blockchain infrastructure.
* Smart contract security and data services.
Important developments: Chainlink expanded its collaboration with S&P Global Ratings in October 2026 to bring risk-assessment information on-chain. This could support institutional adoption. S&P Partnership Expansion
Main risks:
* Broader cryptocurrency market weakness.
* Competition from other oracle networks.
* Token price volatility.
* Regulatory uncertainty.
* Market-wide liquidity reductions.
### 6\. Binance trading strategy
Illustrative trading setup
| Trading parameter | Price |
| -------------------- | ----------- |
| Potential entry zone | $8.95–$9.15 |
| Breakout entry | Above $9.65 |
| Stop loss | Below $8.80 |
| Target 1 | $9.65 |
| Target 2 | $10.00 |
| Target 3 | $10.50 |
Trading advice:
* Avoid buying during strong selling pressure.
* Wait for a bullish candle confirmation.
* Monitor Bitcoin before opening an altcoin position.
* Keep stop-loss protection.
* Avoid excessive futures leverage.
### 7\. Short-term price prediction
These are conditional scenarios, not guaranteed forecasts.
| Scenario | LINK price |
| --------------- | ----------- |
| Bearish | $8.63 |
| Neutral | $8.95–$9.65 |
| Bullish | $10.00 |
| Strong recovery | $10.50 |
### 8\. Overall market outlook
### Bearish – short term
My trading assessment
* 1-hour: Watch for stabilization.
* 4-hour: Recovery needs confirmation.
* Daily: Selling pressure remains.
* Long term: Fundamental potential remains interesting.
Most important levels
Above $9.65
Bullish signal
$8.95–$9.65
Consolidation
Below $8.95
Bearish signal
### 9\. Final verdict
Chainlink has strong long-term utility through its oracle infrastructure, CCIP and institutional adoption opportunities. However, its short-term chart remains under pressure.
My recommendation: Wait for LINK to reclaim $9.65 before considering a stronger bullish trade. If $8.95 breaks, protect your capital and watch $8.63.
This is educational market analysis, not financ
ial advice. Cryptocurrency trading involves substantial risk.
I can also create a detailed LINK/USD Binance trading infographic with entry, stop-loss, targets, support and resistance levels for your next article.
#LINK🔥🔥🔥 #LINKAnalysis #LINKUSDT #TrendingTopic #viralpost
87


·
--
Bullish
$LINK BULLISH ANALYSIS
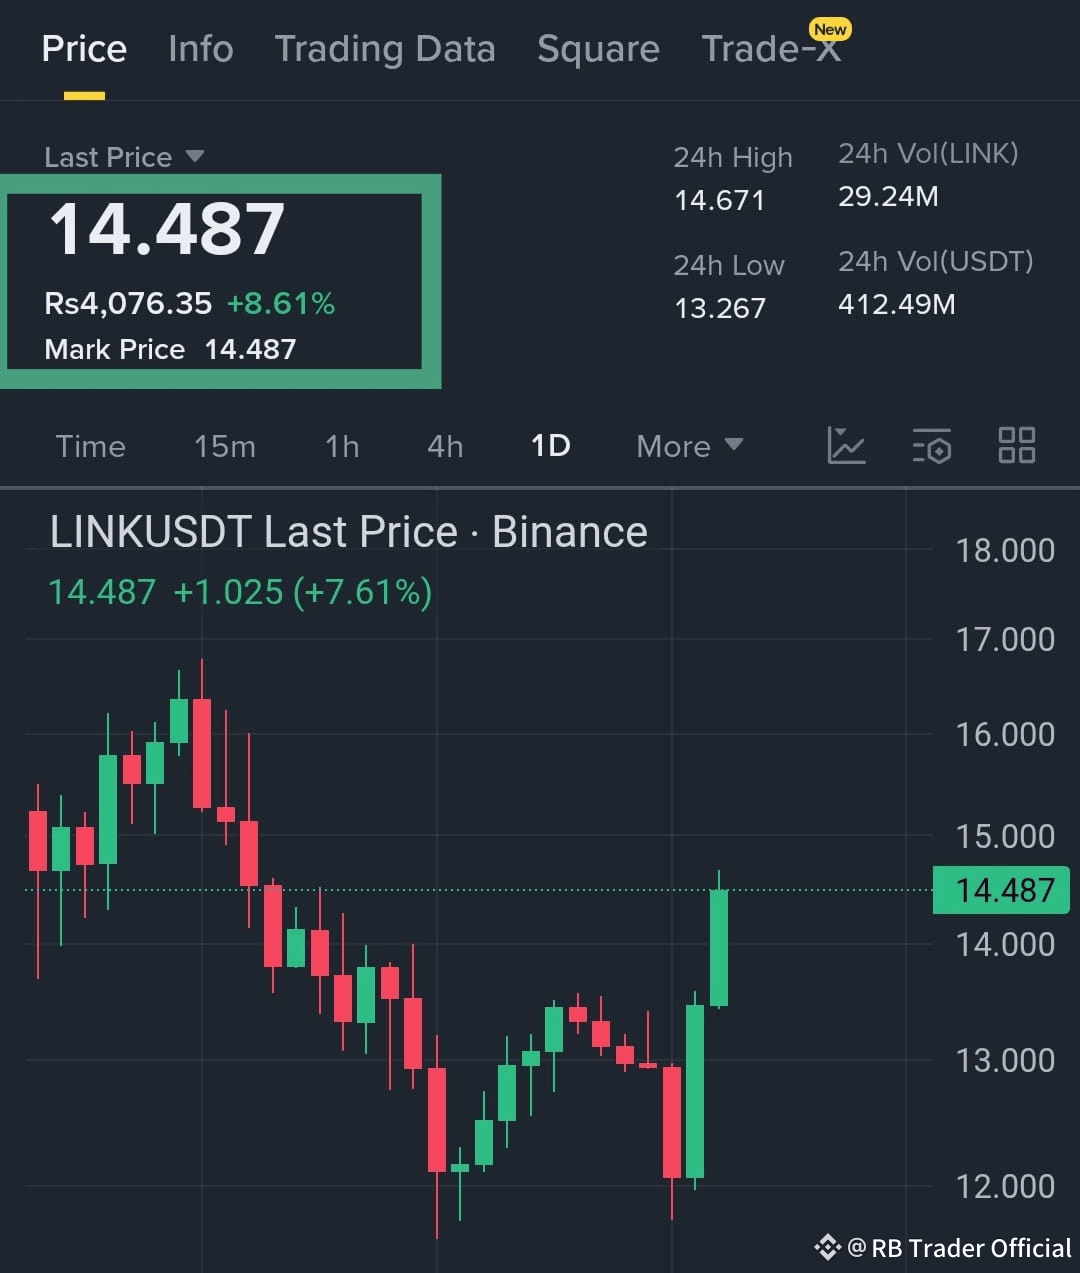
$LINK just printed a strong bullish engulfing candle after rejecting the 12.80–13.00 demand zone. Buyers stepped in aggressively, pushing the price back above 14.20 and showing clear momentum for continuation.
If this strength holds, the market is preparing for another leg up toward key resistance levels.
Entry Zone: 14.20 – 14.40
TP1: 14.90
TP2: 15.40
Stop Loss: 13.80
#LINKAnalysis #CryptoMarket
$LINK BULLISH ANALYSIS
$LINK just printed a strong bullish engulfing candle after rejecting the 12.80–13.00 demand zone. Buyers stepped in aggressively, pushing the price back above 14.20 and showing clear momentum for continuation.
If this strength holds, the market is preparing for another leg up toward key resistance levels.
Entry Zone: 14.20 – 14.40
TP1: 14.90
TP2: 15.40
Stop Loss: 13.80
#LINKAnalysis #CryptoMarket
$LINK just printed a strong bullish engulfing candle after rejecting the 12.80–13.00 demand zone. Buyers stepped in aggressively, pushing the price back above 14.20 and showing clear momentum for continuation.
If this strength holds, the market is preparing for another leg up toward key resistance levels.
Entry Zone: 14.20 – 14.40
TP1: 14.90
TP2: 15.40
Stop Loss: 13.80
#LINKAnalysis #CryptoMarket
1
134

·
--
Bullish
Let’s talk Chainlink, who’s quietly becoming the AI oracle king. Chainlink has been winning where it matters most — fundamentals.
In 2025 alone, it pushed past $27T+ in total value enabled, partnered with Mastercard to open crypto access to 3B+ cardholders, worked with UBS on live tokenized fund workflows, and joined Swift plus 24 major players like DTCC and Euroclear to tackle the $58B corporate actions problem using AI and CRE.
And it did not slow down in Q1 2026.
CCIP monthly volume jumped 62% YoY to $18B.
18 new integrations landed across 22 networks.
Data Streams expanded to tokenized U.S. stocks through Ondo and TSX data across 40+ chains.
Protocol revenue reportedly ran at 5x early-2025 levels.
Santiment also flagged Chainlink as #1 in DeFi development activity across 4,000+ tracked projects.
So yes, the fundamentals are there.
Now look at the chart.
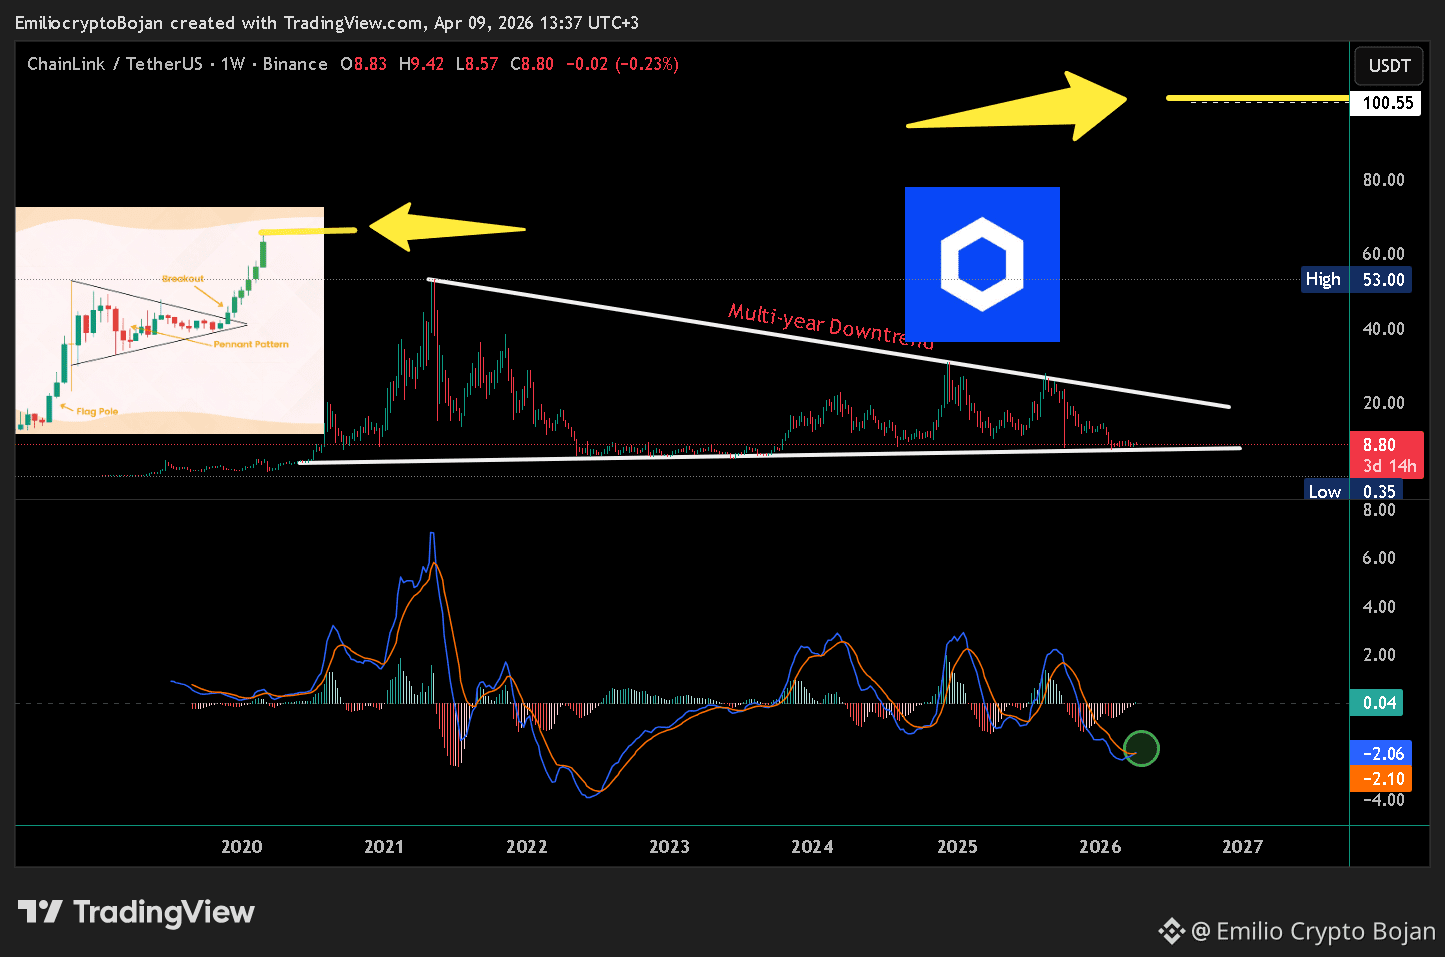
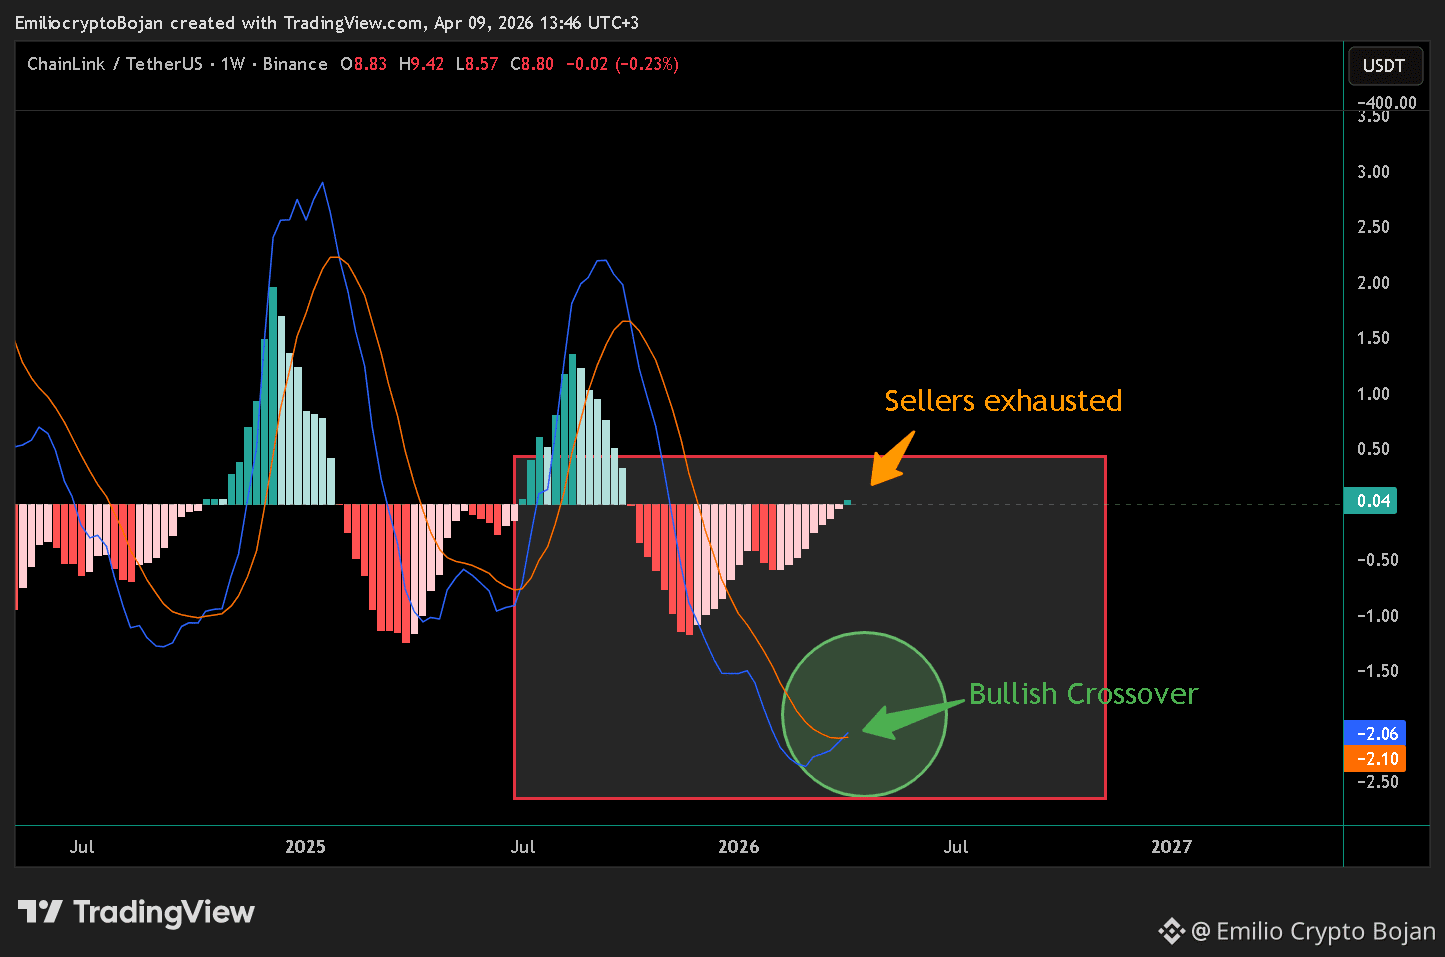
In fact, Chainlink bulls have already signed in with a bullish pennant across the longer-term and medium-term timeframes. It also has a bullish crossover, sellers look exhausted, and the green histogram is printing confirmation.
That combination is dangerous.
Real adoption.
Real numbers.
Real momentum.
$LINK is not just another alt.
It is becoming the infrastructure layer for AI, RWAs, and cross-chain finance. 🚀
#BinanceWalletLaunchesPredictionMarkets ##IranClosesHormuzAgain #CZLiveAMA #LINKanalysis
Let’s talk Chainlink, who’s quietly becoming the AI oracle king. Chainlink has been winning where it matters most — fundamentals.
In 2025 alone, it pushed past $27T+ in total value enabled, partnered with Mastercard to open crypto access to 3B+ cardholders, worked with UBS on live tokenized fund workflows, and joined Swift plus 24 major players like DTCC and Euroclear to tackle the $58B corporate actions problem using AI and CRE.
And it did not slow down in Q1 2026.
CCIP monthly volume jumped 62% YoY to $18B.
18 new integrations landed across 22 networks.
Data Streams expanded to tokenized U.S. stocks through Ondo and TSX data across 40+ chains.
Protocol revenue reportedly ran at 5x early-2025 levels.
Santiment also flagged Chainlink as #1 in DeFi development activity across 4,000+ tracked projects.
So yes, the fundamentals are there.
Now look at the chart.
In fact, Chainlink bulls have already signed in with a bullish pennant across the longer-term and medium-term timeframes. It also has a bullish crossover, sellers look exhausted, and the green histogram is printing confirmation.
That combination is dangerous.
Real adoption.
Real numbers.
Real momentum.
$LINK is not just another alt.
It is becoming the infrastructure layer for AI, RWAs, and cross-chain finance. 🚀
#BinanceWalletLaunchesPredictionMarkets ##IranClosesHormuzAgain #CZLiveAMA #LINKanalysis
In 2025 alone, it pushed past $27T+ in total value enabled, partnered with Mastercard to open crypto access to 3B+ cardholders, worked with UBS on live tokenized fund workflows, and joined Swift plus 24 major players like DTCC and Euroclear to tackle the $58B corporate actions problem using AI and CRE.
And it did not slow down in Q1 2026.
CCIP monthly volume jumped 62% YoY to $18B.
18 new integrations landed across 22 networks.
Data Streams expanded to tokenized U.S. stocks through Ondo and TSX data across 40+ chains.
Protocol revenue reportedly ran at 5x early-2025 levels.
Santiment also flagged Chainlink as #1 in DeFi development activity across 4,000+ tracked projects.
So yes, the fundamentals are there.
Now look at the chart.
In fact, Chainlink bulls have already signed in with a bullish pennant across the longer-term and medium-term timeframes. It also has a bullish crossover, sellers look exhausted, and the green histogram is printing confirmation.
That combination is dangerous.
Real adoption.
Real numbers.
Real momentum.
$LINK is not just another alt.
It is becoming the infrastructure layer for AI, RWAs, and cross-chain finance. 🚀
#BinanceWalletLaunchesPredictionMarkets ##IranClosesHormuzAgain #CZLiveAMA #LINKanalysis
2
4
1.9k
Log in to explore more content
Join global crypto users on Binance Square
⚡️ Get latest and useful information about crypto.
💬 Trusted by the world’s largest crypto exchange.
👍 Discover real insights from verified creators.
Email / Phone number
Trending Topics
1
#BTCReboundsAbove$60KAmidWhaleDipBuying
16,364 views
122 Discussing
2
#SolanaSets2027RoadmapToDoubleComputeCapacity
2,988 views
129 Discussing
3
#CaliforniaNvidiaProbeExaminesPotentialCriminalViolations
1,978 views
35 Discussing
4
#BlackRockLaunchesHKDollarDigitalLiquidityFund
4,508 views
133 Discussing
5
#NvidiaLoses$2.7TrillionInMonthAndAHalf
51,060 views
243 Discussing
6
#GlobalStocksFaceLongestLosingStreakSince2023
437,302 views
2,832 Discussing
7
#BlackRockIBITPostsRecord$541MSingleDayOutflow
67,293 views
157 Discussing
8
#AnthropicPlungesTowardIPOPriceonDay2
238,129 views
1,854 Discussing
9
#TwentyOneCapitalAdds172.25BTC
117,433 views
1,221 Discussing
10
#HKBillWouldExcludeTokenizedDepositsFromVirtualAssets
15,306 views
85 Discussing