
#mstrb
mstrb
30,004 views
928 Discussing
Hot
Latest

·
--
A 5.94% pullback brings $MSTRB into a critical stabilization phase.
Currently trading at $78.97 with $27.71M in 24-hour volume, price action has moderated within its recent range.
If buyers maintain this level and push toward the 87.93 high, bullish continuation remains on the table. Conversely, slipping beneath the 72.36 range low invalidates the consolidation thesis.
Will the current base confirm a move back toward 87.93, or does a break below 72.36 signal further downside?
Tap $MSTRB for the live chart. #MSTRB #BinanceSquare
A 5.94% pullback brings $MSTRB into a critical stabilization phase.
Currently trading at $78.97 with $27.71M in 24-hour volume, price action has moderated within its recent range.
If buyers maintain this level and push toward the 87.93 high, bullish continuation remains on the table. Conversely, slipping beneath the 72.36 range low invalidates the consolidation thesis.
Will the current base confirm a move back toward 87.93, or does a break below 72.36 signal further downside?
Tap $MSTRB for the live chart. #MSTRB #BinanceSquare
Currently trading at $78.97 with $27.71M in 24-hour volume, price action has moderated within its recent range.
If buyers maintain this level and push toward the 87.93 high, bullish continuation remains on the table. Conversely, slipping beneath the 72.36 range low invalidates the consolidation thesis.
Will the current base confirm a move back toward 87.93, or does a break below 72.36 signal further downside?
Tap $MSTRB for the live chart. #MSTRB #BinanceSquare
28

·
--
Strategy Pulse: MSTRB Tests the Floor on Binance Spot 🚧
Price action – $MSTRB is trading at $75.19 on Binance Spot, down 12.66% over the past 24 hours. Volume remains modest, reflecting a cautious market stance.
Why it matters – Strategy Inc is a marquee fintech player; its performance often signals broader tech‑sector health and investor appetite for AI‑driven services.
Key levels – Immediate support sits at $73.00, with a secondary floor near $70.50. Resistance caps the rally around $78.00, while the mid‑range target lies near $76.50. A break below $70.50 would expose the bStock to deeper downside.
Short outlook – From a support‑defense angle, buyers must hold the $73.00 floor; failure to do so could trigger a sharper correction toward $68.00. Until that level proves resilient, the bias remains bearish.
#MSTRB #Stocks #BinanceSquare
Strategy Pulse: MSTRB Tests the Floor on Binance Spot 🚧
Price action – $MSTRB is trading at $75.19 on Binance Spot, down 12.66% over the past 24 hours. Volume remains modest, reflecting a cautious market stance.
Why it matters – Strategy Inc is a marquee fintech player; its performance often signals broader tech‑sector health and investor appetite for AI‑driven services.
Key levels – Immediate support sits at $73.00, with a secondary floor near $70.50. Resistance caps the rally around $78.00, while the mid‑range target lies near $76.50. A break below $70.50 would expose the bStock to deeper downside.
Short outlook – From a support‑defense angle, buyers must hold the $73.00 floor; failure to do so could trigger a sharper correction toward $68.00. Until that level proves resilient, the bias remains bearish.
#MSTRB #Stocks #BinanceSquare
Price action – $MSTRB is trading at $75.19 on Binance Spot, down 12.66% over the past 24 hours. Volume remains modest, reflecting a cautious market stance.
Why it matters – Strategy Inc is a marquee fintech player; its performance often signals broader tech‑sector health and investor appetite for AI‑driven services.
Key levels – Immediate support sits at $73.00, with a secondary floor near $70.50. Resistance caps the rally around $78.00, while the mid‑range target lies near $76.50. A break below $70.50 would expose the bStock to deeper downside.
Short outlook – From a support‑defense angle, buyers must hold the $73.00 floor; failure to do so could trigger a sharper correction toward $68.00. Until that level proves resilient, the bias remains bearish.
#MSTRB #Stocks #BinanceSquare
32
·
--
A 7.72% drop is not an automatic discount.
$MSTRB trades at $79.81 as selling pressure slows near recent range lows.
Trader checklist:
- Bullish trigger: Holding 77.82 to establish a base for stabilization.
- Invalidation signal: Breaking below 77.82, pointing to downside continuation.
Will buyers step in to defend 77.82, or does a break below it confirm further weakness?
Tap $MSTRB for the live chart. #MSTRB #BinanceSquare
A 7.72% drop is not an automatic discount.
$MSTRB trades at $79.81 as selling pressure slows near recent range lows.
Trader checklist:
- Bullish trigger: Holding 77.82 to establish a base for stabilization.
- Invalidation signal: Breaking below 77.82, pointing to downside continuation.
Will buyers step in to defend 77.82, or does a break below it confirm further weakness?
Tap $MSTRB for the live chart. #MSTRB #BinanceSquare
$MSTRB trades at $79.81 as selling pressure slows near recent range lows.
Trader checklist:
- Bullish trigger: Holding 77.82 to establish a base for stabilization.
- Invalidation signal: Breaking below 77.82, pointing to downside continuation.
Will buyers step in to defend 77.82, or does a break below it confirm further weakness?
Tap $MSTRB for the live chart. #MSTRB #BinanceSquare
5
·
--
With a 10.78% drop, can $MSTRB find steady footing here?
1. Current price sits at $83.74 on $15.00M in 24-hour volume.
2. A conditional push back above 84.23 signals buyers stepping in.
3. Staying below 84.23 invalidates stabilization and keeps downside pressure active.
Do you see a reclaim above 84.23, or does weakness confirm further downside?
Tap $MSTRB for the live chart. #MSTRB #BinanceSquare
With a 10.78% drop, can $MSTRB find steady footing here?
1. Current price sits at $83.74 on $15.00M in 24-hour volume.
2. A conditional push back above 84.23 signals buyers stepping in.
3. Staying below 84.23 invalidates stabilization and keeps downside pressure active.
Do you see a reclaim above 84.23, or does weakness confirm further downside?
Tap $MSTRB for the live chart. #MSTRB #BinanceSquare
1. Current price sits at $83.74 on $15.00M in 24-hour volume.
2. A conditional push back above 84.23 signals buyers stepping in.
3. Staying below 84.23 invalidates stabilization and keeps downside pressure active.
Do you see a reclaim above 84.23, or does weakness confirm further downside?
Tap $MSTRB for the live chart. #MSTRB #BinanceSquare
5

·
--
📉 $MSTRB ROCKS SIXTH STRAIGHT LOSS AS $BTC TESTS CRITICAL $62K SUPPORT 🦈
Institutional balance sheets holding heavy digital asset allocations are facing severe stress as systematic liquidation ripples through derivative structures. With $MSTRB sliding for six consecutive sessions alongside $BTC drifting toward the pivotal $62,000 liquidity pocket, macro pressure is testing institutional staying power. 📊
Smart money is closely tracking order book depth around this threshold to gauge whether corporate treasuries will be forced into defensive capital reallocation. 🔍 The inability to defend structural macro supports typically triggers cascading unwinds across correlated equity proxies. ⚡
💬 Are corporate treasury holders prepared to weather a deeper sweep below $62K, or will forced capital restructuring accelerate the downside? 👇
⚠️ Not financial advice. Always manage your risk. 🛡️
🏷️ #MSTRB #BTC #MarketStructure #InstitutionalFlow #Macro
🦈 ⚖️
📉 $MSTRB ROCKS SIXTH STRAIGHT LOSS AS $BTC TESTS CRITICAL $62K SUPPORT 🦈
Institutional balance sheets holding heavy digital asset allocations are facing severe stress as systematic liquidation ripples through derivative structures. With $MSTRB sliding for six consecutive sessions alongside $BTC drifting toward the pivotal $62,000 liquidity pocket, macro pressure is testing institutional staying power. 📊
Smart money is closely tracking order book depth around this threshold to gauge whether corporate treasuries will be forced into defensive capital reallocation. 🔍 The inability to defend structural macro supports typically triggers cascading unwinds across correlated equity proxies. ⚡
💬 Are corporate treasury holders prepared to weather a deeper sweep below $62K, or will forced capital restructuring accelerate the downside? 👇
⚠️ Not financial advice. Always manage your risk. 🛡️
🏷️ #MSTRB #BTC #MarketStructure #InstitutionalFlow #Macro
🦈 ⚖️
Institutional balance sheets holding heavy digital asset allocations are facing severe stress as systematic liquidation ripples through derivative structures. With $MSTRB sliding for six consecutive sessions alongside $BTC drifting toward the pivotal $62,000 liquidity pocket, macro pressure is testing institutional staying power. 📊
Smart money is closely tracking order book depth around this threshold to gauge whether corporate treasuries will be forced into defensive capital reallocation. 🔍 The inability to defend structural macro supports typically triggers cascading unwinds across correlated equity proxies. ⚡
💬 Are corporate treasury holders prepared to weather a deeper sweep below $62K, or will forced capital restructuring accelerate the downside? 👇
⚠️ Not financial advice. Always manage your risk. 🛡️
🏷️ #MSTRB #BTC #MarketStructure #InstitutionalFlow #Macro
🦈 ⚖️

19

·
--
🚨 $MSTRB BLEEDS FOR SIX STRAIGHT SESSIONS AS BITCOIN SLIDES TOWARD $62K 📉
The treasury play is taking a heavy beating as macro gravity pulls momentum right out of corporate balance sheets. When proxy vehicles drop six sessions in a row, it signals aggressive unwinding beneath the surface that retail often misinterprets as a simple dip. 📊
Market pressure is intensifying across the board as key psychological boundaries get tested under persistent selling weight. ⚡ Smart money watches how these proxy vehicles behave when core assets approach major support zones before committing fresh capital. 🌊
Are you treating this sustained corporate bleed as a structural warning sign or an overcooked flush? 👇
⚠️ Not financial advice. Always manage your risk. 🛡️
🏷️ #MSTRB #Bitcoin #Crypto #MarketDownturn #Trading
🔥 📉
🚨 $MSTRB BLEEDS FOR SIX STRAIGHT SESSIONS AS BITCOIN SLIDES TOWARD $62K 📉
The treasury play is taking a heavy beating as macro gravity pulls momentum right out of corporate balance sheets. When proxy vehicles drop six sessions in a row, it signals aggressive unwinding beneath the surface that retail often misinterprets as a simple dip. 📊
Market pressure is intensifying across the board as key psychological boundaries get tested under persistent selling weight. ⚡ Smart money watches how these proxy vehicles behave when core assets approach major support zones before committing fresh capital. 🌊
Are you treating this sustained corporate bleed as a structural warning sign or an overcooked flush? 👇
⚠️ Not financial advice. Always manage your risk. 🛡️
🏷️ #MSTRB #Bitcoin #Crypto #MarketDownturn #Trading
🔥 📉
The treasury play is taking a heavy beating as macro gravity pulls momentum right out of corporate balance sheets. When proxy vehicles drop six sessions in a row, it signals aggressive unwinding beneath the surface that retail often misinterprets as a simple dip. 📊
Market pressure is intensifying across the board as key psychological boundaries get tested under persistent selling weight. ⚡ Smart money watches how these proxy vehicles behave when core assets approach major support zones before committing fresh capital. 🌊
Are you treating this sustained corporate bleed as a structural warning sign or an overcooked flush? 👇
⚠️ Not financial advice. Always manage your risk. 🛡️
🏷️ #MSTRB #Bitcoin #Crypto #MarketDownturn #Trading
🔥 📉

7

·
--
Is $MSTRB carving out a bottom or preparing to break down? ⚖️
1. Market pause: Selling has slowed around $86.57, though volume indicates cautious participation.
2. Bullish trigger: A decisive push higher confirms buyer absorption and signals a potential recovery.
3. Invalidation point: A break beneath the 85.5 range low invalidates this base and warns of further selling.
Do you expect a confirmed rebound from here, or a breakdown under 85.5?
Tap $MSTRB for the live chart. #MSTRB #BinanceSquare
Is $MSTRB carving out a bottom or preparing to break down? ⚖️
1. Market pause: Selling has slowed around $86.57, though volume indicates cautious participation.
2. Bullish trigger: A decisive push higher confirms buyer absorption and signals a potential recovery.
3. Invalidation point: A break beneath the 85.5 range low invalidates this base and warns of further selling.
Do you expect a confirmed rebound from here, or a breakdown under 85.5?
Tap $MSTRB for the live chart. #MSTRB #BinanceSquare
1. Market pause: Selling has slowed around $86.57, though volume indicates cautious participation.
2. Bullish trigger: A decisive push higher confirms buyer absorption and signals a potential recovery.
3. Invalidation point: A break beneath the 85.5 range low invalidates this base and warns of further selling.
Do you expect a confirmed rebound from here, or a breakdown under 85.5?
Tap $MSTRB for the live chart. #MSTRB #BinanceSquare
43
·
--
A pullback is data, not panic.
$MSTRB is hovering at $94.72 after a -3.85% daily drop.
Trader checklist:
- Bullish scenario: If price holds above the 89.05 range low, buyers could build a base toward 99.15.
- Invalidation scenario: If 89.05 gives way, the stabilization structure fails.
Will buyers defend 89.05 to retest 99.15, or will a break below 89.05 invalidate the setup?
Tap $MSTRB for the live chart. #MSTRB #BinanceSquare
A pullback is data, not panic.
$MSTRB is hovering at $94.72 after a -3.85% daily drop.
Trader checklist:
- Bullish scenario: If price holds above the 89.05 range low, buyers could build a base toward 99.15.
- Invalidation scenario: If 89.05 gives way, the stabilization structure fails.
Will buyers defend 89.05 to retest 99.15, or will a break below 89.05 invalidate the setup?
Tap $MSTRB for the live chart. #MSTRB #BinanceSquare
$MSTRB is hovering at $94.72 after a -3.85% daily drop.
Trader checklist:
- Bullish scenario: If price holds above the 89.05 range low, buyers could build a base toward 99.15.
- Invalidation scenario: If 89.05 gives way, the stabilization structure fails.
Will buyers defend 89.05 to retest 99.15, or will a break below 89.05 invalidate the setup?
Tap $MSTRB for the live chart. #MSTRB #BinanceSquare
4
·
--
Tech Titan Tumble: $MSTRB Tests Support on Binance Spot 📉
Price action – $MSTRB trades at $94.28 on Binance Spot, down 5.11 % in the last 24 h with healthy volume. The dip reflects broader pressure on AI‑linked equities as investors await clearer earnings guidance.
Why it matters – Strategy Inc remains a bellwether for the AI and crypto‑mining crossover sector, and its price swing can signal sentiment shifts ahead of the upcoming quarterly report.
Key levels – Immediate support sits near $90.00, a zone that held during the previous pullback. Resistance clusters around $98.00, where sellers re‑emerged earlier this week. The mid‑range pivot is approximately $94.50, acting as a balance point for short‑term bias.
Outlook – Neutral. The stock appears to be consolidating within a tight range. A decisive break above $98.00 or below $90.00 would be needed to define the next move; until then, patience is advised.
#MSTRB #Stocks #BinanceSquare
Tech Titan Tumble: $MSTRB Tests Support on Binance Spot 📉
Price action – $MSTRB trades at $94.28 on Binance Spot, down 5.11 % in the last 24 h with healthy volume. The dip reflects broader pressure on AI‑linked equities as investors await clearer earnings guidance.
Why it matters – Strategy Inc remains a bellwether for the AI and crypto‑mining crossover sector, and its price swing can signal sentiment shifts ahead of the upcoming quarterly report.
Key levels – Immediate support sits near $90.00, a zone that held during the previous pullback. Resistance clusters around $98.00, where sellers re‑emerged earlier this week. The mid‑range pivot is approximately $94.50, acting as a balance point for short‑term bias.
Outlook – Neutral. The stock appears to be consolidating within a tight range. A decisive break above $98.00 or below $90.00 would be needed to define the next move; until then, patience is advised.
#MSTRB #Stocks #BinanceSquare
Price action – $MSTRB trades at $94.28 on Binance Spot, down 5.11 % in the last 24 h with healthy volume. The dip reflects broader pressure on AI‑linked equities as investors await clearer earnings guidance.
Why it matters – Strategy Inc remains a bellwether for the AI and crypto‑mining crossover sector, and its price swing can signal sentiment shifts ahead of the upcoming quarterly report.
Key levels – Immediate support sits near $90.00, a zone that held during the previous pullback. Resistance clusters around $98.00, where sellers re‑emerged earlier this week. The mid‑range pivot is approximately $94.50, acting as a balance point for short‑term bias.
Outlook – Neutral. The stock appears to be consolidating within a tight range. A decisive break above $98.00 or below $90.00 would be needed to define the next move; until then, patience is advised.
#MSTRB #Stocks #BinanceSquare
1


$MSTRB: MSTRB: The Indicator Trap
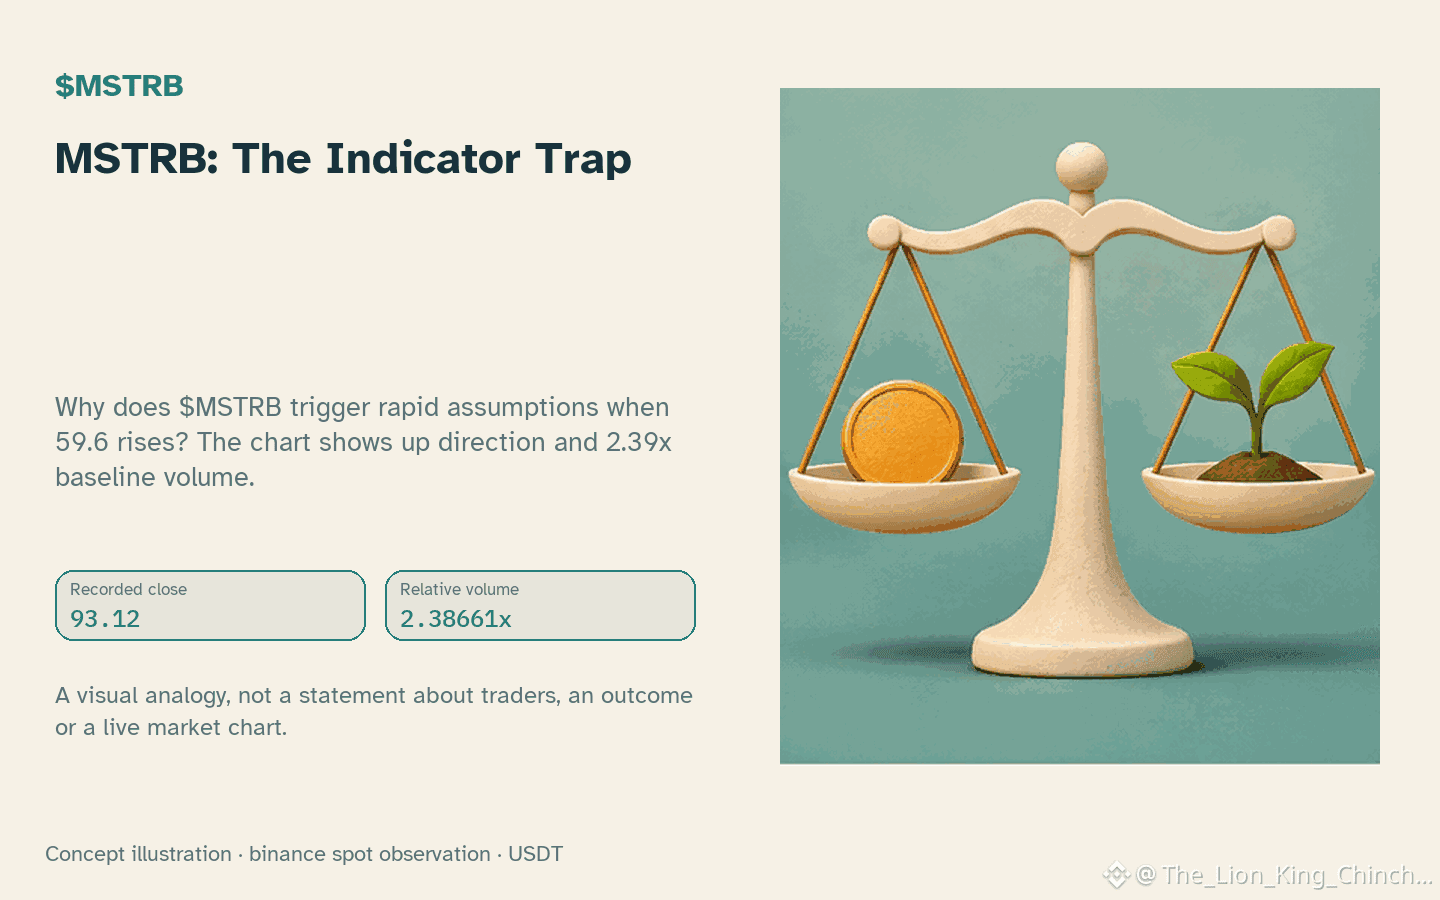
Why does $MSTRB trigger rapid assumptions when 59.6 rises? The chart shows up direction and 2.39x baseline volume.
The temptation to jump to conclusions
Traders often treat a single gauge as proof of intent. This is like hearing a creak in the floor and assuming a ghost exists. The sound is real, but the cause is unknown. A rising RSI can reflect many different market states. It might indicate strong buying pressure, or simply a lack of sellers. Without context, the label feels definitive, but the mechanism remains hidden. This shortcut ignores the complexity of price discovery.
A more careful interpretation
Consider the relationship between price and volume. If price moves up while volume stays flat, the move lacks conviction. Here, volume is above baseline, which adds weight to the move. However, we must check the candle structure. Is the move sustained? A single spike in activity does not guarantee a trend. The indicator reading acts as a signal, not a command. It highlights a change in momentum, but it does not explain why. We must look at the candle pattern and the range position to understand the context.
A useful next observation
To verify the interpretation, watch the next closed candle. If price holds above current support, the positive reading strengthens. If price reverses sharply, the initial assumption fails. This counterexample provides a self-check. It forces a reassessment based on new data rather than prior bias. The goal is to observe the mechanism, not guess the motive. By waiting for confirmation, we avoid the trap of the first suspect. The evidence will show us the truth.
Probabilistic market research, not a recommendation or guaranteed return.
#MSTRB #CryptoEducation
$MSTRB : MSTRB: The Indicator Trap
Why does $MSTRB trigger rapid assumptions when 59.6 rises? The chart shows up direction and 2.39x baseline volume.
The temptation to jump to conclusions
Traders often treat a single gauge as proof of intent. This is like hearing a creak in the floor and assuming a ghost exists. The sound is real, but the cause is unknown. A rising RSI can reflect many different market states. It might indicate strong buying pressure, or simply a lack of sellers. Without context, the label feels definitive, but the mechanism remains hidden. This shortcut ignores the complexity of price discovery.
A more careful interpretation
Consider the relationship between price and volume. If price moves up while volume stays flat, the move lacks conviction. Here, volume is above baseline, which adds weight to the move. However, we must check the candle structure. Is the move sustained? A single spike in activity does not guarantee a trend. The indicator reading acts as a signal, not a command. It highlights a change in momentum, but it does not explain why. We must look at the candle pattern and the range position to understand the context.
A useful next observation
To verify the interpretation, watch the next closed candle. If price holds above current support, the positive reading strengthens. If price reverses sharply, the initial assumption fails. This counterexample provides a self-check. It forces a reassessment based on new data rather than prior bias. The goal is to observe the mechanism, not guess the motive. By waiting for confirmation, we avoid the trap of the first suspect. The evidence will show us the truth.
Probabilistic market research, not a recommendation or guaranteed return.
#MSTRB #CryptoEducation
Why does $MSTRB trigger rapid assumptions when 59.6 rises? The chart shows up direction and 2.39x baseline volume.
The temptation to jump to conclusions
Traders often treat a single gauge as proof of intent. This is like hearing a creak in the floor and assuming a ghost exists. The sound is real, but the cause is unknown. A rising RSI can reflect many different market states. It might indicate strong buying pressure, or simply a lack of sellers. Without context, the label feels definitive, but the mechanism remains hidden. This shortcut ignores the complexity of price discovery.
A more careful interpretation
Consider the relationship between price and volume. If price moves up while volume stays flat, the move lacks conviction. Here, volume is above baseline, which adds weight to the move. However, we must check the candle structure. Is the move sustained? A single spike in activity does not guarantee a trend. The indicator reading acts as a signal, not a command. It highlights a change in momentum, but it does not explain why. We must look at the candle pattern and the range position to understand the context.
A useful next observation
To verify the interpretation, watch the next closed candle. If price holds above current support, the positive reading strengthens. If price reverses sharply, the initial assumption fails. This counterexample provides a self-check. It forces a reassessment based on new data rather than prior bias. The goal is to observe the mechanism, not guess the motive. By waiting for confirmation, we avoid the trap of the first suspect. The evidence will show us the truth.
Probabilistic market research, not a recommendation or guaranteed return.
#MSTRB #CryptoEducation
31
$MSTRB: Why Switching Lanes May Not Speed Up a Crypto Move
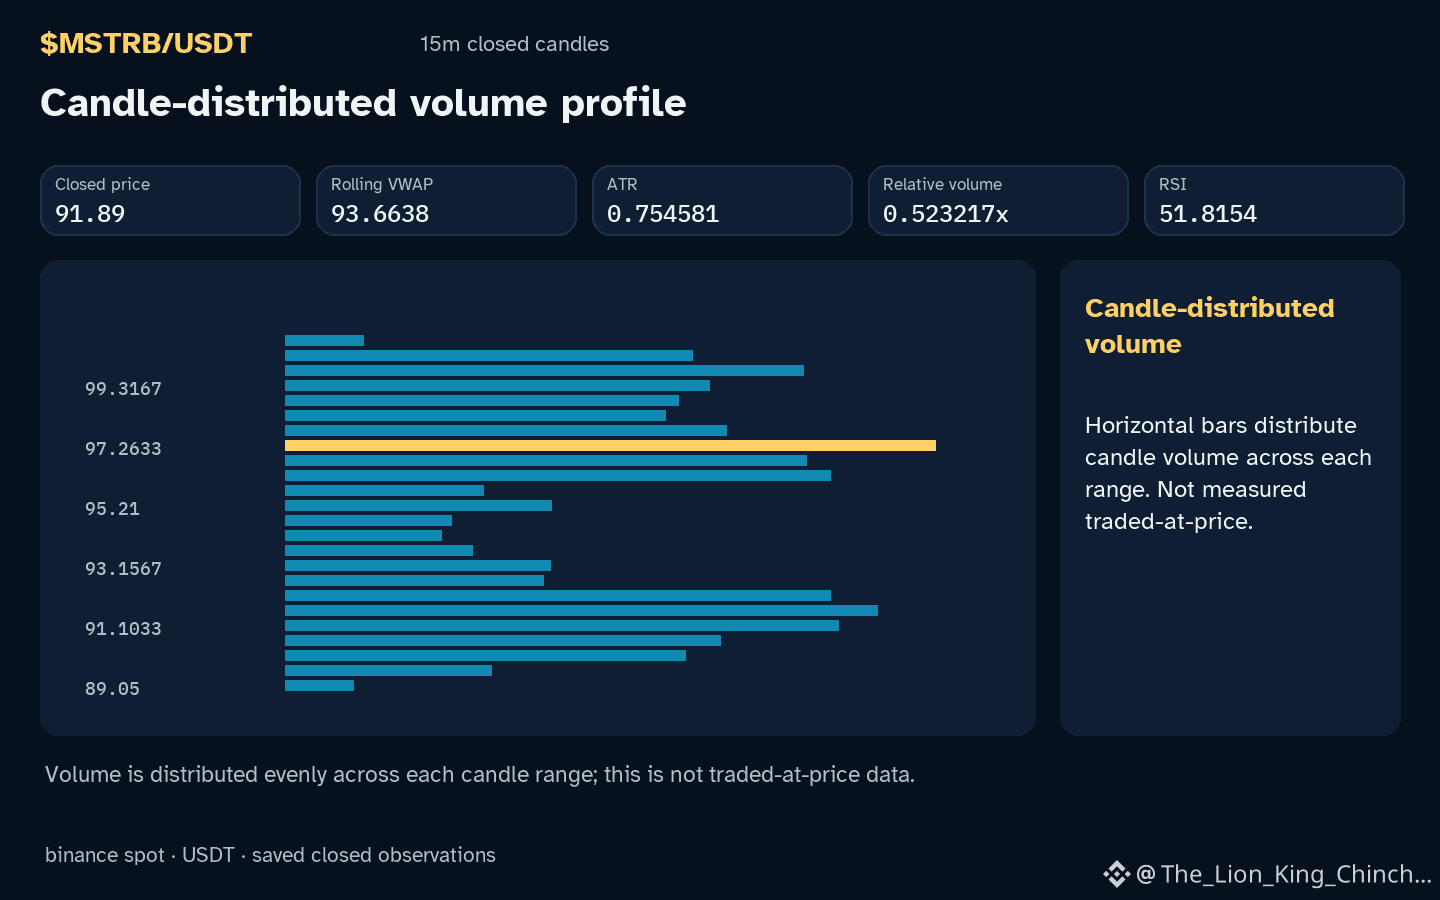
$MSTRB is trending down on the hourly chart while volume stays 0.52x baseline, prompting a question about the usefulness of chasing perceived rotation. The observation shows price moving inside its recent range, with no clear breakout and modest trading activity.
One way to think about this situation is the traffic‑lane switching analogy. Imagine a congested highway where drivers hope that changing lanes will get them ahead faster. In crypto markets, a trader might interpret a sudden dip in price as a lane change opportunity, assuming that liquidity will shift and the token will accelerate upward. The mechanism relies on the idea that market participants redistribute orders, creating a brief surge of buying pressure that can propel price.
However, the evidence does not guarantee such a shift. The current hourly direction is down, RSI 51.8 sits in a neutral zone, and relative volume is only modestly above baseline. If the lane change analogy were true, we would expect a noticeable spike in volume or a rapid reversal within the next few candles. A counterexample would be a scenario where volume remains flat and price continues to drift lower, showing that lane switching did not materialise.
The limits of this hypothesis are clear: without a measurable increase in activity, the traffic‑lane effect remains speculative. Future closed‑candle data showing an hourly change -0.541184% that stays negative while volume stays at 0.52x baseline would weaken the lane‑switch narrative and suggest that the token is simply following its existing trend.
Probabilistic market research, not a recommendation or guaranteed return.
The label or the mechanism behind it?
#MSTRB #CryptoEducation #CryptoLearning
$MSTRB : Why Switching Lanes May Not Speed Up a Crypto Move
$MSTRB is trending down on the hourly chart while volume stays 0.52x baseline, prompting a question about the usefulness of chasing perceived rotation. The observation shows price moving inside its recent range, with no clear breakout and modest trading activity.
One way to think about this situation is the traffic‑lane switching analogy. Imagine a congested highway where drivers hope that changing lanes will get them ahead faster. In crypto markets, a trader might interpret a sudden dip in price as a lane change opportunity, assuming that liquidity will shift and the token will accelerate upward. The mechanism relies on the idea that market participants redistribute orders, creating a brief surge of buying pressure that can propel price.
However, the evidence does not guarantee such a shift. The current hourly direction is down, RSI 51.8 sits in a neutral zone, and relative volume is only modestly above baseline. If the lane change analogy were true, we would expect a noticeable spike in volume or a rapid reversal within the next few candles. A counterexample would be a scenario where volume remains flat and price continues to drift lower, showing that lane switching did not materialise.
The limits of this hypothesis are clear: without a measurable increase in activity, the traffic‑lane effect remains speculative. Future closed‑candle data showing an hourly change -0.541184% that stays negative while volume stays at 0.52x baseline would weaken the lane‑switch narrative and suggest that the token is simply following its existing trend.
Probabilistic market research, not a recommendation or guaranteed return.
The label or the mechanism behind it?
#MSTRB #CryptoEducation #CryptoLearning
$MSTRB is trending down on the hourly chart while volume stays 0.52x baseline, prompting a question about the usefulness of chasing perceived rotation. The observation shows price moving inside its recent range, with no clear breakout and modest trading activity.
One way to think about this situation is the traffic‑lane switching analogy. Imagine a congested highway where drivers hope that changing lanes will get them ahead faster. In crypto markets, a trader might interpret a sudden dip in price as a lane change opportunity, assuming that liquidity will shift and the token will accelerate upward. The mechanism relies on the idea that market participants redistribute orders, creating a brief surge of buying pressure that can propel price.
However, the evidence does not guarantee such a shift. The current hourly direction is down, RSI 51.8 sits in a neutral zone, and relative volume is only modestly above baseline. If the lane change analogy were true, we would expect a noticeable spike in volume or a rapid reversal within the next few candles. A counterexample would be a scenario where volume remains flat and price continues to drift lower, showing that lane switching did not materialise.
The limits of this hypothesis are clear: without a measurable increase in activity, the traffic‑lane effect remains speculative. Future closed‑candle data showing an hourly change -0.541184% that stays negative while volume stays at 0.52x baseline would weaken the lane‑switch narrative and suggest that the token is simply following its existing trend.
Probabilistic market research, not a recommendation or guaranteed return.
The label or the mechanism behind it?
#MSTRB #CryptoEducation #CryptoLearning
55

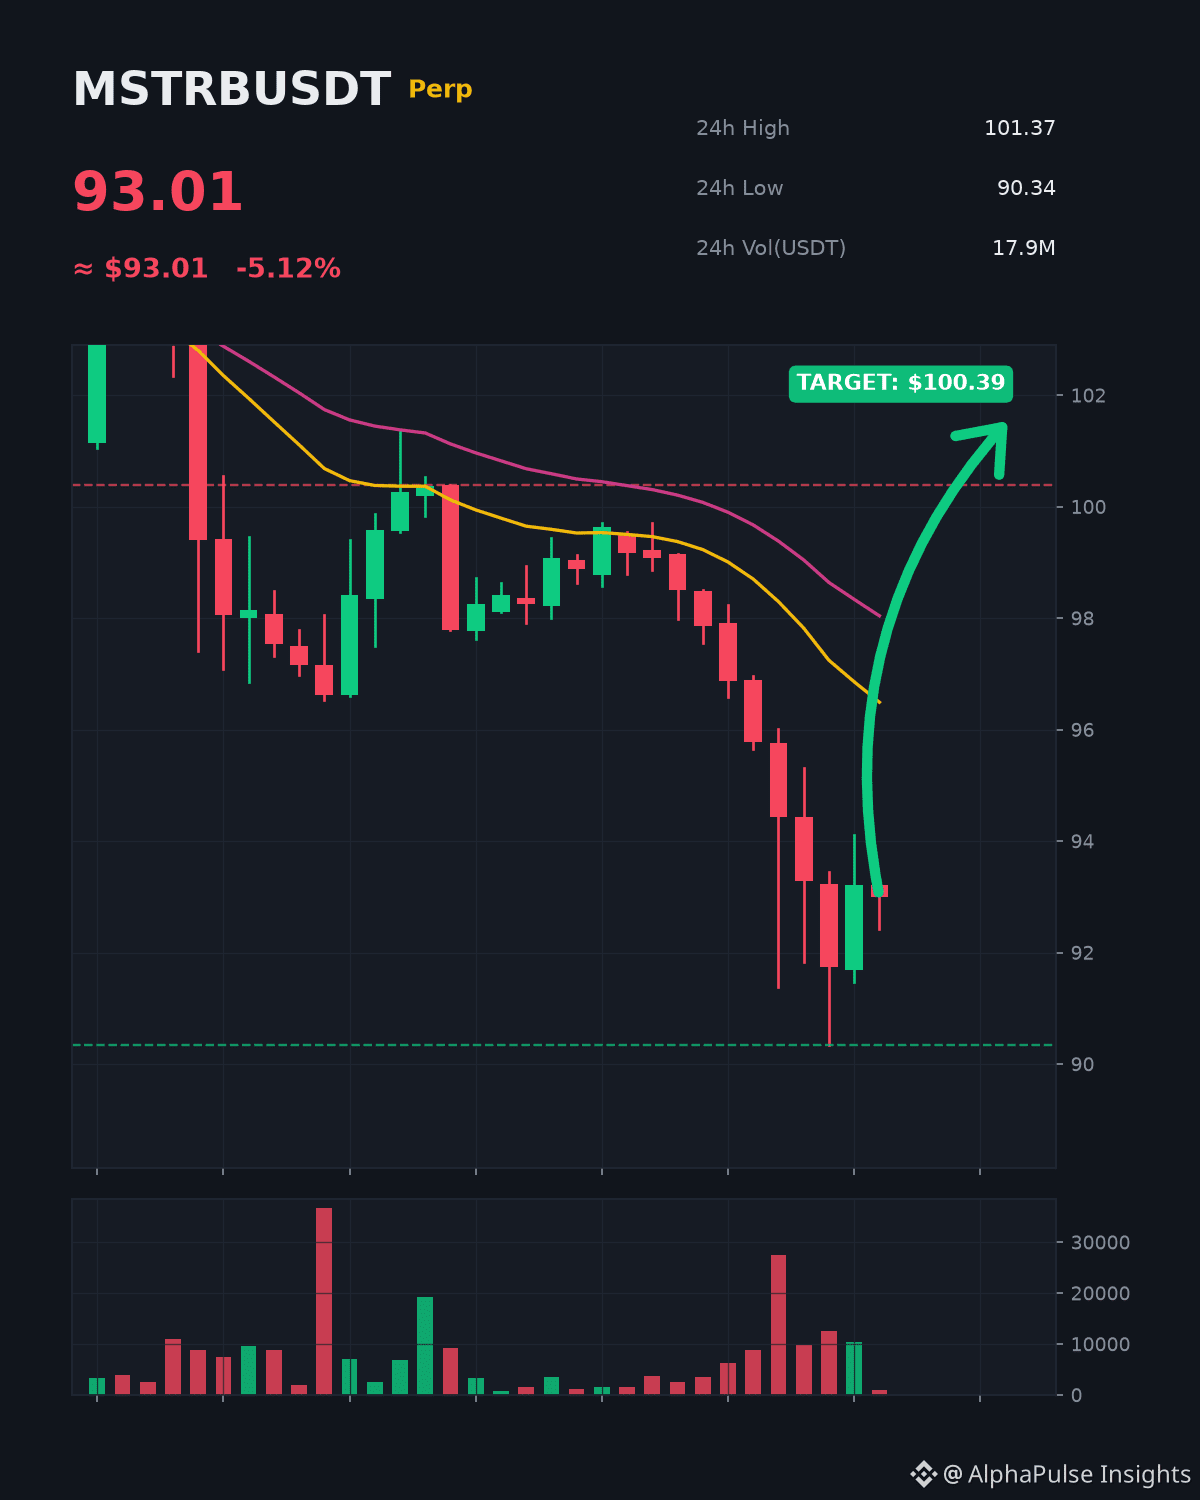
$MSTRB still trading beneath H1 EMA20 ($96.49) and testing support ($90.34). Price action indicates institutional toes still in the water, but retail emotions are getting the better of short-term traders. Will your FOMO-driven buys be crushed when price finds its way to 1H EMA20, invalidating current longs?
$MSTRB $ETH $BTC #MSTRB #Write2Earn #BinanceSquare
$MSTRB still trading beneath H1 EMA20 ($96.49) and testing support ($90.34). Price action indicates institutional toes still in the water, but retail emotions are getting the better of short-term traders. Will your FOMO-driven buys be crushed when price finds its way to 1H EMA20, invalidating current longs?
$MSTRB $ETH $BTC #MSTRB #Write2Earn #BinanceSquare
$MSTRB $ETH $BTC #MSTRB #Write2Earn #BinanceSquare
37
$MSTRB: Would Indicator Agreement Be Independent Evidence?
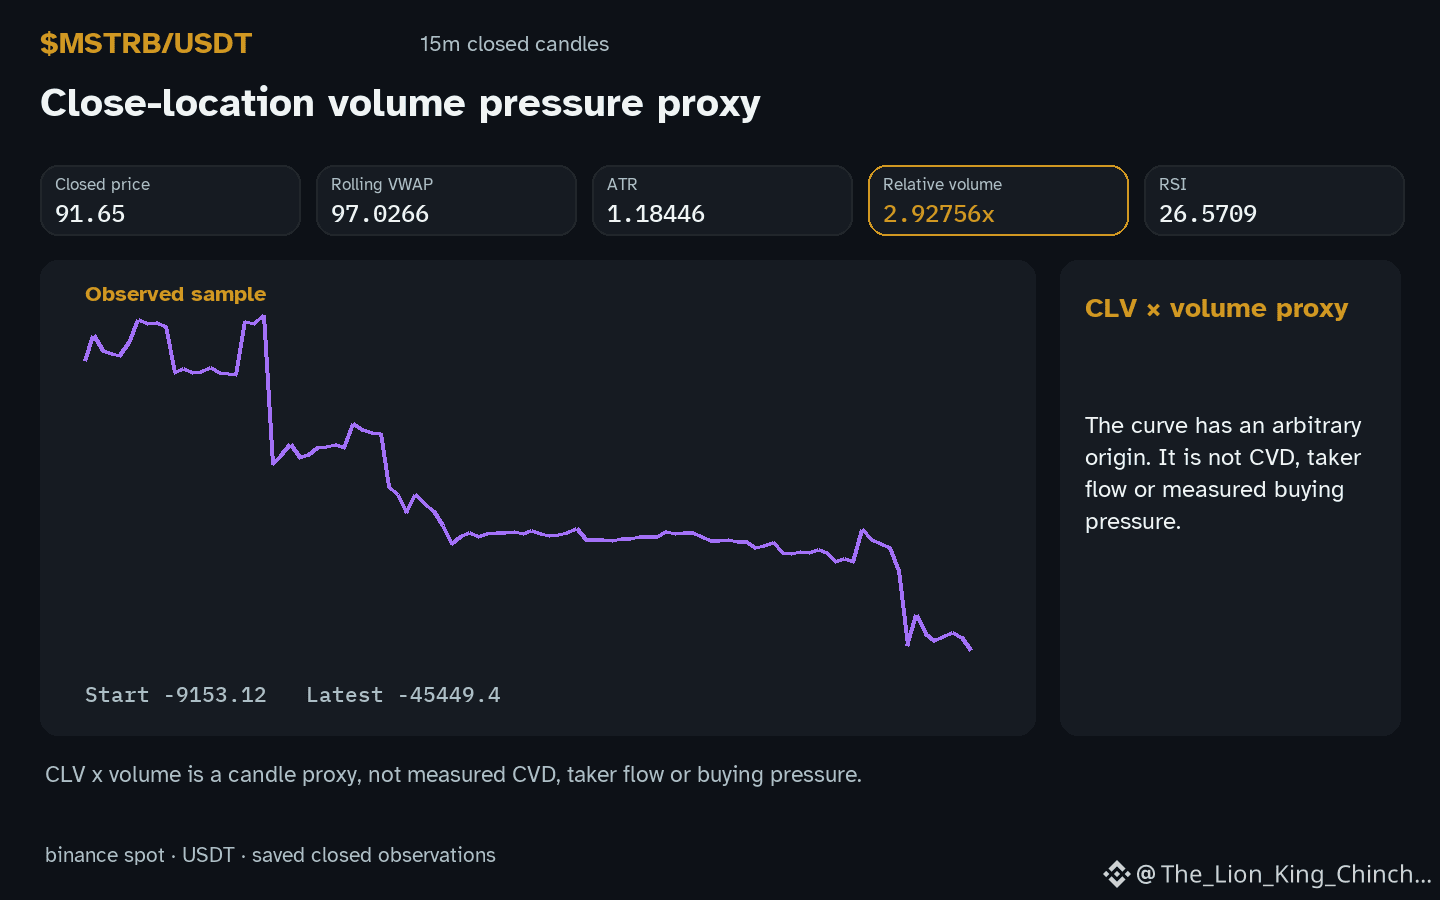
$MSTRB is trading down hourly while the price stays inside recorded range and volume is above baseline. The question is: does the alignment of trend, value, and volume suggest a confluence zone that could act as a support? A common assumption would be that when price moves lower yet remains within a recorded range and volume is higher than the baseline, buyers may be reinforcing the level. The counterexample to consider is that a single candle can show volume above baseline without any lasting effect if the market has no sustained buying pressure. What could change the reading? If the next hourly candle closes above the upper boundary of the range, the zone would shift and the earlier alignment would become a false signal. Conversely, if volume drops below the baseline after a lower close, the support may fail. Thus, the interpretation hinges on the persistence of volume and the direction of the next close relative to the range. Future evidence that weakens this reading would be a sudden spike in price below the lower support while volume stays above baseline, or a sustained downtrend that erodes the range boundaries. A concrete reassessment condition is to observe whether the next hourly close remains within the recorded range while maintaining volume above baseline; a break would invalidate the confluence hypothesis.
Probabilistic market research, not a recommendation or guaranteed return.
#MSTRB #MarketAnalysis #CryptoLearning
$MSTRB : Would Indicator Agreement Be Independent Evidence?
$MSTRB is trading down hourly while the price stays inside recorded range and volume is above baseline. The question is: does the alignment of trend, value, and volume suggest a confluence zone that could act as a support? A common assumption would be that when price moves lower yet remains within a recorded range and volume is higher than the baseline, buyers may be reinforcing the level. The counterexample to consider is that a single candle can show volume above baseline without any lasting effect if the market has no sustained buying pressure. What could change the reading? If the next hourly candle closes above the upper boundary of the range, the zone would shift and the earlier alignment would become a false signal. Conversely, if volume drops below the baseline after a lower close, the support may fail. Thus, the interpretation hinges on the persistence of volume and the direction of the next close relative to the range. Future evidence that weakens this reading would be a sudden spike in price below the lower support while volume stays above baseline, or a sustained downtrend that erodes the range boundaries. A concrete reassessment condition is to observe whether the next hourly close remains within the recorded range while maintaining volume above baseline; a break would invalidate the confluence hypothesis.
Probabilistic market research, not a recommendation or guaranteed return.
#MSTRB #MarketAnalysis #CryptoLearning
$MSTRB is trading down hourly while the price stays inside recorded range and volume is above baseline. The question is: does the alignment of trend, value, and volume suggest a confluence zone that could act as a support? A common assumption would be that when price moves lower yet remains within a recorded range and volume is higher than the baseline, buyers may be reinforcing the level. The counterexample to consider is that a single candle can show volume above baseline without any lasting effect if the market has no sustained buying pressure. What could change the reading? If the next hourly candle closes above the upper boundary of the range, the zone would shift and the earlier alignment would become a false signal. Conversely, if volume drops below the baseline after a lower close, the support may fail. Thus, the interpretation hinges on the persistence of volume and the direction of the next close relative to the range. Future evidence that weakens this reading would be a sudden spike in price below the lower support while volume stays above baseline, or a sustained downtrend that erodes the range boundaries. A concrete reassessment condition is to observe whether the next hourly close remains within the recorded range while maintaining volume above baseline; a break would invalidate the confluence hypothesis.
Probabilistic market research, not a recommendation or guaranteed return.
#MSTRB #MarketAnalysis #CryptoLearning
35

·
--
Bearish
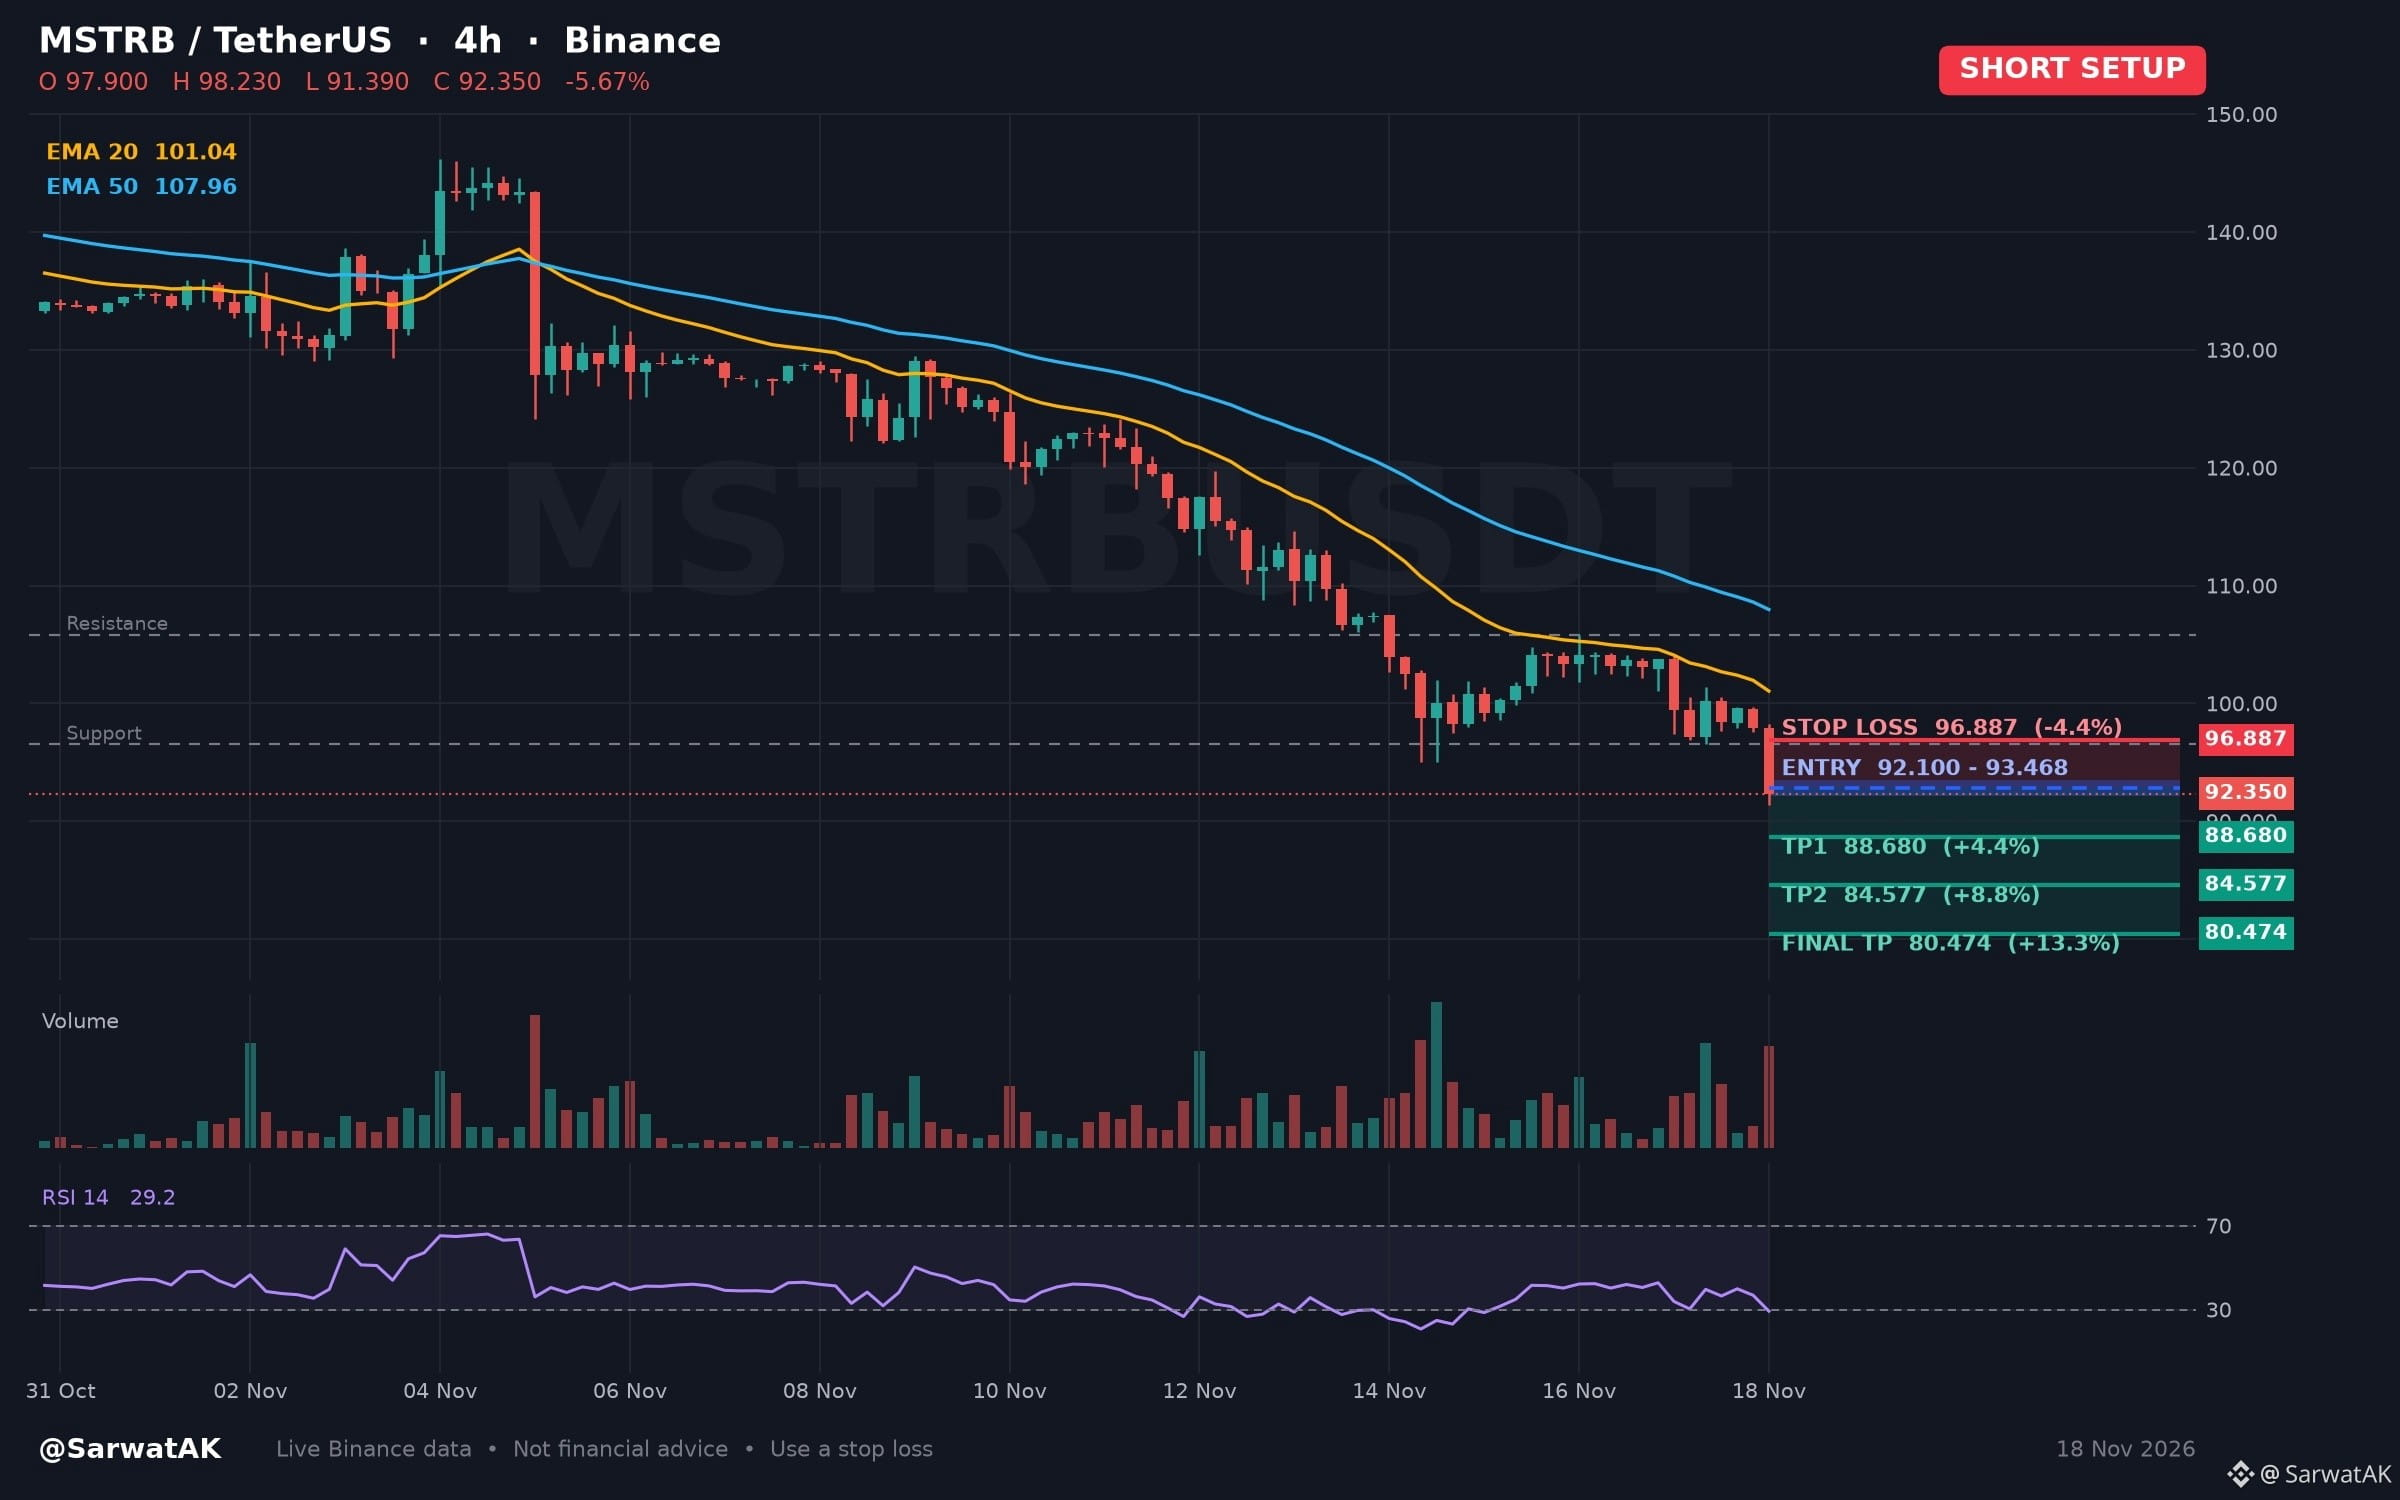
$MSTRB SHORT SETUP ... NEXT TARGET 80.474
Four-Hour Chart Tests Fresh Lows Amid Oversold Momentum Conditions
Entry: 92.100 - 93.468 (Short)
TP1: 88.680
TP2: 84.577
Final TP: 80.474
SL: 96.887
Price fell over the past twenty-four hours to trade below the low of the past twenty four-hour candles. The four-hour relative strength index is oversold, marking extended downside momentum.
As long as price stays below 93.468, structure stays heavy
Must use stop loss while trading
Trade $MSTRB
Not financial advice. Always DYOR.
🙏 Tips are always welcome and truly appreciated. Thank you for supporting Open to Discussion.
Like & Follow for Daily Trade Analytics & Insider News. @SarwatAK
#MSTRB #Breakdown #TradingSignals
{spot}(MSFTBUSDT)
$MSTRB SHORT SETUP ... NEXT TARGET 80.474
Four-Hour Chart Tests Fresh Lows Amid Oversold Momentum Conditions
Entry: 92.100 - 93.468 (Short)
TP1: 88.680
TP2: 84.577
Final TP: 80.474
SL: 96.887
Price fell over the past twenty-four hours to trade below the low of the past twenty four-hour candles. The four-hour relative strength index is oversold, marking extended downside momentum.
As long as price stays below 93.468, structure stays heavy
Must use stop loss while trading
Trade $MSTRB
Not financial advice. Always DYOR.
🙏 Tips are always welcome and truly appreciated. Thank you for supporting Open to Discussion.
Like & Follow for Daily Trade Analytics & Insider News. @SarwatAK
#MSTRB #Breakdown #TradingSignals
Four-Hour Chart Tests Fresh Lows Amid Oversold Momentum Conditions
Entry: 92.100 - 93.468 (Short)
TP1: 88.680
TP2: 84.577
Final TP: 80.474
SL: 96.887
Price fell over the past twenty-four hours to trade below the low of the past twenty four-hour candles. The four-hour relative strength index is oversold, marking extended downside momentum.
As long as price stays below 93.468, structure stays heavy
Must use stop loss while trading
Trade $MSTRB
Not financial advice. Always DYOR.
🙏 Tips are always welcome and truly appreciated. Thank you for supporting Open to Discussion.
Like & Follow for Daily Trade Analytics & Insider News. @SarwatAK
#MSTRB #Breakdown #TradingSignals
268

·
--
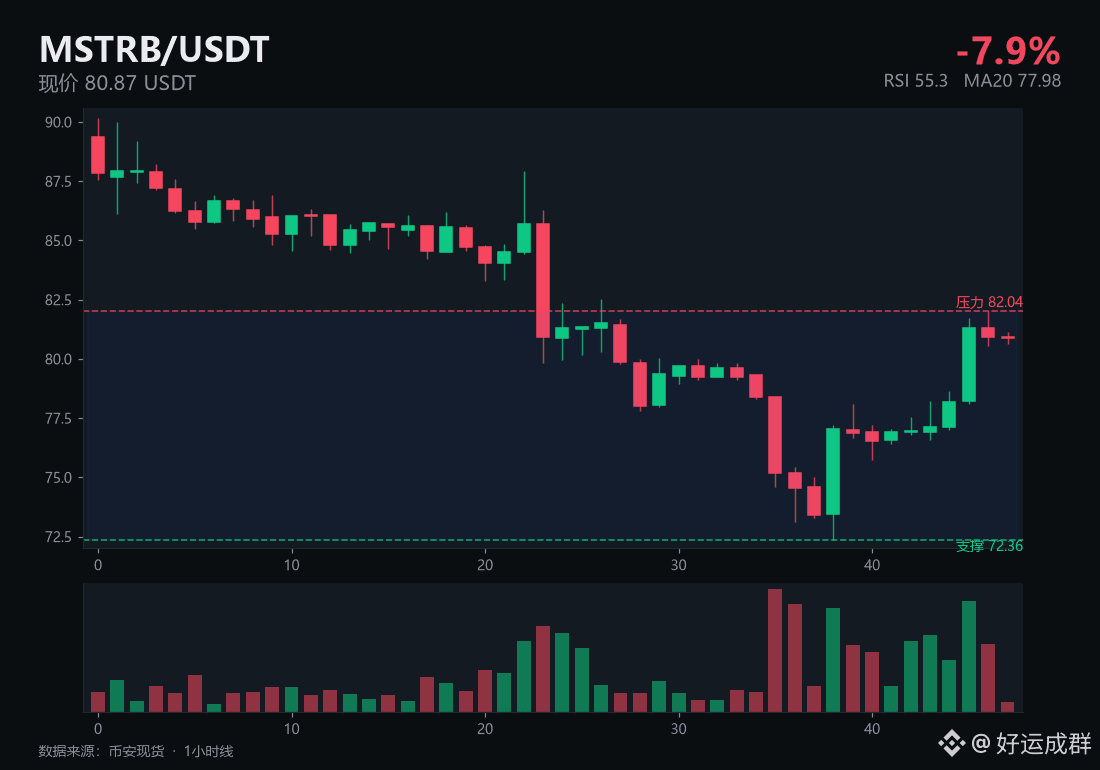
$MSTRB is down 7.9% today—worse than $BTC. $BTC is up 1.3% today.
Not every dip is worth buying; get it wrong and you’re just holding the bag for someone else.
Current price: 80.87, resistance: 82.04, support: 72.36, RSI: 55.3.
If you’re going to make a move, wait until it holds above 82.04. If it can’t, just watch for now—money in your hand won’t bite.
Have you made a move at this level?
#币圈 #MSTRB
$MSTRB is down 7.9% today—worse than $BTC . $BTC is up 1.3% today.
Not every dip is worth buying; get it wrong and you’re just holding the bag for someone else.
Current price: 80.87, resistance: 82.04, support: 72.36, RSI: 55.3.
If you’re going to make a move, wait until it holds above 82.04. If it can’t, just watch for now—money in your hand won’t bite.
Have you made a move at this level?
#币圈 #MSTRB
Not every dip is worth buying; get it wrong and you’re just holding the bag for someone else.
Current price: 80.87, resistance: 82.04, support: 72.36, RSI: 55.3.
If you’re going to make a move, wait until it holds above 82.04. If it can’t, just watch for now—money in your hand won’t bite.
Have you made a move at this level?
#币圈 #MSTRB
48
·
--
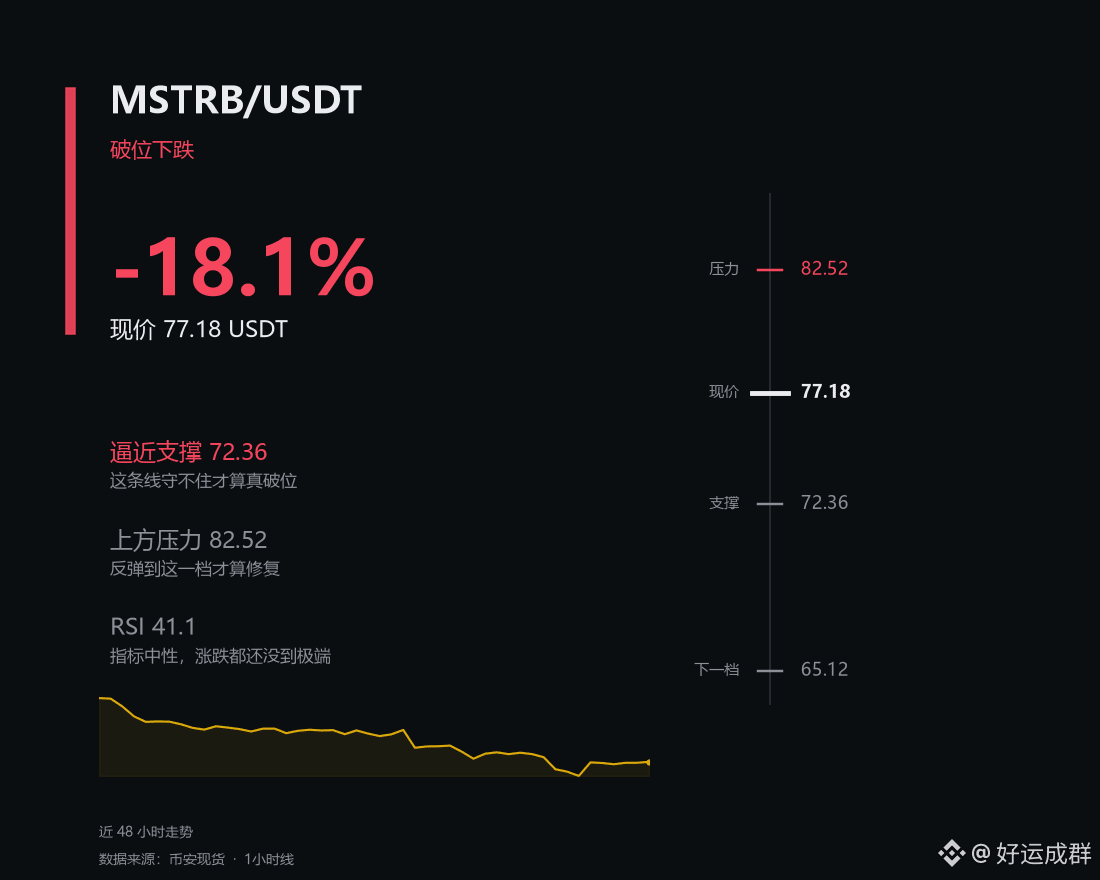
$MSTRB Today: -18.1%, looking worse than $BTC, with the current price at 77.18.
Look at it another way: If you were a market maker, what would you do at this level?
Push it up to 82.52 to lure in some longs, then turn around and sweep the stop-losses below 72.36—profiting from both sides.
An RSI of 41.1 is just right for stirring up some emotion.
What do you think?
Figure out your stop-loss first, then think about profits.
#币圈 #MSTRB
$MSTRB Today: -18.1%, looking worse than $BTC , with the current price at 77.18.
Look at it another way: If you were a market maker, what would you do at this level?
Push it up to 82.52 to lure in some longs, then turn around and sweep the stop-losses below 72.36—profiting from both sides.
An RSI of 41.1 is just right for stirring up some emotion.
What do you think?
Figure out your stop-loss first, then think about profits.
#币圈 #MSTRB
Look at it another way: If you were a market maker, what would you do at this level?
Push it up to 82.52 to lure in some longs, then turn around and sweep the stop-losses below 72.36—profiting from both sides.
An RSI of 41.1 is just right for stirring up some emotion.
What do you think?
Figure out your stop-loss first, then think about profits.
#币圈 #MSTRB
52


·
--
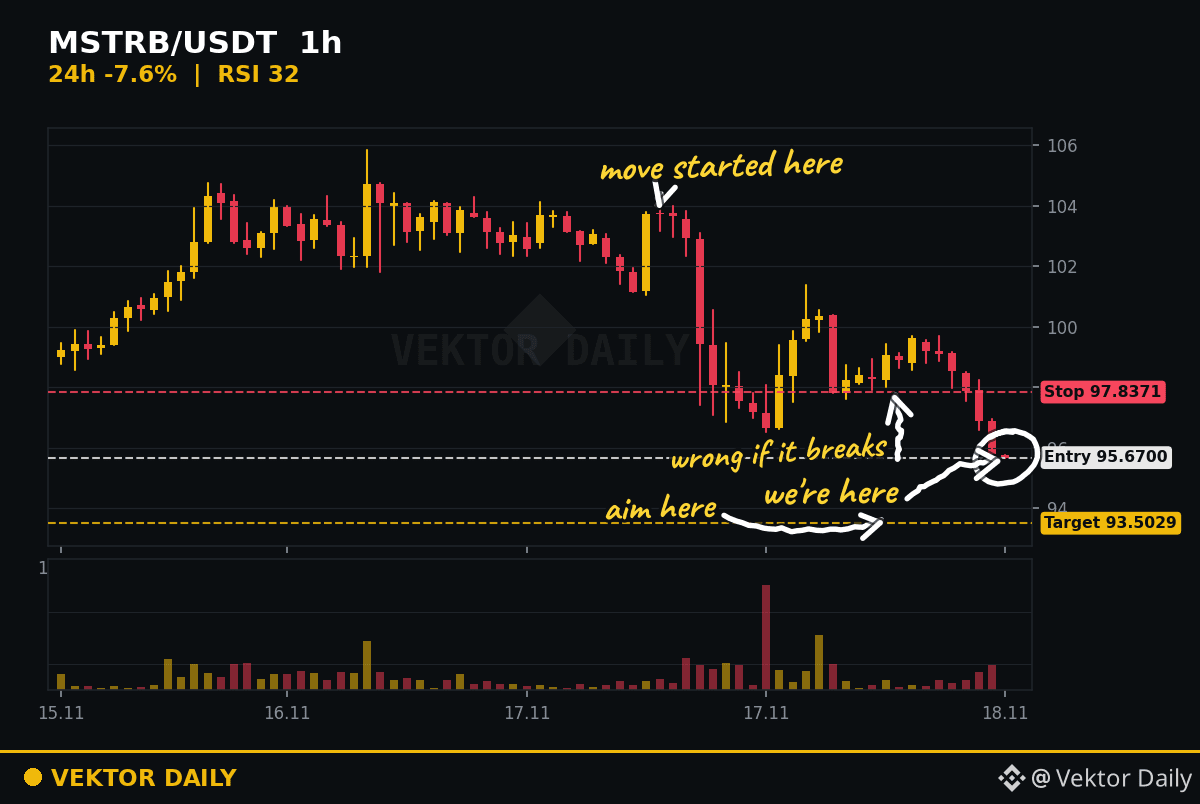
After a drop like this, MSTRB’s short-term chart setup looks pretty ugly. There was plenty of intraday volatility, and anyone chasing the price had a rough day. Each bounce is weaker than the last.
On the numbers, the price is 75.22, down 12.56%, with a trading volume of 19 million USDT. There was no obvious surge in volume, and investor interest was fairly average. It closed near the intraday low, which is a weak sign.
The current price is 17.4% below the 7-day moving average of 91.07. The 25-day moving average is 117.08, putting the price 35.8% below it. 87.93 has been the ceiling over the past few days; until it gets past that, it’s still range-bound.
After a drop like this, dip buyers will probably have to wait a little longer. My approach is simple: I’ll wait for it to get back above the 7-day moving average before making a call.
Another day of waiting for confirmation.
(Just my own observations, not advice)
#MSTRB #盘面观察 #ReviewNotes
After a drop like this, MSTRB’s short-term chart setup looks pretty ugly. There was plenty of intraday volatility, and anyone chasing the price had a rough day. Each bounce is weaker than the last.
On the numbers, the price is 75.22, down 12.56%, with a trading volume of 19 million USDT. There was no obvious surge in volume, and investor interest was fairly average. It closed near the intraday low, which is a weak sign.
The current price is 17.4% below the 7-day moving average of 91.07. The 25-day moving average is 117.08, putting the price 35.8% below it. 87.93 has been the ceiling over the past few days; until it gets past that, it’s still range-bound.
After a drop like this, dip buyers will probably have to wait a little longer. My approach is simple: I’ll wait for it to get back above the 7-day moving average before making a call.
Another day of waiting for confirmation.
(Just my own observations, not advice)
#MSTRB #盘面观察 #ReviewNotes
On the numbers, the price is 75.22, down 12.56%, with a trading volume of 19 million USDT. There was no obvious surge in volume, and investor interest was fairly average. It closed near the intraday low, which is a weak sign.
The current price is 17.4% below the 7-day moving average of 91.07. The 25-day moving average is 117.08, putting the price 35.8% below it. 87.93 has been the ceiling over the past few days; until it gets past that, it’s still range-bound.
After a drop like this, dip buyers will probably have to wait a little longer. My approach is simple: I’ll wait for it to get back above the 7-day moving average before making a call.
Another day of waiting for confirmation.
(Just my own observations, not advice)
#MSTRB #盘面观察 #ReviewNotes
64
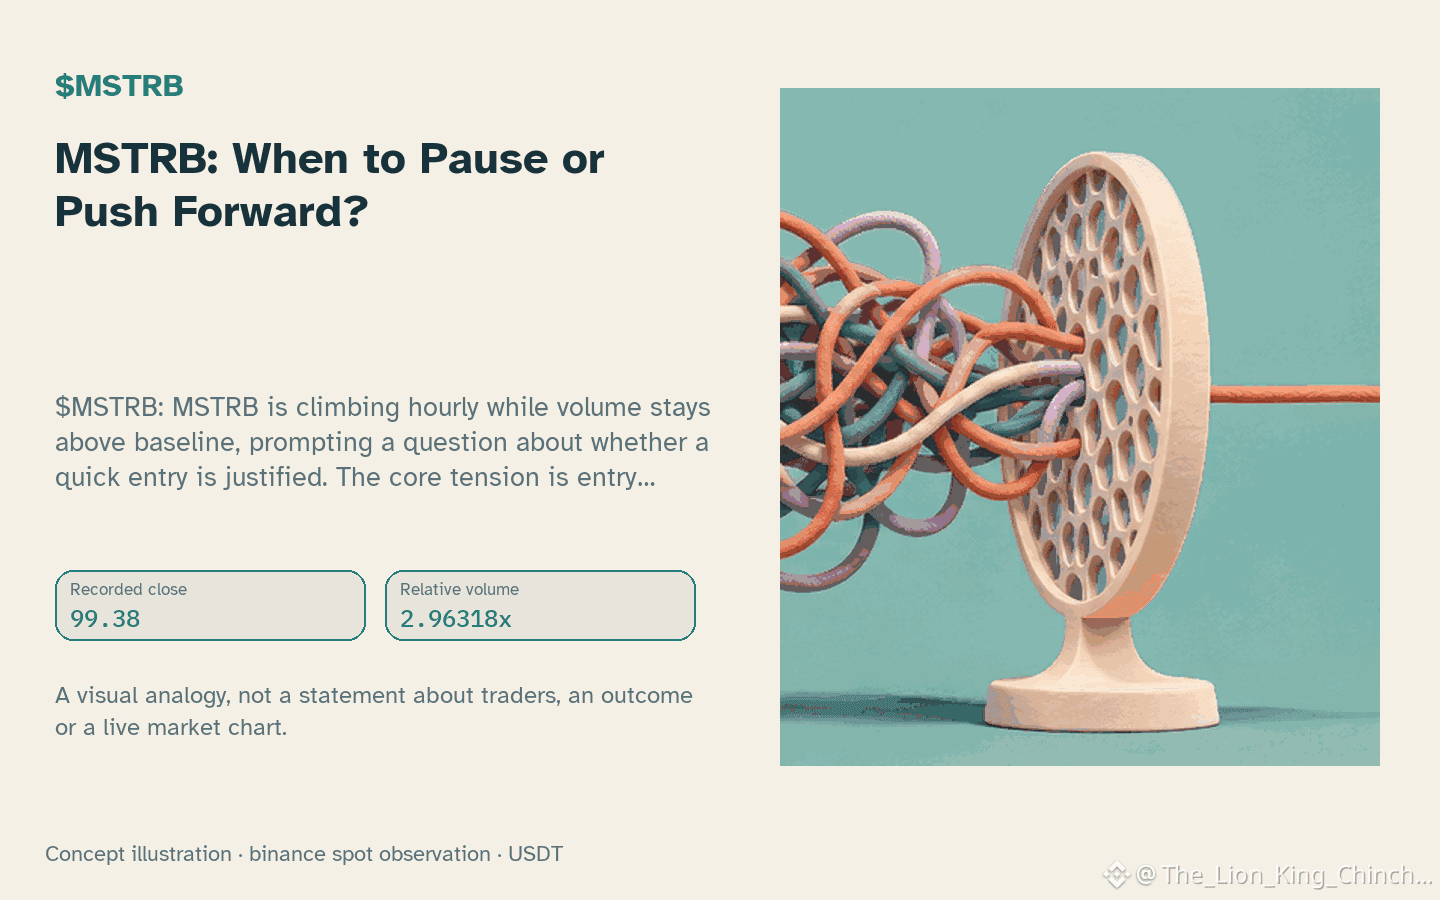
$MSTRB: MSTRB: When to Pause or Push Forward?
$MSTRB: MSTRB is climbing hourly while volume stays above baseline, prompting a question about whether a quick entry is justified. The core tension is entry quality versus chasing a move that may lack confirmation.
If a trader treats the upward direction as a signal to jump in, the risk is that the price could stall near the local resistance level 99.7. A thought experiment helps illustrate the trade‑off: imagine two identical orders, one placed immediately at the current price and another waiting for a pull‑back toward the short-term EMA 99.0885. The first order captures the move if momentum continues, but it also inherits the full spread between entry and the nearest meaningful invalidation point, perhaps the support 97.92. The delayed order sacrifices immediate exposure but gains a clearer risk‑reward ratio because the stop can sit tighter to the recent low.
An alternative reading of the same data notes that the relative volume 2.96x baseline suggests heightened activity, yet volume alone does not guarantee strength. A counterexample would be a sudden drop in hourly change 0.141072% that pushes price back into the range, invalidating the optimism of a rapid entry.
A practical self‑check is to ask: if the next closed candle shows a reversal beyond the short-term EMA 99.0885 and RSI 55.2 entering oversold territory, should the initial premise be reconsidered? This condition provides a concrete way to reassess the interpretation without relying on narrative hype.
Probabilistic market research, not a recommendation or guaranteed return.
#MSTRB #RiskManagement #CryptoLearning
$MSTRB : MSTRB: When to Pause or Push Forward?
$MSTRB : MSTRB is climbing hourly while volume stays above baseline, prompting a question about whether a quick entry is justified. The core tension is entry quality versus chasing a move that may lack confirmation.
If a trader treats the upward direction as a signal to jump in, the risk is that the price could stall near the local resistance level 99.7. A thought experiment helps illustrate the trade‑off: imagine two identical orders, one placed immediately at the current price and another waiting for a pull‑back toward the short-term EMA 99.0885. The first order captures the move if momentum continues, but it also inherits the full spread between entry and the nearest meaningful invalidation point, perhaps the support 97.92. The delayed order sacrifices immediate exposure but gains a clearer risk‑reward ratio because the stop can sit tighter to the recent low.
An alternative reading of the same data notes that the relative volume 2.96x baseline suggests heightened activity, yet volume alone does not guarantee strength. A counterexample would be a sudden drop in hourly change 0.141072% that pushes price back into the range, invalidating the optimism of a rapid entry.
A practical self‑check is to ask: if the next closed candle shows a reversal beyond the short-term EMA 99.0885 and RSI 55.2 entering oversold territory, should the initial premise be reconsidered? This condition provides a concrete way to reassess the interpretation without relying on narrative hype.
Probabilistic market research, not a recommendation or guaranteed return.
#MSTRB #RiskManagement #CryptoLearning
$MSTRB : MSTRB is climbing hourly while volume stays above baseline, prompting a question about whether a quick entry is justified. The core tension is entry quality versus chasing a move that may lack confirmation.
If a trader treats the upward direction as a signal to jump in, the risk is that the price could stall near the local resistance level 99.7. A thought experiment helps illustrate the trade‑off: imagine two identical orders, one placed immediately at the current price and another waiting for a pull‑back toward the short-term EMA 99.0885. The first order captures the move if momentum continues, but it also inherits the full spread between entry and the nearest meaningful invalidation point, perhaps the support 97.92. The delayed order sacrifices immediate exposure but gains a clearer risk‑reward ratio because the stop can sit tighter to the recent low.
An alternative reading of the same data notes that the relative volume 2.96x baseline suggests heightened activity, yet volume alone does not guarantee strength. A counterexample would be a sudden drop in hourly change 0.141072% that pushes price back into the range, invalidating the optimism of a rapid entry.
A practical self‑check is to ask: if the next closed candle shows a reversal beyond the short-term EMA 99.0885 and RSI 55.2 entering oversold territory, should the initial premise be reconsidered? This condition provides a concrete way to reassess the interpretation without relying on narrative hype.
Probabilistic market research, not a recommendation or guaranteed return.
#MSTRB #RiskManagement #CryptoLearning
35
·
--
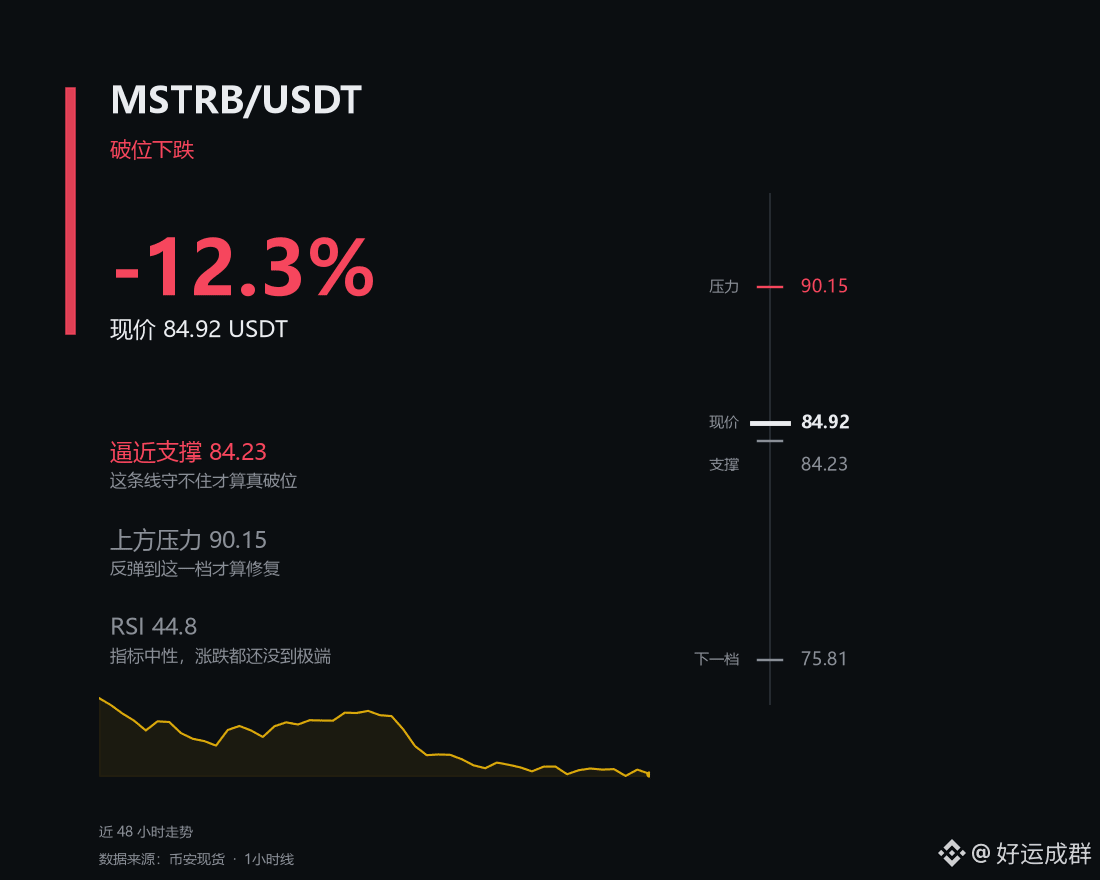
$MSTRB is down 12.3% today, weaker than Bitcoin. $BTC is down 3.2% today.
This kind of price action is the most exhausting: it doesn't rise decisively, and it doesn't fall cleanly.
At 84.92, it's capped by resistance at 90.15 above and supported at 84.23 below. RSI is 44.8.
To put it bluntly, nobody should pretend to be a prophet right now. What do you think?
When the market is this grinding, you can really tell who's following a plan.
#币圈 #MSTRB
$MSTRB is down 12.3% today, weaker than Bitcoin. $BTC is down 3.2% today.
This kind of price action is the most exhausting: it doesn't rise decisively, and it doesn't fall cleanly.
At 84.92, it's capped by resistance at 90.15 above and supported at 84.23 below. RSI is 44.8.
To put it bluntly, nobody should pretend to be a prophet right now. What do you think?
When the market is this grinding, you can really tell who's following a plan.
#币圈 #MSTRB
This kind of price action is the most exhausting: it doesn't rise decisively, and it doesn't fall cleanly.
At 84.92, it's capped by resistance at 90.15 above and supported at 84.23 below. RSI is 44.8.
To put it bluntly, nobody should pretend to be a prophet right now. What do you think?
When the market is this grinding, you can really tell who's following a plan.
#币圈 #MSTRB
28
Log in to explore more content
Join global crypto users on Binance Square
⚡️ Get latest and useful information about crypto.
💬 Trusted by the world’s largest crypto exchange.
👍 Discover real insights from verified creators.
Email / Phone number
Trending Topics
1
#NvidiaLoses$2.7TrillionInMonthAndAHalf
8,880 views
89 Discussing
2
#CanBTCReboundAfterFallingBelow60K?
647,612 views
2,742 Discussing
3
#GlobalStocksFaceLongestLosingStreakSince2023
230,023 views
1,874 Discussing
4
#BlackRockIBITPostsRecord$541MSingleDayOutflow
23,715 views
73 Discussing
5
#AnthropicPlungesTowardIPOPriceonDay2
114,507 views
1,116 Discussing
6
#TwentyOneCapitalAdds172.25BTC
49,919 views
593 Discussing
7
#HKBillWouldExcludeTokenizedDepositsFromVirtualAssets
5,756 views
48 Discussing
8
#BNBDropsBelow540USDTWith8.46%DailyDecline
64,750 views
584 Discussing
9
#HKBillProposesHK$100KFineForUnauthorizedCryptoTitles
2,196 views
21 Discussing
10
#BitMineFaces$10.1BUnrealizedETHLoss
4,443 views
25 Discussing