
#mvrv
mvrv
44,520 views
255 Discussing
Hot
Latest

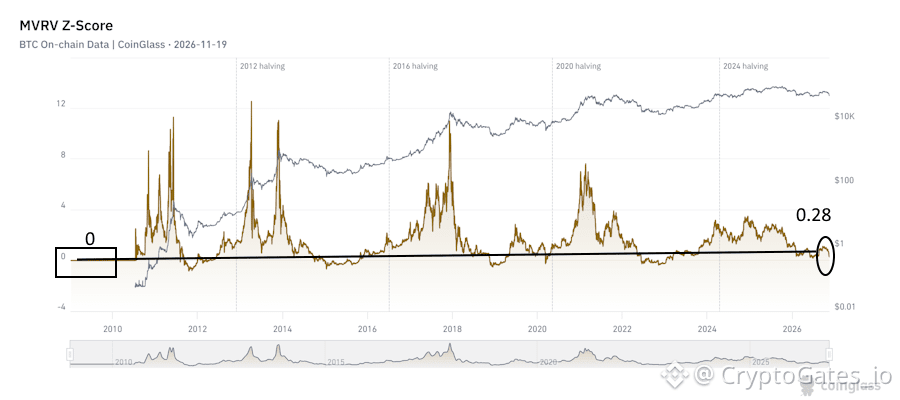
$BTC : MVRV Z-Score is at 0.28, around the 26th percentile of its full history. 📊
What it shows: market cap is only slightly above realized cap, so the average holder is near their cost basis. Valuation is compressed, but it has not gone into the negative zone that has historically appeared late in bear phases.
Execution angle: compressed valuation can last a long time. This is where staged entries (DCA) and defined risk usually hold up better than all-in decisions.
Backtest the parameters first.
#Bitcoin #MVRV #DCA
$BTC : MVRV Z-Score is at 0.28, around the 26th percentile of its full history. 📊
What it shows: market cap is only slightly above realized cap, so the average holder is near their cost basis. Valuation is compressed, but it has not gone into the negative zone that has historically appeared late in bear phases.
Execution angle: compressed valuation can last a long time. This is where staged entries (DCA) and defined risk usually hold up better than all-in decisions.
Backtest the parameters first.
#Bitcoin #MVRV #DCA
What it shows: market cap is only slightly above realized cap, so the average holder is near their cost basis. Valuation is compressed, but it has not gone into the negative zone that has historically appeared late in bear phases.
Execution angle: compressed valuation can last a long time. This is where staged entries (DCA) and defined risk usually hold up better than all-in decisions.
Backtest the parameters first.
#Bitcoin #MVRV #DCA
110

Bitcoin just flashed the same signal it flashed at the 2022 bottom — and almost nobody is watching.
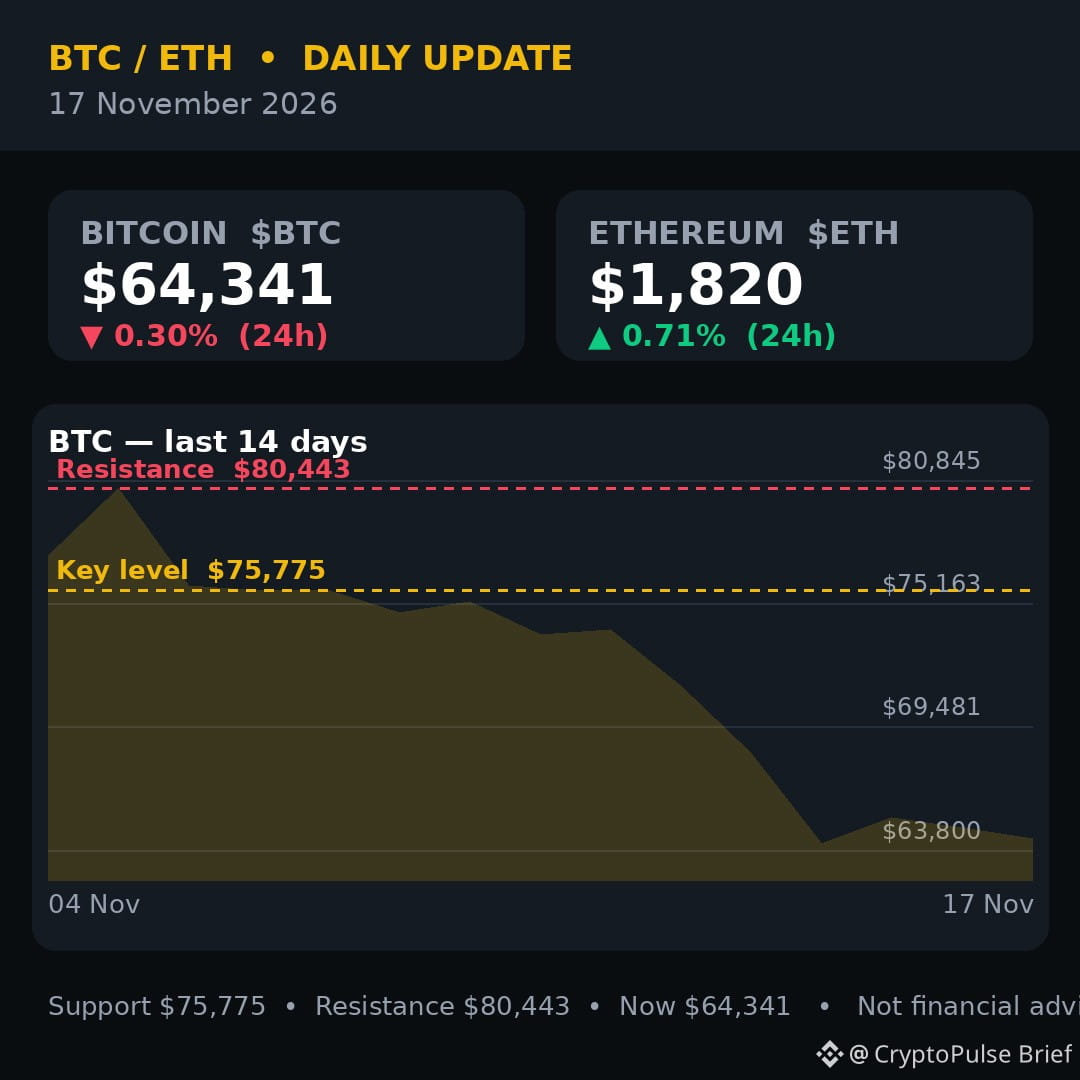
$BTC trades near $64,341, down about 13.7% in a week after dipping to $62,000 on Sunday. The Fear & Greed Index sits at 12 — extreme fear. $ETH is near $1,820, holding up slightly better.
Here is the number that matters: CryptoQuant puts Bitcoin's MVRV ratio near 1.1, below 1.2. MVRV compares market value to what holders actually paid — at 1.1, the market barely values Bitcoin above its holders' cost. The last time it sat near these levels was the 2022 market bottom, before a significant recovery.
But a bottom signal is not a bottom. Demand is still shrinking: CryptoQuant's MorenoDV puts 30-day apparent demand at negative 247,700 $BTC, and the one-year reading near negative 1.21 million. Bitcoin also trades below its 200-day moving average near $73,000 and below the short-term holder cost basis of $75,600 — recent buyers are underwater. Glassnode shows the densest short-term holder supply cluster sitting right where price is now, between $63,000 and $65,000.
The macro headwind is real too: Kalshi prices an 89% chance of a December Fed rate hike, Fed Chair Warsh warned weak AI returns could hurt stocks, and US spot Bitcoin ETFs saw $2.42 billion of outflows between November 2 and 16.
One corner is green: $RAIN is today's biggest top-100 gainer, up about 80% to $0.0062, with a $4.4 billion market cap (CoinGecko).
My take: MVRV says sellers are running out of coins to panic-sell, but the Fed and ETF flows say buyers have not returned yet. Bottoms are a process, not a print — watch if $62,000 holds on the next test.
Levels to watch: support at $64,000, then $63,100; resistance at $65,600–$66,300, then $67,850.
Is MVRV calling the bottom — or does the Fed break it first? Drop your view below.
Source: CryptoQuant, Glassnode, Moneycontrol, CoinGecko — 17 Nov 2026
Follow for daily crypto updates.
#Bitcoin #Crypto #MVRV
Not financial advice.
Bitcoin just flashed the same signal it flashed at the 2022 bottom — and almost nobody is watching.
$BTC trades near $64,341, down about 13.7% in a week after dipping to $62,000 on Sunday. The Fear & Greed Index sits at 12 — extreme fear. $ETH is near $1,820, holding up slightly better.
Here is the number that matters: CryptoQuant puts Bitcoin's MVRV ratio near 1.1, below 1.2. MVRV compares market value to what holders actually paid — at 1.1, the market barely values Bitcoin above its holders' cost. The last time it sat near these levels was the 2022 market bottom, before a significant recovery.
But a bottom signal is not a bottom. Demand is still shrinking: CryptoQuant's MorenoDV puts 30-day apparent demand at negative 247,700 $BTC , and the one-year reading near negative 1.21 million. Bitcoin also trades below its 200-day moving average near $73,000 and below the short-term holder cost basis of $75,600 — recent buyers are underwater. Glassnode shows the densest short-term holder supply cluster sitting right where price is now, between $63,000 and $65,000.
The macro headwind is real too: Kalshi prices an 89% chance of a December Fed rate hike, Fed Chair Warsh warned weak AI returns could hurt stocks, and US spot Bitcoin ETFs saw $2.42 billion of outflows between November 2 and 16.
One corner is green: $RAIN is today's biggest top-100 gainer, up about 80% to $0.0062, with a $4.4 billion market cap (CoinGecko).
My take: MVRV says sellers are running out of coins to panic-sell, but the Fed and ETF flows say buyers have not returned yet. Bottoms are a process, not a print — watch if $62,000 holds on the next test.
Levels to watch: support at $64,000, then $63,100; resistance at $65,600–$66,300, then $67,850.
Is MVRV calling the bottom — or does the Fed break it first? Drop your view below.
Source: CryptoQuant, Glassnode, Moneycontrol, CoinGecko — 17 Nov 2026
Follow for daily crypto updates.
#Bitcoin #Crypto #MVRV
Not financial advice.
$BTC trades near $64,341, down about 13.7% in a week after dipping to $62,000 on Sunday. The Fear & Greed Index sits at 12 — extreme fear. $ETH is near $1,820, holding up slightly better.
Here is the number that matters: CryptoQuant puts Bitcoin's MVRV ratio near 1.1, below 1.2. MVRV compares market value to what holders actually paid — at 1.1, the market barely values Bitcoin above its holders' cost. The last time it sat near these levels was the 2022 market bottom, before a significant recovery.
But a bottom signal is not a bottom. Demand is still shrinking: CryptoQuant's MorenoDV puts 30-day apparent demand at negative 247,700 $BTC , and the one-year reading near negative 1.21 million. Bitcoin also trades below its 200-day moving average near $73,000 and below the short-term holder cost basis of $75,600 — recent buyers are underwater. Glassnode shows the densest short-term holder supply cluster sitting right where price is now, between $63,000 and $65,000.
The macro headwind is real too: Kalshi prices an 89% chance of a December Fed rate hike, Fed Chair Warsh warned weak AI returns could hurt stocks, and US spot Bitcoin ETFs saw $2.42 billion of outflows between November 2 and 16.
One corner is green: $RAIN is today's biggest top-100 gainer, up about 80% to $0.0062, with a $4.4 billion market cap (CoinGecko).
My take: MVRV says sellers are running out of coins to panic-sell, but the Fed and ETF flows say buyers have not returned yet. Bottoms are a process, not a print — watch if $62,000 holds on the next test.
Levels to watch: support at $64,000, then $63,100; resistance at $65,600–$66,300, then $67,850.
Is MVRV calling the bottom — or does the Fed break it first? Drop your view below.
Source: CryptoQuant, Glassnode, Moneycontrol, CoinGecko — 17 Nov 2026
Follow for daily crypto updates.
#Bitcoin #Crypto #MVRV
Not financial advice.
📊 Bitcoin: Are signs of a bottom starting to emerge?
BTC is around $64,844 (+0.48% in 24h), holding above $64,000 after a sweep down to ~$62,000 over the weekend. ETH at ~$1,838 and XRP at ~$0.965 are both up more than 1%, and 65 of the top 100 coins are in the green — market breadth has clearly improved.
Notable point: Bitcoin’s MVRV ratio has fallen to around 1.1, according to CryptoQuant. This is the third time this signal has appeared during the 2026 downturn, and this level previously coincided with the 2022 bear-market bottom — meaning BTC is trading near the average cost basis of the entire market.
But don’t celebrate just yet: 30-day demand remains negative at around 247,700 BTC, ETF inflows haven’t returned, and Fear & Greed is still at 12. October PPI rose 0.3% (forecast: 0.4%) but was up 6.5% year over year — its highest level since 11/2022 — so the market is still pricing in about a 90% chance of a Fed rate hike by 9/12.
Tonight (19:00 UTC), the October FOMC minutes will be released.
⭐ $NEAR gained the most among the top 100 today: +7.42% to ~$3.38, with a market cap of ~$4.4 billion.
Does an MVRV of 1.1 signal a true bottom this time, or is this just a rebound? 👇
#CryptoNews #Bitcoin #MVRV #NEAR
📌 Market information, not investment advice.
📊 Bitcoin: Are signs of a bottom starting to emerge?
BTC is around $64,844 (+0.48% in 24h), holding above $64,000 after a sweep down to ~$62,000 over the weekend. ETH at ~$1,838 and XRP at ~$0.965 are both up more than 1%, and 65 of the top 100 coins are in the green — market breadth has clearly improved.
Notable point: Bitcoin’s MVRV ratio has fallen to around 1.1, according to CryptoQuant. This is the third time this signal has appeared during the 2026 downturn, and this level previously coincided with the 2022 bear-market bottom — meaning BTC is trading near the average cost basis of the entire market.
But don’t celebrate just yet: 30-day demand remains negative at around 247,700 BTC, ETF inflows haven’t returned, and Fear & Greed is still at 12. October PPI rose 0.3% (forecast: 0.4%) but was up 6.5% year over year — its highest level since 11/2022 — so the market is still pricing in about a 90% chance of a Fed rate hike by 9/12.
Tonight (19:00 UTC), the October FOMC minutes will be released.
⭐ $NEAR gained the most among the top 100 today: +7.42% to ~$3.38, with a market cap of ~$4.4 billion.
Does an MVRV of 1.1 signal a true bottom this time, or is this just a rebound? 👇
#CryptoNews #Bitcoin #MVRV #NEAR
📌 Market information, not investment advice.
BTC is around $64,844 (+0.48% in 24h), holding above $64,000 after a sweep down to ~$62,000 over the weekend. ETH at ~$1,838 and XRP at ~$0.965 are both up more than 1%, and 65 of the top 100 coins are in the green — market breadth has clearly improved.
Notable point: Bitcoin’s MVRV ratio has fallen to around 1.1, according to CryptoQuant. This is the third time this signal has appeared during the 2026 downturn, and this level previously coincided with the 2022 bear-market bottom — meaning BTC is trading near the average cost basis of the entire market.
But don’t celebrate just yet: 30-day demand remains negative at around 247,700 BTC, ETF inflows haven’t returned, and Fear & Greed is still at 12. October PPI rose 0.3% (forecast: 0.4%) but was up 6.5% year over year — its highest level since 11/2022 — so the market is still pricing in about a 90% chance of a Fed rate hike by 9/12.
Tonight (19:00 UTC), the October FOMC minutes will be released.
⭐ $NEAR gained the most among the top 100 today: +7.42% to ~$3.38, with a market cap of ~$4.4 billion.
Does an MVRV of 1.1 signal a true bottom this time, or is this just a rebound? 👇
#CryptoNews #Bitcoin #MVRV #NEAR
📌 Market information, not investment advice.

555

·
--
$BTC
MVRV has dropped to 1.1. Let me say this first: it’s a sign we may be near a bottom, not a signal to buy the dip.
Data just released by CryptoQuant puts MVRV at around 1.1, below 1.2.
This compares market value with on-chain cost basis. On average, holders are only up about 10%, putting us in the valuation range seen near the 2022 bear-market bottom.
This is the third time this year: once in February near $60,000, and once in June or July near $57,000. Neither time did the market immediately V-recover afterward.
Glassnode’s November 11 report lines up with this too: short-term holders’ cost basis is clustered between $62,000 and $66,000, and we’re now moving around within that range.
But don’t rush to call a bottom. Other data still looks rough: 30-day apparent demand is down 247,000 BTC, the one-year figure is down 1.21 million BTC, and spot ETFs saw net outflows of $1.07 billion last week.
Put simply: prices are cheaper, but buyers haven’t returned. MVRV measures valuation, not whether anyone is actually willing to put money in.
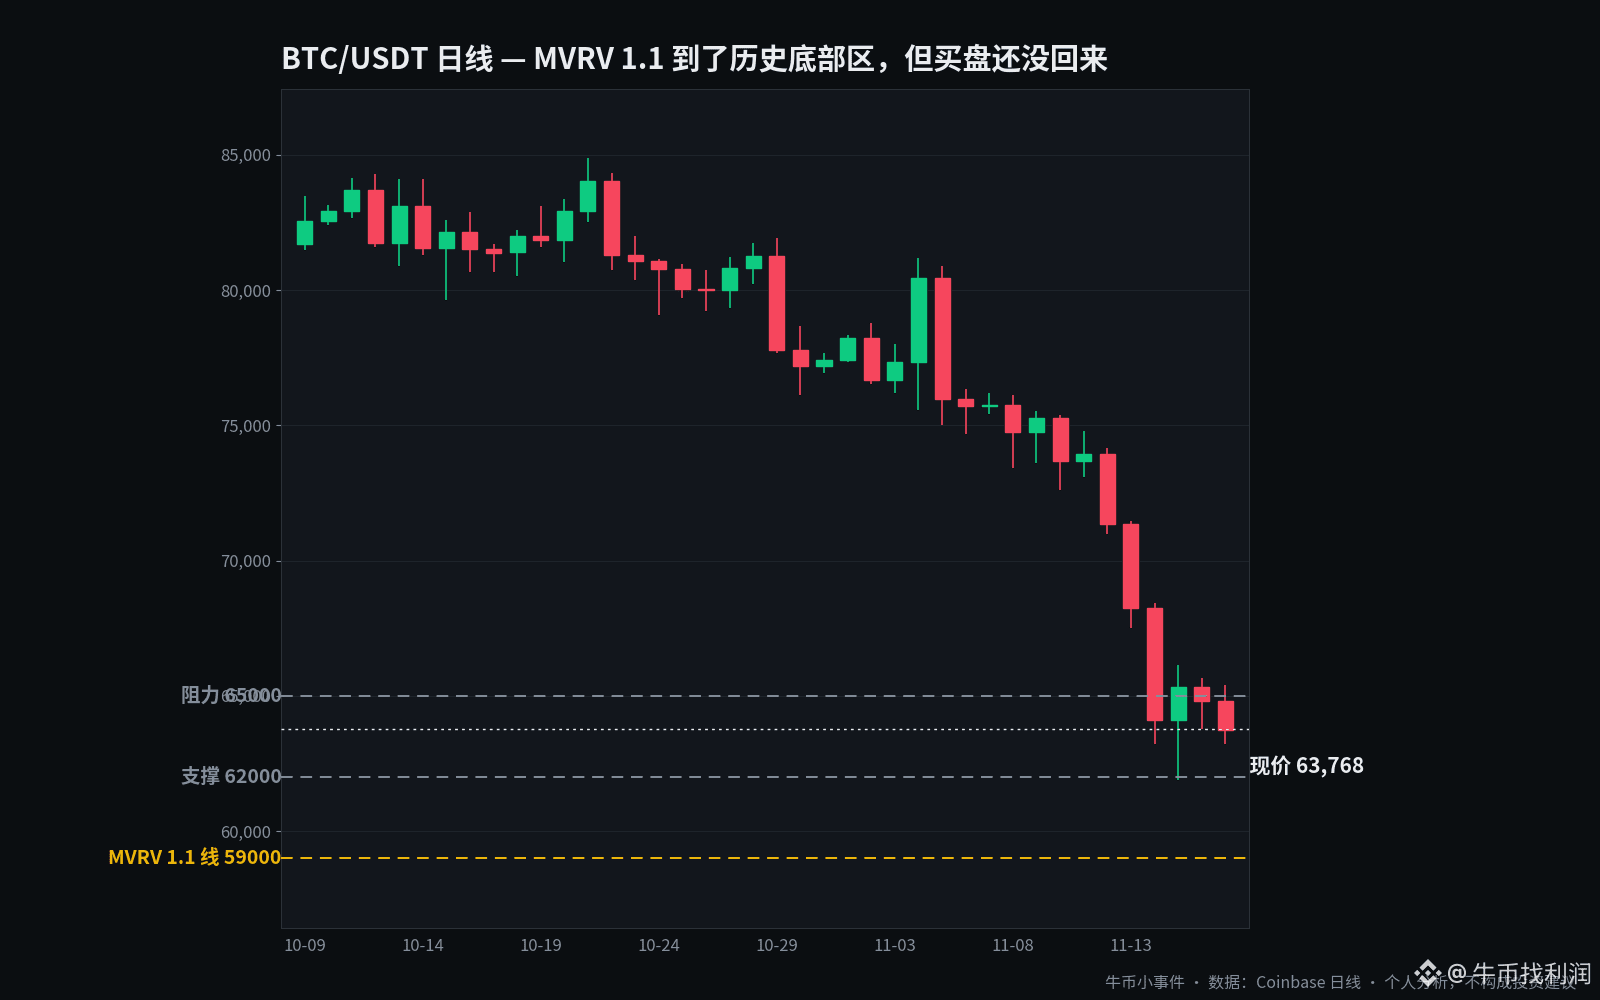
One analyst says the MVRV 1.1 level corresponds to roughly $59,000. If that level doesn’t hold, let’s not talk about a bottom just yet.
I’m still staying out and watching from the sidelines. I’ve accepted and closed out the stop-loss at $64,000 from my post overnight—no point dwelling on it.
I’m watching $62,000 below; if that breaks, then $60,000, and below that is the $59,000 MVRV level.
To the upside, I’d only consider going long after we reclaim $65,000. If we can’t get back above it, it’s off the table.
If you really want to buy the dip, wait until the price stabilizes first. Buying here isn’t buying the bottom—it’s buying the lonely middle of the mountain.
This is my personal analysis and not investment advice.
#MVRV
$BTC
MVRV has dropped to 1.1. Let me say this first: it’s a sign we may be near a bottom, not a signal to buy the dip.
Data just released by CryptoQuant puts MVRV at around 1.1, below 1.2.
This compares market value with on-chain cost basis. On average, holders are only up about 10%, putting us in the valuation range seen near the 2022 bear-market bottom.
This is the third time this year: once in February near $60,000, and once in June or July near $57,000. Neither time did the market immediately V-recover afterward.
Glassnode’s November 11 report lines up with this too: short-term holders’ cost basis is clustered between $62,000 and $66,000, and we’re now moving around within that range.
But don’t rush to call a bottom. Other data still looks rough: 30-day apparent demand is down 247,000 BTC, the one-year figure is down 1.21 million BTC, and spot ETFs saw net outflows of $1.07 billion last week.
Put simply: prices are cheaper, but buyers haven’t returned. MVRV measures valuation, not whether anyone is actually willing to put money in.
One analyst says the MVRV 1.1 level corresponds to roughly $59,000. If that level doesn’t hold, let’s not talk about a bottom just yet.
I’m still staying out and watching from the sidelines. I’ve accepted and closed out the stop-loss at $64,000 from my post overnight—no point dwelling on it.
I’m watching $62,000 below; if that breaks, then $60,000, and below that is the $59,000 MVRV level.
To the upside, I’d only consider going long after we reclaim $65,000. If we can’t get back above it, it’s off the table.
If you really want to buy the dip, wait until the price stabilizes first. Buying here isn’t buying the bottom—it’s buying the lonely middle of the mountain.
This is my personal analysis and not investment advice.
#MVRV
MVRV has dropped to 1.1. Let me say this first: it’s a sign we may be near a bottom, not a signal to buy the dip.
Data just released by CryptoQuant puts MVRV at around 1.1, below 1.2.
This compares market value with on-chain cost basis. On average, holders are only up about 10%, putting us in the valuation range seen near the 2022 bear-market bottom.
This is the third time this year: once in February near $60,000, and once in June or July near $57,000. Neither time did the market immediately V-recover afterward.
Glassnode’s November 11 report lines up with this too: short-term holders’ cost basis is clustered between $62,000 and $66,000, and we’re now moving around within that range.
But don’t rush to call a bottom. Other data still looks rough: 30-day apparent demand is down 247,000 BTC, the one-year figure is down 1.21 million BTC, and spot ETFs saw net outflows of $1.07 billion last week.
Put simply: prices are cheaper, but buyers haven’t returned. MVRV measures valuation, not whether anyone is actually willing to put money in.
One analyst says the MVRV 1.1 level corresponds to roughly $59,000. If that level doesn’t hold, let’s not talk about a bottom just yet.
I’m still staying out and watching from the sidelines. I’ve accepted and closed out the stop-loss at $64,000 from my post overnight—no point dwelling on it.
I’m watching $62,000 below; if that breaks, then $60,000, and below that is the $59,000 MVRV level.
To the upside, I’d only consider going long after we reclaim $65,000. If we can’t get back above it, it’s off the table.
If you really want to buy the dip, wait until the price stabilizes first. Buying here isn’t buying the bottom—it’s buying the lonely middle of the mountain.
This is my personal analysis and not investment advice.
#MVRV
125

·
--
🚨 $BTC SHOCKING: THE SAME NUMBER THAT MARKED THE 2022 BOTTOM
To me, this is the most interesting thing about Bitcoin today: its MVRV fell to ~1.1, the same level that marked the 2022 bear market bottom, when BTC was between $16,000 and $21,000. And this isn’t the first time it’s appeared this year: it was already seen in February near $60,000 and in June–July near $57,000.
Look at the detail nobody is seeing:
→ An MVRV of 1.1 equates to about $59,000: that’s the line that determines whether this is the bottom or another drop is coming, and the price is around $64,700 today after hitting a low near $64,357.
→ Glassnode puts the bulk of recent buyers between $62,000 and $66,000, and June’s low of $58,500 is the last line of defense before a larger gap.
→ Apparent demand is still in the red: -247,700 BTC over 30 days and -1.21 million over a year, and BTC ETFs lost $1.07 billion in the week ending November 13.
Do you think an MVRV of 1.1 marks the bottom, or will Bitcoin still test $59,000? 👇
$BTC $ETH $XRP
#Bitcoin #MVRV #BitcoinBottom
🚨 $BTC SHOCKING: THE SAME NUMBER THAT MARKED THE 2022 BOTTOM
To me, this is the most interesting thing about Bitcoin today: its MVRV fell to ~1.1, the same level that marked the 2022 bear market bottom, when BTC was between $16,000 and $21,000. And this isn’t the first time it’s appeared this year: it was already seen in February near $60,000 and in June–July near $57,000.
Look at the detail nobody is seeing:
→ An MVRV of 1.1 equates to about $59,000: that’s the line that determines whether this is the bottom or another drop is coming, and the price is around $64,700 today after hitting a low near $64,357.
→ Glassnode puts the bulk of recent buyers between $62,000 and $66,000, and June’s low of $58,500 is the last line of defense before a larger gap.
→ Apparent demand is still in the red: -247,700 BTC over 30 days and -1.21 million over a year, and BTC ETFs lost $1.07 billion in the week ending November 13.
Do you think an MVRV of 1.1 marks the bottom, or will Bitcoin still test $59,000? 👇
$BTC $ETH $XRP
#Bitcoin #MVRV #BitcoinBottom
To me, this is the most interesting thing about Bitcoin today: its MVRV fell to ~1.1, the same level that marked the 2022 bear market bottom, when BTC was between $16,000 and $21,000. And this isn’t the first time it’s appeared this year: it was already seen in February near $60,000 and in June–July near $57,000.
Look at the detail nobody is seeing:
→ An MVRV of 1.1 equates to about $59,000: that’s the line that determines whether this is the bottom or another drop is coming, and the price is around $64,700 today after hitting a low near $64,357.
→ Glassnode puts the bulk of recent buyers between $62,000 and $66,000, and June’s low of $58,500 is the last line of defense before a larger gap.
→ Apparent demand is still in the red: -247,700 BTC over 30 days and -1.21 million over a year, and BTC ETFs lost $1.07 billion in the week ending November 13.
Do you think an MVRV of 1.1 marks the bottom, or will Bitcoin still test $59,000? 👇
$BTC $ETH $XRP
#Bitcoin #MVRV #BitcoinBottom

2.6k

·
--
MVRV falls to 1.1: this number last appeared at the 2022 bottom
1.1. I’ve been looking at this number for a long time today.
The latest data from CryptoQuant shows that $BTC ’s MVRV ratio has fallen to around 1.1. In plain English, the current market price is only 10% above the average cost basis of the entire market. When the bear market bottomed in 2022, MVRV also fell to around this level. This doesn’t mean we’ve definitely hit bottom, but it’s a level worth taking a serious look at.
There’s another detail in Glassnode’s November 11 cost distribution report: short-term holders’ coins are tightly concentrated, with the densest cluster between $63,000 and $65,000. BTC is trading at $64,315 today (Finnhub Binance pair, 24-hour change: -0.26%), right in the middle of that cluster. $65,000 is the first hurdle above, and $63,000 is the first line of defense below. There are people on both sides.
What do I think? Two sentences sum it up. If it holds above $65,000, then I’ll believe this is a real rebound, with $66,000 next in sight. If it falls below $63,000, I won’t rush to buy the dip; I’d rather wait for it to stabilize again. Here in the middle, the direction hasn’t been chosen. Don’t guess—just watch those two levels.
Demand is still cold, too: CryptoQuant says BTC’s 30-day apparent demand is -247,700 coins, and the one-year figure is -1.21 million coins. Buyers haven’t returned. This says the same thing as MVRV: valuations have fallen to fair value, but money hasn’t come in.
Here’s a point of comparison from $ETH : ETH is at $1,819.62, up 0.73% in 24 hours, but futures open interest has fallen to $9.12 billion, its lowest since October 2024. Resistance is at $1,864, with support at $1,802 and $1,786. Positions have shrunk this much, which means nobody dares to move—sometimes that’s what it looks like before the market shifts.
And a word about a meme coin. Today’s DexScreener rankings include $GTA, Grand Theft Anthropic. It’s not GTA6; it’s a new coin riding the Anthropic IPO narrative. It launched just 15 hours ago, is up 4,009% over 24 hours, and is still up 20.97% over the last hour, with $1.1 million in trading volume. But liquidity is only $84,000 and market cap is $1.3 million. These numbers tell you one thing: it can shoot up fast, and drop just as fast. I’m only telling you it exists, not telling you to buy it.
Here’s one takeaway for today: next time someone says “the bottom is in” or “there’s more downside,” don’t just listen to their conclusion. Ask them for two numbers—what’s the MVRV, and where is the biggest cluster of coins? If they can’t answer, they’re just going by gut feeling.
MVRV has fallen to 1.1. Do you think that’s a bottom signal, or is there more downside? Pick a side in the comments—I’ll see which one has more people.
At 7 tomorrow morning, after NVDA’s earnings are out, I’ll break down their impact on Bitcoin for you right away. Follow so you don’t miss it.
⚠️ The meme coin sector is extremely risky. The above content does not constitute investment advice. DYOR!
Data source: Binance Skills Hub. For reference only; this does not constitute investment advice.
$BTC $ETH $GTA
#比特幣 #MVRV #BinanceSquare
MVRV falls to 1.1: this number last appeared at the 2022 bottom
1.1. I’ve been looking at this number for a long time today.
The latest data from CryptoQuant shows that $BTC ’s MVRV ratio has fallen to around 1.1. In plain English, the current market price is only 10% above the average cost basis of the entire market. When the bear market bottomed in 2022, MVRV also fell to around this level. This doesn’t mean we’ve definitely hit bottom, but it’s a level worth taking a serious look at.
There’s another detail in Glassnode’s November 11 cost distribution report: short-term holders’ coins are tightly concentrated, with the densest cluster between $63,000 and $65,000. BTC is trading at $64,315 today (Finnhub Binance pair, 24-hour change: -0.26%), right in the middle of that cluster. $65,000 is the first hurdle above, and $63,000 is the first line of defense below. There are people on both sides.
What do I think? Two sentences sum it up. If it holds above $65,000, then I’ll believe this is a real rebound, with $66,000 next in sight. If it falls below $63,000, I won’t rush to buy the dip; I’d rather wait for it to stabilize again. Here in the middle, the direction hasn’t been chosen. Don’t guess—just watch those two levels.
Demand is still cold, too: CryptoQuant says BTC’s 30-day apparent demand is -247,700 coins, and the one-year figure is -1.21 million coins. Buyers haven’t returned. This says the same thing as MVRV: valuations have fallen to fair value, but money hasn’t come in.
Here’s a point of comparison from $ETH : ETH is at $1,819.62, up 0.73% in 24 hours, but futures open interest has fallen to $9.12 billion, its lowest since October 2024. Resistance is at $1,864, with support at $1,802 and $1,786. Positions have shrunk this much, which means nobody dares to move—sometimes that’s what it looks like before the market shifts.
And a word about a meme coin. Today’s DexScreener rankings include $GTA, Grand Theft Anthropic. It’s not GTA6; it’s a new coin riding the Anthropic IPO narrative. It launched just 15 hours ago, is up 4,009% over 24 hours, and is still up 20.97% over the last hour, with $1.1 million in trading volume. But liquidity is only $84,000 and market cap is $1.3 million. These numbers tell you one thing: it can shoot up fast, and drop just as fast. I’m only telling you it exists, not telling you to buy it.
Here’s one takeaway for today: next time someone says “the bottom is in” or “there’s more downside,” don’t just listen to their conclusion. Ask them for two numbers—what’s the MVRV, and where is the biggest cluster of coins? If they can’t answer, they’re just going by gut feeling.
MVRV has fallen to 1.1. Do you think that’s a bottom signal, or is there more downside? Pick a side in the comments—I’ll see which one has more people.
At 7 tomorrow morning, after NVDA’s earnings are out, I’ll break down their impact on Bitcoin for you right away. Follow so you don’t miss it.
⚠️ The meme coin sector is extremely risky. The above content does not constitute investment advice. DYOR!
Data source: Binance Skills Hub. For reference only; this does not constitute investment advice.
$BTC $ETH $GTA
#比特幣 #MVRV #BinanceSquare
1.1. I’ve been looking at this number for a long time today.
The latest data from CryptoQuant shows that $BTC ’s MVRV ratio has fallen to around 1.1. In plain English, the current market price is only 10% above the average cost basis of the entire market. When the bear market bottomed in 2022, MVRV also fell to around this level. This doesn’t mean we’ve definitely hit bottom, but it’s a level worth taking a serious look at.
There’s another detail in Glassnode’s November 11 cost distribution report: short-term holders’ coins are tightly concentrated, with the densest cluster between $63,000 and $65,000. BTC is trading at $64,315 today (Finnhub Binance pair, 24-hour change: -0.26%), right in the middle of that cluster. $65,000 is the first hurdle above, and $63,000 is the first line of defense below. There are people on both sides.
What do I think? Two sentences sum it up. If it holds above $65,000, then I’ll believe this is a real rebound, with $66,000 next in sight. If it falls below $63,000, I won’t rush to buy the dip; I’d rather wait for it to stabilize again. Here in the middle, the direction hasn’t been chosen. Don’t guess—just watch those two levels.
Demand is still cold, too: CryptoQuant says BTC’s 30-day apparent demand is -247,700 coins, and the one-year figure is -1.21 million coins. Buyers haven’t returned. This says the same thing as MVRV: valuations have fallen to fair value, but money hasn’t come in.
Here’s a point of comparison from $ETH : ETH is at $1,819.62, up 0.73% in 24 hours, but futures open interest has fallen to $9.12 billion, its lowest since October 2024. Resistance is at $1,864, with support at $1,802 and $1,786. Positions have shrunk this much, which means nobody dares to move—sometimes that’s what it looks like before the market shifts.
And a word about a meme coin. Today’s DexScreener rankings include $GTA, Grand Theft Anthropic. It’s not GTA6; it’s a new coin riding the Anthropic IPO narrative. It launched just 15 hours ago, is up 4,009% over 24 hours, and is still up 20.97% over the last hour, with $1.1 million in trading volume. But liquidity is only $84,000 and market cap is $1.3 million. These numbers tell you one thing: it can shoot up fast, and drop just as fast. I’m only telling you it exists, not telling you to buy it.
Here’s one takeaway for today: next time someone says “the bottom is in” or “there’s more downside,” don’t just listen to their conclusion. Ask them for two numbers—what’s the MVRV, and where is the biggest cluster of coins? If they can’t answer, they’re just going by gut feeling.
MVRV has fallen to 1.1. Do you think that’s a bottom signal, or is there more downside? Pick a side in the comments—I’ll see which one has more people.
At 7 tomorrow morning, after NVDA’s earnings are out, I’ll break down their impact on Bitcoin for you right away. Follow so you don’t miss it.
⚠️ The meme coin sector is extremely risky. The above content does not constitute investment advice. DYOR!
Data source: Binance Skills Hub. For reference only; this does not constitute investment advice.
$BTC $ETH $GTA
#比特幣 #MVRV #BinanceSquare
188

·
--
Bitcoin MVRV has fallen again to around 1.1 — two days ago it was still below 1.2.
Context: A CryptoQuant analysis cited by Brave New Coin and Coin-Turk today (Nov 17) notes that Bitcoin MVRV is now around 1.1 — the aggregate market value is nearing the average purchase price of all holders. Analyst Darkfost calls this “forming market bottom”: similar levels appeared at the 2022 bottom, when BTC was at 16,000–21,000, and this is the third occurrence in 2026, following February (~60,000) and June–July (~57,000). Glassnode (Nov 11) adds that short-term holder supply is concentrated at 62,000–66,000. BTC is around 64,300 this afternoon, still within that band.
Bullish scenario: holding above 62,000, then closing a 4H candle above 65,662, opens the way to 66,000 and strengthens the bottoming signal.
Bearish scenario: breaking below 62,000 opens the way to 59,000 — analyst Sean’s MVRV 1.1 level — and if that breaks too, this bottom thesis is invalidated.
My take: this is a valuation reading, not proof that buyers are returning — 30-day demand is still negative, and Monday, Nov 16 ETF flows are still partial because IBIT hasn’t reported yet. U.S. Retail Sales are due tonight at 20:30 WIB. I’ll wait for a clear 4H close above 65,662 or below 62,000 before making a judgment.
This is my analysis, not financial advice — always DYOR.
What do you think: is this MVRV 1.1 a bottom forming, or just a pause before looking for a new bottom?
#Bitcoin #MVRV $BTC
Bitcoin MVRV has fallen again to around 1.1 — two days ago it was still below 1.2.
Context: A CryptoQuant analysis cited by Brave New Coin and Coin-Turk today (Nov 17) notes that Bitcoin MVRV is now around 1.1 — the aggregate market value is nearing the average purchase price of all holders. Analyst Darkfost calls this “forming market bottom”: similar levels appeared at the 2022 bottom, when BTC was at 16,000–21,000, and this is the third occurrence in 2026, following February (~60,000) and June–July (~57,000). Glassnode (Nov 11) adds that short-term holder supply is concentrated at 62,000–66,000. BTC is around 64,300 this afternoon, still within that band.
Bullish scenario: holding above 62,000, then closing a 4H candle above 65,662, opens the way to 66,000 and strengthens the bottoming signal.
Bearish scenario: breaking below 62,000 opens the way to 59,000 — analyst Sean’s MVRV 1.1 level — and if that breaks too, this bottom thesis is invalidated.
My take: this is a valuation reading, not proof that buyers are returning — 30-day demand is still negative, and Monday, Nov 16 ETF flows are still partial because IBIT hasn’t reported yet. U.S. Retail Sales are due tonight at 20:30 WIB. I’ll wait for a clear 4H close above 65,662 or below 62,000 before making a judgment.
This is my analysis, not financial advice — always DYOR.
What do you think: is this MVRV 1.1 a bottom forming, or just a pause before looking for a new bottom?
#Bitcoin #MVRV $BTC
Context: A CryptoQuant analysis cited by Brave New Coin and Coin-Turk today (Nov 17) notes that Bitcoin MVRV is now around 1.1 — the aggregate market value is nearing the average purchase price of all holders. Analyst Darkfost calls this “forming market bottom”: similar levels appeared at the 2022 bottom, when BTC was at 16,000–21,000, and this is the third occurrence in 2026, following February (~60,000) and June–July (~57,000). Glassnode (Nov 11) adds that short-term holder supply is concentrated at 62,000–66,000. BTC is around 64,300 this afternoon, still within that band.
Bullish scenario: holding above 62,000, then closing a 4H candle above 65,662, opens the way to 66,000 and strengthens the bottoming signal.
Bearish scenario: breaking below 62,000 opens the way to 59,000 — analyst Sean’s MVRV 1.1 level — and if that breaks too, this bottom thesis is invalidated.
My take: this is a valuation reading, not proof that buyers are returning — 30-day demand is still negative, and Monday, Nov 16 ETF flows are still partial because IBIT hasn’t reported yet. U.S. Retail Sales are due tonight at 20:30 WIB. I’ll wait for a clear 4H close above 65,662 or below 62,000 before making a judgment.
This is my analysis, not financial advice — always DYOR.
What do you think: is this MVRV 1.1 a bottom forming, or just a pause before looking for a new bottom?
#Bitcoin #MVRV $BTC
3

·
--
On-chain indicators say a bottom is forming; market makers say pressure is pointing toward the 50,000s—the same price level, but two groups telling opposite stories. $BTC
MVRV is now around 1.1. CryptoQuant says this is back to where BTC was during the 2022 bear market, when it traded between $16,000 and $21,000. Analysts call it “a bottom in the making.”
But this signal has flashed twice already this year: once in February, when BTC was around $60,000, and again in June–July, when it was around $57,000. Neither time did the price bottom afterward.
On the other side, Wintermute’s view today is blunt: the 200-week moving average has been lost, flows are down across the board, and pressure is pointing toward the 50,000s. Saturday’s low of $62,000 is the first line of defense; $60,000 put options on Deribit, with over $900 million in open interest, are the next magnet.
BTC is now around $64,300, right in the $62,000–$66,000 cost-basis band where short-term holders are most concentrated. Short-term holders overall have only about 35% of their coins in profit.
Spot ETFs are still seeing outflows: another $68.6 million in net outflows on Monday, extending the streak to eight days. Markets are pricing in about a 92% chance of a rate hike in December, and the 10-year Treasury yield is back above 5%.
My view: being cheap and having bottomed are two different things. MVRV measures how much unrealized profit remains across all coins, not whether anyone is buying today; 30-day apparent demand is still languishing at -247,700 BTC. Buyers simply haven’t come back.
Wintermute itself also says it isn’t trying to call the bottom. The two conditions it laid out for turning cautious are the verifiable benchmarks: a UTC daily close above $68,000 accompanied by net ETF inflows that day, or FOMC minutes that remove expectations of a January rate hike.
Three things to watch next: whether $62,000 holds (Saturday’s low and the bottom of the concentrated cost-basis band); the combination of $68,000 and ETF inflows mentioned above; and the FOMC minutes at 3 a.m. Beijing time on November 19.
Which side do you trust more: on-chain’s “it’s already cheap,” or flows saying “money is still going out”? When you watch the market, do you look at price first, or that day’s ETF flows?
#比特币 #MVRV #Wintermute
The above is for informational purposes only and does not constitute investment advice.
On-chain indicators say a bottom is forming; market makers say pressure is pointing toward the 50,000s—the same price level, but two groups telling opposite stories. $BTC
MVRV is now around 1.1. CryptoQuant says this is back to where BTC was during the 2022 bear market, when it traded between $16,000 and $21,000. Analysts call it “a bottom in the making.”
But this signal has flashed twice already this year: once in February, when BTC was around $60,000, and again in June–July, when it was around $57,000. Neither time did the price bottom afterward.
On the other side, Wintermute’s view today is blunt: the 200-week moving average has been lost, flows are down across the board, and pressure is pointing toward the 50,000s. Saturday’s low of $62,000 is the first line of defense; $60,000 put options on Deribit, with over $900 million in open interest, are the next magnet.
BTC is now around $64,300, right in the $62,000–$66,000 cost-basis band where short-term holders are most concentrated. Short-term holders overall have only about 35% of their coins in profit.
Spot ETFs are still seeing outflows: another $68.6 million in net outflows on Monday, extending the streak to eight days. Markets are pricing in about a 92% chance of a rate hike in December, and the 10-year Treasury yield is back above 5%.
My view: being cheap and having bottomed are two different things. MVRV measures how much unrealized profit remains across all coins, not whether anyone is buying today; 30-day apparent demand is still languishing at -247,700 BTC. Buyers simply haven’t come back.
Wintermute itself also says it isn’t trying to call the bottom. The two conditions it laid out for turning cautious are the verifiable benchmarks: a UTC daily close above $68,000 accompanied by net ETF inflows that day, or FOMC minutes that remove expectations of a January rate hike.
Three things to watch next: whether $62,000 holds (Saturday’s low and the bottom of the concentrated cost-basis band); the combination of $68,000 and ETF inflows mentioned above; and the FOMC minutes at 3 a.m. Beijing time on November 19.
Which side do you trust more: on-chain’s “it’s already cheap,” or flows saying “money is still going out”? When you watch the market, do you look at price first, or that day’s ETF flows?
#比特币 #MVRV #Wintermute
The above is for informational purposes only and does not constitute investment advice.
MVRV is now around 1.1. CryptoQuant says this is back to where BTC was during the 2022 bear market, when it traded between $16,000 and $21,000. Analysts call it “a bottom in the making.”
But this signal has flashed twice already this year: once in February, when BTC was around $60,000, and again in June–July, when it was around $57,000. Neither time did the price bottom afterward.
On the other side, Wintermute’s view today is blunt: the 200-week moving average has been lost, flows are down across the board, and pressure is pointing toward the 50,000s. Saturday’s low of $62,000 is the first line of defense; $60,000 put options on Deribit, with over $900 million in open interest, are the next magnet.
BTC is now around $64,300, right in the $62,000–$66,000 cost-basis band where short-term holders are most concentrated. Short-term holders overall have only about 35% of their coins in profit.
Spot ETFs are still seeing outflows: another $68.6 million in net outflows on Monday, extending the streak to eight days. Markets are pricing in about a 92% chance of a rate hike in December, and the 10-year Treasury yield is back above 5%.
My view: being cheap and having bottomed are two different things. MVRV measures how much unrealized profit remains across all coins, not whether anyone is buying today; 30-day apparent demand is still languishing at -247,700 BTC. Buyers simply haven’t come back.
Wintermute itself also says it isn’t trying to call the bottom. The two conditions it laid out for turning cautious are the verifiable benchmarks: a UTC daily close above $68,000 accompanied by net ETF inflows that day, or FOMC minutes that remove expectations of a January rate hike.
Three things to watch next: whether $62,000 holds (Saturday’s low and the bottom of the concentrated cost-basis band); the combination of $68,000 and ETF inflows mentioned above; and the FOMC minutes at 3 a.m. Beijing time on November 19.
Which side do you trust more: on-chain’s “it’s already cheap,” or flows saying “money is still going out”? When you watch the market, do you look at price first, or that day’s ETF flows?
#比特币 #MVRV #Wintermute
The above is for informational purposes only and does not constitute investment advice.
61

·
--
MVRV for $BTC just fell to ~1.1 — a level last seen around the 2022 bottom. What is this indicator saying?
• MVRV = market cap / realized cap. ~1.1 means the price is only ~10% above holders’ average purchase price (CryptoQuant, Nov. 17).
• This is the third time during the 2026 downturn that MVRV has fallen below 1.2 — previous instances were associated with the 2022 bottom.
• But buying demand remains weak: 30-day net demand is ~247,700 BTC negative, and 1-year net demand is ~1.21 million BTC negative (Nov. 15).
• $BTC is at ~$64,600 (-13.7%/7 days), below the short-term holders’ cost basis of ~$75,600; the largest supply concentration is at $63,000–$65,000 (Glassnode).
• Fear & Greed: 12 (Extreme Fear); BTC ETFs saw ~$2.42 billion in outflows from Nov. 2–16.
These figures indicate that the market is in a historically undervalued zone, but that does not necessarily mean it has bottomed — buying demand remains negative, and ETF flows have yet to turn positive.
Levels to watch: whether $BTC holds $62,000–$63,000 or breaks below; whether MVRV falls below 1; and ETF flows this week.
This article is for market analysis only and is not investment advice.
$BTC #Bitcoin #Crypto #MVRV
MVRV for $BTC just fell to ~1.1 — a level last seen around the 2022 bottom. What is this indicator saying?
• MVRV = market cap / realized cap. ~1.1 means the price is only ~10% above holders’ average purchase price (CryptoQuant, Nov. 17).
• This is the third time during the 2026 downturn that MVRV has fallen below 1.2 — previous instances were associated with the 2022 bottom.
• But buying demand remains weak: 30-day net demand is ~247,700 BTC negative, and 1-year net demand is ~1.21 million BTC negative (Nov. 15).
• $BTC is at ~$64,600 (-13.7%/7 days), below the short-term holders’ cost basis of ~$75,600; the largest supply concentration is at $63,000–$65,000 (Glassnode).
• Fear & Greed: 12 (Extreme Fear); BTC ETFs saw ~$2.42 billion in outflows from Nov. 2–16.
These figures indicate that the market is in a historically undervalued zone, but that does not necessarily mean it has bottomed — buying demand remains negative, and ETF flows have yet to turn positive.
Levels to watch: whether $BTC holds $62,000–$63,000 or breaks below; whether MVRV falls below 1; and ETF flows this week.
This article is for market analysis only and is not investment advice.
$BTC #Bitcoin #Crypto #MVRV
• MVRV = market cap / realized cap. ~1.1 means the price is only ~10% above holders’ average purchase price (CryptoQuant, Nov. 17).
• This is the third time during the 2026 downturn that MVRV has fallen below 1.2 — previous instances were associated with the 2022 bottom.
• But buying demand remains weak: 30-day net demand is ~247,700 BTC negative, and 1-year net demand is ~1.21 million BTC negative (Nov. 15).
• $BTC is at ~$64,600 (-13.7%/7 days), below the short-term holders’ cost basis of ~$75,600; the largest supply concentration is at $63,000–$65,000 (Glassnode).
• Fear & Greed: 12 (Extreme Fear); BTC ETFs saw ~$2.42 billion in outflows from Nov. 2–16.
These figures indicate that the market is in a historically undervalued zone, but that does not necessarily mean it has bottomed — buying demand remains negative, and ETF flows have yet to turn positive.
Levels to watch: whether $BTC holds $62,000–$63,000 or breaks below; whether MVRV falls below 1; and ETF flows this week.
This article is for market analysis only and is not investment advice.
$BTC #Bitcoin #Crypto #MVRV
139

·
--
🚨 BREAKING: BTC has just entered a historically significant bottom-indicator zone, last seen at the 2022 bottom!
Bitcoin’s MVRV ratio, which measures market price against the average cost basis of all holders, has just fallen to 1.1, matching the zone around the $16,000 bottom in 2022. CryptoQuant analyst Darkfost calls this a sign that a bottom is forming—the third time this year.
The strange part: big players are still buying above the current price. Strategy added 485 BTC at an average price of $68,887, and Strive bought 251 BTC at $69,853, while BTC is hovering around just $64,600.
But don’t celebrate just yet. 30-day BTC demand is still negative at 247,700 coins, ETFs saw $1.07 billion in outflows last week, and the Fear Index is at just 12. Analyst Sean warns that $59,000 is the key threshold that will determine whether a bottom has formed.
Save this—this week will provide all the answers. Follow me; I post here first. $BTC
#Bitcoin #MVRV
🚨 BREAKING: BTC has just entered a historically significant bottom-indicator zone, last seen at the 2022 bottom!
Bitcoin’s MVRV ratio, which measures market price against the average cost basis of all holders, has just fallen to 1.1, matching the zone around the $16,000 bottom in 2022. CryptoQuant analyst Darkfost calls this a sign that a bottom is forming—the third time this year.
The strange part: big players are still buying above the current price. Strategy added 485 BTC at an average price of $68,887, and Strive bought 251 BTC at $69,853, while BTC is hovering around just $64,600.
But don’t celebrate just yet. 30-day BTC demand is still negative at 247,700 coins, ETFs saw $1.07 billion in outflows last week, and the Fear Index is at just 12. Analyst Sean warns that $59,000 is the key threshold that will determine whether a bottom has formed.
Save this—this week will provide all the answers. Follow me; I post here first. $BTC
#Bitcoin #MVRV
Bitcoin’s MVRV ratio, which measures market price against the average cost basis of all holders, has just fallen to 1.1, matching the zone around the $16,000 bottom in 2022. CryptoQuant analyst Darkfost calls this a sign that a bottom is forming—the third time this year.
The strange part: big players are still buying above the current price. Strategy added 485 BTC at an average price of $68,887, and Strive bought 251 BTC at $69,853, while BTC is hovering around just $64,600.
But don’t celebrate just yet. 30-day BTC demand is still negative at 247,700 coins, ETFs saw $1.07 billion in outflows last week, and the Fear Index is at just 12. Analyst Sean warns that $59,000 is the key threshold that will determine whether a bottom has formed.
Save this—this week will provide all the answers. Follow me; I post here first. $BTC
#Bitcoin #MVRV

160

·
--
【Market Update】Bitcoin MVRV falls to around 1.1, near historical lows
Bitcoin MVRV has fallen below 1.2 and is now around 1.1, marking the third time this year it has reached this range. Similar readings were seen at the bottom of the 2022 bear market. The short-term holder cost-basis cluster is between $62,000 and $66,000, with only 35% in profit; one-year apparent demand is approximately -1.21 million BTC, and ETFs saw net outflows of $1.07 billion last week. Are bottom signals emerging?
$BTC $ETH $XRP
#币安广场 #比特币 #MVRV
(Source: BraveNewCoin)
⚠️Risk warning: The above is shared for informational purposes only and does not constitute investment advice. Investing involves risk; proceed with caution.
【Market Update】Bitcoin MVRV falls to around 1.1, near historical lows
Bitcoin MVRV has fallen below 1.2 and is now around 1.1, marking the third time this year it has reached this range. Similar readings were seen at the bottom of the 2022 bear market. The short-term holder cost-basis cluster is between $62,000 and $66,000, with only 35% in profit; one-year apparent demand is approximately -1.21 million BTC, and ETFs saw net outflows of $1.07 billion last week. Are bottom signals emerging?
$BTC $ETH $XRP
#币安广场 #比特币 #MVRV
(Source: BraveNewCoin)
⚠️Risk warning: The above is shared for informational purposes only and does not constitute investment advice. Investing involves risk; proceed with caution.
Bitcoin MVRV has fallen below 1.2 and is now around 1.1, marking the third time this year it has reached this range. Similar readings were seen at the bottom of the 2022 bear market. The short-term holder cost-basis cluster is between $62,000 and $66,000, with only 35% in profit; one-year apparent demand is approximately -1.21 million BTC, and ETFs saw net outflows of $1.07 billion last week. Are bottom signals emerging?
$BTC $ETH $XRP
#币安广场 #比特币 #MVRV
(Source: BraveNewCoin)
⚠️Risk warning: The above is shared for informational purposes only and does not constitute investment advice. Investing involves risk; proceed with caution.


3

🌡️ MVRV — the on-chain world's thermometer.
1️⃣ MVRV = market cap ÷ realized cap (realized cap = each coin is counted at the price it last moved at)
2️⃣ High MVRV = many holders are in profit — historically, a zone of selling pressure
3️⃣ Low MVRV = coins have shifted into losses — historically, near accumulation zones
This isn't a “magical indicator” — it's a lens that connects sentiment with cost basis. Extreme readings matter, not the noise in between. 🧮
The benefit of on-chain data: emotions can't make claims. 🔍
$BTC
#OnChain #MVRV #CryptoEducation
🌡️ MVRV — the on-chain world's thermometer.
1️⃣ MVRV = market cap ÷ realized cap (realized cap = each coin is counted at the price it last moved at)
2️⃣ High MVRV = many holders are in profit — historically, a zone of selling pressure
3️⃣ Low MVRV = coins have shifted into losses — historically, near accumulation zones
This isn't a “magical indicator” — it's a lens that connects sentiment with cost basis. Extreme readings matter, not the noise in between. 🧮
The benefit of on-chain data: emotions can't make claims. 🔍
$BTC
#OnChain #MVRV #CryptoEducation
1️⃣ MVRV = market cap ÷ realized cap (realized cap = each coin is counted at the price it last moved at)
2️⃣ High MVRV = many holders are in profit — historically, a zone of selling pressure
3️⃣ Low MVRV = coins have shifted into losses — historically, near accumulation zones
This isn't a “magical indicator” — it's a lens that connects sentiment with cost basis. Extreme readings matter, not the noise in between. 🧮
The benefit of on-chain data: emotions can't make claims. 🔍
$BTC
#OnChain #MVRV #CryptoEducation
4
·
--
🚨 $BTC ASTONISHING: THE INDICATOR THAT HAS ONLY FLASHED 3 TIMES THIS YEAR JUST LIT UP
To me, this is what changes how we interpret the drop: CryptoQuant analyst Darkfost reported today that Bitcoin’s MVRV fell below 1.2, and this possible-bottom signal has only been triggered 3 times throughout the entire 2026 bear market. Bitcoin is hovering around $64,482 after touching $62,006 in the early hours.
Take a look at the detail nobody is noticing:
→ The previous two times this alert flashed were in February, with Bitcoin near $60,000, and between June and July, near $57,000: both times, the price was in capitulation territory.
→ The weekly drop has already exceeded 15% and would be the 45th of that magnitude in Bitcoin’s entire history, with the RSI at 21.03, in extreme oversold territory, and support levels everyone is watching at $64,000, $62,000, and $60,000.
→ While the price falls, Bitcoin ETFs have seen $1,000 million flow out over 5 consecutive sessions, and the SOPR is at 0.98, meaning those selling now are doing so at a loss.
Do you think this third MVRV alert marks the bottom, or will Bitcoin still head for $60,000? 👇
$BTC $ETH $SOL
#MVRV #Bitcoin #MarketBottom
🚨 $BTC ASTONISHING: THE INDICATOR THAT HAS ONLY FLASHED 3 TIMES THIS YEAR JUST LIT UP
To me, this is what changes how we interpret the drop: CryptoQuant analyst Darkfost reported today that Bitcoin’s MVRV fell below 1.2, and this possible-bottom signal has only been triggered 3 times throughout the entire 2026 bear market. Bitcoin is hovering around $64,482 after touching $62,006 in the early hours.
Take a look at the detail nobody is noticing:
→ The previous two times this alert flashed were in February, with Bitcoin near $60,000, and between June and July, near $57,000: both times, the price was in capitulation territory.
→ The weekly drop has already exceeded 15% and would be the 45th of that magnitude in Bitcoin’s entire history, with the RSI at 21.03, in extreme oversold territory, and support levels everyone is watching at $64,000, $62,000, and $60,000.
→ While the price falls, Bitcoin ETFs have seen $1,000 million flow out over 5 consecutive sessions, and the SOPR is at 0.98, meaning those selling now are doing so at a loss.
Do you think this third MVRV alert marks the bottom, or will Bitcoin still head for $60,000? 👇
$BTC $ETH $SOL
#MVRV #Bitcoin #MarketBottom
To me, this is what changes how we interpret the drop: CryptoQuant analyst Darkfost reported today that Bitcoin’s MVRV fell below 1.2, and this possible-bottom signal has only been triggered 3 times throughout the entire 2026 bear market. Bitcoin is hovering around $64,482 after touching $62,006 in the early hours.
Take a look at the detail nobody is noticing:
→ The previous two times this alert flashed were in February, with Bitcoin near $60,000, and between June and July, near $57,000: both times, the price was in capitulation territory.
→ The weekly drop has already exceeded 15% and would be the 45th of that magnitude in Bitcoin’s entire history, with the RSI at 21.03, in extreme oversold territory, and support levels everyone is watching at $64,000, $62,000, and $60,000.
→ While the price falls, Bitcoin ETFs have seen $1,000 million flow out over 5 consecutive sessions, and the SOPR is at 0.98, meaning those selling now are doing so at a loss.
Do you think this third MVRV alert marks the bottom, or will Bitcoin still head for $60,000? 👇
$BTC $ETH $SOL
#MVRV #Bitcoin #MarketBottom
1k
·
--
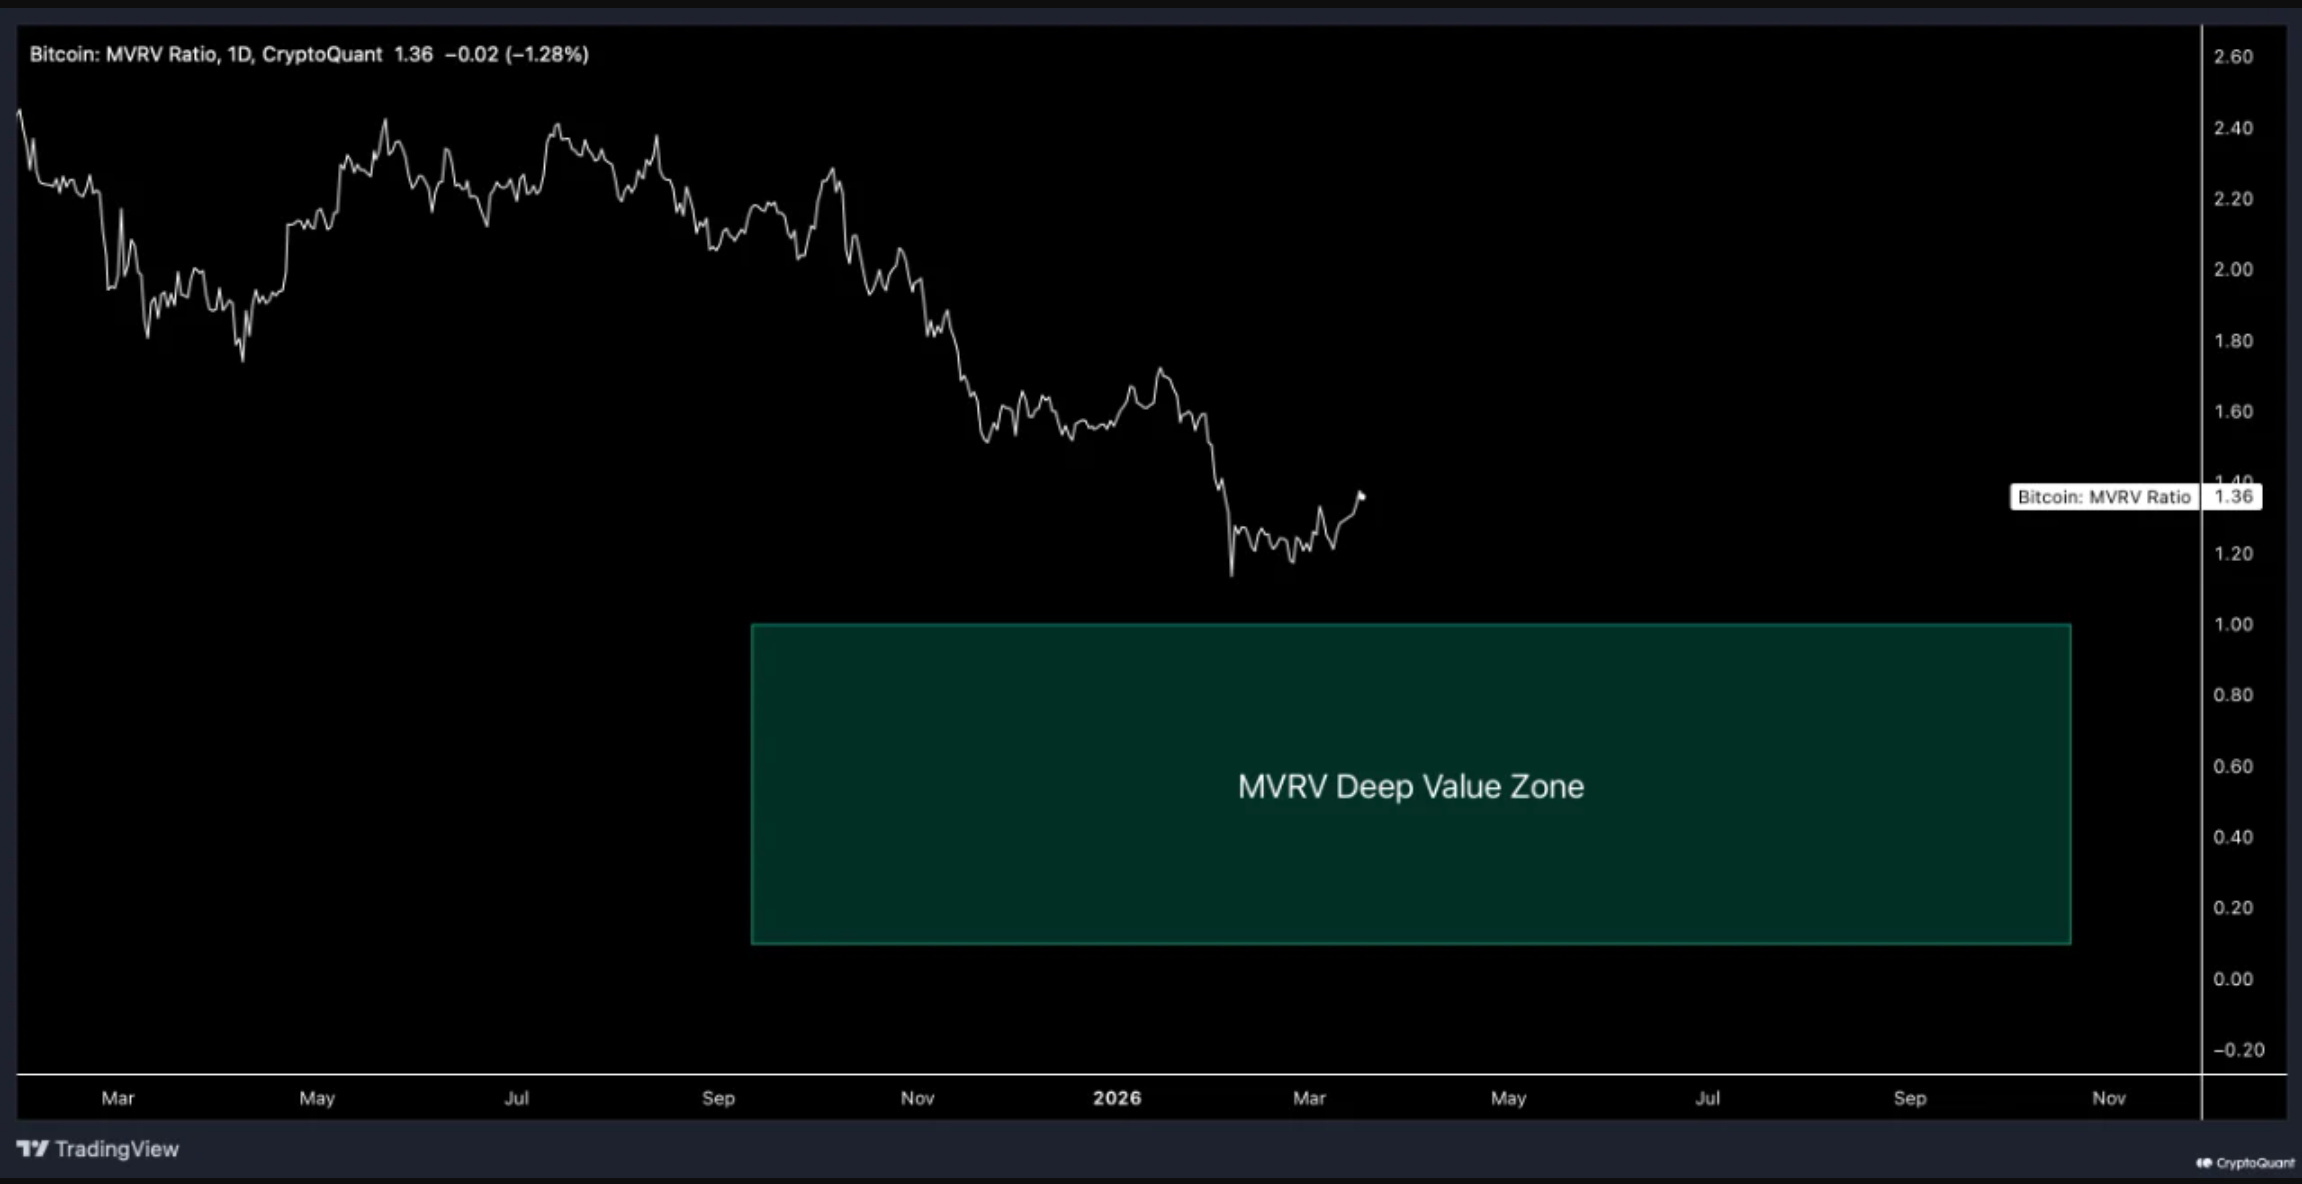
Bitcoin MVRV fell below 1.2 — the same alert that has appeared twice already this year.
Key figures:
• MVRV below 1.2 (Darkfost, CryptoQuant, Nov 15) — the third trigger for its preset in the 2026 bear market. The previous two: February, when BTC was around 60,000, and June–July, when it was around 57,000.
• SOPR around 0.98 (XWIN Japan, CryptoQuant, Nov 15) — coins that moved were sold, on average, slightly below breakeven.
• Less than 45% of the active supply is still in profit (CryptoQuant, Nov 14–15); MVRV Z-Score is 0.33.
• Demand comparison: spot BTC ETFs still saw around $1 billion in outflows over the 5 sessions through Nov 13 (Farside).
What I think it means: aggregate valuation has entered a zone that has historically been cheap — but being cheap alone is not proof that a bottom has formed. This preset is adjusted over time, and three triggers in one bear market don’t prove three lasting bottoms. What hasn’t turned around is demand: ETFs are still seeing outflows, and SOPR is below 1. So my read is: cheap, but there’s no evidence yet that buyers are back to absorbing supply.
What I’m watching: ETF flows next week and whether SOPR moves back above 1. BTC hit 62,112 earlier this morning and is now around 64,700.
What do you think — cheap valuation without a return of demand: enough reason to start paying attention, or should we keep waiting for evidence?
This is my analysis, not financial advice — always DYOR.
#Bitcoin #OnChain #MVRV $BTC
Bitcoin MVRV fell below 1.2 — the same alert that has appeared twice already this year.
Key figures:
• MVRV below 1.2 (Darkfost, CryptoQuant, Nov 15) — the third trigger for its preset in the 2026 bear market. The previous two: February, when BTC was around 60,000, and June–July, when it was around 57,000.
• SOPR around 0.98 (XWIN Japan, CryptoQuant, Nov 15) — coins that moved were sold, on average, slightly below breakeven.
• Less than 45% of the active supply is still in profit (CryptoQuant, Nov 14–15); MVRV Z-Score is 0.33.
• Demand comparison: spot BTC ETFs still saw around $1 billion in outflows over the 5 sessions through Nov 13 (Farside).
What I think it means: aggregate valuation has entered a zone that has historically been cheap — but being cheap alone is not proof that a bottom has formed. This preset is adjusted over time, and three triggers in one bear market don’t prove three lasting bottoms. What hasn’t turned around is demand: ETFs are still seeing outflows, and SOPR is below 1. So my read is: cheap, but there’s no evidence yet that buyers are back to absorbing supply.
What I’m watching: ETF flows next week and whether SOPR moves back above 1. BTC hit 62,112 earlier this morning and is now around 64,700.
What do you think — cheap valuation without a return of demand: enough reason to start paying attention, or should we keep waiting for evidence?
This is my analysis, not financial advice — always DYOR.
#Bitcoin #OnChain #MVRV $BTC
Key figures:
• MVRV below 1.2 (Darkfost, CryptoQuant, Nov 15) — the third trigger for its preset in the 2026 bear market. The previous two: February, when BTC was around 60,000, and June–July, when it was around 57,000.
• SOPR around 0.98 (XWIN Japan, CryptoQuant, Nov 15) — coins that moved were sold, on average, slightly below breakeven.
• Less than 45% of the active supply is still in profit (CryptoQuant, Nov 14–15); MVRV Z-Score is 0.33.
• Demand comparison: spot BTC ETFs still saw around $1 billion in outflows over the 5 sessions through Nov 13 (Farside).
What I think it means: aggregate valuation has entered a zone that has historically been cheap — but being cheap alone is not proof that a bottom has formed. This preset is adjusted over time, and three triggers in one bear market don’t prove three lasting bottoms. What hasn’t turned around is demand: ETFs are still seeing outflows, and SOPR is below 1. So my read is: cheap, but there’s no evidence yet that buyers are back to absorbing supply.
What I’m watching: ETF flows next week and whether SOPR moves back above 1. BTC hit 62,112 earlier this morning and is now around 64,700.
What do you think — cheap valuation without a return of demand: enough reason to start paying attention, or should we keep waiting for evidence?
This is my analysis, not financial advice — always DYOR.
#Bitcoin #OnChain #MVRV $BTC
·
--
The same “bottom signal,” in the same bear market, has sounded three times.
The MVRV score fell below 1.2, and analyst Darkfost’s on-chain alert sounded for the third time today. The first two times: in February, when BTC was still above $60,000; and in June–July, when BTC was at $57,000. The last time this signal appeared was in 2022, when BTC was between $16,000 and $21,000.
MVRV is market cap divided by realized cap. A reading of 1.2 means the market as a whole is sitting on an average unrealized gain of only about 20%. Using the realized price of around $54,000 from early November as a rough estimate, the current price of $65,600 puts MVRV at about 1.2; at the overnight low of $62,000, it was around 1.15.
More than half of holders are now underwater: the share of supply in profit has fallen below 45%. Historically, a drop below 40% has often coincided with local bottoms.
BTC is currently around $65,600, down about 2.4% over 24 hours. After hitting an overnight low of $62,000, it has rebounded about 5.7%, but it is still down around 12% from last Sunday’s close. At the overnight low, the weekly decline briefly exceeded 17%. The Fear and Greed Index is at 10—extreme fear—down from 20 to 10 in three days.
My take: this signal measures “cheap,” not “the bottom.”
After it sounded in February, the price fell further to $57,000. After it sounded in June, the price rose back to $84,000, a gain of nearly 50%. The same signal, followed by two opposite outcomes—it has never been a buy signal, but rather a line that says, “Any further drop would put the whole market underwater.”
What matters is how far the price is from the market’s average cost basis: the realized price is around $54,000, leaving the current price about 18% above it. If that level holds, the value zone remains intact; if it breaks, the MVRV Z-Score turns negative, and only then does a final sell-off like 2022 begin to take shape.
Next, watch whether BTC can close the week back above $66,000 tonight, whether ETF flows stop bleeding on Monday, and whether the share of supply in profit falls below 40%.
Do you see this kind of “cheap signal” in your own trading as a reason to add to your position, or a reason to wait? What happened the last time you acted on a similar signal?
$BTC
#比特币 #MVRV #On-chain data
The above is for informational purposes only and does not constitute investment advice.
The same “bottom signal,” in the same bear market, has sounded three times.
The MVRV score fell below 1.2, and analyst Darkfost’s on-chain alert sounded for the third time today. The first two times: in February, when BTC was still above $60,000; and in June–July, when BTC was at $57,000. The last time this signal appeared was in 2022, when BTC was between $16,000 and $21,000.
MVRV is market cap divided by realized cap. A reading of 1.2 means the market as a whole is sitting on an average unrealized gain of only about 20%. Using the realized price of around $54,000 from early November as a rough estimate, the current price of $65,600 puts MVRV at about 1.2; at the overnight low of $62,000, it was around 1.15.
More than half of holders are now underwater: the share of supply in profit has fallen below 45%. Historically, a drop below 40% has often coincided with local bottoms.
BTC is currently around $65,600, down about 2.4% over 24 hours. After hitting an overnight low of $62,000, it has rebounded about 5.7%, but it is still down around 12% from last Sunday’s close. At the overnight low, the weekly decline briefly exceeded 17%. The Fear and Greed Index is at 10—extreme fear—down from 20 to 10 in three days.
My take: this signal measures “cheap,” not “the bottom.”
After it sounded in February, the price fell further to $57,000. After it sounded in June, the price rose back to $84,000, a gain of nearly 50%. The same signal, followed by two opposite outcomes—it has never been a buy signal, but rather a line that says, “Any further drop would put the whole market underwater.”
What matters is how far the price is from the market’s average cost basis: the realized price is around $54,000, leaving the current price about 18% above it. If that level holds, the value zone remains intact; if it breaks, the MVRV Z-Score turns negative, and only then does a final sell-off like 2022 begin to take shape.
Next, watch whether BTC can close the week back above $66,000 tonight, whether ETF flows stop bleeding on Monday, and whether the share of supply in profit falls below 40%.
Do you see this kind of “cheap signal” in your own trading as a reason to add to your position, or a reason to wait? What happened the last time you acted on a similar signal?
$BTC
#比特币 #MVRV #On-chain data
The above is for informational purposes only and does not constitute investment advice.
The MVRV score fell below 1.2, and analyst Darkfost’s on-chain alert sounded for the third time today. The first two times: in February, when BTC was still above $60,000; and in June–July, when BTC was at $57,000. The last time this signal appeared was in 2022, when BTC was between $16,000 and $21,000.
MVRV is market cap divided by realized cap. A reading of 1.2 means the market as a whole is sitting on an average unrealized gain of only about 20%. Using the realized price of around $54,000 from early November as a rough estimate, the current price of $65,600 puts MVRV at about 1.2; at the overnight low of $62,000, it was around 1.15.
More than half of holders are now underwater: the share of supply in profit has fallen below 45%. Historically, a drop below 40% has often coincided with local bottoms.
BTC is currently around $65,600, down about 2.4% over 24 hours. After hitting an overnight low of $62,000, it has rebounded about 5.7%, but it is still down around 12% from last Sunday’s close. At the overnight low, the weekly decline briefly exceeded 17%. The Fear and Greed Index is at 10—extreme fear—down from 20 to 10 in three days.
My take: this signal measures “cheap,” not “the bottom.”
After it sounded in February, the price fell further to $57,000. After it sounded in June, the price rose back to $84,000, a gain of nearly 50%. The same signal, followed by two opposite outcomes—it has never been a buy signal, but rather a line that says, “Any further drop would put the whole market underwater.”
What matters is how far the price is from the market’s average cost basis: the realized price is around $54,000, leaving the current price about 18% above it. If that level holds, the value zone remains intact; if it breaks, the MVRV Z-Score turns negative, and only then does a final sell-off like 2022 begin to take shape.
Next, watch whether BTC can close the week back above $66,000 tonight, whether ETF flows stop bleeding on Monday, and whether the share of supply in profit falls below 40%.
Do you see this kind of “cheap signal” in your own trading as a reason to add to your position, or a reason to wait? What happened the last time you acted on a similar signal?
$BTC
#比特币 #MVRV #On-chain data
The above is for informational purposes only and does not constitute investment advice.
133

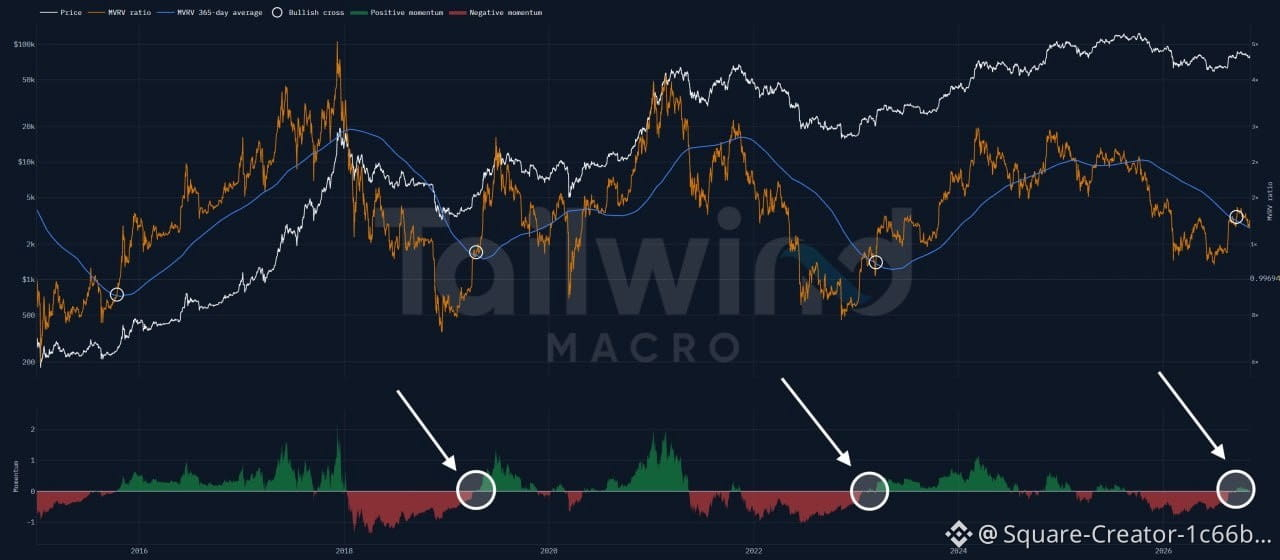
🐂 The BTC MVRV indicator has climbed back above its 1-Year Average, even with yesterday’s bearish candle!
This has happened only twice in the past nine years:
1️⃣ April 2019, when Bitcoin was priced at $5,000.
2️⃣ January 2023, when the price was $21,000.
Both times, this was a definitive signal that the Bear Market had ended and a new bull cycle was beginning! 🚀
$BTC
{future}(BTCUSDT)
@BinanceOracle Binance Square Official
#Bitcoin #BinanceSquare #Crypto #MVRV #BTC #BullMarket #BTC
🐂 The BTC MVRV indicator has climbed back above its 1-Year Average, even with yesterday’s bearish candle!
This has happened only twice in the past nine years:
1️⃣ April 2019, when Bitcoin was priced at $5,000.
2️⃣ January 2023, when the price was $21,000.
Both times, this was a definitive signal that the Bear Market had ended and a new bull cycle was beginning! 🚀
$BTC
@BinanceOracle Binance Square Official
#Bitcoin #BinanceSquare #Crypto #MVRV #BTC #BullMarket #BTC
This has happened only twice in the past nine years:
1️⃣ April 2019, when Bitcoin was priced at $5,000.
2️⃣ January 2023, when the price was $21,000.
Both times, this was a definitive signal that the Bear Market had ended and a new bull cycle was beginning! 🚀
$BTC
@BinanceOracle Binance Square Official
#Bitcoin #BinanceSquare #Crypto #MVRV #BTC #BullMarket #BTC
97
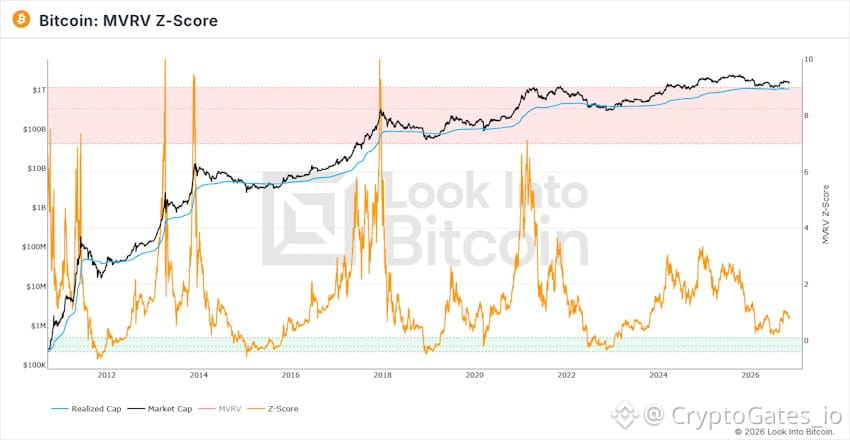
$BTC : MVRV Z-Score is reading below 1 📊
Past tops formed in the red band at the upper end of the chart. Past bottoms formed in the green band near zero and below. The current reading sits between them.
Market cap and realized cap are close together, so the network isn’t showing broad overvaluation or deep stress. Execution takeaway: neutral valuation zones give weak timing signals, so entry spacing and position sizing carry more weight than a single read. Gradual entry strategies are worth backtesting here, including how they behave if the indicator drifts toward either band ⚠️
#BTC #MVRV #DCA
$BTC : MVRV Z-Score is reading below 1 📊
Past tops formed in the red band at the upper end of the chart. Past bottoms formed in the green band near zero and below. The current reading sits between them.
Market cap and realized cap are close together, so the network isn’t showing broad overvaluation or deep stress. Execution takeaway: neutral valuation zones give weak timing signals, so entry spacing and position sizing carry more weight than a single read. Gradual entry strategies are worth backtesting here, including how they behave if the indicator drifts toward either band ⚠️
#BTC #MVRV #DCA
Past tops formed in the red band at the upper end of the chart. Past bottoms formed in the green band near zero and below. The current reading sits between them.
Market cap and realized cap are close together, so the network isn’t showing broad overvaluation or deep stress. Execution takeaway: neutral valuation zones give weak timing signals, so entry spacing and position sizing carry more weight than a single read. Gradual entry strategies are worth backtesting here, including how they behave if the indicator drifts toward either band ⚠️
#BTC #MVRV #DCA
58

·
--
$BTC | The MVRV Z-Score proxy I track for SatoshiMacro, built on AUD BTC closes, sits at 0.18 today, just above the 0.08 cutoff for the cycle-bottom zone. It already touched that zone once in 2026, only the sixth year that has happened since the proxy's 2016 start. On the desk, a second approach to a floor reads differently to the first. History shows the cycle-top zone has held for 183 days total versus 362 in the cycle-bottom zone. Bottoms take longer. My read is that slower rhythm matters more than today's single print. It is a position classifier, not a forecaster, and this signal carries 25 percent of Tier 1 in the SatoshiMacro Model, never the whole call. Not trading advice.
https://satoshimacro.com/tools/crypto/cycle-indicators/bitcoin-market-value-z-score/?utm_source=binance_square&utm_medium=social&utm_campaign=autopilot_short-1
#SatoshiMacro #MVRV #BitcoinCycle #Bitcoin
$BTC | The MVRV Z-Score proxy I track for SatoshiMacro, built on AUD BTC closes, sits at 0.18 today, just above the 0.08 cutoff for the cycle-bottom zone. It already touched that zone once in 2026, only the sixth year that has happened since the proxy's 2016 start. On the desk, a second approach to a floor reads differently to the first. History shows the cycle-top zone has held for 183 days total versus 362 in the cycle-bottom zone. Bottoms take longer. My read is that slower rhythm matters more than today's single print. It is a position classifier, not a forecaster, and this signal carries 25 percent of Tier 1 in the SatoshiMacro Model, never the whole call. Not trading advice.
https://satoshimacro.com/tools/crypto/cycle-indicators/bitcoin-market-value-z-score/?utm_source=binance_square&utm_medium=social&utm_campaign=autopilot_short-1
#SatoshiMacro #MVRV #BitcoinCycle #Bitcoin
https://satoshimacro.com/tools/crypto/cycle-indicators/bitcoin-market-value-z-score/?utm_source=binance_square&utm_medium=social&utm_campaign=autopilot_short-1
#SatoshiMacro #MVRV #BitcoinCycle #Bitcoin
93

·
--
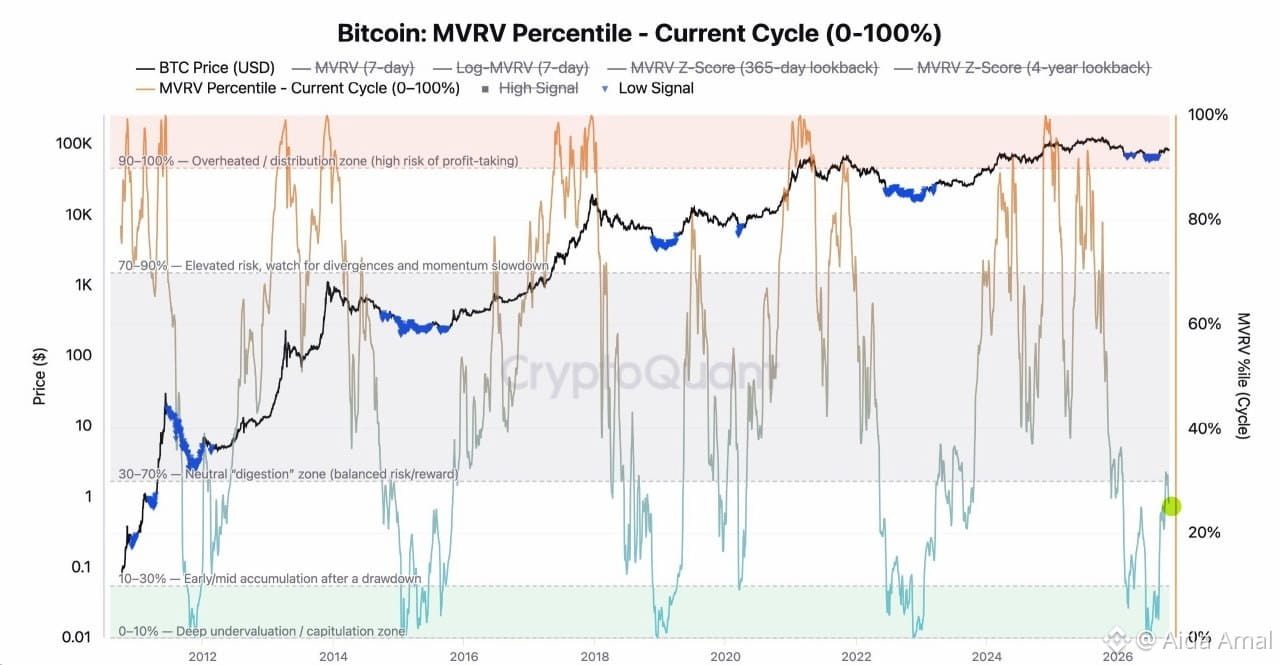
The #MVRV indicator has fallen below its historical 30th percentile, due to Bitcoin's inability to maintain levels near $87,000. As a result, analysts at #CryptoQuant suggest that $BTC is once again in the "accumulation zone".
The #MVRV indicator has fallen below its historical 30th percentile, due to Bitcoin's inability to maintain levels near $87,000. As a result, analysts at #CryptoQuant suggest that $BTC is once again in the "accumulation zone".
1
27

·
--
🐕 DOGE holders are down nearly 26% on average? On-chain metrics say selling pressure may be nearing its bottom
Latest data from Santiment (October 21):
📉 $DOGE 365-day MVRV ≈ 0.74: people who bought over the past year are deeply underwater on average
📉 $XRP 365-day MVRV ≈ 0.92: holders are also down overall
⚖️ BTC, ETH, and LINK are at 0.97–1.04, basically near the breakeven line
🔍 How should you read this?
MVRV < 1 = market cap is below the average cost basis of all holders. Historically, this has often been a range where selling pressure gradually runs out. But “cheap” doesn’t mean “about to go up”—prices could keep bottoming out for a long time.
On the other hand: around $0.0813, DOGE is at a strong resistance zone indicated by URPD. Until it holds above that level, any bounce is just a bounce. XRP’s daily on-chain transaction volume rose 59.37% over the same period—worth tracking to see if it continues.
📊 Sentiment: Fear & Greed Index at 63 (greed). Major coins have returned to their cost basis, while altcoins are even cheaper. Do you think they’re unfairly beaten down, or getting what they deserve?
Which do you think will recover first: DOGE or XRP? Join the discussion below 👇
#MVRV #链上数据 #Altcoins
Personal opinion only; not investment advice
🐕 DOGE holders are down nearly 26% on average? On-chain metrics say selling pressure may be nearing its bottom
Latest data from Santiment (October 21):
📉 $DOGE 365-day MVRV ≈ 0.74: people who bought over the past year are deeply underwater on average
📉 $XRP 365-day MVRV ≈ 0.92: holders are also down overall
⚖️ BTC, ETH, and LINK are at 0.97–1.04, basically near the breakeven line
🔍 How should you read this?
MVRV < 1 = market cap is below the average cost basis of all holders. Historically, this has often been a range where selling pressure gradually runs out. But “cheap” doesn’t mean “about to go up”—prices could keep bottoming out for a long time.
On the other hand: around $0.0813, DOGE is at a strong resistance zone indicated by URPD. Until it holds above that level, any bounce is just a bounce. XRP’s daily on-chain transaction volume rose 59.37% over the same period—worth tracking to see if it continues.
📊 Sentiment: Fear & Greed Index at 63 (greed). Major coins have returned to their cost basis, while altcoins are even cheaper. Do you think they’re unfairly beaten down, or getting what they deserve?
Which do you think will recover first: DOGE or XRP? Join the discussion below 👇
#MVRV #链上数据 #Altcoins
Personal opinion only; not investment advice
Latest data from Santiment (October 21):
📉 $DOGE 365-day MVRV ≈ 0.74: people who bought over the past year are deeply underwater on average
📉 $XRP 365-day MVRV ≈ 0.92: holders are also down overall
⚖️ BTC, ETH, and LINK are at 0.97–1.04, basically near the breakeven line
🔍 How should you read this?
MVRV < 1 = market cap is below the average cost basis of all holders. Historically, this has often been a range where selling pressure gradually runs out. But “cheap” doesn’t mean “about to go up”—prices could keep bottoming out for a long time.
On the other hand: around $0.0813, DOGE is at a strong resistance zone indicated by URPD. Until it holds above that level, any bounce is just a bounce. XRP’s daily on-chain transaction volume rose 59.37% over the same period—worth tracking to see if it continues.
📊 Sentiment: Fear & Greed Index at 63 (greed). Major coins have returned to their cost basis, while altcoins are even cheaper. Do you think they’re unfairly beaten down, or getting what they deserve?
Which do you think will recover first: DOGE or XRP? Join the discussion below 👇
#MVRV #链上数据 #Altcoins
Personal opinion only; not investment advice

12
Log in to explore more content
Join global crypto users on Binance Square
⚡️ Get latest and useful information about crypto.
💬 Trusted by the world’s largest crypto exchange.
👍 Discover real insights from verified creators.
Email / Phone number
Trending Topics
1
#NvidiaLoses$2.7TrillionInMonthAndAHalf
5,208 views
71 Discussing
2
#CanBTCReboundAfterFallingBelow60K?
611,302 views
2,631 Discussing
3
#GlobalStocksFaceLongestLosingStreakSince2023
214,271 views
1,803 Discussing
4
#BlackRockIBITPostsRecord$541MSingleDayOutflow
20,803 views
63 Discussing
5
#AnthropicPlungesTowardIPOPriceonDay2
106,425 views
1,070 Discussing
6
#TwentyOneCapitalAdds172.25BTC
44,955 views
551 Discussing
7
#HKBillWouldExcludeTokenizedDepositsFromVirtualAssets
5,006 views
48 Discussing
8
#BNBDropsBelow540USDTWith8.46%DailyDecline
60,939 views
566 Discussing
9
#HKBillProposesHK$100KFineForUnauthorizedCryptoTitles
2,033 views
20 Discussing
10
#BitMineFaces$10.1BUnrealizedETHLoss
4,291 views
25 Discussing