
CryptoGates_io
519 Posts

CryptoGates_io
Report
Block User
No 1 FREE Crypto Strategy Builder 🧠
Crypto made simple, safer and profitable for everyone 📈
Build | Backtest | Optimize | Automate 🤖
Occasional Trader
3.8 Years
412 Following
64 Followers
26 Liked
Posts
All
Videos
$BTC dipped to ~55K and is back at 59.2K. What it means:
55K was a wick, not a confirmed base. Watch daily closes above 60K.
Range to respect: 55K support, 62K resistance.
Bottom calls have been drifting (40-50K earlier, 55-57K now). Always check whether a call is data or a position being defended.
Leverage on a bottom call is the real risk. The market does not need to prove you wrong, it only needs to move first.
Plan: define invalidation before entry, scale in with DCA, backtest the range first.
$BTC dipped to ~55K and is back at 59.2K. What it means:
55K was a wick, not a confirmed base. Watch daily closes above 60K.
Range to respect: 55K support, 62K resistance.
Bottom calls have been drifting (40-50K earlier, 55-57K now). Always check whether a call is data or a position being defended.
Leverage on a bottom call is the real risk. The market does not need to prove you wrong, it only needs to move first.
Plan: define invalidation before entry, scale in with DCA, backtest the range first.
55K was a wick, not a confirmed base. Watch daily closes above 60K.
Range to respect: 55K support, 62K resistance.
Bottom calls have been drifting (40-50K earlier, 55-57K now). Always check whether a call is data or a position being defended.
Leverage on a bottom call is the real risk. The market does not need to prove you wrong, it only needs to move first.
Plan: define invalidation before entry, scale in with DCA, backtest the range first.
93
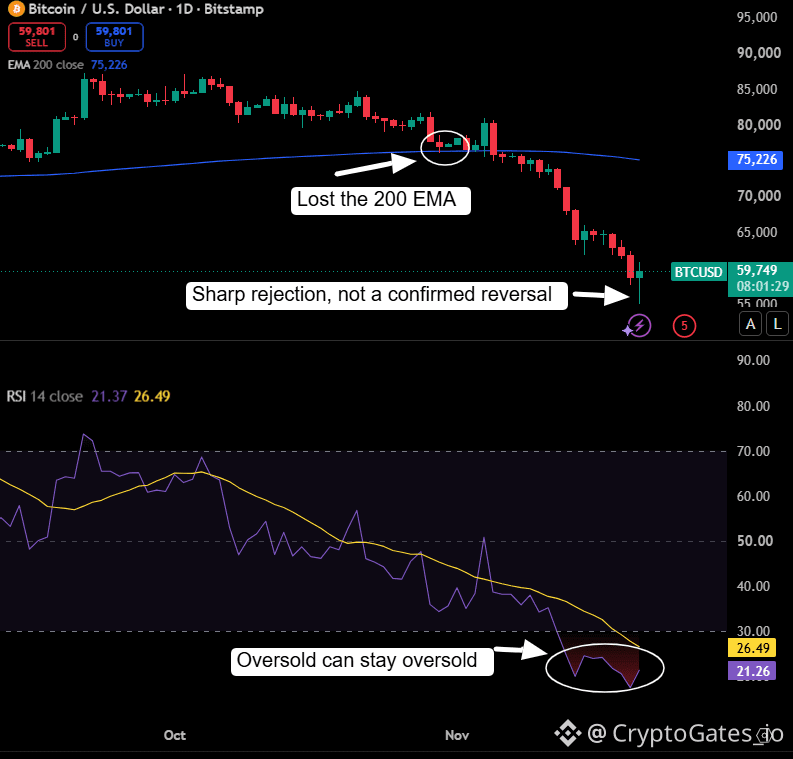
$BTC Daily: A Sharp Wick Is Not a Confirmed Reversal
Bitcoin printed a daily low of 55,081 and recovered to 59,749 at the time of writing.
📊 Key readings on the daily chart:
Price remains well below the 200 EMA at 75,226.
RSI (14) is at 21.26, deep in oversold territory.
Oversold readings describe momentum, not direction. In a downtrend, RSI can stay compressed for extended periods, so a bounce from it alone is not a signal.
Scenario map:
Bulls reclaim 60K and hold it on a daily close. The wick begins to function as a base.
Price revisits and loses 55,081. The wick turns out to be a liquidity sweep, and the structure weakens further.
Spot ETF flows have leaned negative this month, so I would want to see spot demand return before treating any bounce as durable.
Verify first. Risk later. Scale slowly.
#BTC #Bitcoin
$BTC Daily: A Sharp Wick Is Not a Confirmed Reversal
Bitcoin printed a daily low of 55,081 and recovered to 59,749 at the time of writing.
📊 Key readings on the daily chart:
Price remains well below the 200 EMA at 75,226.
RSI (14) is at 21.26, deep in oversold territory.
Oversold readings describe momentum, not direction. In a downtrend, RSI can stay compressed for extended periods, so a bounce from it alone is not a signal.
Scenario map:
Bulls reclaim 60K and hold it on a daily close. The wick begins to function as a base.
Price revisits and loses 55,081. The wick turns out to be a liquidity sweep, and the structure weakens further.
Spot ETF flows have leaned negative this month, so I would want to see spot demand return before treating any bounce as durable.
Verify first. Risk later. Scale slowly.
#BTC #Bitcoin
Bitcoin printed a daily low of 55,081 and recovered to 59,749 at the time of writing.
📊 Key readings on the daily chart:
Price remains well below the 200 EMA at 75,226.
RSI (14) is at 21.26, deep in oversold territory.
Oversold readings describe momentum, not direction. In a downtrend, RSI can stay compressed for extended periods, so a bounce from it alone is not a signal.
Scenario map:
Bulls reclaim 60K and hold it on a daily close. The wick begins to function as a base.
Price revisits and loses 55,081. The wick turns out to be a liquidity sweep, and the structure weakens further.
Spot ETF flows have leaned negative this month, so I would want to see spot demand return before treating any bounce as durable.
Verify first. Risk later. Scale slowly.
#BTC #Bitcoin
81
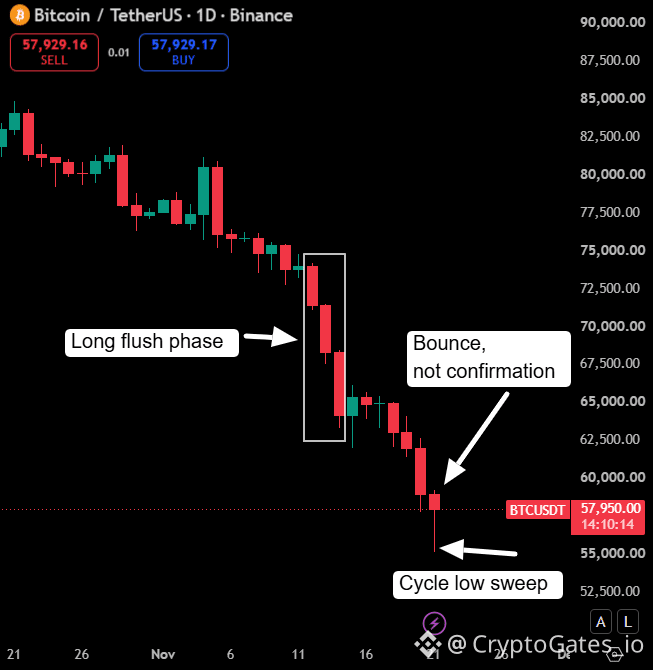
$BTC Swept 55,130: What the Liquidation Data Actually Says
BTC/USDT printed a low of 55,130 and is trading near 57,950 on the daily. The more useful signal is positioning.
📊 24h liquidations: $2.55B, with $2.27B (89.2%) from longs
👥 359,048 traders liquidated
🔎 BTC liquidations: $1.16B, 89.2% long
This looks like a leverage flush, not broad panic. In the latest 4h window, short liquidations ($108.41M) exceeded long liquidations ($81.22M), which points to a short squeeze inside the bounce.
A bounce is not confirmation. Price reclaiming a level is different from a confirmed retest. Key scenarios:
55,130 holds and price retests the breakdown zone successfully.
The bounce fades and 55,130 is swept again.
Range-bound chop that traps both sides.
Plan for all three before sizing anything.
Backtest the plan, keep size small, scale slowly.
#BTC #Bitcoin #Liquidations
$BTC Swept 55,130: What the Liquidation Data Actually Says
BTC/USDT printed a low of 55,130 and is trading near 57,950 on the daily. The more useful signal is positioning.
📊 24h liquidations: $2.55B, with $2.27B (89.2%) from longs
👥 359,048 traders liquidated
🔎 BTC liquidations: $1.16B, 89.2% long
This looks like a leverage flush, not broad panic. In the latest 4h window, short liquidations ($108.41M) exceeded long liquidations ($81.22M), which points to a short squeeze inside the bounce.
A bounce is not confirmation. Price reclaiming a level is different from a confirmed retest. Key scenarios:
55,130 holds and price retests the breakdown zone successfully.
The bounce fades and 55,130 is swept again.
Range-bound chop that traps both sides.
Plan for all three before sizing anything.
Backtest the plan, keep size small, scale slowly.
#BTC #Bitcoin #Liquidations
BTC/USDT printed a low of 55,130 and is trading near 57,950 on the daily. The more useful signal is positioning.
📊 24h liquidations: $2.55B, with $2.27B (89.2%) from longs
👥 359,048 traders liquidated
🔎 BTC liquidations: $1.16B, 89.2% long
This looks like a leverage flush, not broad panic. In the latest 4h window, short liquidations ($108.41M) exceeded long liquidations ($81.22M), which points to a short squeeze inside the bounce.
A bounce is not confirmation. Price reclaiming a level is different from a confirmed retest. Key scenarios:
55,130 holds and price retests the breakdown zone successfully.
The bounce fades and 55,130 is swept again.
Range-bound chop that traps both sides.
Plan for all three before sizing anything.
Backtest the plan, keep size small, scale slowly.
#BTC #Bitcoin #Liquidations
104
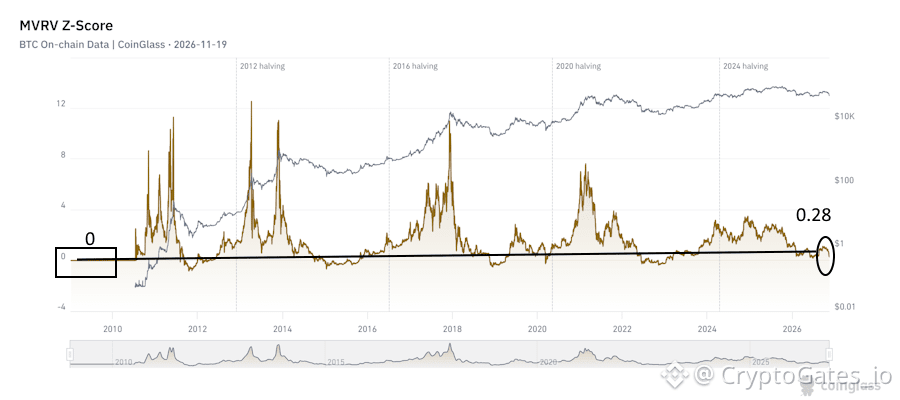
$BTC : MVRV Z-Score is at 0.28, around the 26th percentile of its full history. 📊
What it shows: market cap is only slightly above realized cap, so the average holder is near their cost basis. Valuation is compressed, but it has not gone into the negative zone that has historically appeared late in bear phases.
Execution angle: compressed valuation can last a long time. This is where staged entries (DCA) and defined risk usually hold up better than all-in decisions.
Backtest the parameters first.
#Bitcoin #MVRV #DCA
$BTC : MVRV Z-Score is at 0.28, around the 26th percentile of its full history. 📊
What it shows: market cap is only slightly above realized cap, so the average holder is near their cost basis. Valuation is compressed, but it has not gone into the negative zone that has historically appeared late in bear phases.
Execution angle: compressed valuation can last a long time. This is where staged entries (DCA) and defined risk usually hold up better than all-in decisions.
Backtest the parameters first.
#Bitcoin #MVRV #DCA
What it shows: market cap is only slightly above realized cap, so the average holder is near their cost basis. Valuation is compressed, but it has not gone into the negative zone that has historically appeared late in bear phases.
Execution angle: compressed valuation can last a long time. This is where staged entries (DCA) and defined risk usually hold up better than all-in decisions.
Backtest the parameters first.
#Bitcoin #MVRV #DCA
113
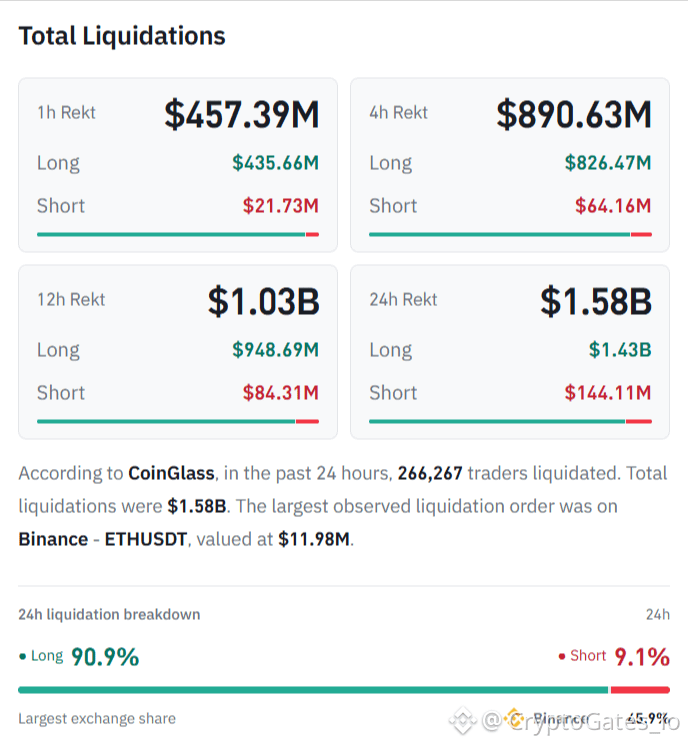
$1.58B Liquidated in 24 Hours: Longs Took 90.9%
CoinGlass data shows $1.43B in long liquidations against $144.11M in shorts, with 266,267 traders affected. The last hour alone saw $457.39M, with $435.66M from longs.
📊 Key takeaways:
Binance accounted for 45.9% of total liquidations. The largest single order was a $11.98M ETHUSDT long.
A leverage flush is not the same as capitulation. Liquidations clear overleveraged positions; capitulation needs spot holders selling at a loss.
Scenario map: if funding resets and open interest rebuilds slowly, expect range-bound base-building. If forced selling spills into spot, the cascade can extend.
Track funding rates, open interest and spot volume before adding exposure. Position size matters more than direction in moments like this.
Verify first. Risk later. Scale slowly.
#Bitcoin #Liquidations #CryptoRisk
$1.58B Liquidated in 24 Hours: Longs Took 90.9%
CoinGlass data shows $1.43B in long liquidations against $144.11M in shorts, with 266,267 traders affected. The last hour alone saw $457.39M, with $435.66M from longs.
📊 Key takeaways:
Binance accounted for 45.9% of total liquidations. The largest single order was a $11.98M ETHUSDT long.
A leverage flush is not the same as capitulation. Liquidations clear overleveraged positions; capitulation needs spot holders selling at a loss.
Scenario map: if funding resets and open interest rebuilds slowly, expect range-bound base-building. If forced selling spills into spot, the cascade can extend.
Track funding rates, open interest and spot volume before adding exposure. Position size matters more than direction in moments like this.
Verify first. Risk later. Scale slowly.
#Bitcoin #Liquidations #CryptoRisk
CoinGlass data shows $1.43B in long liquidations against $144.11M in shorts, with 266,267 traders affected. The last hour alone saw $457.39M, with $435.66M from longs.
📊 Key takeaways:
Binance accounted for 45.9% of total liquidations. The largest single order was a $11.98M ETHUSDT long.
A leverage flush is not the same as capitulation. Liquidations clear overleveraged positions; capitulation needs spot holders selling at a loss.
Scenario map: if funding resets and open interest rebuilds slowly, expect range-bound base-building. If forced selling spills into spot, the cascade can extend.
Track funding rates, open interest and spot volume before adding exposure. Position size matters more than direction in moments like this.
Verify first. Risk later. Scale slowly.
#Bitcoin #Liquidations #CryptoRisk
86
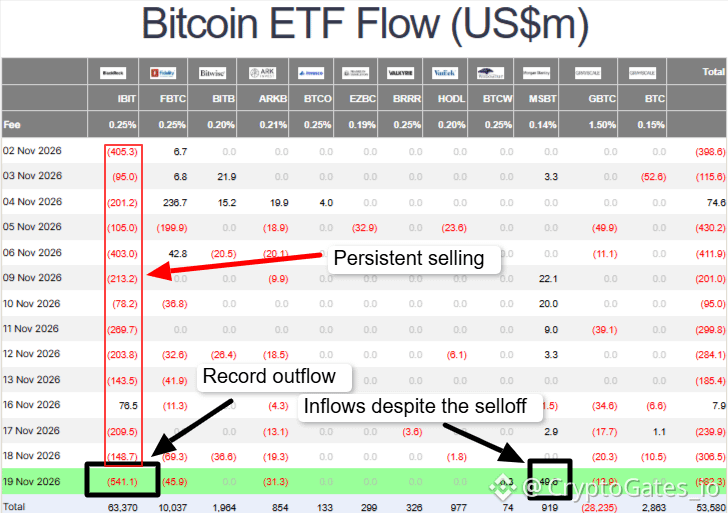
$BTC ETF Flows: Record Single-Day Outflow
IBIT recorded $541.1M in net outflows on Nov 19, its largest single day on record. Total US spot Bitcoin ETF outflows reached $582.3M that session, with BTC trading near 61.6K.
The details matter more than the headline. IBIT has seen outflows on 13 of 14 sessions this month, so the pressure is concentrated in one fund rather than spread evenly. MSBT recorded $49.6M of inflows on the same day 📈, the largest on the board.
A record outflow is not proof of capitulation. Flows show where capital is moving, but they don’t show panic by themselves. Two scenarios to track:
Outflows cool down and price stabilizes, which would suggest the heavy trimming is fading.
Outflows stay at this pace and spread to other funds, which would keep pressure on price.
Key checks before acting: outflow size over the next sessions, whether other funds join, and how price reacts around current levels. Size positions for both scenarios, not just the one you prefer.
Verify first. Risk later. Scale slowly.
#BTC #BitcoinETF
$BTC ETF Flows: Record Single-Day Outflow
IBIT recorded $541.1M in net outflows on Nov 19, its largest single day on record. Total US spot Bitcoin ETF outflows reached $582.3M that session, with BTC trading near 61.6K.
The details matter more than the headline. IBIT has seen outflows on 13 of 14 sessions this month, so the pressure is concentrated in one fund rather than spread evenly. MSBT recorded $49.6M of inflows on the same day 📈, the largest on the board.
A record outflow is not proof of capitulation. Flows show where capital is moving, but they don’t show panic by themselves. Two scenarios to track:
Outflows cool down and price stabilizes, which would suggest the heavy trimming is fading.
Outflows stay at this pace and spread to other funds, which would keep pressure on price.
Key checks before acting: outflow size over the next sessions, whether other funds join, and how price reacts around current levels. Size positions for both scenarios, not just the one you prefer.
Verify first. Risk later. Scale slowly.
#BTC #BitcoinETF
IBIT recorded $541.1M in net outflows on Nov 19, its largest single day on record. Total US spot Bitcoin ETF outflows reached $582.3M that session, with BTC trading near 61.6K.
The details matter more than the headline. IBIT has seen outflows on 13 of 14 sessions this month, so the pressure is concentrated in one fund rather than spread evenly. MSBT recorded $49.6M of inflows on the same day 📈, the largest on the board.
A record outflow is not proof of capitulation. Flows show where capital is moving, but they don’t show panic by themselves. Two scenarios to track:
Outflows cool down and price stabilizes, which would suggest the heavy trimming is fading.
Outflows stay at this pace and spread to other funds, which would keep pressure on price.
Key checks before acting: outflow size over the next sessions, whether other funds join, and how price reacts around current levels. Size positions for both scenarios, not just the one you prefer.
Verify first. Risk later. Scale slowly.
#BTC #BitcoinETF
81
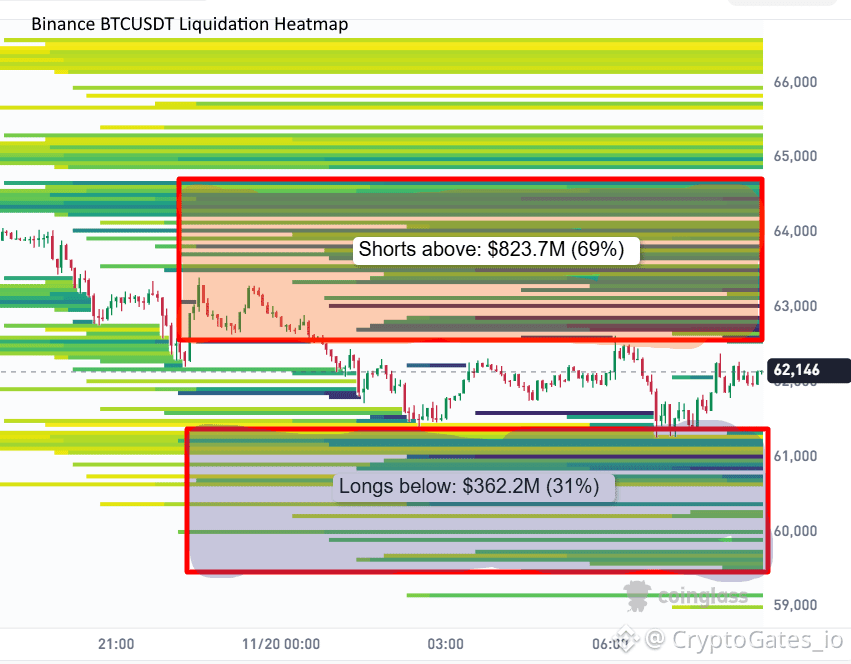
$BTC Liquidation Map: Where the Leverage Sits 📊
BTC trades near $62,146. On Binance BTCUSDT, the 24h heatmap shows:
🔴 Shorts above: $823.7M (69%)
🟢 Longs below: $362.2M (31%)
Short liquidations are stacked roughly between 62.7K and 64.7K. Long liquidations cluster between roughly 61.4K and 59.5K.
Dense zones can attract price, but they do not predict direction. Three scenarios are on the table: a squeeze into the upside cluster, a sweep of the long cluster below, or continued range-bound chop. These figures are estimates based on open positions and typical leverage, not resting orders, and they update constantly.
Decide your response to each scenario before price gets there. Verify first. Risk later. Scale slowly.
$BTC #BTCUpdat #Liquidations
$BTC Liquidation Map: Where the Leverage Sits 📊
BTC trades near $62,146. On Binance BTCUSDT, the 24h heatmap shows:
🔴 Shorts above: $823.7M (69%)
🟢 Longs below: $362.2M (31%)
Short liquidations are stacked roughly between 62.7K and 64.7K. Long liquidations cluster between roughly 61.4K and 59.5K.
Dense zones can attract price, but they do not predict direction. Three scenarios are on the table: a squeeze into the upside cluster, a sweep of the long cluster below, or continued range-bound chop. These figures are estimates based on open positions and typical leverage, not resting orders, and they update constantly.
Decide your response to each scenario before price gets there. Verify first. Risk later. Scale slowly.
$BTC #BTCUpdat #Liquidations
BTC trades near $62,146. On Binance BTCUSDT, the 24h heatmap shows:
🔴 Shorts above: $823.7M (69%)
🟢 Longs below: $362.2M (31%)
Short liquidations are stacked roughly between 62.7K and 64.7K. Long liquidations cluster between roughly 61.4K and 59.5K.
Dense zones can attract price, but they do not predict direction. Three scenarios are on the table: a squeeze into the upside cluster, a sweep of the long cluster below, or continued range-bound chop. These figures are estimates based on open positions and typical leverage, not resting orders, and they update constantly.
Decide your response to each scenario before price gets there. Verify first. Risk later. Scale slowly.
$BTC #BTCUpdat #Liquidations
151
$BTC defends the $62K shelf, but the structure still needs confirmation
BTC trades near $63.8K after a daily low of $62.39K and a weekly low of $62.06K. Six consecutive red weeks are in the books, and a seventh is in progress.
Pressure is coming from three places: December rate-hike bets, roughly $2.6B of spot ETF outflows this month, and cash raising around the mega IPO windows. The IPO overlap is a narrative with a sample of two, not a signal.
Scenario map:
🔹 $62K holds and BTC reclaims $65-66K: relief move, next test at $68-70K
🔹 Daily close below $62K: leveraged longs get flushed, targets $60K then $58.5K (June low)
Glassnode data shows ~66,000 BTC accumulated in the $62-66K range, with about 20% of short-term holder supply there. That is support, but also overhead supply if price returns to breakeven.
Daily RSI near 22 is oversold, which is not the same as a bottom. A reclaim is not a confirmed retest. Wait for closes, size small, and let the level prove itself.
Verify first. Risk later. Scale slowly.
#BTC #Bitcoin #CryptoMarkets
$BTC defends the $62K shelf, but the structure still needs confirmation
BTC trades near $63.8K after a daily low of $62.39K and a weekly low of $62.06K. Six consecutive red weeks are in the books, and a seventh is in progress.
Pressure is coming from three places: December rate-hike bets, roughly $2.6B of spot ETF outflows this month, and cash raising around the mega IPO windows. The IPO overlap is a narrative with a sample of two, not a signal.
Scenario map:
🔹 $62K holds and BTC reclaims $65-66K: relief move, next test at $68-70K
🔹 Daily close below $62K: leveraged longs get flushed, targets $60K then $58.5K (June low)
Glassnode data shows ~66,000 BTC accumulated in the $62-66K range, with about 20% of short-term holder supply there. That is support, but also overhead supply if price returns to breakeven.
Daily RSI near 22 is oversold, which is not the same as a bottom. A reclaim is not a confirmed retest. Wait for closes, size small, and let the level prove itself.
Verify first. Risk later. Scale slowly.
#BTC #Bitcoin #CryptoMarkets
BTC trades near $63.8K after a daily low of $62.39K and a weekly low of $62.06K. Six consecutive red weeks are in the books, and a seventh is in progress.
Pressure is coming from three places: December rate-hike bets, roughly $2.6B of spot ETF outflows this month, and cash raising around the mega IPO windows. The IPO overlap is a narrative with a sample of two, not a signal.
Scenario map:
🔹 $62K holds and BTC reclaims $65-66K: relief move, next test at $68-70K
🔹 Daily close below $62K: leveraged longs get flushed, targets $60K then $58.5K (June low)
Glassnode data shows ~66,000 BTC accumulated in the $62-66K range, with about 20% of short-term holder supply there. That is support, but also overhead supply if price returns to breakeven.
Daily RSI near 22 is oversold, which is not the same as a bottom. A reclaim is not a confirmed retest. Wait for closes, size small, and let the level prove itself.
Verify first. Risk later. Scale slowly.
#BTC #Bitcoin #CryptoMarkets
81
Fed Hike Debate: 25 or 50 bps? 📊
Rate expectations have shifted from “when do cuts start” to “how large is the December hike.” Several Fed officials have discussed a 50 bps move, while a hike of some size is largely priced in. $BTC is trading near 63.6K as the macro backdrop takes control.
Scenario map for the December FOMC:
1️⃣ 25 bps, cautious tone: largely priced in, likely a relief chop.
2️⃣ 25 bps, hawkish guidance: the language matters more than the number.
3️⃣ 50 bps: the tail case. Faster liquidity tightening puts leveraged positions under pressure.
The useful question is not which scenario wins, but whether your position and sizing hold up in all three. Reduce leverage into event risk, define your risk before the decision, and test your strategy against rate-shock conditions rather than trusting a forecast.
Verify first. Risk later. Scale slowly.
#BTC #FOMC #Bitcoin
Fed Hike Debate: 25 or 50 bps? 📊
Rate expectations have shifted from “when do cuts start” to “how large is the December hike.” Several Fed officials have discussed a 50 bps move, while a hike of some size is largely priced in. $BTC is trading near 63.6K as the macro backdrop takes control.
Scenario map for the December FOMC:
1️⃣ 25 bps, cautious tone: largely priced in, likely a relief chop.
2️⃣ 25 bps, hawkish guidance: the language matters more than the number.
3️⃣ 50 bps: the tail case. Faster liquidity tightening puts leveraged positions under pressure.
The useful question is not which scenario wins, but whether your position and sizing hold up in all three. Reduce leverage into event risk, define your risk before the decision, and test your strategy against rate-shock conditions rather than trusting a forecast.
Verify first. Risk later. Scale slowly.
#BTC #FOMC #Bitcoin
Rate expectations have shifted from “when do cuts start” to “how large is the December hike.” Several Fed officials have discussed a 50 bps move, while a hike of some size is largely priced in. $BTC is trading near 63.6K as the macro backdrop takes control.
Scenario map for the December FOMC:
1️⃣ 25 bps, cautious tone: largely priced in, likely a relief chop.
2️⃣ 25 bps, hawkish guidance: the language matters more than the number.
3️⃣ 50 bps: the tail case. Faster liquidity tightening puts leveraged positions under pressure.
The useful question is not which scenario wins, but whether your position and sizing hold up in all three. Reduce leverage into event risk, define your risk before the decision, and test your strategy against rate-shock conditions rather than trusting a forecast.
Verify first. Risk later. Scale slowly.
#BTC #FOMC #Bitcoin
76
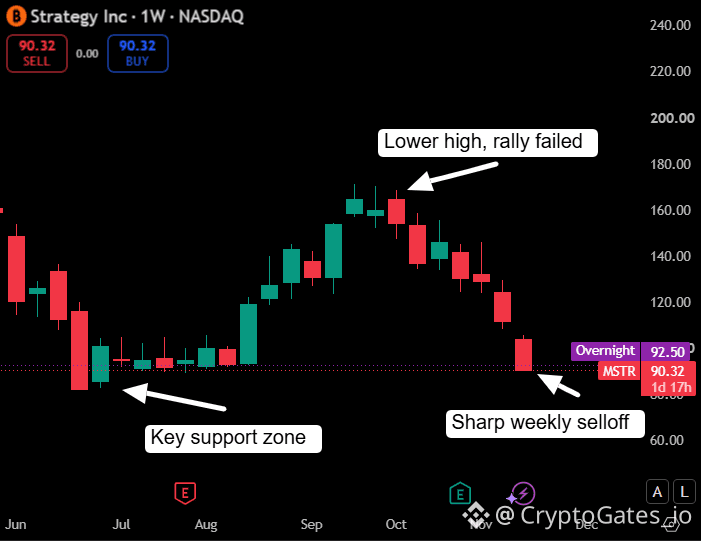
Strategy’s latest filing tells a different story than the headlines. 📊
Last week: 485 $BTC bought ($33.4M) vs $228M spent on STRC preferred buybacks. Nearly 7x more went into defending the preferred than into new Bitcoin.
Context:
Holdings: 850,849 BTC
Average cost: $75,452
BTC now: ~$63K, roughly $10B below cost ⚠️
USD reserve: $4.9B
December STRC dividend: 12%
MSTR: $90.32, down 19% on the weekly candle
The chart shows a lower high in autumn followed by a sharp weekly selloff, with the Jul-Aug base now the key support zone.
When average cost sits well above spot, funding obligations matter more than accumulation. STRC holding near its $100 par is the level to watch.
The lesson for traders: leverage amplifies conviction and cost of carry at the same time. Backtest your exposure before you scale it.
Verify first. Risk later. Scale slowly.
#BTC #MSTR
Strategy’s latest filing tells a different story than the headlines. 📊
Last week: 485 $BTC bought ($33.4M) vs $228M spent on STRC preferred buybacks. Nearly 7x more went into defending the preferred than into new Bitcoin.
Context:
Holdings: 850,849 BTC
Average cost: $75,452
BTC now: ~$63K, roughly $10B below cost ⚠️
USD reserve: $4.9B
December STRC dividend: 12%
MSTR: $90.32, down 19% on the weekly candle
The chart shows a lower high in autumn followed by a sharp weekly selloff, with the Jul-Aug base now the key support zone.
When average cost sits well above spot, funding obligations matter more than accumulation. STRC holding near its $100 par is the level to watch.
The lesson for traders: leverage amplifies conviction and cost of carry at the same time. Backtest your exposure before you scale it.
Verify first. Risk later. Scale slowly.
#BTC #MSTR
Last week: 485 $BTC bought ($33.4M) vs $228M spent on STRC preferred buybacks. Nearly 7x more went into defending the preferred than into new Bitcoin.
Context:
Holdings: 850,849 BTC
Average cost: $75,452
BTC now: ~$63K, roughly $10B below cost ⚠️
USD reserve: $4.9B
December STRC dividend: 12%
MSTR: $90.32, down 19% on the weekly candle
The chart shows a lower high in autumn followed by a sharp weekly selloff, with the Jul-Aug base now the key support zone.
When average cost sits well above spot, funding obligations matter more than accumulation. STRC holding near its $100 par is the level to watch.
The lesson for traders: leverage amplifies conviction and cost of carry at the same time. Backtest your exposure before you scale it.
Verify first. Risk later. Scale slowly.
#BTC #MSTR
86
$BTC at $64,240: The Level That Matters Now
Bitcoin trades near $64.2K (-0.98% on the day), roughly 26% below the ~$87K lower high set in October and about half below the Oct 2025 peak near $126K.
The key zone on the daily chart is $57K-$60K, where the June and July lows formed. Price sits only 7-10% above it.
📊 Scenario map:
Support holds: sideways range between the high $50Ks and mid $60Ks
Daily close below the zone: higher liquidation risk and a deeper downside leg comes into play
Bounce rejected under ~$87K: lower-high structure remains
No single scenario is confirmed yet. Position sizing and pre-tested strategies matter more than predictions here.
Verify first. Risk later. Scale slowly.
#BTC #Bitcoin
$BTC at $64,240: The Level That Matters Now
Bitcoin trades near $64.2K (-0.98% on the day), roughly 26% below the ~$87K lower high set in October and about half below the Oct 2025 peak near $126K.
The key zone on the daily chart is $57K-$60K, where the June and July lows formed. Price sits only 7-10% above it.
📊 Scenario map:
Support holds: sideways range between the high $50Ks and mid $60Ks
Daily close below the zone: higher liquidation risk and a deeper downside leg comes into play
Bounce rejected under ~$87K: lower-high structure remains
No single scenario is confirmed yet. Position sizing and pre-tested strategies matter more than predictions here.
Verify first. Risk later. Scale slowly.
#BTC #Bitcoin
Bitcoin trades near $64.2K (-0.98% on the day), roughly 26% below the ~$87K lower high set in October and about half below the Oct 2025 peak near $126K.
The key zone on the daily chart is $57K-$60K, where the June and July lows formed. Price sits only 7-10% above it.
📊 Scenario map:
Support holds: sideways range between the high $50Ks and mid $60Ks
Daily close below the zone: higher liquidation risk and a deeper downside leg comes into play
Bounce rejected under ~$87K: lower-high structure remains
No single scenario is confirmed yet. Position sizing and pre-tested strategies matter more than predictions here.
Verify first. Risk later. Scale slowly.
#BTC #Bitcoin
60
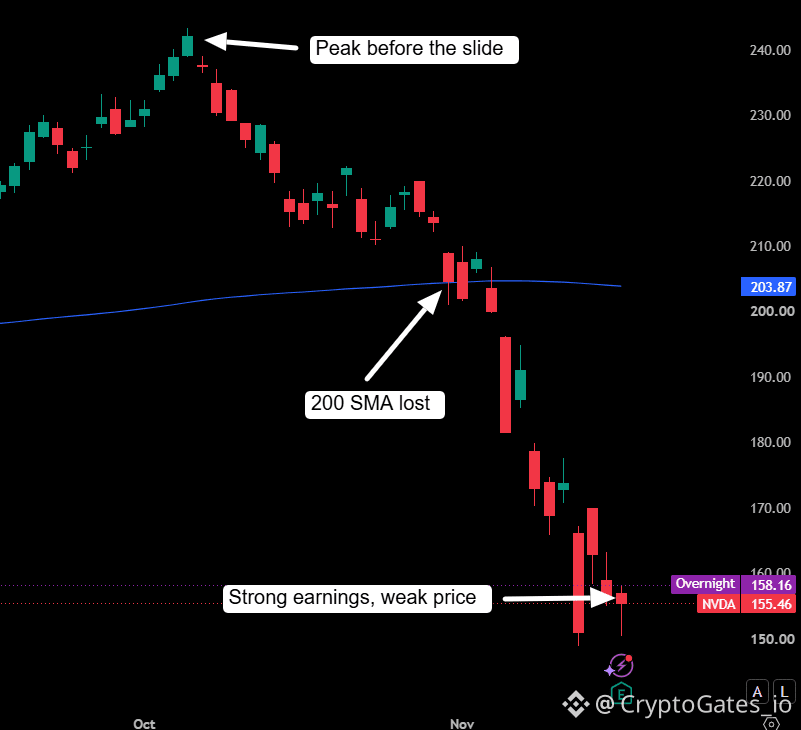
Strong earnings, weak price: what NVDA is telling us 📊
NVIDIA reported $115.8B in quarterly revenue, up 103% YoY. The stock is at 155.46, about 24% below its 200 SMA (203.87), and it lost that level in early November.
Why it matters for crypto: the same disconnect exists in BTC. Institutional access is built, yet price sits roughly 50% below its all-time high near $64K.
Takeaways:
Good news is not the same as a good entry
A reclaimed level is not a confirmed trend change
Scenario planning beats headline trading
Wait for structure. Size small. Let the data confirm before scaling. 🛡️
Verify first. Risk later. Scale slowly.
#BTC #CryptoAnalysis
Strong earnings, weak price: what NVDA is telling us 📊
NVIDIA reported $115.8B in quarterly revenue, up 103% YoY. The stock is at 155.46, about 24% below its 200 SMA (203.87), and it lost that level in early November.
Why it matters for crypto: the same disconnect exists in BTC. Institutional access is built, yet price sits roughly 50% below its all-time high near $64K.
Takeaways:
Good news is not the same as a good entry
A reclaimed level is not a confirmed trend change
Scenario planning beats headline trading
Wait for structure. Size small. Let the data confirm before scaling. 🛡️
Verify first. Risk later. Scale slowly.
#BTC #CryptoAnalysis
NVIDIA reported $115.8B in quarterly revenue, up 103% YoY. The stock is at 155.46, about 24% below its 200 SMA (203.87), and it lost that level in early November.
Why it matters for crypto: the same disconnect exists in BTC. Institutional access is built, yet price sits roughly 50% below its all-time high near $64K.
Takeaways:
Good news is not the same as a good entry
A reclaimed level is not a confirmed trend change
Scenario planning beats headline trading
Wait for structure. Size small. Let the data confirm before scaling. 🛡️
Verify first. Risk later. Scale slowly.
#BTC #CryptoAnalysis
145
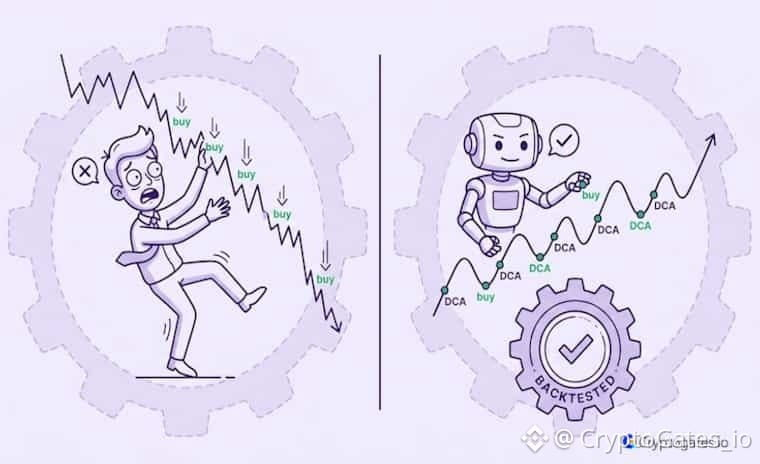
Most traders spend more time picking the coin than setting the DCA parameters. That’s backwards. 📊
Take-profit set too high means the bot never exits and your capital stays locked. Stop-loss set too tight means normal volatility stops you out before DCA works. Too many safety orders for your capital means the bot runs dry mid-position. All three are visible in a backtest before you risk anything.
Backtest your DCA bot first...
(no signup, no credit card)
#CryptoTrading #DCA #Bitcoin
Most traders spend more time picking the coin than setting the DCA parameters. That’s backwards. 📊
Take-profit set too high means the bot never exits and your capital stays locked. Stop-loss set too tight means normal volatility stops you out before DCA works. Too many safety orders for your capital means the bot runs dry mid-position. All three are visible in a backtest before you risk anything.
Backtest your DCA bot first...
(no signup, no credit card)
#CryptoTrading #DCA #Bitcoin
Take-profit set too high means the bot never exits and your capital stays locked. Stop-loss set too tight means normal volatility stops you out before DCA works. Too many safety orders for your capital means the bot runs dry mid-position. All three are visible in a backtest before you risk anything.
Backtest your DCA bot first...
(no signup, no credit card)
#CryptoTrading #DCA #Bitcoin
78
📊 $BTC : Longs Didn’t Blink
BTC dipped to $62K over the weekend and now trades near $64K. Meanwhile, margin longs on a major offshore exchange remain near ~90.9K BTC, around multi-year highs.
📌 What it could mean:
Conviction: large holders treating the dip as an entry
Crowding: if $62K fails, those longs can fuel a liquidation cascade
Both readings are valid. What matters is how this positioning behaves on the next bounce and the next retest.
⚠️ Note: 90.9K is a BTC quantity, not a price level.
A single positioning chart is a signal, not a strategy. Define your scenarios, size your risk, and validate before you act.
Verify first. Risk later. Scale slowly.
#Bitcoin #BTC
📊 $BTC : Longs Didn’t Blink
BTC dipped to $62K over the weekend and now trades near $64K. Meanwhile, margin longs on a major offshore exchange remain near ~90.9K BTC, around multi-year highs.
📌 What it could mean:
Conviction: large holders treating the dip as an entry
Crowding: if $62K fails, those longs can fuel a liquidation cascade
Both readings are valid. What matters is how this positioning behaves on the next bounce and the next retest.
⚠️ Note: 90.9K is a BTC quantity, not a price level.
A single positioning chart is a signal, not a strategy. Define your scenarios, size your risk, and validate before you act.
Verify first. Risk later. Scale slowly.
#Bitcoin #BTC
BTC dipped to $62K over the weekend and now trades near $64K. Meanwhile, margin longs on a major offshore exchange remain near ~90.9K BTC, around multi-year highs.
📌 What it could mean:
Conviction: large holders treating the dip as an entry
Crowding: if $62K fails, those longs can fuel a liquidation cascade
Both readings are valid. What matters is how this positioning behaves on the next bounce and the next retest.
⚠️ Note: 90.9K is a BTC quantity, not a price level.
A single positioning chart is a signal, not a strategy. Define your scenarios, size your risk, and validate before you act.
Verify first. Risk later. Scale slowly.
#Bitcoin #BTC
1
190
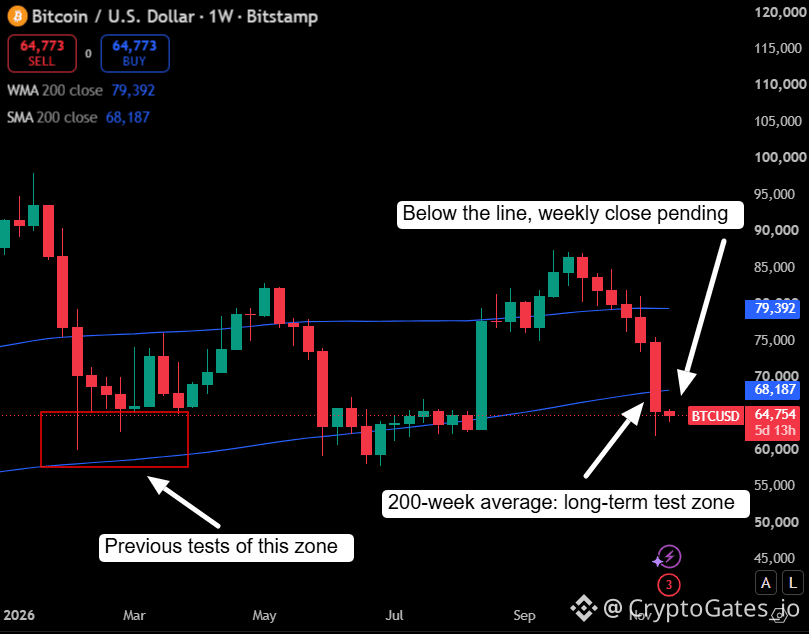
$BTC vs its 200-week average
Price: ~64.7k. 200-week SMA: 68,187. The weekly candle is still open, so this is “below the line”, not a confirmed loss.
Context: ~$2B in weekend liquidations, 7 straight ETF outflow sessions (~$1.9B), and a December hike priced near-certain.
📊 Scenarios: a weekly close above 68k reclaims the zone, a rejection turns it into resistance, and chop in between is also possible.
Systems over speculation. Verify first, risk later.
#BTC #Bitcoin
$BTC vs its 200-week average
Price: ~64.7k. 200-week SMA: 68,187. The weekly candle is still open, so this is “below the line”, not a confirmed loss.
Context: ~$2B in weekend liquidations, 7 straight ETF outflow sessions (~$1.9B), and a December hike priced near-certain.
📊 Scenarios: a weekly close above 68k reclaims the zone, a rejection turns it into resistance, and chop in between is also possible.
Systems over speculation. Verify first, risk later.
#BTC #Bitcoin
Price: ~64.7k. 200-week SMA: 68,187. The weekly candle is still open, so this is “below the line”, not a confirmed loss.
Context: ~$2B in weekend liquidations, 7 straight ETF outflow sessions (~$1.9B), and a December hike priced near-certain.
📊 Scenarios: a weekly close above 68k reclaims the zone, a rejection turns it into resistance, and chop in between is also possible.
Systems over speculation. Verify first, risk later.
#BTC #Bitcoin
46
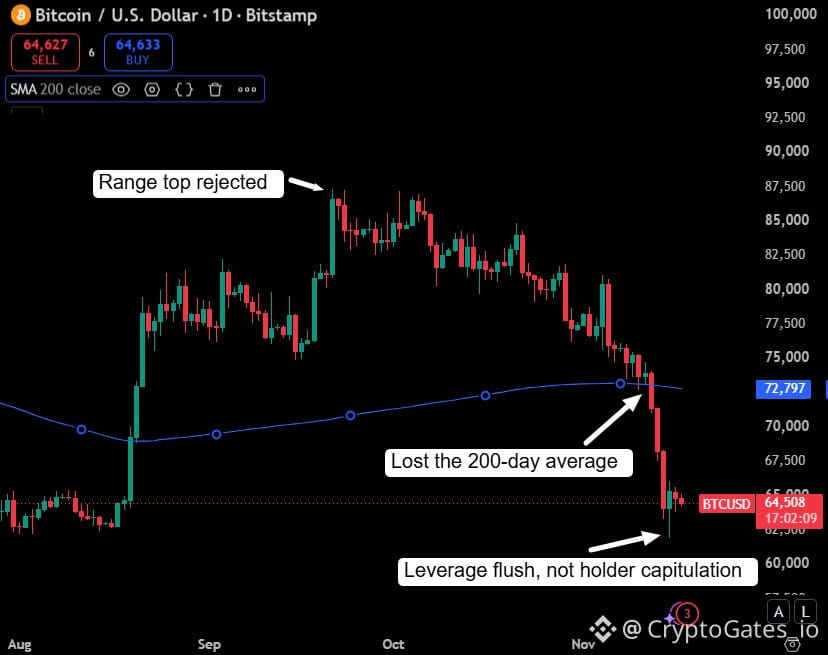
$BTC bounced from a four-month low near 62K, but the structure still needs work 📉
Weekend liquidations reached roughly $2B, mostly long positions, and open interest dropped sharply. That points to a leverage flush. The rebound has been driven largely by short covering, not a clear rise in spot demand.
Key reads:
Daily close near 64.5K, still below the 200-day average around 72.8K
US spot ETFs saw about $1.07B in net outflows last week, 7 straight days
Net loss realization is at its highest since mid-July, but not yet at the extreme seen at prior cycle lows
Scenario map:
✅ 62K holds and ETF flows stabilize: relief toward the 200-day is possible, but a reclaim still needs a confirmed retest
⚠️ 62K breaks: the June low zone (roughly 58K to 60K) comes into focus
A bounce is not a bottom. The cleanest confirmation would be ETF inflows returning on real volume. Until then, size positions for volatility, not for a call.
Verify first. Risk later. Scale slowly.
#BTC #Bitcoin
$BTC bounced from a four-month low near 62K, but the structure still needs work 📉
Weekend liquidations reached roughly $2B, mostly long positions, and open interest dropped sharply. That points to a leverage flush. The rebound has been driven largely by short covering, not a clear rise in spot demand.
Key reads:
Daily close near 64.5K, still below the 200-day average around 72.8K
US spot ETFs saw about $1.07B in net outflows last week, 7 straight days
Net loss realization is at its highest since mid-July, but not yet at the extreme seen at prior cycle lows
Scenario map:
✅ 62K holds and ETF flows stabilize: relief toward the 200-day is possible, but a reclaim still needs a confirmed retest
⚠️ 62K breaks: the June low zone (roughly 58K to 60K) comes into focus
A bounce is not a bottom. The cleanest confirmation would be ETF inflows returning on real volume. Until then, size positions for volatility, not for a call.
Verify first. Risk later. Scale slowly.
#BTC #Bitcoin
Weekend liquidations reached roughly $2B, mostly long positions, and open interest dropped sharply. That points to a leverage flush. The rebound has been driven largely by short covering, not a clear rise in spot demand.
Key reads:
Daily close near 64.5K, still below the 200-day average around 72.8K
US spot ETFs saw about $1.07B in net outflows last week, 7 straight days
Net loss realization is at its highest since mid-July, but not yet at the extreme seen at prior cycle lows
Scenario map:
✅ 62K holds and ETF flows stabilize: relief toward the 200-day is possible, but a reclaim still needs a confirmed retest
⚠️ 62K breaks: the June low zone (roughly 58K to 60K) comes into focus
A bounce is not a bottom. The cleanest confirmation would be ETF inflows returning on real volume. Until then, size positions for volatility, not for a call.
Verify first. Risk later. Scale slowly.
#BTC #Bitcoin
19
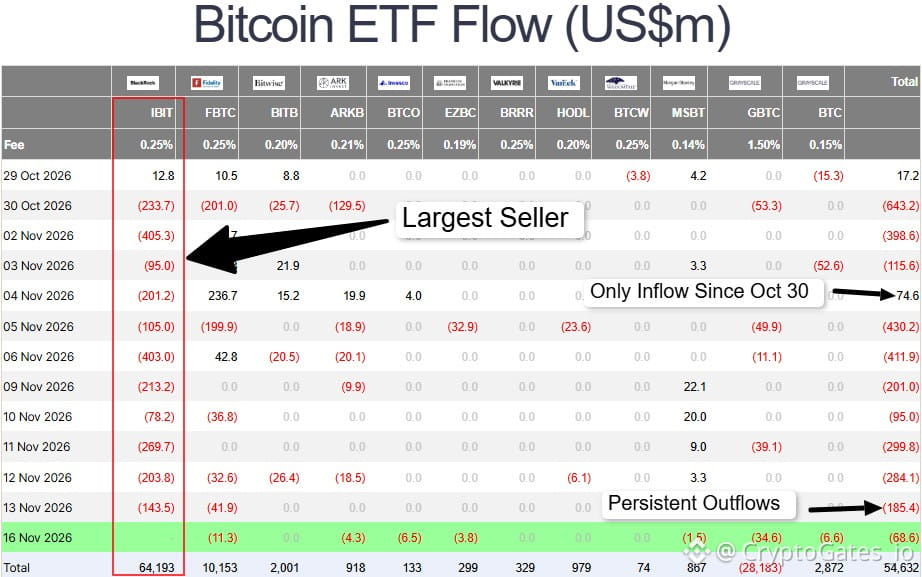
Spot $BTC ETFs: 11 Red Sessions Out of 12
From 30 Oct to 16 Nov, daily net flows were negative in 11 of 12 sessions. The only inflow came on 4 Nov (+$74.6M). 💸 Cumulative net outflow over the window exceeds $3B.
BTC is still holding around $65K, so this is not a panic exit. It is a steady absence of fresh institutional demand.
Scenario map:
Outflows fade: price can stabilize without extra support
Outflows persist while price chops: dips rely on spot and leverage alone, and liquidity can thin out quickly
ETF flows lag demand and are not a timing tool. Check funding, open interest and price reaction at key levels before increasing exposure.
Verify first. Risk later. Scale slowly.
#BitcoinETF #BTC
Spot $BTC ETFs: 11 Red Sessions Out of 12
From 30 Oct to 16 Nov, daily net flows were negative in 11 of 12 sessions. The only inflow came on 4 Nov (+$74.6M). 💸 Cumulative net outflow over the window exceeds $3B.
BTC is still holding around $65K, so this is not a panic exit. It is a steady absence of fresh institutional demand.
Scenario map:
Outflows fade: price can stabilize without extra support
Outflows persist while price chops: dips rely on spot and leverage alone, and liquidity can thin out quickly
ETF flows lag demand and are not a timing tool. Check funding, open interest and price reaction at key levels before increasing exposure.
Verify first. Risk later. Scale slowly.
#BitcoinETF #BTC
From 30 Oct to 16 Nov, daily net flows were negative in 11 of 12 sessions. The only inflow came on 4 Nov (+$74.6M). 💸 Cumulative net outflow over the window exceeds $3B.
BTC is still holding around $65K, so this is not a panic exit. It is a steady absence of fresh institutional demand.
Scenario map:
Outflows fade: price can stabilize without extra support
Outflows persist while price chops: dips rely on spot and leverage alone, and liquidity can thin out quickly
ETF flows lag demand and are not a timing tool. Check funding, open interest and price reaction at key levels before increasing exposure.
Verify first. Risk later. Scale slowly.
#BitcoinETF #BTC
BTC+3.94%
IBITETF-4.95%
32
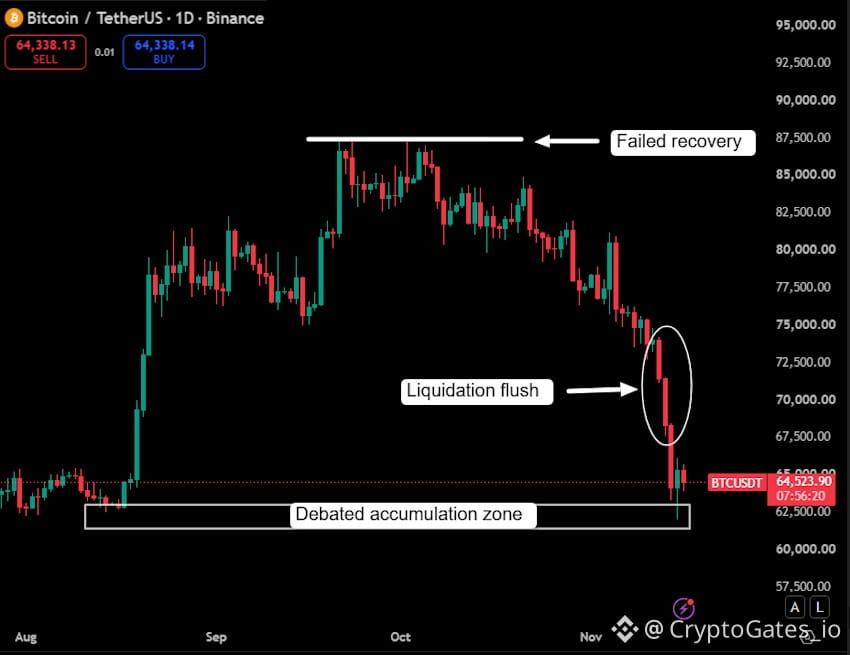
$BTC at 64.5K 📉 What the daily chart is saying
BTC is trading near 64.5K, down 1.27% on the day, and back in the old summer range after a sharp drop from the high 80s.
The recovery attempt failed, and the fast flush brought price right into a zone many traders now call accumulation. Here is the catch: a reclaim of a level is not a confirmed retest.
Three scenarios to track 📊
Zone holds: base building, slow chop
Sweep and reclaim: a liquidity grab before any real move
Clean loss: the next leg lower opens up
Risk management is the edge here. Scale in with DCA tranches instead of one entry, and define your invalidation before you click buy.
Verify first. Risk later. Scale slowly.
#BTC #CryptoAnalysis
$BTC at 64.5K 📉 What the daily chart is saying
BTC is trading near 64.5K, down 1.27% on the day, and back in the old summer range after a sharp drop from the high 80s.
The recovery attempt failed, and the fast flush brought price right into a zone many traders now call accumulation. Here is the catch: a reclaim of a level is not a confirmed retest.
Three scenarios to track 📊
Zone holds: base building, slow chop
Sweep and reclaim: a liquidity grab before any real move
Clean loss: the next leg lower opens up
Risk management is the edge here. Scale in with DCA tranches instead of one entry, and define your invalidation before you click buy.
Verify first. Risk later. Scale slowly.
#BTC #CryptoAnalysis
BTC is trading near 64.5K, down 1.27% on the day, and back in the old summer range after a sharp drop from the high 80s.
The recovery attempt failed, and the fast flush brought price right into a zone many traders now call accumulation. Here is the catch: a reclaim of a level is not a confirmed retest.
Three scenarios to track 📊
Zone holds: base building, slow chop
Sweep and reclaim: a liquidity grab before any real move
Clean loss: the next leg lower opens up
Risk management is the edge here. Scale in with DCA tranches instead of one entry, and define your invalidation before you click buy.
Verify first. Risk later. Scale slowly.
#BTC #CryptoAnalysis
55
$BTC Bounced From 62k. Is It The Bottom? 📉
BTC is trading near 65k after a weekend wick to about 62k. ETH sits at 1,821.
The price is only half the story. US spot Bitcoin ETFs have seen about $2.35B in net outflows since Nov 2, and IBIT has recorded outflows for 11 straight sessions. Outflows have slowed over the last 3 sessions, but they have not turned positive.
The weekend drop also happened while ETF markets were closed, which points to thin spot and perp liquidity as the driver, not fund selling.
How I’d map it:
✅ 62k holds and ETF flows stabilize: base-building
⚠️ 62k holds but outflows continue: sideways bleed
❌ 62k breaks with weekday volume: lower levels come into play
If you plan to accumulate, split entries and set your invalidation before you click buy. A strategy you backtested beats a call you saw online.
Verify first. Risk later. Scale slowly.
Not financial advice.
#BTC #Bitcoin #CryptoMarket
$BTC Bounced From 62k. Is It The Bottom? 📉
BTC is trading near 65k after a weekend wick to about 62k. ETH sits at 1,821.
The price is only half the story. US spot Bitcoin ETFs have seen about $2.35B in net outflows since Nov 2, and IBIT has recorded outflows for 11 straight sessions. Outflows have slowed over the last 3 sessions, but they have not turned positive.
The weekend drop also happened while ETF markets were closed, which points to thin spot and perp liquidity as the driver, not fund selling.
How I’d map it:
✅ 62k holds and ETF flows stabilize: base-building
⚠️ 62k holds but outflows continue: sideways bleed
❌ 62k breaks with weekday volume: lower levels come into play
If you plan to accumulate, split entries and set your invalidation before you click buy. A strategy you backtested beats a call you saw online.
Verify first. Risk later. Scale slowly.
Not financial advice.
#BTC #Bitcoin #CryptoMarket
BTC is trading near 65k after a weekend wick to about 62k. ETH sits at 1,821.
The price is only half the story. US spot Bitcoin ETFs have seen about $2.35B in net outflows since Nov 2, and IBIT has recorded outflows for 11 straight sessions. Outflows have slowed over the last 3 sessions, but they have not turned positive.
The weekend drop also happened while ETF markets were closed, which points to thin spot and perp liquidity as the driver, not fund selling.
How I’d map it:
✅ 62k holds and ETF flows stabilize: base-building
⚠️ 62k holds but outflows continue: sideways bleed
❌ 62k breaks with weekday volume: lower levels come into play
If you plan to accumulate, split entries and set your invalidation before you click buy. A strategy you backtested beats a call you saw online.
Verify first. Risk later. Scale slowly.
Not financial advice.
#BTC #Bitcoin #CryptoMarket
67
Q3 2026 was a big one: $ETH +70.8% (its best Q3 ever) and BTC +42.71% (the second-best Q3 since 2013). BTC moved from about $58.5K to near $84K in three months 📊
Green portfolios feel like skill. That is exactly the risk.
Here is what strong quarters tend to do to beginners:
They buy late because of FOMO
They add leverage because recent wins felt easy
They never plan an exit
Quick survival checklist:
Write your exit plan and position size before buying, not after a big green candle
Test your strategy on past data, including quarters when the market dropped hard
Never raise your risk just because the last few weeks felt easy
This is not a crash call. A big quarter tells you the wave was big, not when it ends.
Backtest before you deploy...
#Bitcoin #CryptoTrading #Ethereum
Q3 2026 was a big one: $ETH +70.8% (its best Q3 ever) and BTC +42.71% (the second-best Q3 since 2013). BTC moved from about $58.5K to near $84K in three months 📊
Green portfolios feel like skill. That is exactly the risk.
Here is what strong quarters tend to do to beginners:
They buy late because of FOMO
They add leverage because recent wins felt easy
They never plan an exit
Quick survival checklist:
Write your exit plan and position size before buying, not after a big green candle
Test your strategy on past data, including quarters when the market dropped hard
Never raise your risk just because the last few weeks felt easy
This is not a crash call. A big quarter tells you the wave was big, not when it ends.
Backtest before you deploy...
#Bitcoin #CryptoTrading #Ethereum
Green portfolios feel like skill. That is exactly the risk.
Here is what strong quarters tend to do to beginners:
They buy late because of FOMO
They add leverage because recent wins felt easy
They never plan an exit
Quick survival checklist:
Write your exit plan and position size before buying, not after a big green candle
Test your strategy on past data, including quarters when the market dropped hard
Never raise your risk just because the last few weeks felt easy
This is not a crash call. A big quarter tells you the wave was big, not when it ends.
Backtest before you deploy...
#Bitcoin #CryptoTrading #Ethereum

81
Log in to explore more content
Join global crypto users on Binance Square
⚡️ Get latest and useful information about crypto.
💬 Trusted by the world’s largest crypto exchange.
👍 Discover real insights from verified creators.
Email / Phone number
Trending Topics
BTCReboundsAbove$60KAmidWhaleDipBuying
8,712 views
84 Discussing
Abraxas Capital, Other Whales Buy the BTC Dip as Bitcoin Briefly Reclaims $60,000
Binance News
·18 Likes
·21.8k views
SolanaSets2027RoadmapToDoubleComputeCapacity
1 views
17 Discussing
CaliforniaNvidiaProbeExaminesPotentialCriminalViolations
683 views
17 Discussing