
#now
now
98,134 views
672 Discussing
Hot
Latest


·
--
Bullish
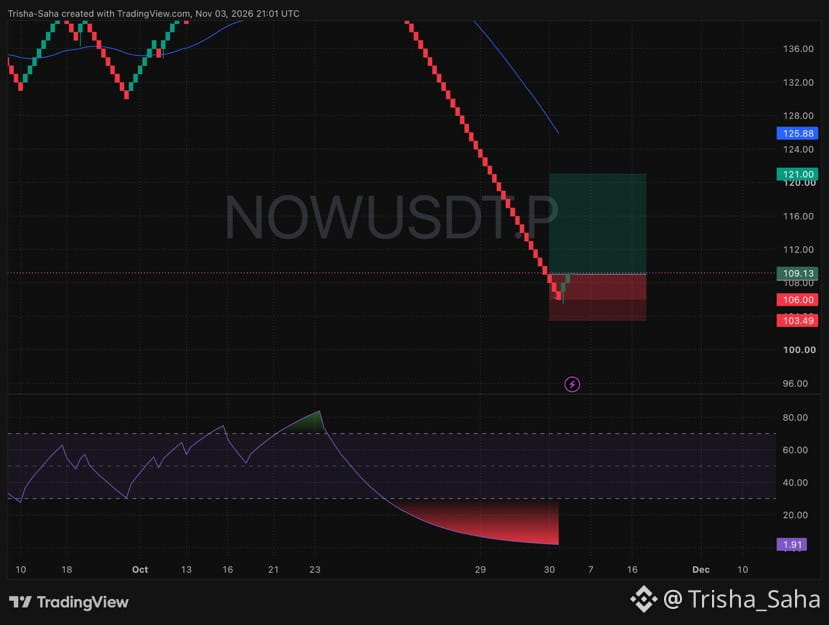
🔥 $NOW is slamming hard into a major accumulation zone and gearing up for a violent bounce! 🚀
📍 Trade Setup:
• Entry Zone: $107.50 – $109.13
• Stop Loss: $103.49
• Target: $121.00
📌 Chart Analysis:
• Sellers completely ran out of fuel around the $103.49 support floor after a heavy plunge.
• Fresh green candles are printing back up instantly as bulls seize full control of momentum.
• Indicator lines are curling sharply upward from deeply oversold levels, signaling a massive trend flip is locked in.
🛡️ Capital Protection:
Lock down your risk by sliding your Stop Loss straight to Break-Even the moment this trade hits +3% to +4% profit.
I'm already positioned and locked in. Are you catching this rebound or watching it fly without you? Drop a ⚡ below! 👇
#NOW #NOWUSDT #BinanceSquare #CryptoTrading
{future}(NOWUSDT)
🔥 $NOW is slamming hard into a major accumulation zone and gearing up for a violent bounce! 🚀
📍 Trade Setup:
• Entry Zone: $107.50 – $109.13
• Stop Loss: $103.49
• Target: $121.00
📌 Chart Analysis:
• Sellers completely ran out of fuel around the $103.49 support floor after a heavy plunge.
• Fresh green candles are printing back up instantly as bulls seize full control of momentum.
• Indicator lines are curling sharply upward from deeply oversold levels, signaling a massive trend flip is locked in.
🛡️ Capital Protection:
Lock down your risk by sliding your Stop Loss straight to Break-Even the moment this trade hits +3% to +4% profit.
I'm already positioned and locked in. Are you catching this rebound or watching it fly without you? Drop a ⚡ below! 👇
#NOW #NOWUSDT #BinanceSquare #CryptoTrading
📍 Trade Setup:
• Entry Zone: $107.50 – $109.13
• Stop Loss: $103.49
• Target: $121.00
📌 Chart Analysis:
• Sellers completely ran out of fuel around the $103.49 support floor after a heavy plunge.
• Fresh green candles are printing back up instantly as bulls seize full control of momentum.
• Indicator lines are curling sharply upward from deeply oversold levels, signaling a massive trend flip is locked in.
🛡️ Capital Protection:
Lock down your risk by sliding your Stop Loss straight to Break-Even the moment this trade hits +3% to +4% profit.
I'm already positioned and locked in. Are you catching this rebound or watching it fly without you? Drop a ⚡ below! 👇
#NOW #NOWUSDT #BinanceSquare #CryptoTrading
217
Verified
$NOW -27% — Service Now crashes after Q3 2026
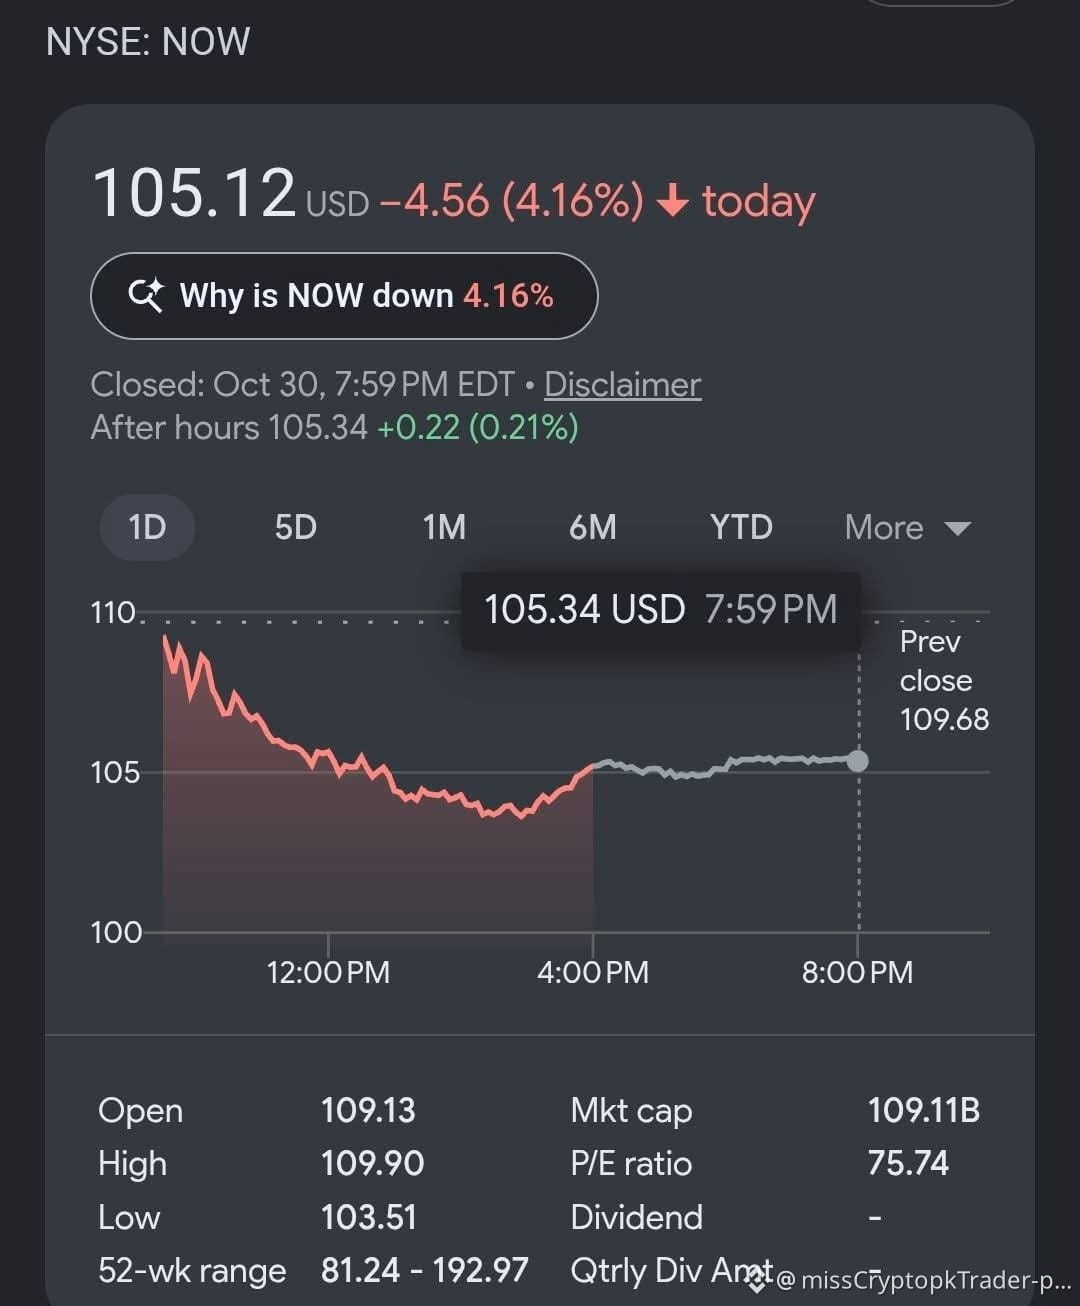
Revenue +20.5% to $4.11B, AI ACV target raised to $1.7B, but stock hit 105.12 (-4.16%) today on backlog & valuation fears.
Buying dip or warning for SaaS?
#NOW #ServiceNow #AI #Binance
$NOW -27% — Service Now crashes after Q3 2026
Revenue +20.5% to $4.11B, AI ACV target raised to $1.7B, but stock hit 105.12 (-4.16%) today on backlog & valuation fears.
Buying dip or warning for SaaS?
#NOW #ServiceNow #AI #Binance
Revenue +20.5% to $4.11B, AI ACV target raised to $1.7B, but stock hit 105.12 (-4.16%) today on backlog & valuation fears.
Buying dip or warning for SaaS?
#NOW #ServiceNow #AI #Binance
2
425

·
--

Article
The first domino in SaaS: AI panic topples $NOWIn the last week of October (the 26th–30th), SaaS leader ServiceNow fell 45%, plunging 27% in a single day after its earnings report—the biggest one-day drop since it went public. Everyone online was shouting “SaaSpocalypse” (the end of SaaS). What actually happened?
First, the earnings report itself really wasn't that bad:
☆ Revenue of $4.11 billion, up 20.5%, beating expectations.
☆ Renewal rate of 98%, among the best in the industry.
☆ New AI contracts up 65%; million-dollar AI deals were 4.5 times last year's total.
☆ Earnings per share of $1.00, just two cents shy of Wall Street's $1.02 estimate.
So where did that -27% come from?
★ Full-year guidance of $15.78 billion vs. Wall Street's expectation of $16.22 billion—a shortfall of over $400 million, not just a little miss.
The first domino in SaaS: AI panic topples $NOW
In the last week of October (the 26th–30th), SaaS leader ServiceNow fell 45%, plunging 27% in a single day after its earnings report—the biggest one-day drop since it went public. Everyone online was shouting “SaaSpocalypse” (the end of SaaS). What actually happened?
First, the earnings report itself really wasn't that bad:
☆ Revenue of $4.11 billion, up 20.5%, beating expectations.
☆ Renewal rate of 98%, among the best in the industry.
☆ New AI contracts up 65%; million-dollar AI deals were 4.5 times last year's total.
☆ Earnings per share of $1.00, just two cents shy of Wall Street's $1.02 estimate.
So where did that -27% come from?
★ Full-year guidance of $15.78 billion vs. Wall Street's expectation of $16.22 billion—a shortfall of over $400 million, not just a little miss.
First, the earnings report itself really wasn't that bad:
☆ Revenue of $4.11 billion, up 20.5%, beating expectations.
☆ Renewal rate of 98%, among the best in the industry.
☆ New AI contracts up 65%; million-dollar AI deals were 4.5 times last year's total.
☆ Earnings per share of $1.00, just two cents shy of Wall Street's $1.02 estimate.
So where did that -27% come from?
★ Full-year guidance of $15.78 billion vs. Wall Street's expectation of $16.22 billion—a shortfall of over $400 million, not just a little miss.
314

·
--
Keeping a close eye on $NOW as it enters our buy window. The trade plan is clear, parameters are set, and risk is strictly defined.
⚡ $NOW — LONG SETUP
📍 Entry: 108.52 – 109.18
🎯 TP1: 110.5
🎯 TP2: 111.37
🎯 TP3: 112.69
🛑 Stop Loss: 107.87
Trade here 👇
📌 Trade management rules: see pinned post.
What’s your outlook on $NOW for this move? Follow along for more structured trade setups!
#NOW #bnb
Keeping a close eye on $NOW as it enters our buy window. The trade plan is clear, parameters are set, and risk is strictly defined.
⚡ $NOW — LONG SETUP
📍 Entry: 108.52 – 109.18
🎯 TP1: 110.5
🎯 TP2: 111.37
🎯 TP3: 112.69
🛑 Stop Loss: 107.87
Trade here 👇
📌 Trade management rules: see pinned post.
What’s your outlook on $NOW for this move? Follow along for more structured trade setups!
#NOW #bnb
⚡ $NOW — LONG SETUP
📍 Entry: 108.52 – 109.18
🎯 TP1: 110.5
🎯 TP2: 111.37
🎯 TP3: 112.69
🛑 Stop Loss: 107.87
Trade here 👇
📌 Trade management rules: see pinned post.
What’s your outlook on $NOW for this move? Follow along for more structured trade setups!
#NOW #bnb
1
49

·
--
$NOW Daily-Chart Bearish Alert 🔥
════════════════════
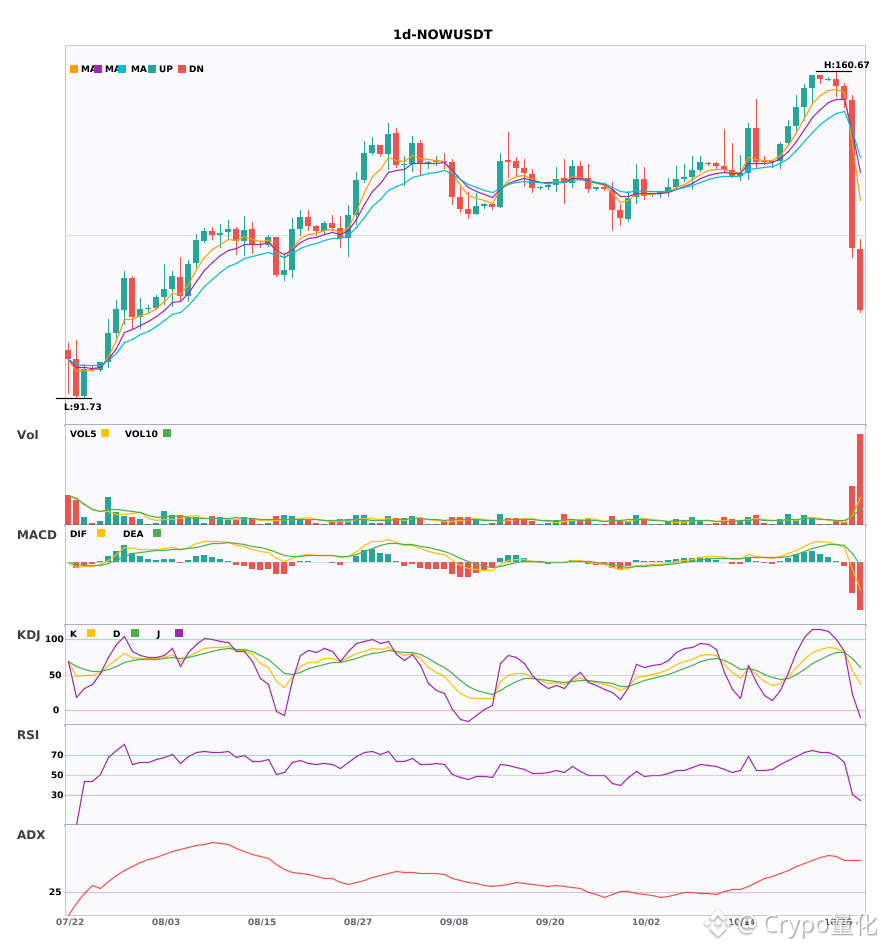
🟢 $NOW Daily-Chart Bearish Signal
⚠️ Technicals: ADX (62) indicates a very strong trend (beware of an overheated pullback) | MACD DIF falls below the zero line, signaling a bearish trend | EMA5 crosses below EMA8, turning bearish in the short term | KDJ death cross, bearish in the short term (K: 56.1, D: 72.9) | Volume surge (4.6x)
════════════════════
🔔 Follow for first-hand market updates 🔔
#技术分析 #NOW
📌 When trading, pay attention to whether the candlestick patterns confirm
$NOW Daily-Chart Bearish Alert 🔥
════════════════════
🟢 $NOW Daily-Chart Bearish Signal
⚠️ Technicals: ADX (62) indicates a very strong trend (beware of an overheated pullback) | MACD DIF falls below the zero line, signaling a bearish trend | EMA5 crosses below EMA8, turning bearish in the short term | KDJ death cross, bearish in the short term (K: 56.1, D: 72.9) | Volume surge (4.6x)
════════════════════
🔔 Follow for first-hand market updates 🔔
#技术分析 #NOW
📌 When trading, pay attention to whether the candlestick patterns confirm
════════════════════
🟢 $NOW Daily-Chart Bearish Signal
⚠️ Technicals: ADX (62) indicates a very strong trend (beware of an overheated pullback) | MACD DIF falls below the zero line, signaling a bearish trend | EMA5 crosses below EMA8, turning bearish in the short term | KDJ death cross, bearish in the short term (K: 56.1, D: 72.9) | Volume surge (4.6x)
════════════════════
🔔 Follow for first-hand market updates 🔔
#技术分析 #NOW
📌 When trading, pay attention to whether the candlestick patterns confirm
12

·
--
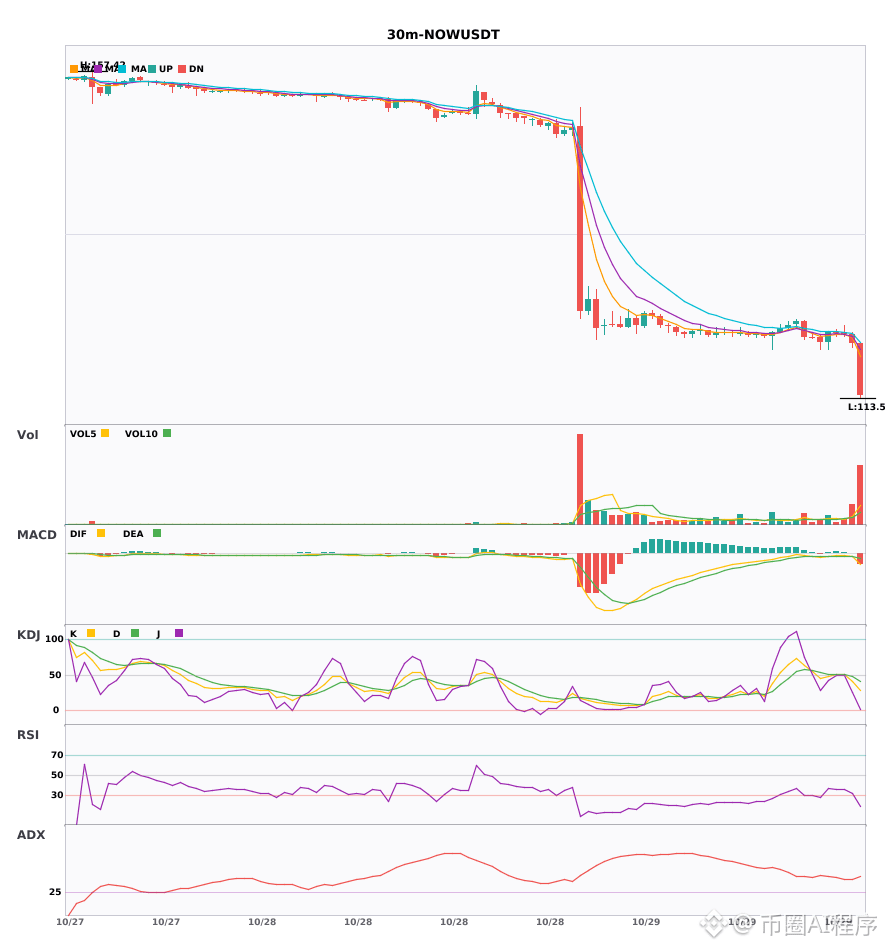
$NOW 30 30-minute bearish + 4-hour bearish alignment; multi-timeframe resonance—trade with the trend 🔥
════════════════════
🟢 $NOW 30 30-minute bearish signal
⚠️ Technical analysis: 4-hour bearish resonance confirmed | 30-minute entry: MACD bearish crossover below zero, bearish momentum accelerating | EMA5 < EMA8 < EMA13, bearish alignment | KDJ trending weakly, bears in control (K is 40.2, D is 47.3) | Volume spike (2.9x)
════════════════════
🔔 Follow to get first-hand market updates 🔔
#多周期共振 #NOW
📌 When trading, pay attention to whether the candlestick patterns align
$NOW 30 30-minute bearish + 4-hour bearish alignment; multi-timeframe resonance—trade with the trend 🔥
════════════════════
🟢 $NOW 30 30-minute bearish signal
⚠️ Technical analysis: 4-hour bearish resonance confirmed | 30-minute entry: MACD bearish crossover below zero, bearish momentum accelerating | EMA5 < EMA8 < EMA13, bearish alignment | KDJ trending weakly, bears in control (K is 40.2, D is 47.3) | Volume spike (2.9x)
════════════════════
🔔 Follow to get first-hand market updates 🔔
#多周期共振 #NOW
📌 When trading, pay attention to whether the candlestick patterns align
════════════════════
🟢 $NOW 30 30-minute bearish signal
⚠️ Technical analysis: 4-hour bearish resonance confirmed | 30-minute entry: MACD bearish crossover below zero, bearish momentum accelerating | EMA5 < EMA8 < EMA13, bearish alignment | KDJ trending weakly, bears in control (K is 40.2, D is 47.3) | Volume spike (2.9x)
════════════════════
🔔 Follow to get first-hand market updates 🔔
#多周期共振 #NOW
📌 When trading, pay attention to whether the candlestick patterns align
17

·
--
Bullish
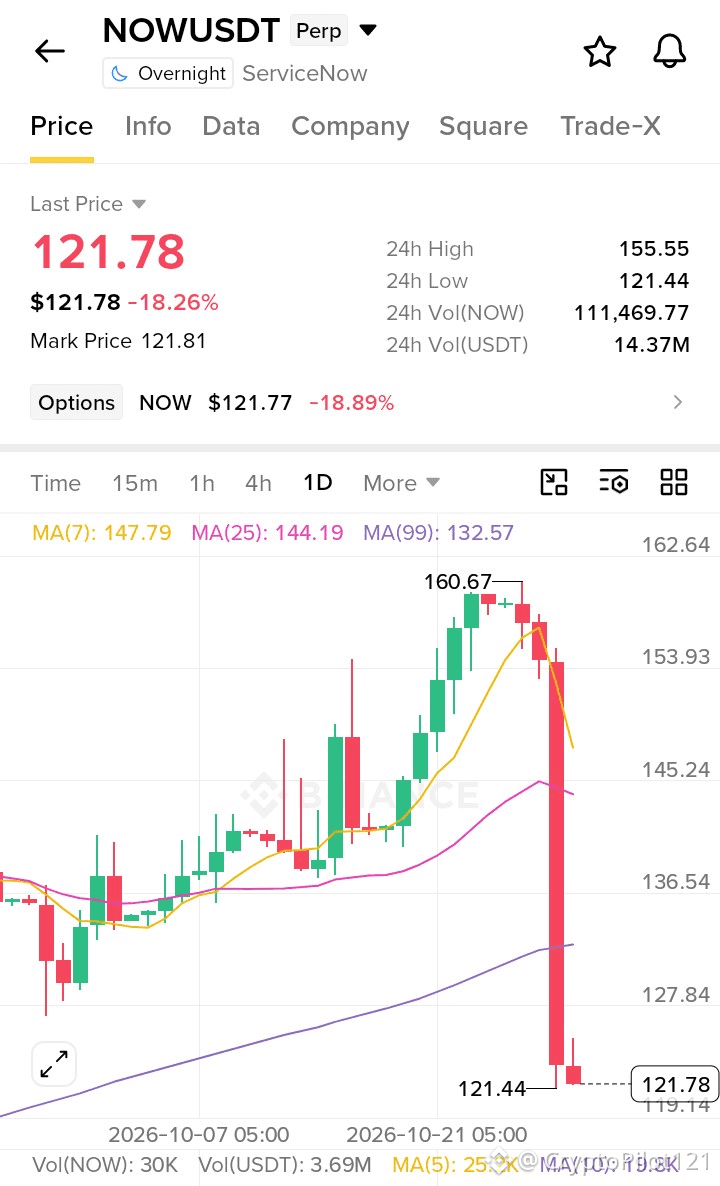
🔻 $NOW USDT Perp – Short Setup
Entry Zone: 121.78 – 125.00
Target 1: 119.14 (near support)
Target 2: 110.00
Stop Loss: 130.00
Why Short?
· Massive bearish engulfing candle breaking down from the 160.67 high
· Downtrend at -18.26%
· Price collapsing through MA(7): 147.79, MA(25): 144.19, and MA(99): 132.57 with heavy selling volume, confirming a strong trend reversal
Key Levels:
🔴 Resistance: 130.00
🟢 Support: 119.14 → 110.00
#NOW #Trading #ShortSignal #Crypto #Binance
$NOW
{future}(NOWUSDT)
🔻 $NOW USDT Perp – Short Setup
Entry Zone: 121.78 – 125.00
Target 1: 119.14 (near support)
Target 2: 110.00
Stop Loss: 130.00
Why Short?
· Massive bearish engulfing candle breaking down from the 160.67 high
· Downtrend at -18.26%
· Price collapsing through MA(7): 147.79, MA(25): 144.19, and MA(99): 132.57 with heavy selling volume, confirming a strong trend reversal
Key Levels:
🔴 Resistance: 130.00
🟢 Support: 119.14 → 110.00
#NOW #Trading #ShortSignal #Crypto #Binance
$NOW
Entry Zone: 121.78 – 125.00
Target 1: 119.14 (near support)
Target 2: 110.00
Stop Loss: 130.00
Why Short?
· Massive bearish engulfing candle breaking down from the 160.67 high
· Downtrend at -18.26%
· Price collapsing through MA(7): 147.79, MA(25): 144.19, and MA(99): 132.57 with heavy selling volume, confirming a strong trend reversal
Key Levels:
🔴 Resistance: 130.00
🟢 Support: 119.14 → 110.00
#NOW #Trading #ShortSignal #Crypto #Binance
$NOW
50

·
--
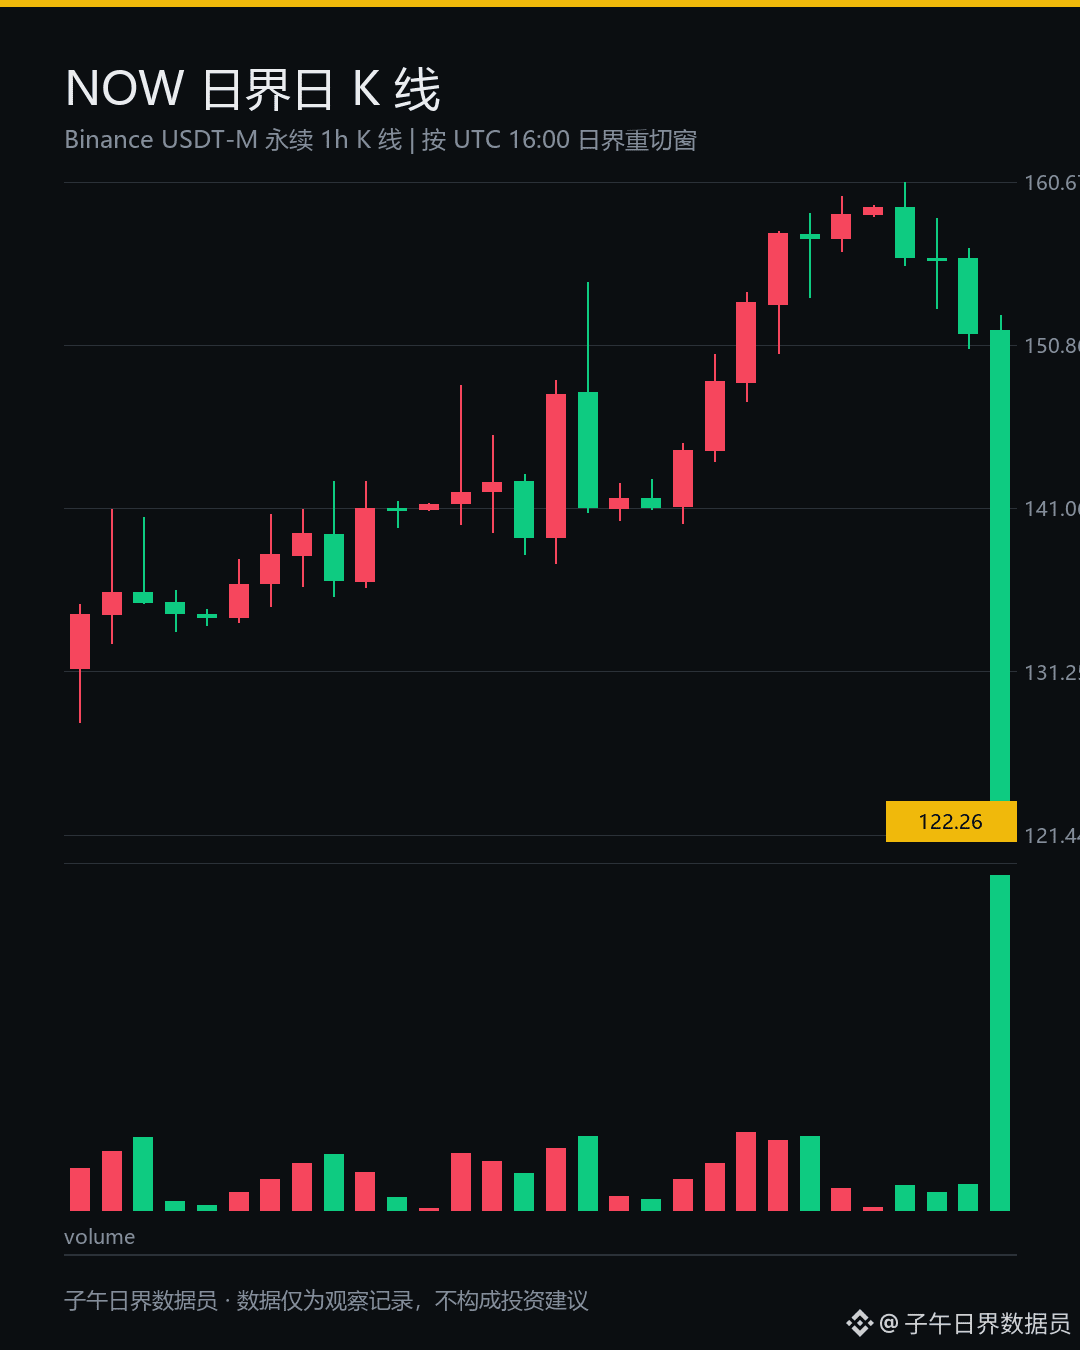
Everyone, in this rotation, NOWUSDT is the one that’s been drained the most.
Down 20.668% in 24 hours, with the price at 122.41—right on the floor of its 20-day range.
At the 0.0th percentile, it hasn’t lifted its head all day.
At this level, I wouldn’t rush to call it cheap.
Trading volume was 0.89M in the previous 24 hours, and 12.16M over the past 24 hours—that’s 13.6 times higher, yet the price still couldn’t hold its ground.
There’s no cushion beneath the floor.
That multiple tells us the tokens are changing hands, not that supply is running short.
The real detail is the funding rate: positive 0.0505%. Longs are still paying shorts.
In my view, it’s not shorts getting squeezed; longs are the ones giving way, and support is being stripped away layer by layer.
Among the same batch, CAPUSDT is down 25.897% and DOSUSDT is down 16.966%.
GRASSUSDT is down 14.345%. It’s the same pot, but those closest to the fire are the first to go hungry.
Prices collapse wherever liquidity migrates. That hasn’t changed.
What do you all think of this one? Let’s talk in the comments.
At first glance, I thought I’d read it wrong. I checked twice before believing it had really plunged to a new 20-day low. Just keep an eye on it, everyone.
$NOW $CAP $DOS
#NOW #比特币 #Crypto
The above is a record of my personal trading system and observations of data, and does not constitute investment advice.
Everyone, in this rotation, NOWUSDT is the one that’s been drained the most.
Down 20.668% in 24 hours, with the price at 122.41—right on the floor of its 20-day range.
At the 0.0th percentile, it hasn’t lifted its head all day.
At this level, I wouldn’t rush to call it cheap.
Trading volume was 0.89M in the previous 24 hours, and 12.16M over the past 24 hours—that’s 13.6 times higher, yet the price still couldn’t hold its ground.
There’s no cushion beneath the floor.
That multiple tells us the tokens are changing hands, not that supply is running short.
The real detail is the funding rate: positive 0.0505%. Longs are still paying shorts.
In my view, it’s not shorts getting squeezed; longs are the ones giving way, and support is being stripped away layer by layer.
Among the same batch, CAPUSDT is down 25.897% and DOSUSDT is down 16.966%.
GRASSUSDT is down 14.345%. It’s the same pot, but those closest to the fire are the first to go hungry.
Prices collapse wherever liquidity migrates. That hasn’t changed.
What do you all think of this one? Let’s talk in the comments.
At first glance, I thought I’d read it wrong. I checked twice before believing it had really plunged to a new 20-day low. Just keep an eye on it, everyone.
$NOW $CAP $DOS
#NOW #比特币 #Crypto
The above is a record of my personal trading system and observations of data, and does not constitute investment advice.
Down 20.668% in 24 hours, with the price at 122.41—right on the floor of its 20-day range.
At the 0.0th percentile, it hasn’t lifted its head all day.
At this level, I wouldn’t rush to call it cheap.
Trading volume was 0.89M in the previous 24 hours, and 12.16M over the past 24 hours—that’s 13.6 times higher, yet the price still couldn’t hold its ground.
There’s no cushion beneath the floor.
That multiple tells us the tokens are changing hands, not that supply is running short.
The real detail is the funding rate: positive 0.0505%. Longs are still paying shorts.
In my view, it’s not shorts getting squeezed; longs are the ones giving way, and support is being stripped away layer by layer.
Among the same batch, CAPUSDT is down 25.897% and DOSUSDT is down 16.966%.
GRASSUSDT is down 14.345%. It’s the same pot, but those closest to the fire are the first to go hungry.
Prices collapse wherever liquidity migrates. That hasn’t changed.
What do you all think of this one? Let’s talk in the comments.
At first glance, I thought I’d read it wrong. I checked twice before believing it had really plunged to a new 20-day low. Just keep an eye on it, everyone.
$NOW $CAP $DOS
#NOW #比特币 #Crypto
The above is a record of my personal trading system and observations of data, and does not constitute investment advice.
1
75

·
--
NOW Binance TradFi Perpetual (traditional finance), closed at 04:15 Beijing time on 2026-10-29, down 12.54% over 5m. At 04:15:01 Beijing time on 2026-10-29, the observed price was 129.33, 24h turnover was 4.8386 million, price was below VWAP 140.6781, and RSI was 13.9. The key thing to watch is whether the short-term recovery attempt meets resistance. Right now, the main question is whether panic selling has run its course or the price will continue breaking down.
Can the rebound climb back above VWAP 140.6781? Don’t focus on the first glance—the quality of the rebound is more telling.
Note: This is a traditional finance perpetual. Liquidity is lower and gap risk is higher outside trading hours. 24h trading volume is under $5 million, and the order book is thin, so watch out for slippage.
#NOW #Unusual Movement Alert
NOW Binance TradFi Perpetual (traditional finance), closed at 04:15 Beijing time on 2026-10-29, down 12.54% over 5m. At 04:15:01 Beijing time on 2026-10-29, the observed price was 129.33, 24h turnover was 4.8386 million, price was below VWAP 140.6781, and RSI was 13.9. The key thing to watch is whether the short-term recovery attempt meets resistance. Right now, the main question is whether panic selling has run its course or the price will continue breaking down.
Can the rebound climb back above VWAP 140.6781? Don’t focus on the first glance—the quality of the rebound is more telling.
Note: This is a traditional finance perpetual. Liquidity is lower and gap risk is higher outside trading hours. 24h trading volume is under $5 million, and the order book is thin, so watch out for slippage.
#NOW #Unusual Movement Alert
Can the rebound climb back above VWAP 140.6781? Don’t focus on the first glance—the quality of the rebound is more telling.
Note: This is a traditional finance perpetual. Liquidity is lower and gap risk is higher outside trading hours. 24h trading volume is under $5 million, and the order book is thin, so watch out for slippage.
#NOW #Unusual Movement Alert
7

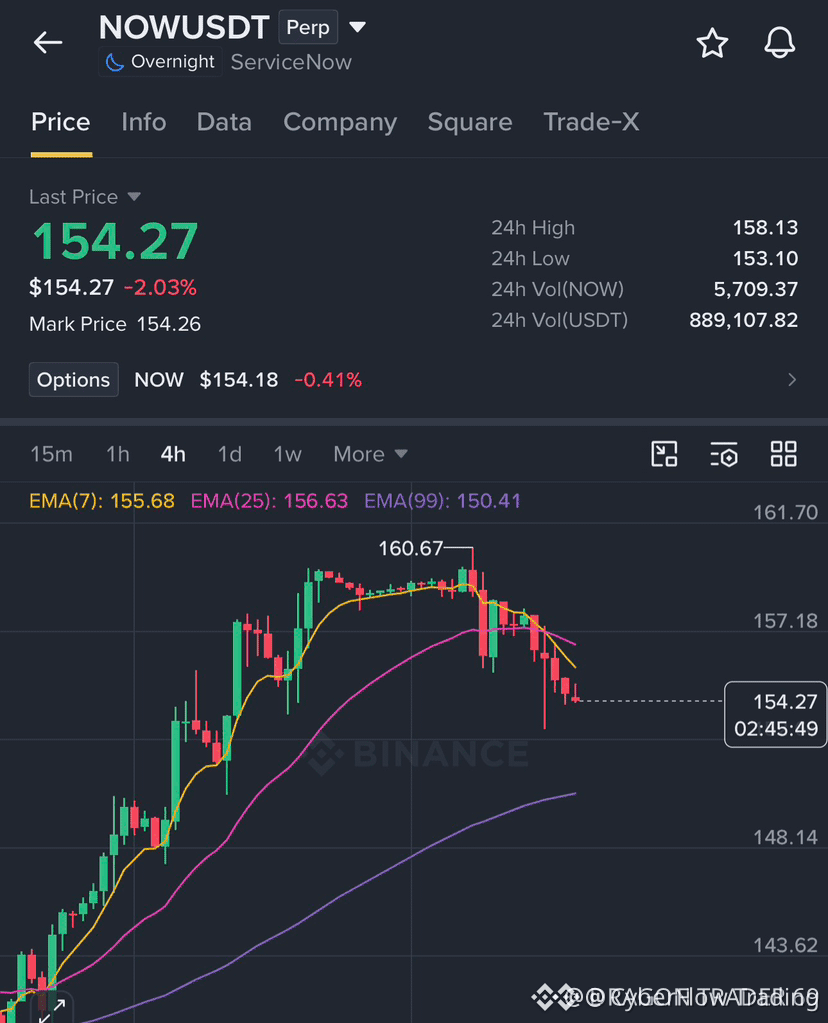
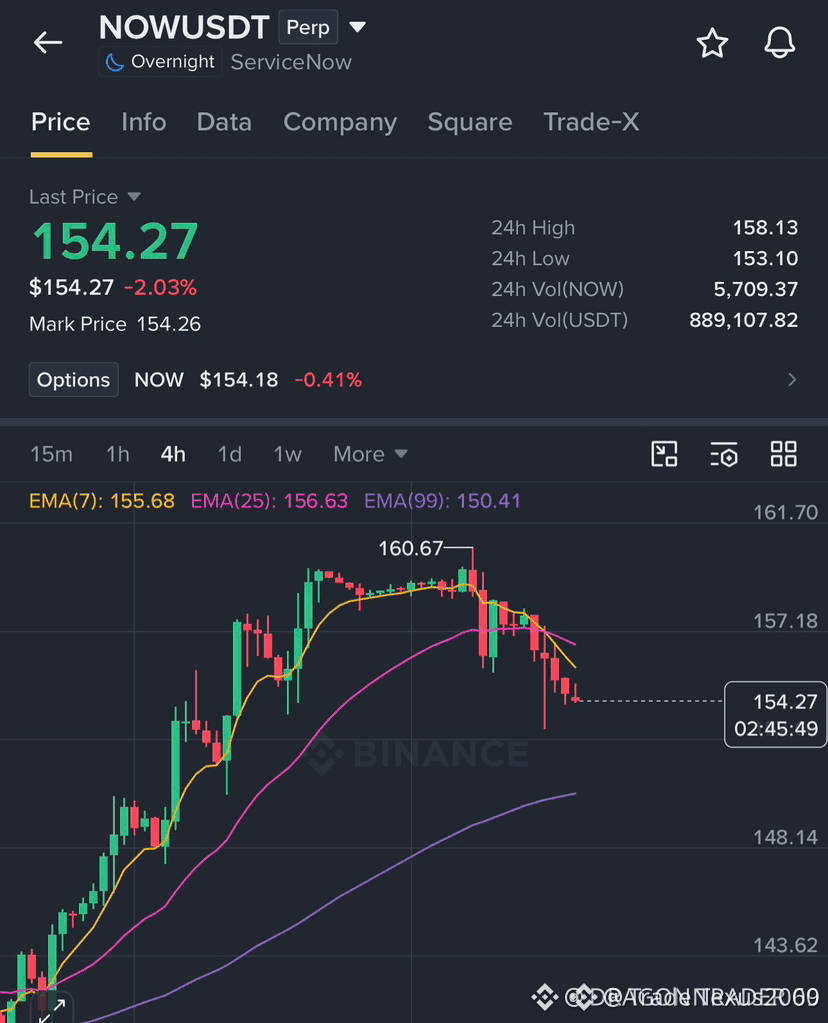
🚨 $NOW SHORT ALERT: BEARISH SWEEP AFTER RALLY 📉
Entry: 154.25-154.80 ⚡
Target: 152.80-151.00 🚀
Stop Loss: 156.20 ⚠️
The 4H chart is flashing red candles, draining the last burst of buying power and exposing a thin liquidity pocket around $154.5. 📊 Sellers are stacking orders, and the momentum is ticking down fast. ⚡
If price punches the $154.25‑$154.80 band with bearish confirmation, we flip the script and target the $152.80‑$151.00 corridor. 📌 Keep the stop tight at $156.20 to dodge any sudden reversal. 🌊
💬 Which side of the trade are you lining up for? 👇
⚠️ Not financial advice. Always manage your risk. 🛡️
🏷️ #NOW #ShortSetup #Crypto #Bearish
🔥 🦈
🚨 $NOW SHORT ALERT: BEARISH SWEEP AFTER RALLY 📉
Entry: 154.25-154.80 ⚡
Target: 152.80-151.00 🚀
Stop Loss: 156.20 ⚠️
The 4H chart is flashing red candles, draining the last burst of buying power and exposing a thin liquidity pocket around $154.5. 📊 Sellers are stacking orders, and the momentum is ticking down fast. ⚡
If price punches the $154.25‑$154.80 band with bearish confirmation, we flip the script and target the $152.80‑$151.00 corridor. 📌 Keep the stop tight at $156.20 to dodge any sudden reversal. 🌊
💬 Which side of the trade are you lining up for? 👇
⚠️ Not financial advice. Always manage your risk. 🛡️
🏷️ #NOW #ShortSetup #Crypto #Bearish
🔥 🦈
Entry: 154.25-154.80 ⚡
Target: 152.80-151.00 🚀
Stop Loss: 156.20 ⚠️
The 4H chart is flashing red candles, draining the last burst of buying power and exposing a thin liquidity pocket around $154.5. 📊 Sellers are stacking orders, and the momentum is ticking down fast. ⚡
If price punches the $154.25‑$154.80 band with bearish confirmation, we flip the script and target the $152.80‑$151.00 corridor. 📌 Keep the stop tight at $156.20 to dodge any sudden reversal. 🌊
💬 Which side of the trade are you lining up for? 👇
⚠️ Not financial advice. Always manage your risk. 🛡️
🏷️ #NOW #ShortSetup #Crypto #Bearish
🔥 🦈
17

🚨 $NOW BEARISH BREAKDOWN TARGETING $152 – SHORT SETUP ALERT!
Entry: 154.25-154.80 ⚡
Target: 152.80-151.00 🚀
Stop Loss: 156.20 ⚠️
Smart money has been unloading after the recent rally, and the 4H series now shows three consecutive bearish candles, eroding the $159‑$160 demand zone 📊. A break beneath $153.10 would trigger a liquidity sweep 🦈, pulling price deeper into the correction.
Entry range $154.25‑$154.80 aligns with the next bearish order block 📌, while the stop at $156.20 caps upside risk 💡. Targets between $152.80 and $151.00 offer a crisp risk‑reward profile, but wait for a confirming dip before committing. 💬 Are you ready to short $NOW on the next bearish wave? 👇
⚠️ Not financial advice. Always manage your risk. 🛡️
🏷️ #NOW #ShortSetup #LiquidityHunt #Crypto
🔥 🦈
🚨 $NOW BEARISH BREAKDOWN TARGETING $152 – SHORT SETUP ALERT!
Entry: 154.25-154.80 ⚡
Target: 152.80-151.00 🚀
Stop Loss: 156.20 ⚠️
Smart money has been unloading after the recent rally, and the 4H series now shows three consecutive bearish candles, eroding the $159‑$160 demand zone 📊. A break beneath $153.10 would trigger a liquidity sweep 🦈, pulling price deeper into the correction.
Entry range $154.25‑$154.80 aligns with the next bearish order block 📌, while the stop at $156.20 caps upside risk 💡. Targets between $152.80 and $151.00 offer a crisp risk‑reward profile, but wait for a confirming dip before committing. 💬 Are you ready to short $NOW on the next bearish wave? 👇
⚠️ Not financial advice. Always manage your risk. 🛡️
🏷️ #NOW #ShortSetup #LiquidityHunt #Crypto
🔥 🦈
Entry: 154.25-154.80 ⚡
Target: 152.80-151.00 🚀
Stop Loss: 156.20 ⚠️
Smart money has been unloading after the recent rally, and the 4H series now shows three consecutive bearish candles, eroding the $159‑$160 demand zone 📊. A break beneath $153.10 would trigger a liquidity sweep 🦈, pulling price deeper into the correction.
Entry range $154.25‑$154.80 aligns with the next bearish order block 📌, while the stop at $156.20 caps upside risk 💡. Targets between $152.80 and $151.00 offer a crisp risk‑reward profile, but wait for a confirming dip before committing. 💬 Are you ready to short $NOW on the next bearish wave? 👇
⚠️ Not financial advice. Always manage your risk. 🛡️
🏷️ #NOW #ShortSetup #LiquidityHunt #Crypto
🔥 🦈
15

·
--
🚨 $NOW IS WAKING UP! 🚨
After a powerful rebound from support, $NOW is showing clear signs of buyer dominance. Bulls have defended the key zone, and momentum is building fast. If this strength continues, a breakout toward higher targets could arrive sooner than many expect.
📊 LONG SETUP
💰 Entry: $97.80 – $99.20
🎯 TP1: $102.50
🎯 TP2: $106.00
🎯 TP3: $110.00
🛑 SL: $94.50
⚡ Current Price: $98.56 (+7.29%)
The chart is printing strength, volume is improving, and sentiment is turning bullish. The next move could separate the early traders from the late chasers.
❓ Do you think $NOW reaches $110 first or pulls back before the breakout?
🔥 Trade NOW here 👇
#NOW #NOWUSDT
🚨 $NOW IS WAKING UP! 🚨
After a powerful rebound from support, $NOW is showing clear signs of buyer dominance. Bulls have defended the key zone, and momentum is building fast. If this strength continues, a breakout toward higher targets could arrive sooner than many expect.
📊 LONG SETUP
💰 Entry: $97.80 – $99.20
🎯 TP1: $102.50
🎯 TP2: $106.00
🎯 TP3: $110.00
🛑 SL: $94.50
⚡ Current Price: $98.56 (+7.29%)
The chart is printing strength, volume is improving, and sentiment is turning bullish. The next move could separate the early traders from the late chasers.
❓ Do you think $NOW reaches $110 first or pulls back before the breakout?
🔥 Trade NOW here 👇
#NOW #NOWUSDT
After a powerful rebound from support, $NOW is showing clear signs of buyer dominance. Bulls have defended the key zone, and momentum is building fast. If this strength continues, a breakout toward higher targets could arrive sooner than many expect.
📊 LONG SETUP
💰 Entry: $97.80 – $99.20
🎯 TP1: $102.50
🎯 TP2: $106.00
🎯 TP3: $110.00
🛑 SL: $94.50
⚡ Current Price: $98.56 (+7.29%)
The chart is printing strength, volume is improving, and sentiment is turning bullish. The next move could separate the early traders from the late chasers.
❓ Do you think $NOW reaches $110 first or pulls back before the breakout?
🔥 Trade NOW here 👇
#NOW #NOWUSDT
67

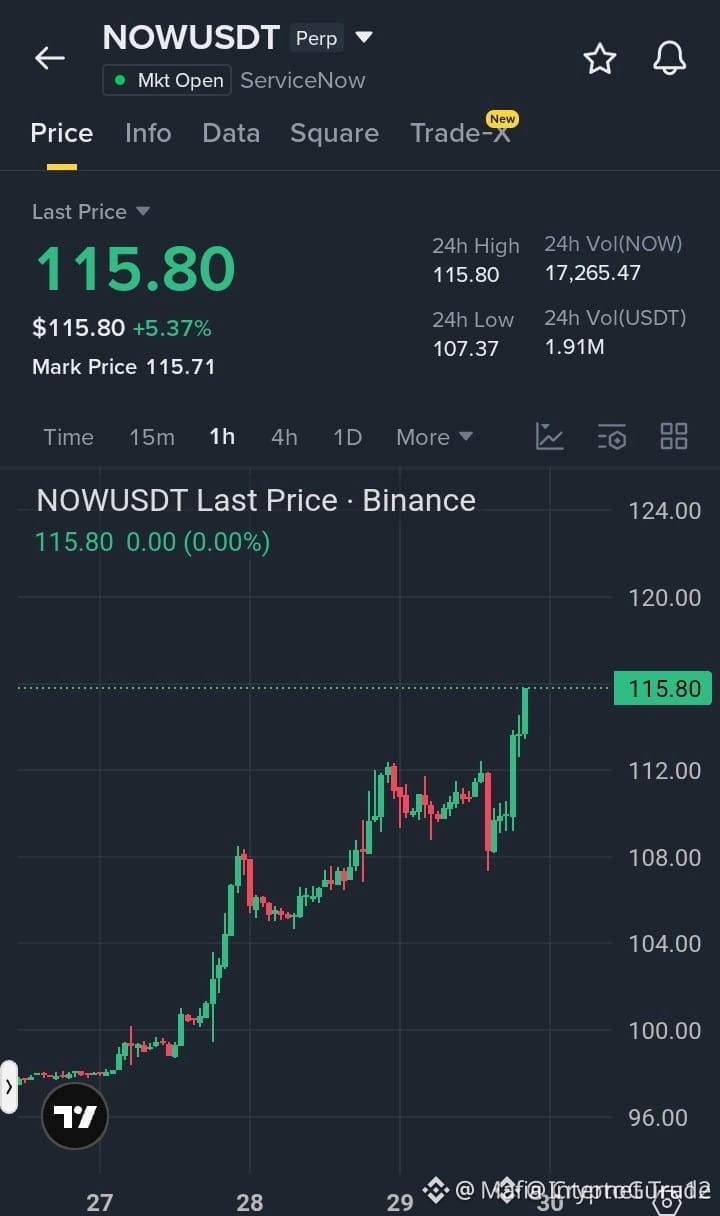
🚨 $NOW EYES FRESH HIGHS — BREAKOUT SETUP LOADING! 💥
Entry: $115.50 - $116.20 ⚡
Target: $124.00 🚀
Stop Loss: $112.80 ⚠️
📌 $NOW is coiling just beneath a major resistance wall, with buyers stacking bids aggressively in the $115 zone. 📊 Volume profile shows accumulation — each dip gets swallowed faster than the last. 💡 A clean break above $116.20 could trigger a liquidity cascade into $118, then $121, with the big target at $124. 🎯 The risk-to-reward here is asymmetric: stop at $112.80 keeps the downside tight. 💬 Are you loading up at these levels or waiting for the breakout confirmation? 👇
⚠️ Not financial advice. Always manage your risk. 🛡️
🏷️ #NOW #LongSetup #Breakout #Crypto
🚀 🎯
🚨 $NOW EYES FRESH HIGHS — BREAKOUT SETUP LOADING! 💥
Entry: $115.50 - $116.20 ⚡
Target: $124.00 🚀
Stop Loss: $112.80 ⚠️
📌 $NOW is coiling just beneath a major resistance wall, with buyers stacking bids aggressively in the $115 zone. 📊 Volume profile shows accumulation — each dip gets swallowed faster than the last. 💡 A clean break above $116.20 could trigger a liquidity cascade into $118, then $121, with the big target at $124. 🎯 The risk-to-reward here is asymmetric: stop at $112.80 keeps the downside tight. 💬 Are you loading up at these levels or waiting for the breakout confirmation? 👇
⚠️ Not financial advice. Always manage your risk. 🛡️
🏷️ #NOW #LongSetup #Breakout #Crypto
🚀 🎯
Entry: $115.50 - $116.20 ⚡
Target: $124.00 🚀
Stop Loss: $112.80 ⚠️
📌 $NOW is coiling just beneath a major resistance wall, with buyers stacking bids aggressively in the $115 zone. 📊 Volume profile shows accumulation — each dip gets swallowed faster than the last. 💡 A clean break above $116.20 could trigger a liquidity cascade into $118, then $121, with the big target at $124. 🎯 The risk-to-reward here is asymmetric: stop at $112.80 keeps the downside tight. 💬 Are you loading up at these levels or waiting for the breakout confirmation? 👇
⚠️ Not financial advice. Always manage your risk. 🛡️
🏷️ #NOW #LongSetup #Breakout #Crypto
🚀 🎯
40

·
--
$NOW currently reports 108.07000, up 10.399% in the past 24 hours. Funding rate is still 0, and open interest is 6530.11. The move has already been quite aggressive, yet longs and shorts don’t show a clear preference in the funding rate. Markets like this are the easiest to keep shaking people out, and also the easiest to spike higher and then suddenly yank the ladder away.
Once political and military narratives start to heat up, capital will first re-price based on hedging needs and the discount on risk assets. The market often translates escalation of conflict directly into “everything is bearish.” I disagree with that lazy judgment. Since the funding rate hasn’t turned positive, it means the cost of chasing longs hasn’t stacked up yet. Right now, it looks more like an expansion in volatility, and shorts can’t gain a crowded-position advantage either. If someone only looks at news sentiment and chases shorts, they may get hit by a squeeze round first.
My move: only buy on a pullback. I’ll open the position on the lowest multiple tier, with a light position size. If price around 108.07000 can hold, I’ll enter. If it clearly drops back below that level, I’ll stop out immediately. If it spikes higher and the funding rate turns positive, but price doesn’t keep pushing higher, I’ll take profit in batches—I won’t stick around to “perform hero” for the market.
Trading tag: #TradFi #链上美股 #NOW
Under risk-off sentiment, how will NOW likely move?
$NOW currently reports 108.07000, up 10.399% in the past 24 hours. Funding rate is still 0, and open interest is 6530.11. The move has already been quite aggressive, yet longs and shorts don’t show a clear preference in the funding rate. Markets like this are the easiest to keep shaking people out, and also the easiest to spike higher and then suddenly yank the ladder away.
Once political and military narratives start to heat up, capital will first re-price based on hedging needs and the discount on risk assets. The market often translates escalation of conflict directly into “everything is bearish.” I disagree with that lazy judgment. Since the funding rate hasn’t turned positive, it means the cost of chasing longs hasn’t stacked up yet. Right now, it looks more like an expansion in volatility, and shorts can’t gain a crowded-position advantage either. If someone only looks at news sentiment and chases shorts, they may get hit by a squeeze round first.
My move: only buy on a pullback. I’ll open the position on the lowest multiple tier, with a light position size. If price around 108.07000 can hold, I’ll enter. If it clearly drops back below that level, I’ll stop out immediately. If it spikes higher and the funding rate turns positive, but price doesn’t keep pushing higher, I’ll take profit in batches—I won’t stick around to “perform hero” for the market.
Trading tag: #TradFi #链上美股 #NOW
Under risk-off sentiment, how will NOW likely move?
Once political and military narratives start to heat up, capital will first re-price based on hedging needs and the discount on risk assets. The market often translates escalation of conflict directly into “everything is bearish.” I disagree with that lazy judgment. Since the funding rate hasn’t turned positive, it means the cost of chasing longs hasn’t stacked up yet. Right now, it looks more like an expansion in volatility, and shorts can’t gain a crowded-position advantage either. If someone only looks at news sentiment and chases shorts, they may get hit by a squeeze round first.
My move: only buy on a pullback. I’ll open the position on the lowest multiple tier, with a light position size. If price around 108.07000 can hold, I’ll enter. If it clearly drops back below that level, I’ll stop out immediately. If it spikes higher and the funding rate turns positive, but price doesn’t keep pushing higher, I’ll take profit in batches—I won’t stick around to “perform hero” for the market.
Trading tag: #TradFi #链上美股 #NOW
Under risk-off sentiment, how will NOW likely move?
20

·
--
To be honest, I’ve been watching this wave of $NOW for a long time. At the 1-minute timeframe, it directly breaks out on a surge in volume—clearly there’s a main force accumulating. In terms of structure, the lows keep getting higher. That pullback just now landed right on the support zone and didn’t break down—this is a classic buildup signal. I’m going to choose to follow in directly. Once a strong coin starts, it won’t give you too much time to hesitate.
Place the stop loss below the dense trading area under it, that’s all. The upside space is pretty clear—scaling out in batches is totally fine. Since the direction is clear, don’t overthink it—just do it.
🟢 Trade Direction: Long
📍 Entry Range: 106.94 – 106.95
🛑 Stop Loss: 106.00
🎯 Take Profit 1: 108.00
🎯 Take Profit 2: 108.50
🎯 Take Profit 3: 109.00
#NOW
Click the button below to trade👇👇👇
To be honest, I’ve been watching this wave of $NOW for a long time. At the 1-minute timeframe, it directly breaks out on a surge in volume—clearly there’s a main force accumulating. In terms of structure, the lows keep getting higher. That pullback just now landed right on the support zone and didn’t break down—this is a classic buildup signal. I’m going to choose to follow in directly. Once a strong coin starts, it won’t give you too much time to hesitate.
Place the stop loss below the dense trading area under it, that’s all. The upside space is pretty clear—scaling out in batches is totally fine. Since the direction is clear, don’t overthink it—just do it.
🟢 Trade Direction: Long
📍 Entry Range: 106.94 – 106.95
🛑 Stop Loss: 106.00
🎯 Take Profit 1: 108.00
🎯 Take Profit 2: 108.50
🎯 Take Profit 3: 109.00
#NOW
Click the button below to trade👇👇👇
Place the stop loss below the dense trading area under it, that’s all. The upside space is pretty clear—scaling out in batches is totally fine. Since the direction is clear, don’t overthink it—just do it.
🟢 Trade Direction: Long
📍 Entry Range: 106.94 – 106.95
🛑 Stop Loss: 106.00
🎯 Take Profit 1: 108.00
🎯 Take Profit 2: 108.50
🎯 Take Profit 3: 109.00
#NOW
Click the button below to trade👇👇👇
104

·
--
Brothers, $NOW I’ve understood this trend anyway— the pullback has been washed out about enough. The bears tried to smash it three times but couldn’t break through. Instead, our people quietly picked up orders below. If you don’t get on the train, are you going to chase after it’s already pulled up?
Don’t mess around. We’re going long on this order. The logic is: if it can’t fall anymore, it should rise. Don’t overthink it—just follow the rhythm. Set your stop-loss properly, and the rest is up to the market.
🟢 Trade Direction: Long
📍 Entry Range: 105.50 – 106.30
🛑 Stop-Loss: 104.50
🎯 Take Profit 1: 108.00
🎯 Take Profit 2: 110.00
🎯 Take Profit 3: 113.00
#NOW
Click below to trade👇👇👇
Brothers, $NOW I’ve understood this trend anyway— the pullback has been washed out about enough. The bears tried to smash it three times but couldn’t break through. Instead, our people quietly picked up orders below. If you don’t get on the train, are you going to chase after it’s already pulled up?
Don’t mess around. We’re going long on this order. The logic is: if it can’t fall anymore, it should rise. Don’t overthink it—just follow the rhythm. Set your stop-loss properly, and the rest is up to the market.
🟢 Trade Direction: Long
📍 Entry Range: 105.50 – 106.30
🛑 Stop-Loss: 104.50
🎯 Take Profit 1: 108.00
🎯 Take Profit 2: 110.00
🎯 Take Profit 3: 113.00
#NOW
Click below to trade👇👇👇
Don’t mess around. We’re going long on this order. The logic is: if it can’t fall anymore, it should rise. Don’t overthink it—just follow the rhythm. Set your stop-loss properly, and the rest is up to the market.
🟢 Trade Direction: Long
📍 Entry Range: 105.50 – 106.30
🛑 Stop-Loss: 104.50
🎯 Take Profit 1: 108.00
🎯 Take Profit 2: 110.00
🎯 Take Profit 3: 113.00
#NOW
Click below to trade👇👇👇
35
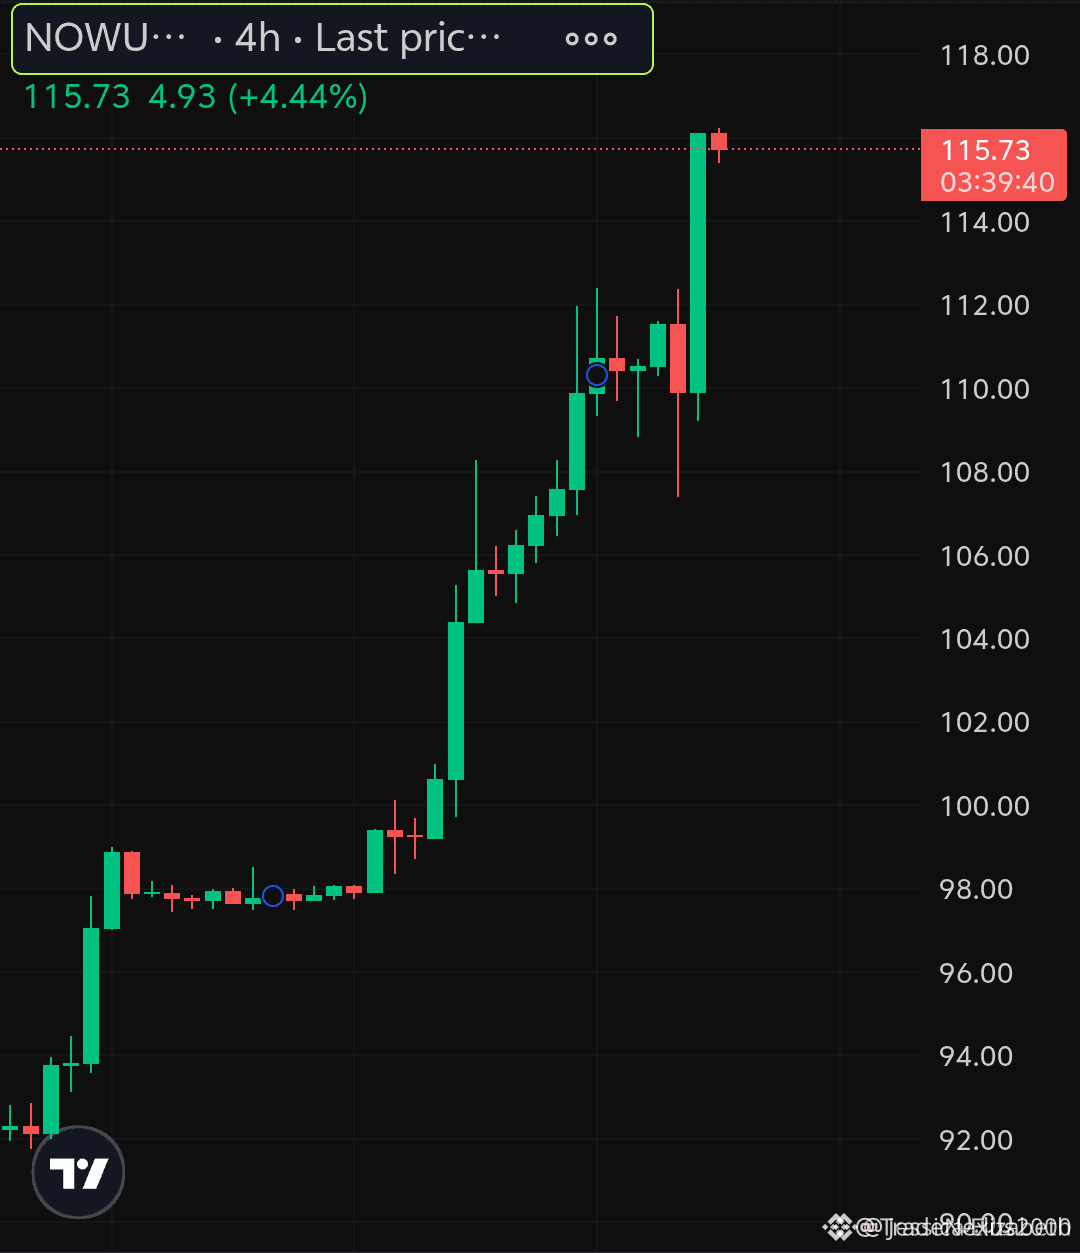
🚀 $NOW INSTITUTIONAL DEMAND ZONE CONFIRMED - BUYERS IN FULL CONTROL 🐂
Entry: 114.9-117.1 ⚡
Target 1: 120.56 🚀
Target 2: 124.80 🚀
Target 3: 127.00 🚀
Stop Loss: 111.90 ⚠️
📌 Price is compressing above a clear structural support zone where aggressive accumulation has been spotted on lower timeframes. 📊 The move above 116.30 triggered a wave of short liquidity sweeps, leaving behind a freshly formed order block that smart money is now defending.
💡 With buyers stepping in immediately at the demand area, this setup aligns with a classic continuation pattern. Volume is expanding, and the path toward 124.80 and 127.00 offers a clean risk-to-reward profile for a disciplined swing. 💬 Are you stacking at the zone or waiting for one more sweep below entry to add size? 👇
⚠️ Not financial advice. Always manage your risk. 🛡️
🏷️ #NOW #LongSetup #Breakout #Crypto #Trading
🎯 📊
🚀 $NOW INSTITUTIONAL DEMAND ZONE CONFIRMED - BUYERS IN FULL CONTROL 🐂
Entry: 114.9-117.1 ⚡
Target 1: 120.56 🚀
Target 2: 124.80 🚀
Target 3: 127.00 🚀
Stop Loss: 111.90 ⚠️
📌 Price is compressing above a clear structural support zone where aggressive accumulation has been spotted on lower timeframes. 📊 The move above 116.30 triggered a wave of short liquidity sweeps, leaving behind a freshly formed order block that smart money is now defending.
💡 With buyers stepping in immediately at the demand area, this setup aligns with a classic continuation pattern. Volume is expanding, and the path toward 124.80 and 127.00 offers a clean risk-to-reward profile for a disciplined swing. 💬 Are you stacking at the zone or waiting for one more sweep below entry to add size? 👇
⚠️ Not financial advice. Always manage your risk. 🛡️
🏷️ #NOW #LongSetup #Breakout #Crypto #Trading
🎯 📊
Entry: 114.9-117.1 ⚡
Target 1: 120.56 🚀
Target 2: 124.80 🚀
Target 3: 127.00 🚀
Stop Loss: 111.90 ⚠️
📌 Price is compressing above a clear structural support zone where aggressive accumulation has been spotted on lower timeframes. 📊 The move above 116.30 triggered a wave of short liquidity sweeps, leaving behind a freshly formed order block that smart money is now defending.
💡 With buyers stepping in immediately at the demand area, this setup aligns with a classic continuation pattern. Volume is expanding, and the path toward 124.80 and 127.00 offers a clean risk-to-reward profile for a disciplined swing. 💬 Are you stacking at the zone or waiting for one more sweep below entry to add size? 👇
⚠️ Not financial advice. Always manage your risk. 🛡️
🏷️ #NOW #LongSetup #Breakout #Crypto #Trading
🎯 📊
12

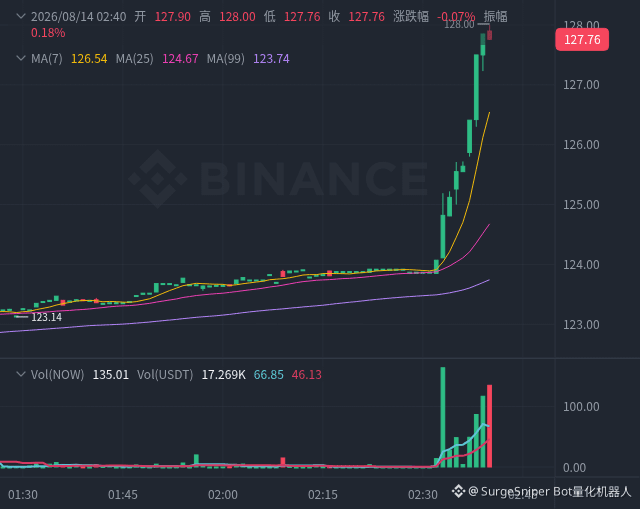
$NOW [Accumulation] NOW the main force is quietly accumulating? OI爆拉 the price but it’s still pinned!
[Hide-and-Sneak] Is the capital hiding in plain sight? A 3.2% increase in OI, yet the price doesn’t budge—classic accumulation behavior
I dug through the on-chain data: the main force is building positions; OI is surging, but the price hasn’t started moving yet
To put it plainly:
OI is open interest (positions), while price is the surface. If OI spikes but price doesn’t rise = someone is catching the bids underneath, and the people above haven’t noticed.
When OI jumps 3.2% within 30 minutes, the price only moves +0.17%—typical pattern where volume/position comes before price.
OI is the result of market participants voting with real money. It’s more honest than any candlestick pattern. In this structure, historically the win rate isn’t low.
━━━ Liquidity/Capital Interpretation ━━━
[Whales on the Sidelines] Whale long/short ratio is 0.82—no clear directional action yet, just observing
[Retail Neutral] Retail long/short ratio is 1.31—sentiment is neutral, neither overheated nor panicked
━━━ One-line Summary ━━━
The signal that the main force is loading up is already very clear—the only question is when the market will react. Being early by half a step makes you the winner.
[OI Signal Strategy V3.2]
#NOW
{future}(NOWUSDT)
$NOW [Accumulation] NOW the main force is quietly accumulating? OI爆拉 the price but it’s still pinned!
[Hide-and-Sneak] Is the capital hiding in plain sight? A 3.2% increase in OI, yet the price doesn’t budge—classic accumulation behavior
I dug through the on-chain data: the main force is building positions; OI is surging, but the price hasn’t started moving yet
To put it plainly:
OI is open interest (positions), while price is the surface. If OI spikes but price doesn’t rise = someone is catching the bids underneath, and the people above haven’t noticed.
When OI jumps 3.2% within 30 minutes, the price only moves +0.17%—typical pattern where volume/position comes before price.
OI is the result of market participants voting with real money. It’s more honest than any candlestick pattern. In this structure, historically the win rate isn’t low.
━━━ Liquidity/Capital Interpretation ━━━
[Whales on the Sidelines] Whale long/short ratio is 0.82—no clear directional action yet, just observing
[Retail Neutral] Retail long/short ratio is 1.31—sentiment is neutral, neither overheated nor panicked
━━━ One-line Summary ━━━
The signal that the main force is loading up is already very clear—the only question is when the market will react. Being early by half a step makes you the winner.
[OI Signal Strategy V3.2]
#NOW
[Hide-and-Sneak] Is the capital hiding in plain sight? A 3.2% increase in OI, yet the price doesn’t budge—classic accumulation behavior
I dug through the on-chain data: the main force is building positions; OI is surging, but the price hasn’t started moving yet
To put it plainly:
OI is open interest (positions), while price is the surface. If OI spikes but price doesn’t rise = someone is catching the bids underneath, and the people above haven’t noticed.
When OI jumps 3.2% within 30 minutes, the price only moves +0.17%—typical pattern where volume/position comes before price.
OI is the result of market participants voting with real money. It’s more honest than any candlestick pattern. In this structure, historically the win rate isn’t low.
━━━ Liquidity/Capital Interpretation ━━━
[Whales on the Sidelines] Whale long/short ratio is 0.82—no clear directional action yet, just observing
[Retail Neutral] Retail long/short ratio is 1.31—sentiment is neutral, neither overheated nor panicked
━━━ One-line Summary ━━━
The signal that the main force is loading up is already very clear—the only question is when the market will react. Being early by half a step makes you the winner.
[OI Signal Strategy V3.2]
#NOW
31
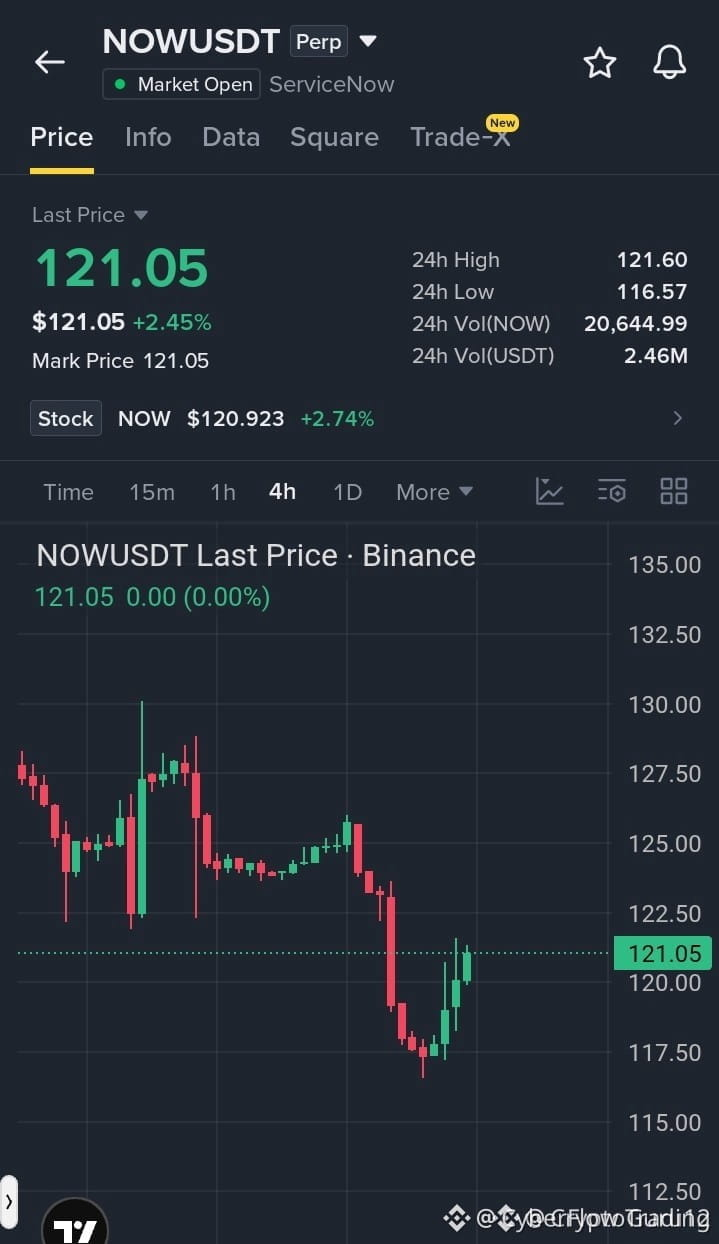
⚡ $NOW DEFENDS DEMAND AT $117 AS BUYERS MOUNT AN EXPLOSIVE RECOVERY! 🎯
Entry: 120.50 - 121.20 ⚡
Target: 123.00 / 125.00 / 127.50 🚀
Stop Loss: 118.50 ⚠️
Buyers aggressively stepped into the $117–$118 demand pocket following the recent flush, forcing a sharp absorption tail. 📊 Holding firm above the structural level at $120 signals that short-side pressure is rapidly wearing thin.
A clean flip and sustained move past $122.50 opens up clear skies toward upper supply levels. 💡 Invalidation is tightly set right under support, offering an exceptionally clean risk-to-reward window. 💬 Are you bidding this support reclaim or waiting for the breakout confirmation? 👇
⚠️ Not financial advice. Always manage your risk. 🛡️
🏷️ #NOW #LongSetup #Crypto #Trading #Bounce
🔥 💎
⚡ $NOW DEFENDS DEMAND AT $117 AS BUYERS MOUNT AN EXPLOSIVE RECOVERY! 🎯
Entry: 120.50 - 121.20 ⚡
Target: 123.00 / 125.00 / 127.50 🚀
Stop Loss: 118.50 ⚠️
Buyers aggressively stepped into the $117–$118 demand pocket following the recent flush, forcing a sharp absorption tail. 📊 Holding firm above the structural level at $120 signals that short-side pressure is rapidly wearing thin.
A clean flip and sustained move past $122.50 opens up clear skies toward upper supply levels. 💡 Invalidation is tightly set right under support, offering an exceptionally clean risk-to-reward window. 💬 Are you bidding this support reclaim or waiting for the breakout confirmation? 👇
⚠️ Not financial advice. Always manage your risk. 🛡️
🏷️ #NOW #LongSetup #Crypto #Trading #Bounce
🔥 💎
Entry: 120.50 - 121.20 ⚡
Target: 123.00 / 125.00 / 127.50 🚀
Stop Loss: 118.50 ⚠️
Buyers aggressively stepped into the $117–$118 demand pocket following the recent flush, forcing a sharp absorption tail. 📊 Holding firm above the structural level at $120 signals that short-side pressure is rapidly wearing thin.
A clean flip and sustained move past $122.50 opens up clear skies toward upper supply levels. 💡 Invalidation is tightly set right under support, offering an exceptionally clean risk-to-reward window. 💬 Are you bidding this support reclaim or waiting for the breakout confirmation? 👇
⚠️ Not financial advice. Always manage your risk. 🛡️
🏷️ #NOW #LongSetup #Crypto #Trading #Bounce
🔥 💎
20

$NOW LONG
Can buyers build on the current upward momentum? It looks like the bulls are determined and ready to maintain initiative in the market. As long as the upward structure remains intact, a move toward the upper price targets seems like a completely plausible scenario. The risk of a pullback is always present, but current control remains with the buyers.
🏁Entry: 130.02
💰Target 1: 131.33312837 (+1.01%)
💰Target 2: 133.03625674 (+2.32%)
💰Target 3: 135.59094929 (+4.28%)
⛔️Stop: 127.07530745 (-2.26%)
⚠️ This is not financial advice. Trade at your own risk. DYOR.
#NOW #SPCXB #WLD 📈
$NOW
$NOW LONG
Can buyers build on the current upward momentum? It looks like the bulls are determined and ready to maintain initiative in the market. As long as the upward structure remains intact, a move toward the upper price targets seems like a completely plausible scenario. The risk of a pullback is always present, but current control remains with the buyers.
🏁Entry: 130.02
💰Target 1: 131.33312837 (+1.01%)
💰Target 2: 133.03625674 (+2.32%)
💰Target 3: 135.59094929 (+4.28%)
⛔️Stop: 127.07530745 (-2.26%)
⚠️ This is not financial advice. Trade at your own risk. DYOR.
#NOW #SPCXB #WLD 📈
$NOW
Can buyers build on the current upward momentum? It looks like the bulls are determined and ready to maintain initiative in the market. As long as the upward structure remains intact, a move toward the upper price targets seems like a completely plausible scenario. The risk of a pullback is always present, but current control remains with the buyers.
🏁Entry: 130.02
💰Target 1: 131.33312837 (+1.01%)
💰Target 2: 133.03625674 (+2.32%)
💰Target 3: 135.59094929 (+4.28%)
⛔️Stop: 127.07530745 (-2.26%)
⚠️ This is not financial advice. Trade at your own risk. DYOR.
#NOW #SPCXB #WLD 📈
$NOW
74
Log in to explore more content
Join global crypto users on Binance Square
⚡️ Get latest and useful information about crypto.
💬 Trusted by the world’s largest crypto exchange.
👍 Discover real insights from verified creators.
Email / Phone number
Trending Topics
1
#BitcoinCorePatchesAIDiscoveredVulnerability
7 views
34 Discussing
2
#CanBTCReboundAfterFallingBelow60K?
448,740 views
1,944 Discussing
3
#GlobalStocksFaceLongestLosingStreakSince2023
152,117 views
1,358 Discussing
4
#BlackRockIBITPostsRecord$541MSingleDayOutflow
5,295 views
42 Discussing
5
#AnthropicPlungesTowardIPOPriceonDay2
73,269 views
767 Discussing
6
#TwentyOneCapitalAdds172.25BTC
23,984 views
299 Discussing
7
#HKBillWouldExcludeTokenizedDepositsFromVirtualAssets
2,671 views
31 Discussing
8
#BNBDropsBelow540USDTWith8.46%DailyDecline
42,673 views
373 Discussing
9
#HKBillProposesHK$100KFineForUnauthorizedCryptoTitles
1,500 views
20 Discussing
10
#BitMineFaces$10.1BUnrealizedETHLoss
2,750 views
25 Discussing