
#spcxb
spcxb
438,034 views
4,111 Discussing
Hot
Latest


$SPCXB: Examining Candle Stalls Near Local Resistance
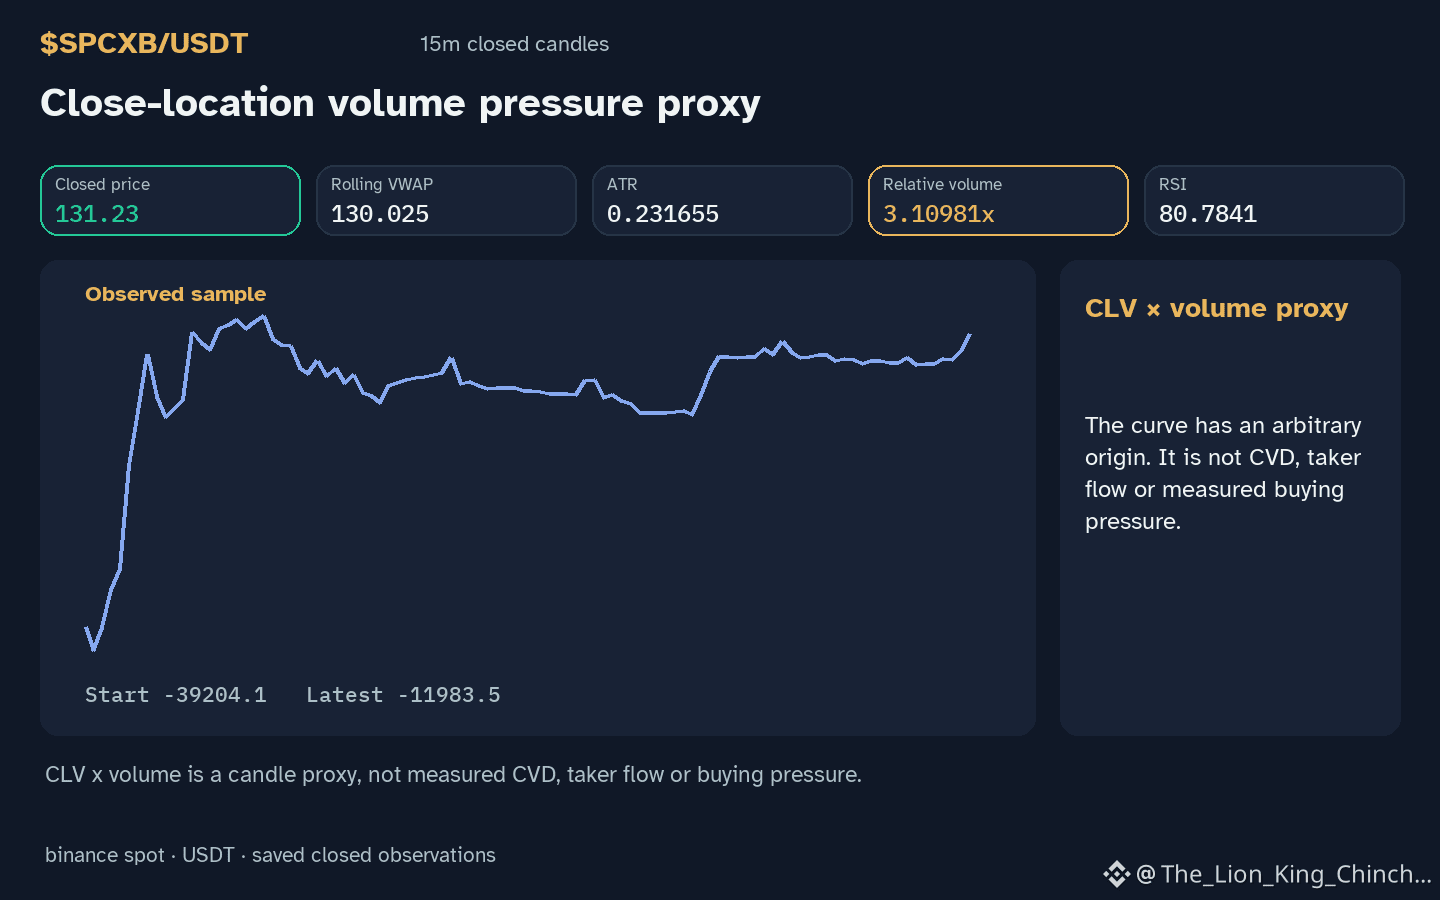
What occurs when $SPCXB moves into a local resistance level with rising volume but fails to produce a wide-bodied expansion? Current observations show the asset is positioned above resistance with an hourly direction up and volume 3.11x the baseline.
A forensic reading of stalled breakout candles involves looking at the relationship between high relative volume and the resulting candle spread. In a hypothetical mechanism, a small candle body accompanied by high volume at a resistance level might suggest a lack of directional conviction. If a candle closes near its open despite heavy activity, it indicates that price movement was restrained during that interval. This is an observation of price action, not a claim about participant motives. A doji-like candle in this context serves as a thought experiment on structural friction.
An alternative reading suggests this could be a temporary pause where price prepares for further extension. In this scenario, the high volume signifies active participation that has not yet shifted the price significantly. However, if the RSI 80.8 is already elevated, a stall might precede a mean reversion toward the local support 129.7.
To reassess this interpretation, one should look at the subsequent closed candles. If future candles close below the current range while relative volume remains high, it would weaken the idea of a successful breakout. Conversely, a wide-bodied candle closing above the recent high would suggest the stall was merely a brief consolidation.
Probabilistic market research, not a recommendation or guaranteed return.
#SPCXB #MarketAnalysis #CryptoLearning
$SPCXB : Examining Candle Stalls Near Local Resistance
What occurs when $SPCXB moves into a local resistance level with rising volume but fails to produce a wide-bodied expansion? Current observations show the asset is positioned above resistance with an hourly direction up and volume 3.11x the baseline.
A forensic reading of stalled breakout candles involves looking at the relationship between high relative volume and the resulting candle spread. In a hypothetical mechanism, a small candle body accompanied by high volume at a resistance level might suggest a lack of directional conviction. If a candle closes near its open despite heavy activity, it indicates that price movement was restrained during that interval. This is an observation of price action, not a claim about participant motives. A doji-like candle in this context serves as a thought experiment on structural friction.
An alternative reading suggests this could be a temporary pause where price prepares for further extension. In this scenario, the high volume signifies active participation that has not yet shifted the price significantly. However, if the RSI 80.8 is already elevated, a stall might precede a mean reversion toward the local support 129.7.
To reassess this interpretation, one should look at the subsequent closed candles. If future candles close below the current range while relative volume remains high, it would weaken the idea of a successful breakout. Conversely, a wide-bodied candle closing above the recent high would suggest the stall was merely a brief consolidation.
Probabilistic market research, not a recommendation or guaranteed return.
#SPCXB #MarketAnalysis #CryptoLearning
What occurs when $SPCXB moves into a local resistance level with rising volume but fails to produce a wide-bodied expansion? Current observations show the asset is positioned above resistance with an hourly direction up and volume 3.11x the baseline.
A forensic reading of stalled breakout candles involves looking at the relationship between high relative volume and the resulting candle spread. In a hypothetical mechanism, a small candle body accompanied by high volume at a resistance level might suggest a lack of directional conviction. If a candle closes near its open despite heavy activity, it indicates that price movement was restrained during that interval. This is an observation of price action, not a claim about participant motives. A doji-like candle in this context serves as a thought experiment on structural friction.
An alternative reading suggests this could be a temporary pause where price prepares for further extension. In this scenario, the high volume signifies active participation that has not yet shifted the price significantly. However, if the RSI 80.8 is already elevated, a stall might precede a mean reversion toward the local support 129.7.
To reassess this interpretation, one should look at the subsequent closed candles. If future candles close below the current range while relative volume remains high, it would weaken the idea of a successful breakout. Conversely, a wide-bodied candle closing above the recent high would suggest the stall was merely a brief consolidation.
Probabilistic market research, not a recommendation or guaranteed return.
#SPCXB #MarketAnalysis #CryptoLearning
135

·
--
$SPCXB +1.00% | $MSFTB +0.98% | $币安人生 +0.68%
#SPCXB at $130.27, up +1.00% on $20.4 M volume. The modest gain hints at light buying pressure but enough depth to hold the move.
#MSFTB trading at $491.03, up +0.98% with $1.1 M volume. Momentum is thin yet steady, suggesting a cautious market stance.
#币安人生 priced at $0.4477, up +0.68% on $2.6 M volume. A small rise backed by respectable liquidity for a sub‑$1 token.
👀 Watch if SPCXB’s stronger volume can spark a broader breakout across the three.
#Write2Earn #Binance
$SPCXB +1.00% | $MSFTB +0.98% | $币安人生 +0.68%
#SPCXB at $130.27, up +1.00% on $20.4 M volume. The modest gain hints at light buying pressure but enough depth to hold the move.
#MSFTB trading at $491.03, up +0.98% with $1.1 M volume. Momentum is thin yet steady, suggesting a cautious market stance.
#币安人生 priced at $0.4477, up +0.68% on $2.6 M volume. A small rise backed by respectable liquidity for a sub‑$1 token.
👀 Watch if SPCXB’s stronger volume can spark a broader breakout across the three.
#Write2Earn #Binance
#SPCXB at $130.27, up +1.00% on $20.4 M volume. The modest gain hints at light buying pressure but enough depth to hold the move.
#MSFTB trading at $491.03, up +0.98% with $1.1 M volume. Momentum is thin yet steady, suggesting a cautious market stance.
#币安人生 priced at $0.4477, up +0.68% on $2.6 M volume. A small rise backed by respectable liquidity for a sub‑$1 token.
👀 Watch if SPCXB’s stronger volume can spark a broader breakout across the three.
#Write2Earn #Binance
13

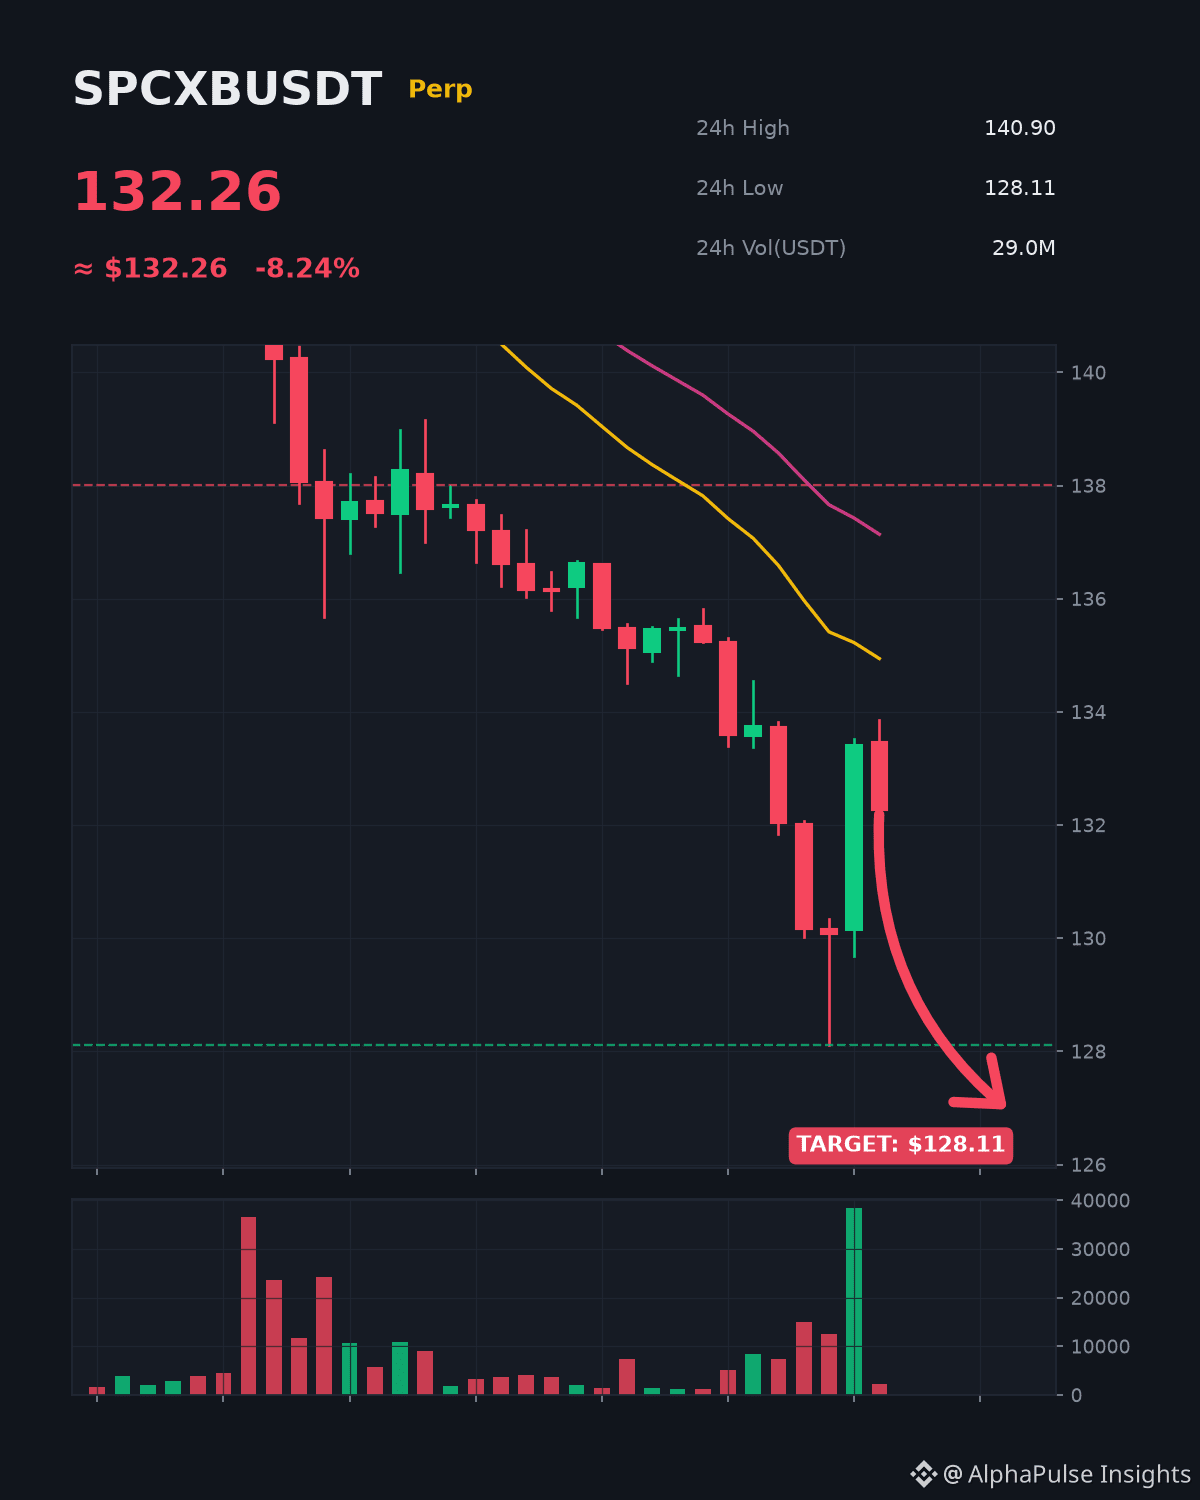
Bears rejected $SPCXB near $138.01 on $$29.0M turnover, shifting 1H structure downward.
Sellers are capping every minor push, favoring a liquidity sweep toward $128.11.
Playing the breakdown or staying patient on the sidelines? 👇
$SPCXB $ETH $SOL #SPCXB #Write2Earn #BinanceSquare
Bears rejected $SPCXB near $138.01 on $$29.0M turnover, shifting 1H structure downward.
Sellers are capping every minor push, favoring a liquidity sweep toward $128.11.
Playing the breakdown or staying patient on the sidelines? 👇
$SPCXB $ETH $SOL #SPCXB #Write2Earn #BinanceSquare
Sellers are capping every minor push, favoring a liquidity sweep toward $128.11.
Playing the breakdown or staying patient on the sidelines? 👇
$SPCXB $ETH $SOL #SPCXB #Write2Earn #BinanceSquare
32

·
--
A double-digit drop is not an automatic buying signal.
Trader checklist for $SPCXB:
- Current state: Down 10.58% to $129.78.
- Bullish trigger: A conditional reclaim of 131.85 indicates stabilizing demand.
- Invalidation risk: Rejection below 131.85 warns of continued downside pressure.
Will buyers reclaim 131.85 to confirm relief, or does staying below it validate continuation?
Tap $SPCXB for the live chart. #SPCXB #BinanceSquare
A double-digit drop is not an automatic buying signal.
Trader checklist for $SPCXB :
- Current state: Down 10.58% to $129.78.
- Bullish trigger: A conditional reclaim of 131.85 indicates stabilizing demand.
- Invalidation risk: Rejection below 131.85 warns of continued downside pressure.
Will buyers reclaim 131.85 to confirm relief, or does staying below it validate continuation?
Tap $SPCXB for the live chart. #SPCXB #BinanceSquare
Trader checklist for $SPCXB :
- Current state: Down 10.58% to $129.78.
- Bullish trigger: A conditional reclaim of 131.85 indicates stabilizing demand.
- Invalidation risk: Rejection below 131.85 warns of continued downside pressure.
Will buyers reclaim 131.85 to confirm relief, or does staying below it validate continuation?
Tap $SPCXB for the live chart. #SPCXB #BinanceSquare
5
·
--
Is $SPCXB seeing selling exhaustion or a persistent liquidity drain?
1. Participation: A 24-hour turnover of $26.34M accompanied an -8.62% decline to $134.19.
2. Bullish scenario: A sustained reclaim above 134.51 would indicate dip buyers absorbing the selloff.
3. Invalidation signal: Remaining under the 133.59 hourly close signals ongoing sell-side pressure.
Can buyers reclaim 134.51 to confirm absorption, or does acceptance below 133.59 keep the trend down?
Tap $SPCXB for the live chart. #SPCXB #BinanceSquare
Is $SPCXB seeing selling exhaustion or a persistent liquidity drain?
1. Participation: A 24-hour turnover of $26.34M accompanied an -8.62% decline to $134.19.
2. Bullish scenario: A sustained reclaim above 134.51 would indicate dip buyers absorbing the selloff.
3. Invalidation signal: Remaining under the 133.59 hourly close signals ongoing sell-side pressure.
Can buyers reclaim 134.51 to confirm absorption, or does acceptance below 133.59 keep the trend down?
Tap $SPCXB for the live chart. #SPCXB #BinanceSquare
1. Participation: A 24-hour turnover of $26.34M accompanied an -8.62% decline to $134.19.
2. Bullish scenario: A sustained reclaim above 134.51 would indicate dip buyers absorbing the selloff.
3. Invalidation signal: Remaining under the 133.59 hourly close signals ongoing sell-side pressure.
Can buyers reclaim 134.51 to confirm absorption, or does acceptance below 133.59 keep the trend down?
Tap $SPCXB for the live chart. #SPCXB #BinanceSquare
4

·
--
Is the $SPCXB pullback stabilizing or simply taking a breather?
After sliding -7.68% to $135.26, selling momentum appears to be slowing rather than accelerating.
Holding above the recent range low at 134.51 offers a conditional setup for stabilization. Conversely, a drop below 134.51 would invalidate that scenario and highlight ongoing downside risk.
Will 134.51 confirm a reliable floor, or does a breakdown confirm another leg lower?
Tap $SPCXB for the live chart. #SPCXB #BinanceSquare
Is the $SPCXB pullback stabilizing or simply taking a breather?
After sliding -7.68% to $135.26, selling momentum appears to be slowing rather than accelerating.
Holding above the recent range low at 134.51 offers a conditional setup for stabilization. Conversely, a drop below 134.51 would invalidate that scenario and highlight ongoing downside risk.
Will 134.51 confirm a reliable floor, or does a breakdown confirm another leg lower?
Tap $SPCXB for the live chart. #SPCXB #BinanceSquare
After sliding -7.68% to $135.26, selling momentum appears to be slowing rather than accelerating.
Holding above the recent range low at 134.51 offers a conditional setup for stabilization. Conversely, a drop below 134.51 would invalidate that scenario and highlight ongoing downside risk.
Will 134.51 confirm a reliable floor, or does a breakdown confirm another leg lower?
Tap $SPCXB for the live chart. #SPCXB #BinanceSquare
2

📊 TECHNICAL ANALYSIS: $SPCXB (SPCXBUSDT) — 🔴 SHORT
💰 Current Price: 135.040 USDT (24h: -7.29% | 24h Vol: 25.75M USDT)
📈 24h Range: Low 134.510 — High 147.520 | 1H Structure (EMA7: 135.886 • RSI: 26)
🎯 Entry Zone: 135.040 - 135.580
✅ Take Profit 1 (TP1): 128.288
✅ Take Profit 2 (TP2): 122.886
🛑 Stop Loss (SL): 137.471
📝 Technical Thesis: On the 1H timeframe, $SPCXB is facing distribution pressure around 135.040 USDT (-7.29% 24h, Vol 25.75M USDT). Momentum remains capped below the 139.160 resistance (RSI 26), favoring a disciplined short setup on relief bounces.
⚠️ Khuyến cáo: Thông tin và các mốc Entry / TP / SL trên chỉ mang tính chất tham khảo dựa trên dữ liệu thị trường và góc nhìn phân tích kỹ thuật cá nhân, hoàn toàn không phải lời khuyên đầu tư tài chính. Vui lòng tự nghiên cứu (DYOR) và quản lý rủi ro chặt chẽ trước khi giao dịch.
#SPCXB #BinanceSquare #CryptoAnalysis
📊 TECHNICAL ANALYSIS: $SPCXB (SPCXBUSDT) — 🔴 SHORT
💰 Current Price: 135.040 USDT (24h: -7.29% | 24h Vol: 25.75M USDT)
📈 24h Range: Low 134.510 — High 147.520 | 1H Structure (EMA7: 135.886 • RSI: 26)
🎯 Entry Zone: 135.040 - 135.580
✅ Take Profit 1 (TP1): 128.288
✅ Take Profit 2 (TP2): 122.886
🛑 Stop Loss (SL): 137.471
📝 Technical Thesis: On the 1H timeframe, $SPCXB is facing distribution pressure around 135.040 USDT (-7.29% 24h, Vol 25.75M USDT). Momentum remains capped below the 139.160 resistance (RSI 26), favoring a disciplined short setup on relief bounces.
⚠️ Khuyến cáo: Thông tin và các mốc Entry / TP / SL trên chỉ mang tính chất tham khảo dựa trên dữ liệu thị trường và góc nhìn phân tích kỹ thuật cá nhân, hoàn toàn không phải lời khuyên đầu tư tài chính. Vui lòng tự nghiên cứu (DYOR) và quản lý rủi ro chặt chẽ trước khi giao dịch.
#SPCXB #BinanceSquare #CryptoAnalysis
💰 Current Price: 135.040 USDT (24h: -7.29% | 24h Vol: 25.75M USDT)
📈 24h Range: Low 134.510 — High 147.520 | 1H Structure (EMA7: 135.886 • RSI: 26)
🎯 Entry Zone: 135.040 - 135.580
✅ Take Profit 1 (TP1): 128.288
✅ Take Profit 2 (TP2): 122.886
🛑 Stop Loss (SL): 137.471
📝 Technical Thesis: On the 1H timeframe, $SPCXB is facing distribution pressure around 135.040 USDT (-7.29% 24h, Vol 25.75M USDT). Momentum remains capped below the 139.160 resistance (RSI 26), favoring a disciplined short setup on relief bounces.
⚠️ Khuyến cáo: Thông tin và các mốc Entry / TP / SL trên chỉ mang tính chất tham khảo dựa trên dữ liệu thị trường và góc nhìn phân tích kỹ thuật cá nhân, hoàn toàn không phải lời khuyên đầu tư tài chính. Vui lòng tự nghiên cứu (DYOR) và quản lý rủi ro chặt chẽ trước khi giao dịch.
#SPCXB #BinanceSquare #CryptoAnalysis
27
·
--
A -5.34% drop puts $SPCXB in a tight consolidation test.
Price currently trades at $137.06 with $24.35M in 24-hour volume.
Bull case: Holding above the 135.67 range low establishes a base for stabilization.
Bear case: A sustained break below 135.67 invalidates defense and signals further weakness.
Confirmation trigger: Reclaiming momentum requires a push toward the 147.52 range high.
Will buyers defend 135.67 to confirm stabilization, or does a breakdown trigger invalidation?
Tap $SPCXB for the live chart. #SPCXB #BinanceSquare
A -5.34% drop puts $SPCXB in a tight consolidation test.
Price currently trades at $137.06 with $24.35M in 24-hour volume.
Bull case: Holding above the 135.67 range low establishes a base for stabilization.
Bear case: A sustained break below 135.67 invalidates defense and signals further weakness.
Confirmation trigger: Reclaiming momentum requires a push toward the 147.52 range high.
Will buyers defend 135.67 to confirm stabilization, or does a breakdown trigger invalidation?
Tap $SPCXB for the live chart. #SPCXB #BinanceSquare
Price currently trades at $137.06 with $24.35M in 24-hour volume.
Bull case: Holding above the 135.67 range low establishes a base for stabilization.
Bear case: A sustained break below 135.67 invalidates defense and signals further weakness.
Confirmation trigger: Reclaiming momentum requires a push toward the 147.52 range high.
Will buyers defend 135.67 to confirm stabilization, or does a breakdown trigger invalidation?
Tap $SPCXB for the live chart. #SPCXB #BinanceSquare
1

·
--
$SPCXB -4.45% | $BTC -0.25% | $XRP -0.59%
#SPCXB slipped to $138.01, down 4.45% on $23.4 M of volume. The pullback hints at broader market caution.
#BTC traded at $62,979.14, easing 0.25% with $1.13 B moving hands. Its modest dip follows the recent stability around the $63k level.
#XRP priced at $0.9742, down 0.59% on $108.3 M of volume. The token’s slight slide may reflect lingering uncertainty after the latest legal developments.
👀 Keep an eye on whether the volume dip in SPCXB will deepen, potentially signalling a short‑term trend shift.
#Write2Earn #Binance
$SPCXB -4.45% | $BTC -0.25% | $XRP -0.59%
#SPCXB slipped to $138.01, down 4.45% on $23.4 M of volume. The pullback hints at broader market caution.
#BTC traded at $62,979.14, easing 0.25% with $1.13 B moving hands. Its modest dip follows the recent stability around the $63k level.
#XRP priced at $0.9742, down 0.59% on $108.3 M of volume. The token’s slight slide may reflect lingering uncertainty after the latest legal developments.
👀 Keep an eye on whether the volume dip in SPCXB will deepen, potentially signalling a short‑term trend shift.
#Write2Earn #Binance
#SPCXB slipped to $138.01, down 4.45% on $23.4 M of volume. The pullback hints at broader market caution.
#BTC traded at $62,979.14, easing 0.25% with $1.13 B moving hands. Its modest dip follows the recent stability around the $63k level.
#XRP priced at $0.9742, down 0.59% on $108.3 M of volume. The token’s slight slide may reflect lingering uncertainty after the latest legal developments.
👀 Keep an eye on whether the volume dip in SPCXB will deepen, potentially signalling a short‑term trend shift.
#Write2Earn #Binance
16

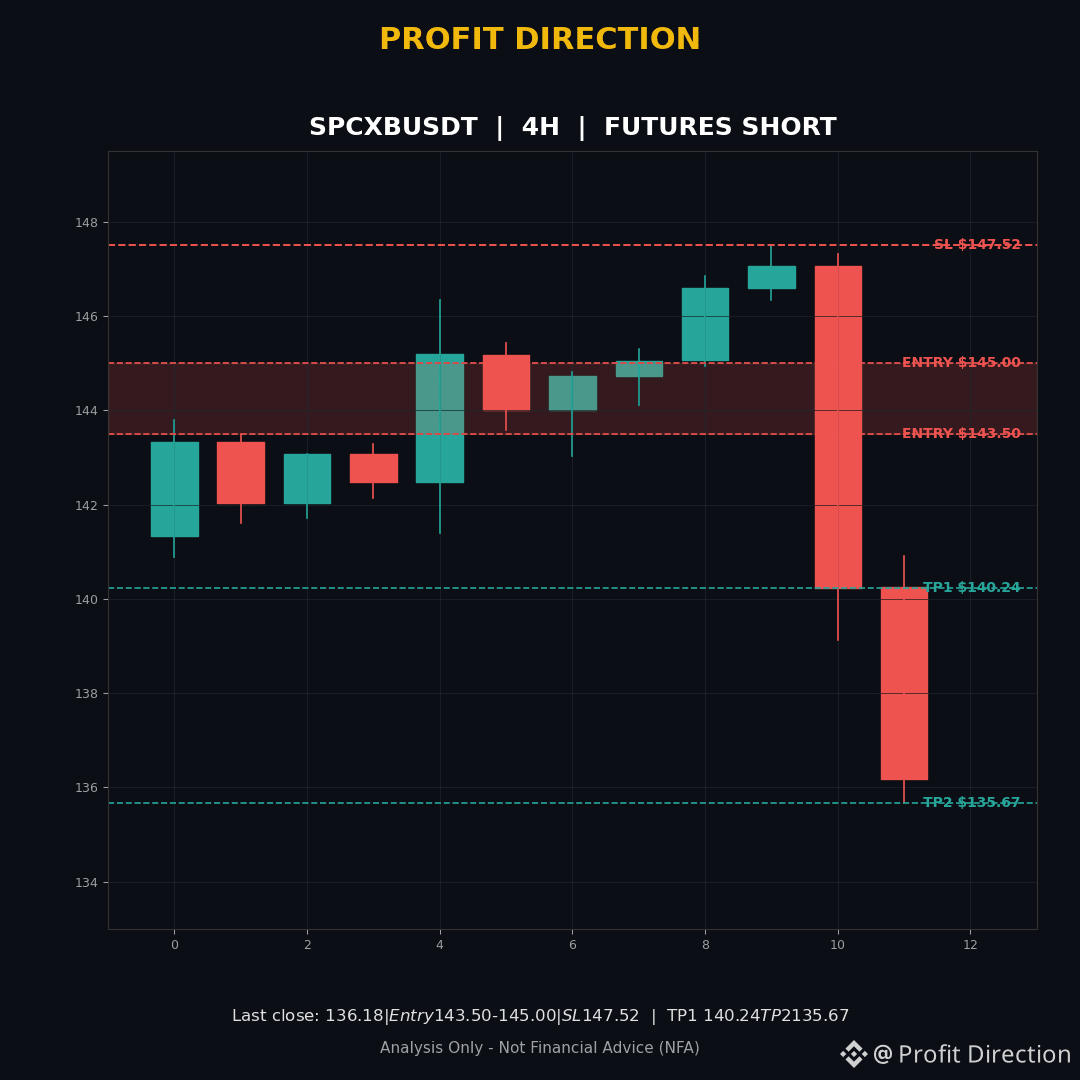
🔴 SPCXBUSDT — FUTURES SHORT (CONDITIONAL)
Entry Zone: $143.50 – $145.00 (awaiting retest — do NOT enter at the current price)
Stop Loss: $147.52 (4H close above $147.52)
TP1: $140.24
TP2: $135.67
R:R: 1:1.23 (TP1) | 1:2.62 (TP2)
TF: 4H
Why I like this one: the S&P index token broke down hard from $147.52 — one 4H candle fell from $147.06 to $140.24 on the heaviest volume in the window, then the next 4H candle kept falling and closed near its low at $136.76. That $143.50–$145.00 zone was support for days before it broke, so a bounce back up there should meet sellers again. I am waiting for that retest rather than chasing the fall, with my stop just above the high that has to hold.
Invalidation: a 4H close above $147.52 kills the idea — that would mean buyers took back the breakdown level.
Analysis Only — Not Financial Advice (NFA). Trading involves risk.
Follow Profit Direction for more signals, best signals and market updates. Share your opinion in the comments.
Do you think SPCXB will retest $145.00 first, or keep falling from here? Comment SHORT or LONG.
$SPCXB
#SPCXB #SPCXBUSDT #SP500 #CryptoTrading #FuturesTrading
🔴 SPCXBUSDT — FUTURES SHORT (CONDITIONAL)
Entry Zone: $143.50 – $145.00 (awaiting retest — do NOT enter at the current price)
Stop Loss: $147.52 (4H close above $147.52)
TP1: $140.24
TP2: $135.67
R:R: 1:1.23 (TP1) | 1:2.62 (TP2)
TF: 4H
Why I like this one: the S&P index token broke down hard from $147.52 — one 4H candle fell from $147.06 to $140.24 on the heaviest volume in the window, then the next 4H candle kept falling and closed near its low at $136.76. That $143.50–$145.00 zone was support for days before it broke, so a bounce back up there should meet sellers again. I am waiting for that retest rather than chasing the fall, with my stop just above the high that has to hold.
Invalidation: a 4H close above $147.52 kills the idea — that would mean buyers took back the breakdown level.
Analysis Only — Not Financial Advice (NFA). Trading involves risk.
Follow Profit Direction for more signals, best signals and market updates. Share your opinion in the comments.
Do you think SPCXB will retest $145.00 first, or keep falling from here? Comment SHORT or LONG.
$SPCXB
#SPCXB #SPCXBUSDT #SP500 #CryptoTrading #FuturesTrading
Entry Zone: $143.50 – $145.00 (awaiting retest — do NOT enter at the current price)
Stop Loss: $147.52 (4H close above $147.52)
TP1: $140.24
TP2: $135.67
R:R: 1:1.23 (TP1) | 1:2.62 (TP2)
TF: 4H
Why I like this one: the S&P index token broke down hard from $147.52 — one 4H candle fell from $147.06 to $140.24 on the heaviest volume in the window, then the next 4H candle kept falling and closed near its low at $136.76. That $143.50–$145.00 zone was support for days before it broke, so a bounce back up there should meet sellers again. I am waiting for that retest rather than chasing the fall, with my stop just above the high that has to hold.
Invalidation: a 4H close above $147.52 kills the idea — that would mean buyers took back the breakdown level.
Analysis Only — Not Financial Advice (NFA). Trading involves risk.
Follow Profit Direction for more signals, best signals and market updates. Share your opinion in the comments.
Do you think SPCXB will retest $145.00 first, or keep falling from here? Comment SHORT or LONG.
$SPCXB
#SPCXB #SPCXBUSDT #SP500 #CryptoTrading #FuturesTrading
1
·
--
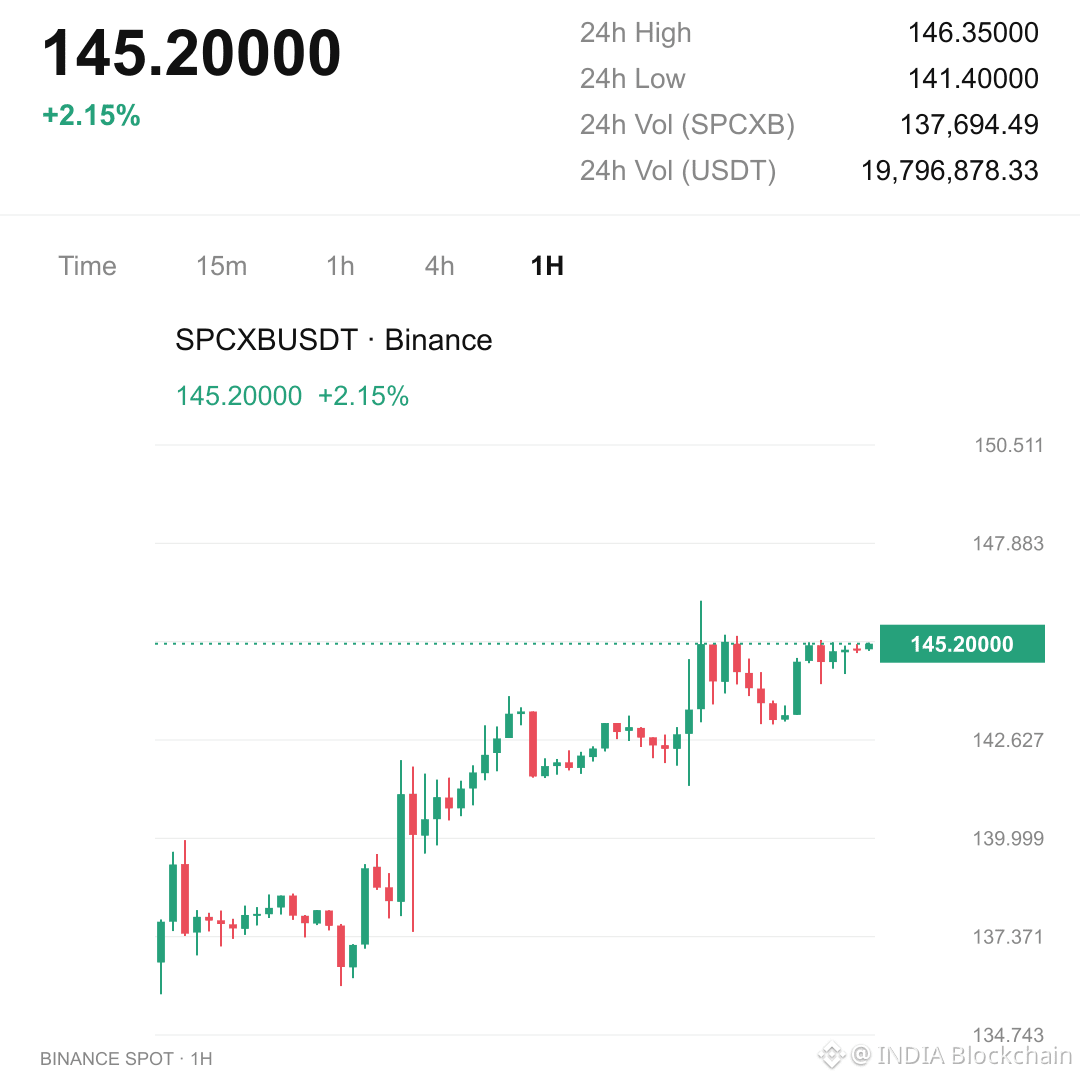
Holding +1.81%, $SPCXB faces a critical momentum versus risk test.
At $145.19 with $20.66M in 24-hour volume, price action remains tight. A conditional push above the 147.52 range high would confirm continuation strength. In contrast, slipping below the 141.4 low invalidates the short-term structure.
Will buyers drive a breakout above 147.52, or does a breakdown under 141.4 take control?
Tap $SPCXB for the live chart. #SPCXB #BinanceSquare
Holding +1.81%, $SPCXB faces a critical momentum versus risk test.
At $145.19 with $20.66M in 24-hour volume, price action remains tight. A conditional push above the 147.52 range high would confirm continuation strength. In contrast, slipping below the 141.4 low invalidates the short-term structure.
Will buyers drive a breakout above 147.52, or does a breakdown under 141.4 take control?
Tap $SPCXB for the live chart. #SPCXB #BinanceSquare
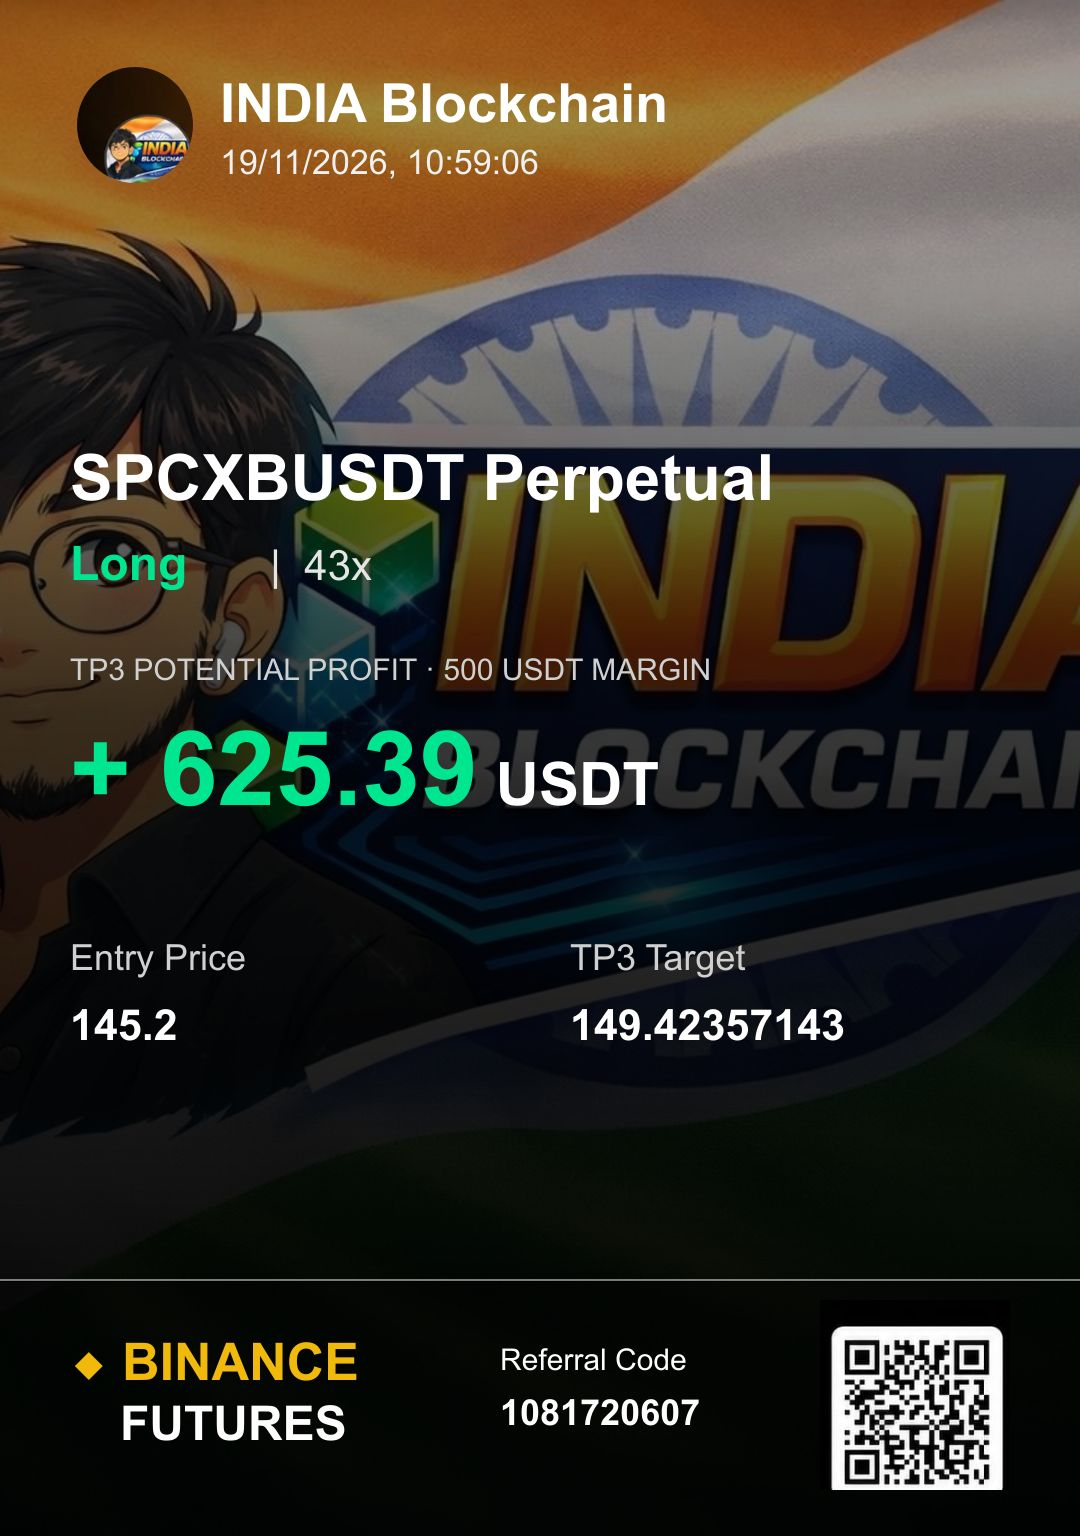
At $145.19 with $20.66M in 24-hour volume, price action remains tight. A conditional push above the 147.52 range high would confirm continuation strength. In contrast, slipping below the 141.4 low invalidates the short-term structure.
Will buyers drive a breakout above 147.52, or does a breakdown under 141.4 take control?
Tap $SPCXB for the live chart. #SPCXB #BinanceSquare
1

·
--
🚨 **ASMA DOLL PREMIUM SIGNAL**
**$SPCXB /USDT – SHORT 📉**
**Entry Zone:** $144.80 – $145.50
**Stop Loss (SL):** $147.60
**Take Profit Targets:**
- TP1: $143.50
- TP2: $142.00
- TP3: $140.50
Trade here $SPCXB
{spot}(SPCXBUSDT)
**Market Analysis:**
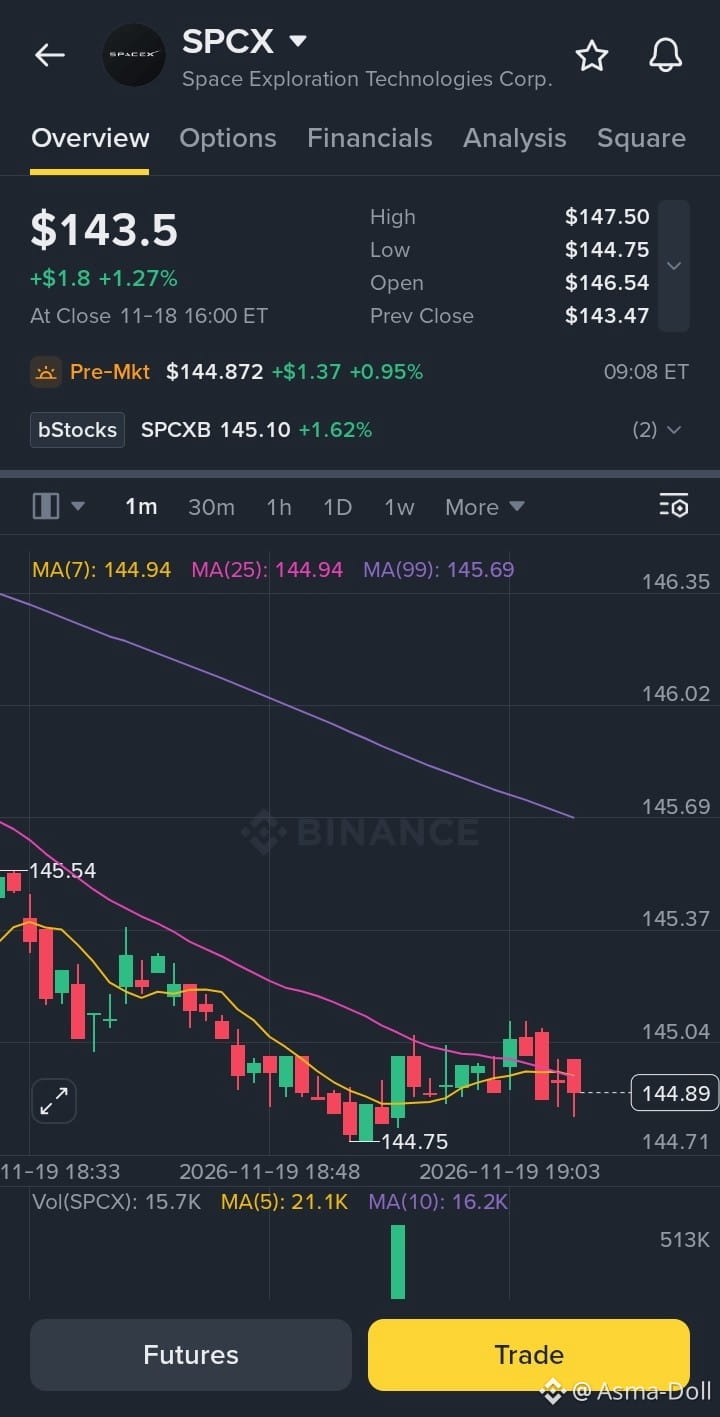
SPCX is showing signs of weakness after facing rejection near the $147.50 resistance zone.
- Price is trading around $143.50, showing limited bullish momentum.
- MA(7) and MA(25) are both near $144.94, indicating weak short-term direction.
- MA(99) at $145.69 acts as overhead resistance.
- Buyers have not established a strong recovery above the moving averages.
- A rejection from the $145.00–$145.70 zone could trigger another downward move.
**Confirmation:**
A clean breakdown below $143.40 with increasing selling volume could strengthen the bearish setup.
⚠️ **Invalidation:** Sustained movement above $147.60 weakens this short idea.
Trade smart. Manage your risk! ⚡
#SPCXB #ShortSignal #CryptoTrading #BinanceSquare #AsmaDoll
Note: This is a conditional technical setup based on your supplied snapshot, not verified live execution pricing. Confirm the chart and liquidity before entering.
🚨 **ASMA DOLL PREMIUM SIGNAL**
**$SPCXB /USDT – SHORT 📉**
**Entry Zone:** $144.80 – $145.50
**Stop Loss (SL):** $147.60
**Take Profit Targets:**
- TP1: $143.50
- TP2: $142.00
- TP3: $140.50
Trade here $SPCXB
**Market Analysis:**
SPCX is showing signs of weakness after facing rejection near the $147.50 resistance zone.
- Price is trading around $143.50, showing limited bullish momentum.
- MA(7) and MA(25) are both near $144.94, indicating weak short-term direction.
- MA(99) at $145.69 acts as overhead resistance.
- Buyers have not established a strong recovery above the moving averages.
- A rejection from the $145.00–$145.70 zone could trigger another downward move.
**Confirmation:**
A clean breakdown below $143.40 with increasing selling volume could strengthen the bearish setup.
⚠️ **Invalidation:** Sustained movement above $147.60 weakens this short idea.
Trade smart. Manage your risk! ⚡
#SPCXB #ShortSignal #CryptoTrading #BinanceSquare #AsmaDoll
Note: This is a conditional technical setup based on your supplied snapshot, not verified live execution pricing. Confirm the chart and liquidity before entering.
**$SPCXB /USDT – SHORT 📉**
**Entry Zone:** $144.80 – $145.50
**Stop Loss (SL):** $147.60
**Take Profit Targets:**
- TP1: $143.50
- TP2: $142.00
- TP3: $140.50
Trade here $SPCXB
**Market Analysis:**
SPCX is showing signs of weakness after facing rejection near the $147.50 resistance zone.
- Price is trading around $143.50, showing limited bullish momentum.
- MA(7) and MA(25) are both near $144.94, indicating weak short-term direction.
- MA(99) at $145.69 acts as overhead resistance.
- Buyers have not established a strong recovery above the moving averages.
- A rejection from the $145.00–$145.70 zone could trigger another downward move.
**Confirmation:**
A clean breakdown below $143.40 with increasing selling volume could strengthen the bearish setup.
⚠️ **Invalidation:** Sustained movement above $147.60 weakens this short idea.
Trade smart. Manage your risk! ⚡
#SPCXB #ShortSignal #CryptoTrading #BinanceSquare #AsmaDoll
Note: This is a conditional technical setup based on your supplied snapshot, not verified live execution pricing. Confirm the chart and liquidity before entering.
4
29

·
--
📊 Crypto Market Analysis – November 19, 2026
🐸 $PEPE : Showing a small recovery, but the overall trend remains weak. Watch $0.00000366 support and $0.000004 resistance.
₮ $TRX : Watch for a breakout with strong buying volume. Market confirmation is important before taking a position.
Market Outlook: Stay cautious, manage risk, and wait for confirmation before entering new trades.
#PEPE #TRX #CryptoAnalysis #CryptoMarket #Trading
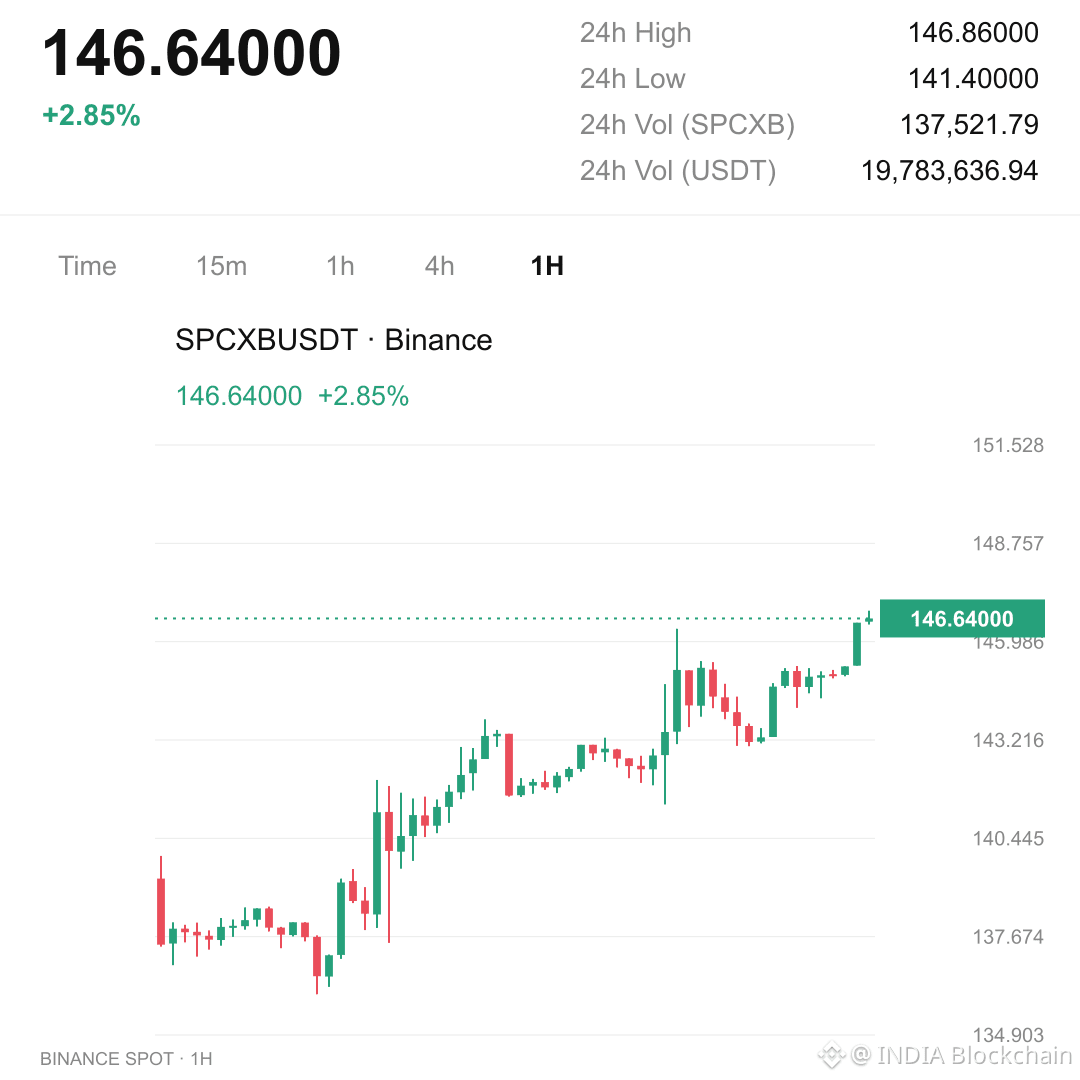
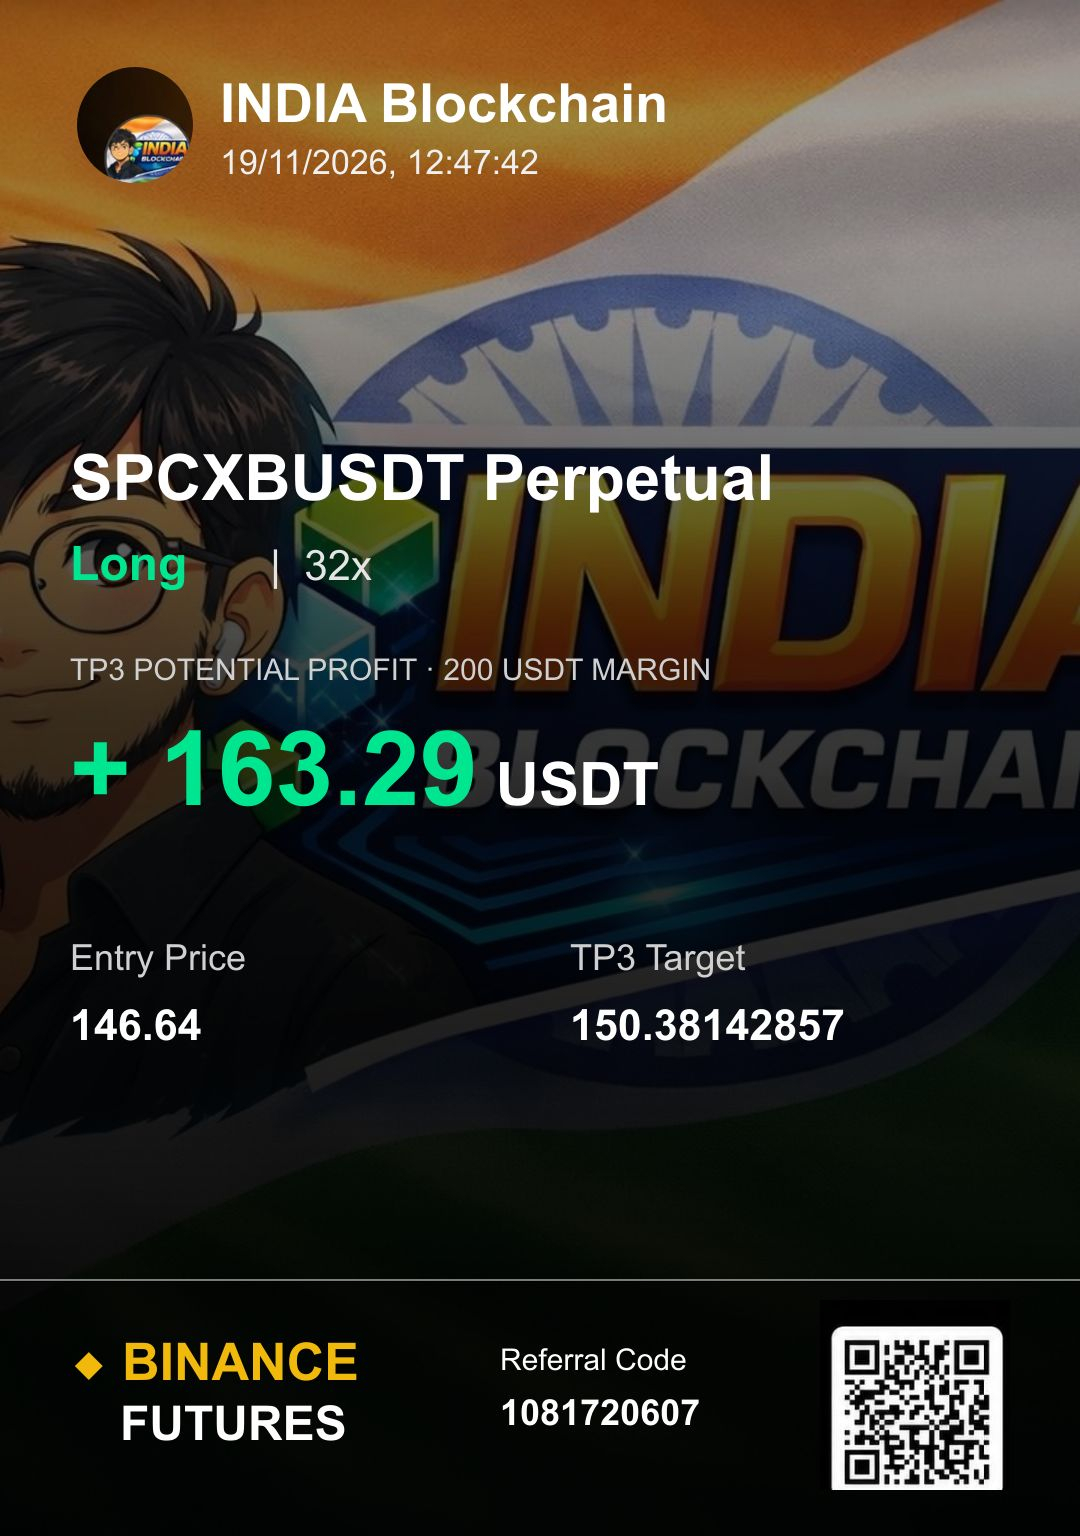
🚀 $SPCXB (SpaceX Tokenized Stock): Trading around $144.52, showing short-term recovery. Support is near $141.40, while $146 resistance is the key breakout level. A strong move above resistance could improve bullish momentum.
📈 Overall Strategy: Watch support, volume, and breakout confirmation. Avoid emotional trading and manage risk carefully.
#SPCXB #CryptoTrading #MarketUpdate
{spot}(PEPEUSDT)
{future}(TRXUSDT)
{spot}(SPCXBUSDT)
📊 Crypto Market Analysis – November 19, 2026
🐸 $PEPE : Showing a small recovery, but the overall trend remains weak. Watch $0.00000366 support and $0.000004 resistance.
₮ $TRX : Watch for a breakout with strong buying volume. Market confirmation is important before taking a position.
Market Outlook: Stay cautious, manage risk, and wait for confirmation before entering new trades.
#PEPE #TRX #CryptoAnalysis #CryptoMarket #Trading
🚀 $SPCXB (SpaceX Tokenized Stock): Trading around $144.52, showing short-term recovery. Support is near $141.40, while $146 resistance is the key breakout level. A strong move above resistance could improve bullish momentum.
📈 Overall Strategy: Watch support, volume, and breakout confirmation. Avoid emotional trading and manage risk carefully.
#SPCXB #CryptoTrading #MarketUpdate
🐸 $PEPE : Showing a small recovery, but the overall trend remains weak. Watch $0.00000366 support and $0.000004 resistance.
₮ $TRX : Watch for a breakout with strong buying volume. Market confirmation is important before taking a position.
Market Outlook: Stay cautious, manage risk, and wait for confirmation before entering new trades.
#PEPE #TRX #CryptoAnalysis #CryptoMarket #Trading
🚀 $SPCXB (SpaceX Tokenized Stock): Trading around $144.52, showing short-term recovery. Support is near $141.40, while $146 resistance is the key breakout level. A strong move above resistance could improve bullish momentum.
📈 Overall Strategy: Watch support, volume, and breakout confirmation. Avoid emotional trading and manage risk carefully.
#SPCXB #CryptoTrading #MarketUpdate

58
·
--
$SPCXB +3.01% | $INTCB +2.81% | $KMNO +2.36%
#SPCXB sits at $146.86, up +3.01% on $19.9 M of volume. The price climb is modest but the hefty flow suggests some fresh buying interest.
#INTCB trades around $57.07, gaining +2.81% with $6.5 M moving hands. Momentum appears steady, though the volume is noticeably lower than SPCXB’s.
#KMNO is at $0.0260, up +2.36% on $1.0 M of volume. A small‑cap rally, but the thin turnover means price swings could be volatile.
🔎 Watch whether SPCXB can sustain its volume‑driven rise as the session progresses.
#Write2Earn #Binance
$SPCXB +3.01% | $INTCB +2.81% | $KMNO +2.36%
#SPCXB sits at $146.86, up +3.01% on $19.9 M of volume. The price climb is modest but the hefty flow suggests some fresh buying interest.
#INTCB trades around $57.07, gaining +2.81% with $6.5 M moving hands. Momentum appears steady, though the volume is noticeably lower than SPCXB’s.
#KMNO is at $0.0260, up +2.36% on $1.0 M of volume. A small‑cap rally, but the thin turnover means price swings could be volatile.
🔎 Watch whether SPCXB can sustain its volume‑driven rise as the session progresses.
#Write2Earn #Binance
#SPCXB sits at $146.86, up +3.01% on $19.9 M of volume. The price climb is modest but the hefty flow suggests some fresh buying interest.
#INTCB trades around $57.07, gaining +2.81% with $6.5 M moving hands. Momentum appears steady, though the volume is noticeably lower than SPCXB’s.
#KMNO is at $0.0260, up +2.36% on $1.0 M of volume. A small‑cap rally, but the thin turnover means price swings could be volatile.
🔎 Watch whether SPCXB can sustain its volume‑driven rise as the session progresses.
#Write2Earn #Binance
1
·
--
$SPCXB trades at $147.08, attempting a breakout past its 23-hour high.
The move brings a +2.92% gain on $19.56M 24-hour volume, topping the prior 146.86 ceiling.
Bull case: Holding above 146.86 confirms buyer control and opens room for expansion.
Bear case: Slipping back below 146.86 warns of late-entry risk toward the 141.4 low.
Confirmation trigger: Watch for a defended retest at 146.86 to validate genuine demand.
Will buyers protect 146.86 to confirm the breakout, or will rejection send price toward 141.4?
Tap $SPCXB for the live chart. #SPCXB #BinanceSquare
$SPCXB trades at $147.08, attempting a breakout past its 23-hour high.
The move brings a +2.92% gain on $19.56M 24-hour volume, topping the prior 146.86 ceiling.
Bull case: Holding above 146.86 confirms buyer control and opens room for expansion.
Bear case: Slipping back below 146.86 warns of late-entry risk toward the 141.4 low.
Confirmation trigger: Watch for a defended retest at 146.86 to validate genuine demand.
Will buyers protect 146.86 to confirm the breakout, or will rejection send price toward 141.4?
Tap $SPCXB for the live chart. #SPCXB #BinanceSquare
The move brings a +2.92% gain on $19.56M 24-hour volume, topping the prior 146.86 ceiling.
Bull case: Holding above 146.86 confirms buyer control and opens room for expansion.
Bear case: Slipping back below 146.86 warns of late-entry risk toward the 141.4 low.
Confirmation trigger: Watch for a defended retest at 146.86 to validate genuine demand.
Will buyers protect 146.86 to confirm the breakout, or will rejection send price toward 141.4?
Tap $SPCXB for the live chart. #SPCXB #BinanceSquare
4


·
--
$SPCXB 🟢📊
Is SPCXBUSDT about to break through a key resistance level? An unfiltered look at the technical behavior ⚡
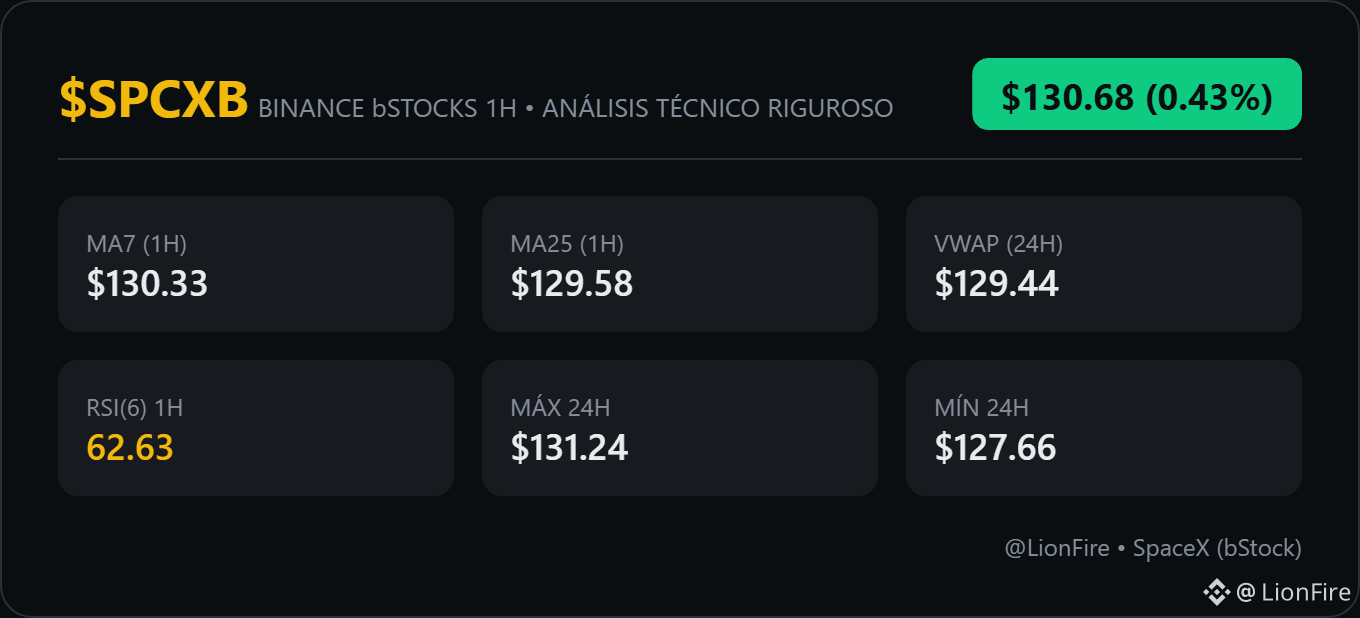
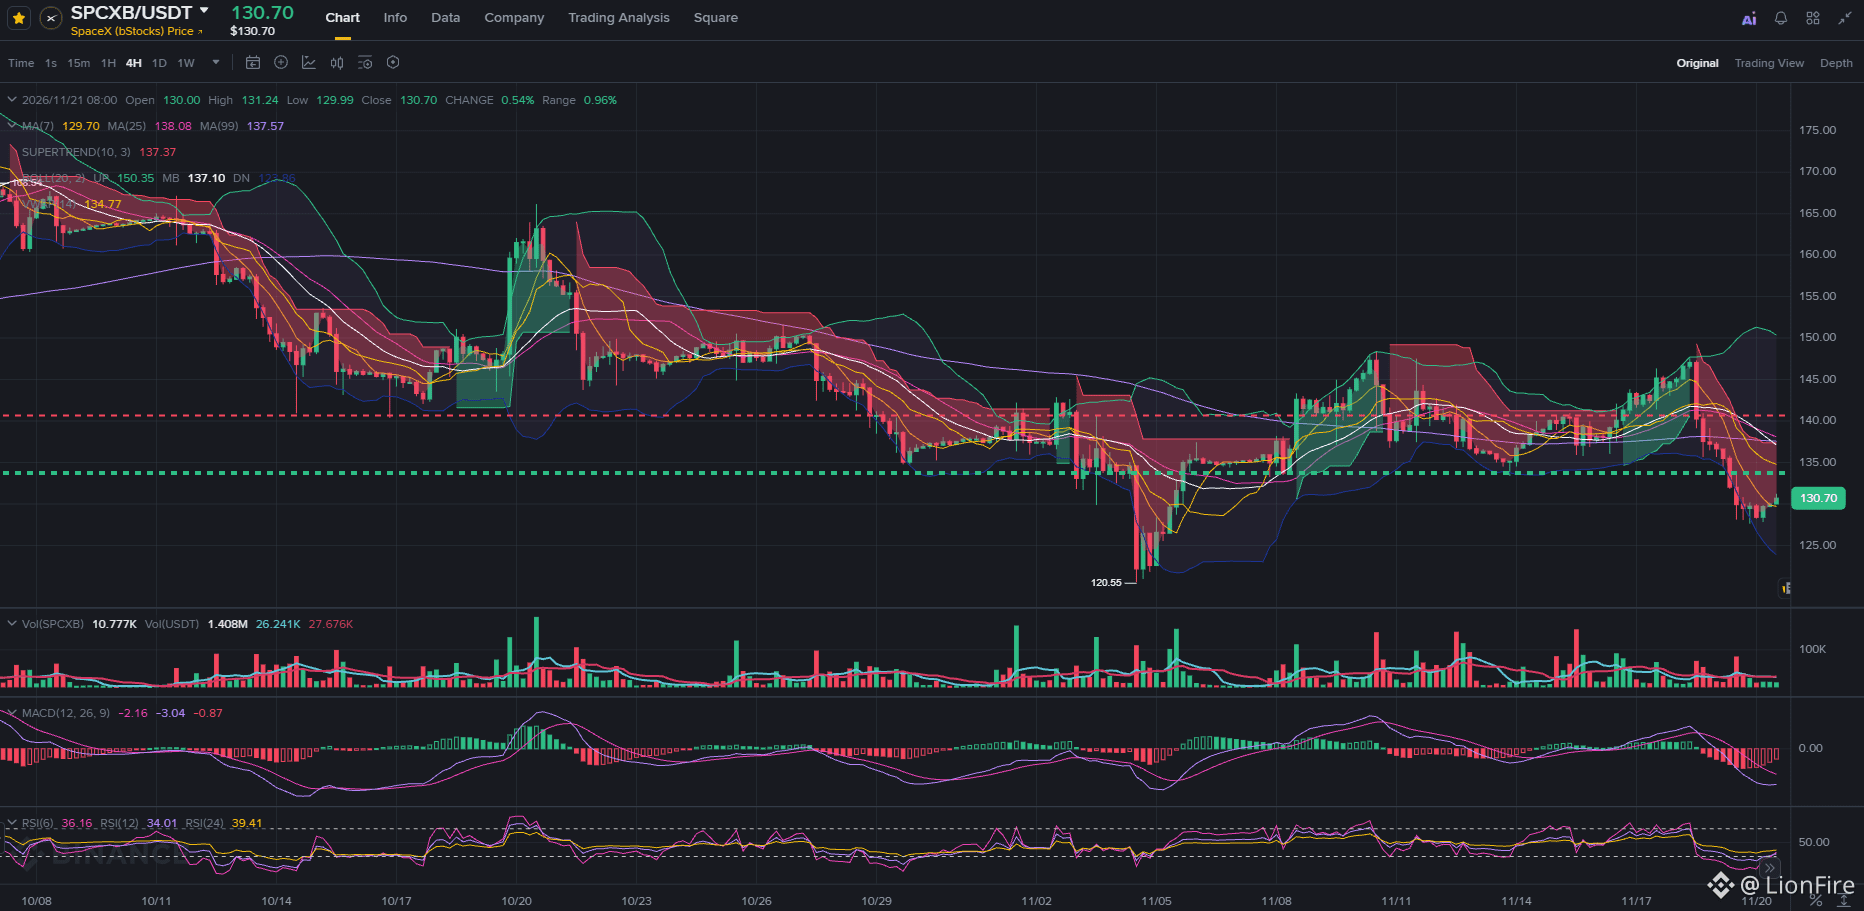
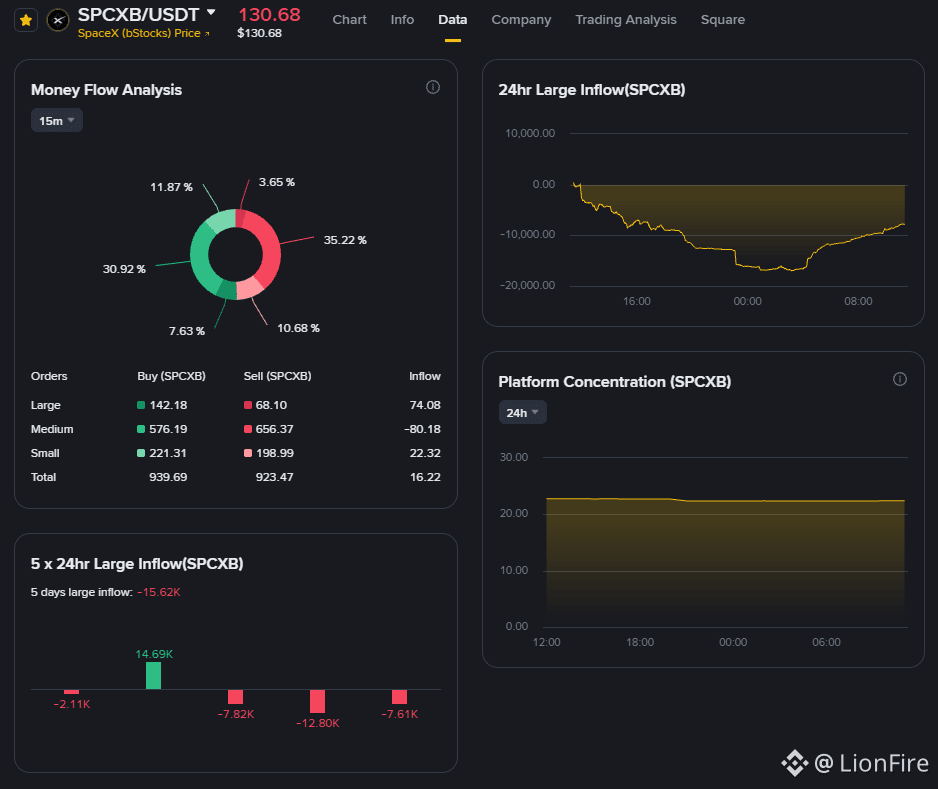
With $SPCXB trading at $130.68, very close to the 7-day moving average ($130.33), the market suggests possible consolidation or an upward breakout. The 1-hour RSI(6) at 62.63 indicates a balance between buyers and sellers, with potential for a significant technical move.
📊 1. Technical overview:
🟢 The price is above the MA7 ($130.33), the MA25 ($129.58), and the 24h VWAP ($129.44).
⚖️ The 1-hour chart structure shows a clear uptrend, with solid support at $127.66.
⚡ The RSI(6) at 62.63 suggests that buying momentum is healthy, with no imminent overbought signals.
⚠️ 2. Structural risk:
Although the current consolidation looks favorable, the proximity to the 24h high resistance ($131.24) creates significant technical tension. If volume does not confirm a clear breakout, unexpected pullbacks could occur.
💡
$SPCXB is in a favorable position to continue rising, but beware of FOMO euphoria and chasing green candles without a plan. Keep a cool head and don't let emotion lead you to make impulsive decisions.
#bStocks #CryptoAnalysis #SPCXB
$SPCXB 🟢📊
Is SPCXBUSDT about to break through a key resistance level? An unfiltered look at the technical behavior ⚡
With $SPCXB trading at $130.68, very close to the 7-day moving average ($130.33), the market suggests possible consolidation or an upward breakout. The 1-hour RSI(6) at 62.63 indicates a balance between buyers and sellers, with potential for a significant technical move.
📊 1. Technical overview:
🟢 The price is above the MA7 ($130.33), the MA25 ($129.58), and the 24h VWAP ($129.44).
⚖️ The 1-hour chart structure shows a clear uptrend, with solid support at $127.66.
⚡ The RSI(6) at 62.63 suggests that buying momentum is healthy, with no imminent overbought signals.
⚠️ 2. Structural risk:
Although the current consolidation looks favorable, the proximity to the 24h high resistance ($131.24) creates significant technical tension. If volume does not confirm a clear breakout, unexpected pullbacks could occur.
💡
$SPCXB is in a favorable position to continue rising, but beware of FOMO euphoria and chasing green candles without a plan. Keep a cool head and don't let emotion lead you to make impulsive decisions.
#bStocks #CryptoAnalysis #SPCXB
Is SPCXBUSDT about to break through a key resistance level? An unfiltered look at the technical behavior ⚡
With $SPCXB trading at $130.68, very close to the 7-day moving average ($130.33), the market suggests possible consolidation or an upward breakout. The 1-hour RSI(6) at 62.63 indicates a balance between buyers and sellers, with potential for a significant technical move.
📊 1. Technical overview:
🟢 The price is above the MA7 ($130.33), the MA25 ($129.58), and the 24h VWAP ($129.44).
⚖️ The 1-hour chart structure shows a clear uptrend, with solid support at $127.66.
⚡ The RSI(6) at 62.63 suggests that buying momentum is healthy, with no imminent overbought signals.
⚠️ 2. Structural risk:
Although the current consolidation looks favorable, the proximity to the 24h high resistance ($131.24) creates significant technical tension. If volume does not confirm a clear breakout, unexpected pullbacks could occur.
💡
$SPCXB is in a favorable position to continue rising, but beware of FOMO euphoria and chasing green candles without a plan. Keep a cool head and don't let emotion lead you to make impulsive decisions.
#bStocks #CryptoAnalysis #SPCXB
56

·
--
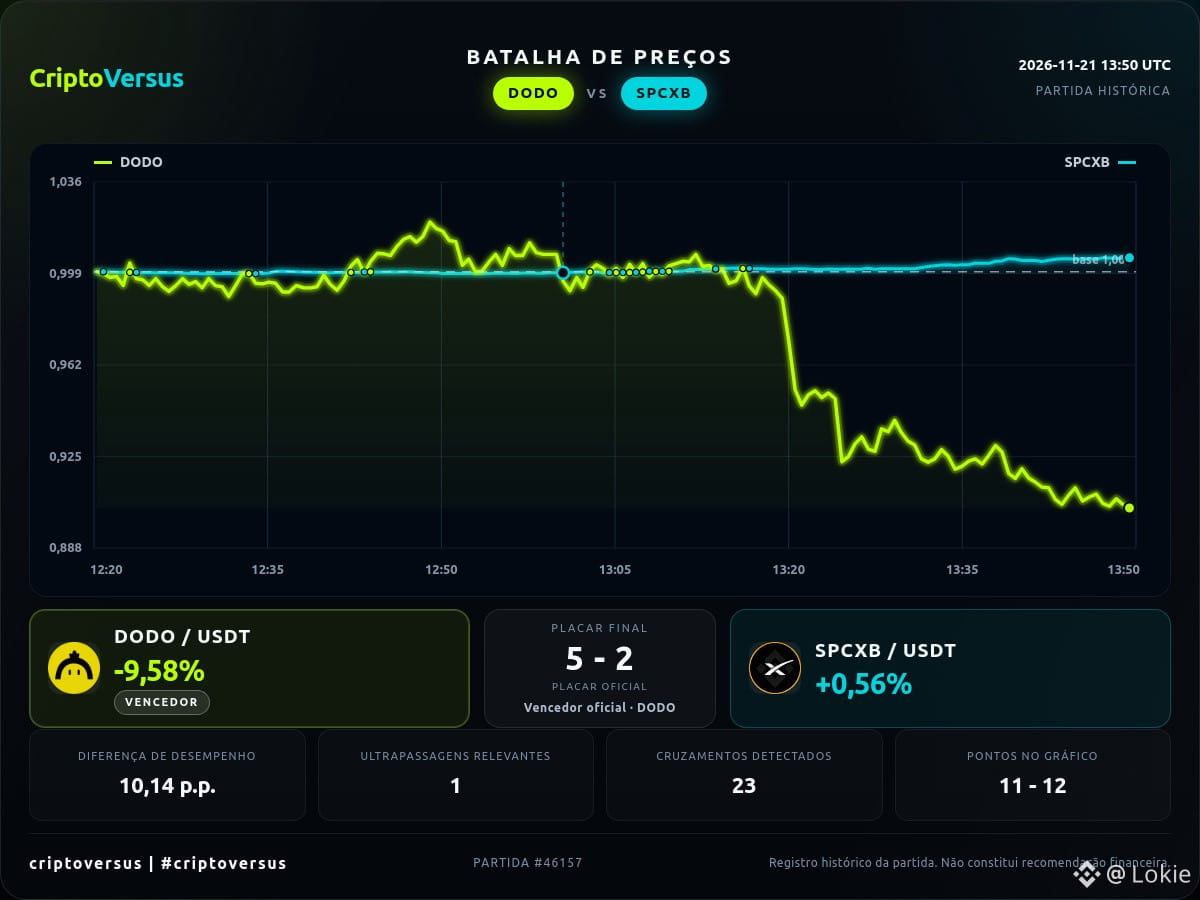
Two trajectories over the same period: DODO and SPCXB
DODO vs. SPCXB: their relative performance curves crossed 23 times, with the advantage alternating between the assets. DODO: -9.6% | SPCXB: +0.6%.
A snapshot of the matchup, not a market forecast.
Which aspect of this contest deserves a deeper analysis?
#CriptoVersus #PriceBattle #DODO #SPCXB
Historical and informational content; not financial advice.
Two trajectories over the same period: DODO and SPCXB
DODO vs. SPCXB: their relative performance curves crossed 23 times, with the advantage alternating between the assets. DODO: -9.6% | SPCXB: +0.6%.
A snapshot of the matchup, not a market forecast.
Which aspect of this contest deserves a deeper analysis?
#CriptoVersus #PriceBattle #DODO #SPCXB
Historical and informational content; not financial advice.
DODO vs. SPCXB: their relative performance curves crossed 23 times, with the advantage alternating between the assets. DODO: -9.6% | SPCXB: +0.6%.
A snapshot of the matchup, not a market forecast.
Which aspect of this contest deserves a deeper analysis?
#CriptoVersus #PriceBattle #DODO #SPCXB
Historical and informational content; not financial advice.
59

·
--
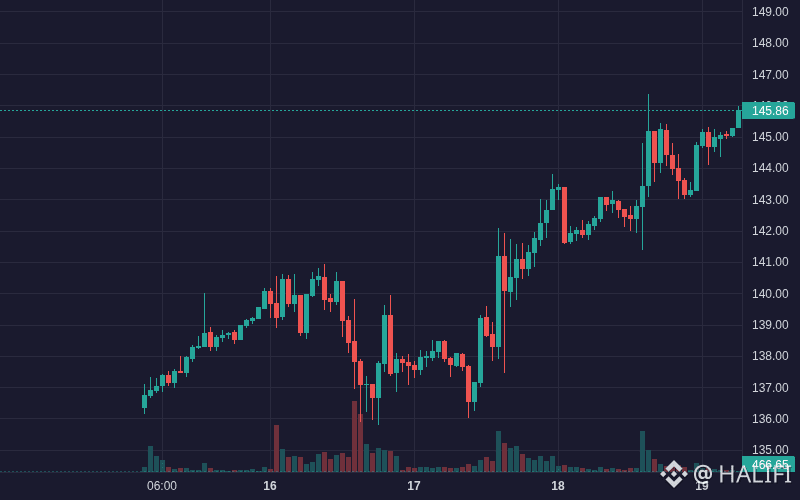
$SPCXB SPCXB is showing bullish movement: 2.69% (Crypto).
Volume: 19.70M | Last: $145.99
Key signals: high trader activity.
Bias Daily: BULLISH 🟢 | Weekly: BULLISH 🟢
SPCXB gained 1.99% over 24h to $145.04, supported by institutional financing reports and high-volume breakout buying.
**Institutional financing optimism (High)**: Apollo and other institutions reportedly committed ~$40B in GPU financing for computing infrastructure → lifted sentiment across tokenized equity assets.
- **Volume & capital surge (High)**: Spot volume spiked past $11.1M alongside +$452K net inflow and +$481K large-order inflows → propelled price from $142.78 to highs above $145.
- **DeFi yield traction (Medium)**: Elevated staking yields (up to 179% APY) boosted ecosystem demand and lockup incentives.
#SPCXB #Bitcoin #BinanceSquare #TerraClassic #Crypto
$SPCXB SPCXB is showing bullish movement: 2.69% (Crypto).
Volume: 19.70M | Last: $145.99
Key signals: high trader activity.
Bias Daily: BULLISH 🟢 | Weekly: BULLISH 🟢
SPCXB gained 1.99% over 24h to $145.04, supported by institutional financing reports and high-volume breakout buying.
**Institutional financing optimism (High)**: Apollo and other institutions reportedly committed ~$40B in GPU financing for computing infrastructure → lifted sentiment across tokenized equity assets.
- **Volume & capital surge (High)**: Spot volume spiked past $11.1M alongside +$452K net inflow and +$481K large-order inflows → propelled price from $142.78 to highs above $145.
- **DeFi yield traction (Medium)**: Elevated staking yields (up to 179% APY) boosted ecosystem demand and lockup incentives.
#SPCXB #Bitcoin #BinanceSquare #TerraClassic #Crypto
Volume: 19.70M | Last: $145.99
Key signals: high trader activity.
Bias Daily: BULLISH 🟢 | Weekly: BULLISH 🟢
SPCXB gained 1.99% over 24h to $145.04, supported by institutional financing reports and high-volume breakout buying.
**Institutional financing optimism (High)**: Apollo and other institutions reportedly committed ~$40B in GPU financing for computing infrastructure → lifted sentiment across tokenized equity assets.
- **Volume & capital surge (High)**: Spot volume spiked past $11.1M alongside +$452K net inflow and +$481K large-order inflows → propelled price from $142.78 to highs above $145.
- **DeFi yield traction (Medium)**: Elevated staking yields (up to 179% APY) boosted ecosystem demand and lockup incentives.
#SPCXB #Bitcoin #BinanceSquare #TerraClassic #Crypto
10
Log in to explore more content
Join global crypto users on Binance Square
⚡️ Get latest and useful information about crypto.
💬 Trusted by the world’s largest crypto exchange.
👍 Discover real insights from verified creators.
Email / Phone number
Trending Topics
1
#BTCReboundsAbove$60KAmidWhaleDipBuying
32,541 views
185 Discussing
2
#SolanaSets2027RoadmapToDoubleComputeCapacity
15,737 views
441 Discussing
3
#CaliforniaNvidiaProbeExaminesPotentialCriminalViolations
4,806 views
61 Discussing
4
#BlackRockLaunchesHKDollarDigitalLiquidityFund
12,217 views
378 Discussing
5
#NvidiaLoses$2.7TrillionInMonthAndAHalf
59,460 views
264 Discussing
6
#GlobalStocksFaceLongestLosingStreakSince2023
485,945 views
3,099 Discussing
7
#BlackRockIBITPostsRecord$541MSingleDayOutflow
77,512 views
159 Discussing
8
#AnthropicPlungesTowardIPOPriceonDay2
263,483 views
2,051 Discussing
9
#TwentyOneCapitalAdds172.25BTC
132,627 views
1,395 Discussing
10
#HKBillWouldExcludeTokenizedDepositsFromVirtualAssets
16,281 views
95 Discussing