
#osmo
osmo
341,211 views
3,028 Discussing
Hot
Latest

·
--
Bullish
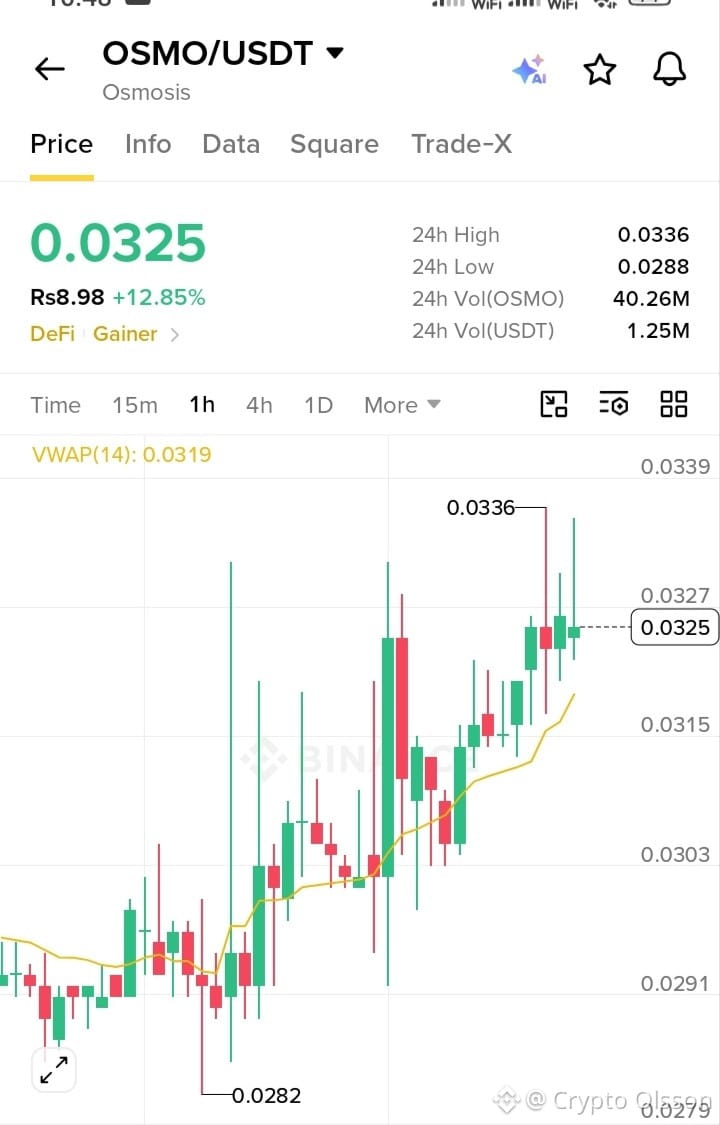
$OSMO Can Bulls Break Above $0.0336?
Trade Setup: Long
Entry Zone: 0.03180 – 0.03250
Tp1: 0.03360 Tp2: 0.03480 Tp3: 0.03650
SL: 0.03030
#OSMO is showing strong bullish momentum with a 12.85% daily gain and trading above VWAP at 0.0319. Buyers are approaching the $0.0336 resistance zone. A confirmed breakout could open the way toward $0.0348 and $0.0365. Watch volume and avoid chasing if price gets rejected.
Trade Here On $OSMO 👇.
{spot}(OSMOUSDT)
$OSMO Can Bulls Break Above $0.0336?
Trade Setup: Long
Entry Zone: 0.03180 – 0.03250
Tp1: 0.03360 Tp2: 0.03480 Tp3: 0.03650
SL: 0.03030
#OSMO is showing strong bullish momentum with a 12.85% daily gain and trading above VWAP at 0.0319. Buyers are approaching the $0.0336 resistance zone. A confirmed breakout could open the way toward $0.0348 and $0.0365. Watch volume and avoid chasing if price gets rejected.
Trade Here On $OSMO 👇.
Trade Setup: Long
Entry Zone: 0.03180 – 0.03250
Tp1: 0.03360 Tp2: 0.03480 Tp3: 0.03650
SL: 0.03030
#OSMO is showing strong bullish momentum with a 12.85% daily gain and trading above VWAP at 0.0319. Buyers are approaching the $0.0336 resistance zone. A confirmed breakout could open the way toward $0.0348 and $0.0365. Watch volume and avoid chasing if price gets rejected.
Trade Here On $OSMO 👇.
1
66

·
--
$OSMO +10.51% | $SC +10.24% | $USUAL +9.56%
#OSMO nudged up to $0.0326, climbing +10.51% on $1.1 M of volume. The DEX’s cross‑chain pull seems to be resonating as traders pile in.
#SC rose to $0.00060300, gaining +10.24% with $1.2 M changing hands. Momentum is clear, though the thin price could still wobble on larger moves.
#USUAL jumped to $0.0116, up +9.56% on a solid $3.8 M volume. The surge hints at renewed interest, but watch for any pullback if broader market sentiment shifts.
👀 Keep an eye on whether the volume spikes translate into sustained buying pressure across these midsize caps.
#Write2Earn #Binance
$OSMO +10.51% | $SC +10.24% | $USUAL +9.56%
#OSMO nudged up to $0.0326, climbing +10.51% on $1.1 M of volume. The DEX’s cross‑chain pull seems to be resonating as traders pile in.
#SC rose to $0.00060300, gaining +10.24% with $1.2 M changing hands. Momentum is clear, though the thin price could still wobble on larger moves.
#USUAL jumped to $0.0116, up +9.56% on a solid $3.8 M volume. The surge hints at renewed interest, but watch for any pullback if broader market sentiment shifts.
👀 Keep an eye on whether the volume spikes translate into sustained buying pressure across these midsize caps.
#Write2Earn #Binance
#OSMO nudged up to $0.0326, climbing +10.51% on $1.1 M of volume. The DEX’s cross‑chain pull seems to be resonating as traders pile in.
#SC rose to $0.00060300, gaining +10.24% with $1.2 M changing hands. Momentum is clear, though the thin price could still wobble on larger moves.
#USUAL jumped to $0.0116, up +9.56% on a solid $3.8 M volume. The surge hints at renewed interest, but watch for any pullback if broader market sentiment shifts.
👀 Keep an eye on whether the volume spikes translate into sustained buying pressure across these midsize caps.
#Write2Earn #Binance
11

·
--
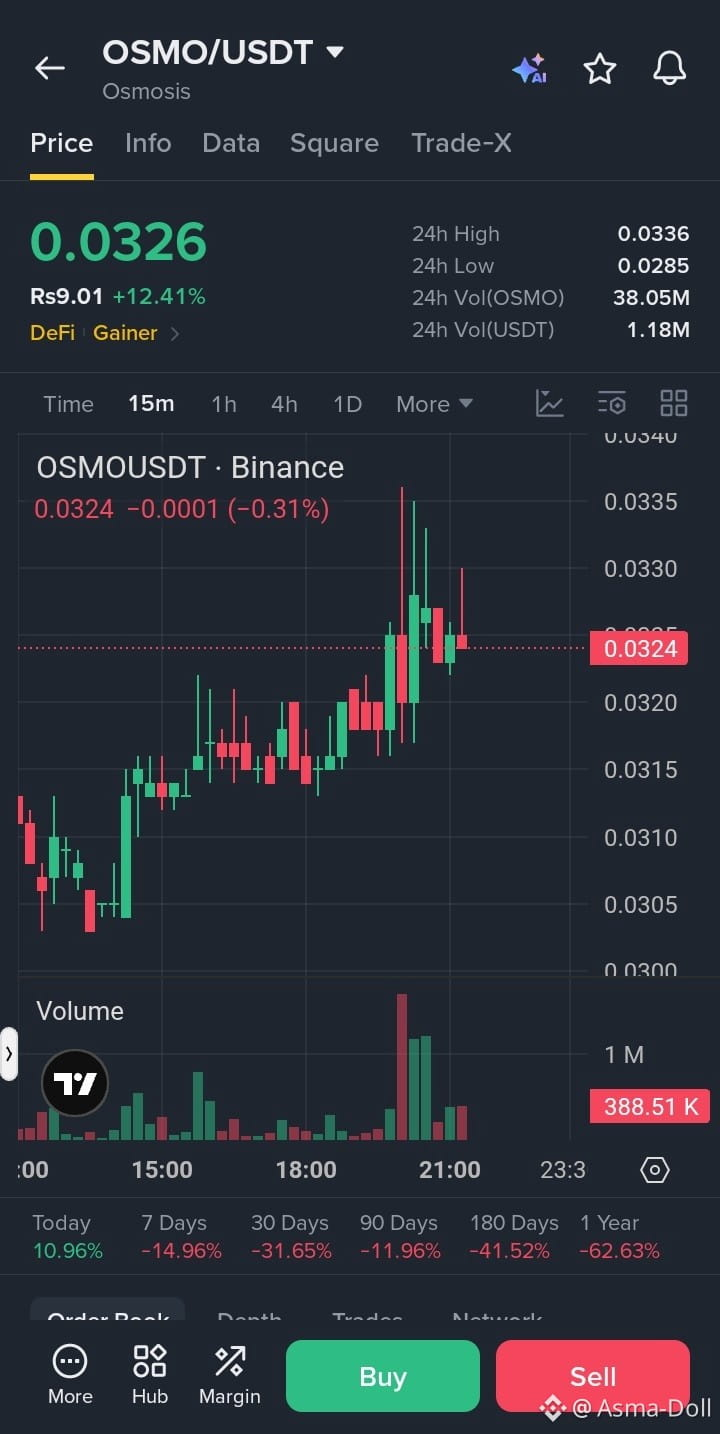
🔥 **ASMA DOLL PREMIUM SIGNAL**
🔴 **$OSMO /USDT – SHORT**
**Current Price:** $0.0326
**Entry Zone:** $0.0325 – $0.0335
**Stop Loss (SL):** $0.0350
🎯 **Take Profit Targets:**
- TP1: $0.0315
- TP2: $0.0305
- TP3: $0.0290
Trade here $OSMO
{spot}(OSMOUSDT)
📉 **Market Analysis:**
OSMO is showing a strong short-term rally of +12.41%, approaching its 24-hour high of $0.0336.
- Price is facing potential resistance near $0.0335–$0.0336.
- The recent upward move may attract profit-taking.
- Trading near the daily high increases the risk of a rejection.
- Broader price performance remains weak, with a 7-day decline of approximately 14.96%.
- A failure to hold above $0.0320 could trigger further downside.
**Confirmation:**
A clear rejection from $0.0335–$0.0336 followed by a breakdown below $0.0320 would strengthen the bearish setup.
⚠️ **Trade Smart:** Avoid entering blindly during strong upward momentum. Wait for bearish confirmation.
#OSMO #Osmosis #CryptoSignals #BinanceSquare #ASMADOLL
Note: This is a conditional short setup based on the supplied snapshot, not a confirmed bearish reversal. The 15m/1h chart structure should be checked before entry.
🔥 **ASMA DOLL PREMIUM SIGNAL**
🔴 **$OSMO /USDT – SHORT**
**Current Price:** $0.0326
**Entry Zone:** $0.0325 – $0.0335
**Stop Loss (SL):** $0.0350
🎯 **Take Profit Targets:**
- TP1: $0.0315
- TP2: $0.0305
- TP3: $0.0290
Trade here $OSMO
📉 **Market Analysis:**
OSMO is showing a strong short-term rally of +12.41%, approaching its 24-hour high of $0.0336.
- Price is facing potential resistance near $0.0335–$0.0336.
- The recent upward move may attract profit-taking.
- Trading near the daily high increases the risk of a rejection.
- Broader price performance remains weak, with a 7-day decline of approximately 14.96%.
- A failure to hold above $0.0320 could trigger further downside.
**Confirmation:**
A clear rejection from $0.0335–$0.0336 followed by a breakdown below $0.0320 would strengthen the bearish setup.
⚠️ **Trade Smart:** Avoid entering blindly during strong upward momentum. Wait for bearish confirmation.
#OSMO #Osmosis #CryptoSignals #BinanceSquare #ASMADOLL
Note: This is a conditional short setup based on the supplied snapshot, not a confirmed bearish reversal. The 15m/1h chart structure should be checked before entry.
🔴 **$OSMO /USDT – SHORT**
**Current Price:** $0.0326
**Entry Zone:** $0.0325 – $0.0335
**Stop Loss (SL):** $0.0350
🎯 **Take Profit Targets:**
- TP1: $0.0315
- TP2: $0.0305
- TP3: $0.0290
Trade here $OSMO
📉 **Market Analysis:**
OSMO is showing a strong short-term rally of +12.41%, approaching its 24-hour high of $0.0336.
- Price is facing potential resistance near $0.0335–$0.0336.
- The recent upward move may attract profit-taking.
- Trading near the daily high increases the risk of a rejection.
- Broader price performance remains weak, with a 7-day decline of approximately 14.96%.
- A failure to hold above $0.0320 could trigger further downside.
**Confirmation:**
A clear rejection from $0.0335–$0.0336 followed by a breakdown below $0.0320 would strengthen the bearish setup.
⚠️ **Trade Smart:** Avoid entering blindly during strong upward momentum. Wait for bearish confirmation.
#OSMO #Osmosis #CryptoSignals #BinanceSquare #ASMADOLL
Note: This is a conditional short setup based on the supplied snapshot, not a confirmed bearish reversal. The 15m/1h chart structure should be checked before entry.
1
47

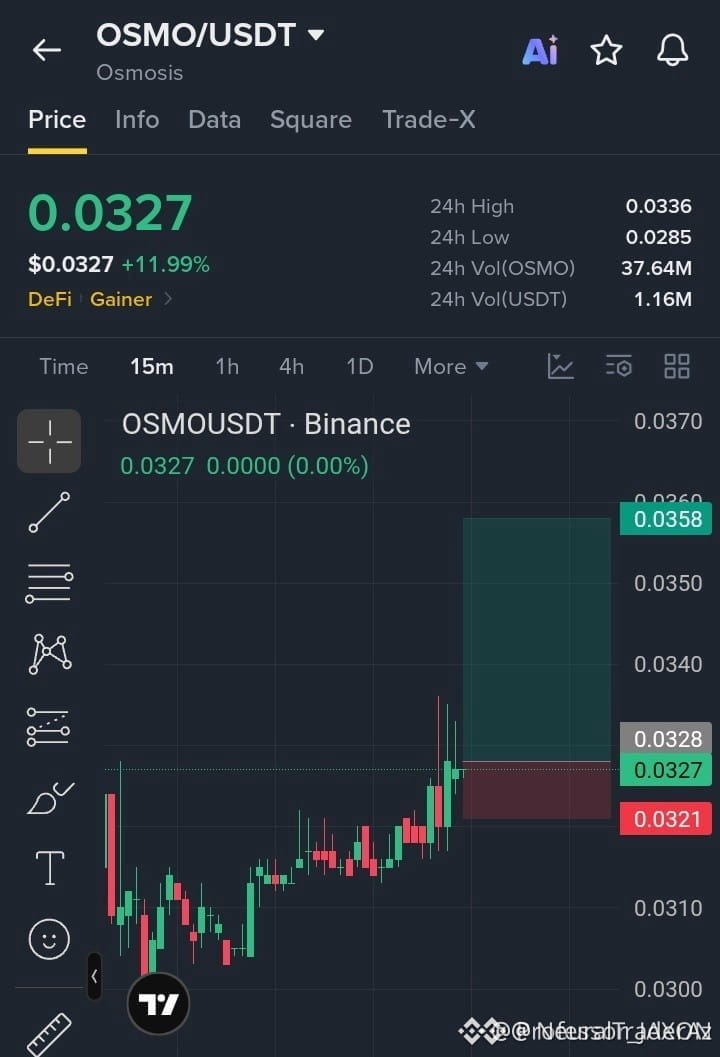
🚨 $OSMO FORMING HIGHER LOWS AS SMART MONEY ACCUMULATES NEAR LOCAL SUPPORT! ⚡
Entry: 0.0325–0.0328 ⚡
Target: 0.0336 🎯
Target: 0.0345 🎯
Target: 0.0358 🚀
Stop Loss: 0.0321 ⚠️
The lower timeframe order flow on $OSMO reveals persistent institutional bidding, systematically absorbing supply and carving clean higher lows on the 15-minute chart. 📊 Volume profiles confirm buyers are stepping in earlier on each minor pullback, building the structural velocity needed to challenge overhead resistance. ⚡ A sustained acceptance above 0.0330 should unlock a rapid liquidity expansion toward our upper targets. 🌊 Are you positioning ahead of the breakout or waiting for a retest? 👇
⚠️ Not financial advice. Always manage your risk. 🛡️
🏷️ #OSMO #LongSetup #OrderFlow #Breakout #Crypto
🔥 💎
🚨 $OSMO FORMING HIGHER LOWS AS SMART MONEY ACCUMULATES NEAR LOCAL SUPPORT! ⚡
Entry: 0.0325–0.0328 ⚡
Target: 0.0336 🎯
Target: 0.0345 🎯
Target: 0.0358 🚀
Stop Loss: 0.0321 ⚠️
The lower timeframe order flow on $OSMO reveals persistent institutional bidding, systematically absorbing supply and carving clean higher lows on the 15-minute chart. 📊 Volume profiles confirm buyers are stepping in earlier on each minor pullback, building the structural velocity needed to challenge overhead resistance. ⚡ A sustained acceptance above 0.0330 should unlock a rapid liquidity expansion toward our upper targets. 🌊 Are you positioning ahead of the breakout or waiting for a retest? 👇
⚠️ Not financial advice. Always manage your risk. 🛡️
🏷️ #OSMO #LongSetup #OrderFlow #Breakout #Crypto
🔥 💎
Entry: 0.0325–0.0328 ⚡
Target: 0.0336 🎯
Target: 0.0345 🎯
Target: 0.0358 🚀
Stop Loss: 0.0321 ⚠️
The lower timeframe order flow on $OSMO reveals persistent institutional bidding, systematically absorbing supply and carving clean higher lows on the 15-minute chart. 📊 Volume profiles confirm buyers are stepping in earlier on each minor pullback, building the structural velocity needed to challenge overhead resistance. ⚡ A sustained acceptance above 0.0330 should unlock a rapid liquidity expansion toward our upper targets. 🌊 Are you positioning ahead of the breakout or waiting for a retest? 👇
⚠️ Not financial advice. Always manage your risk. 🛡️
🏷️ #OSMO #LongSetup #OrderFlow #Breakout #Crypto
🔥 💎
3

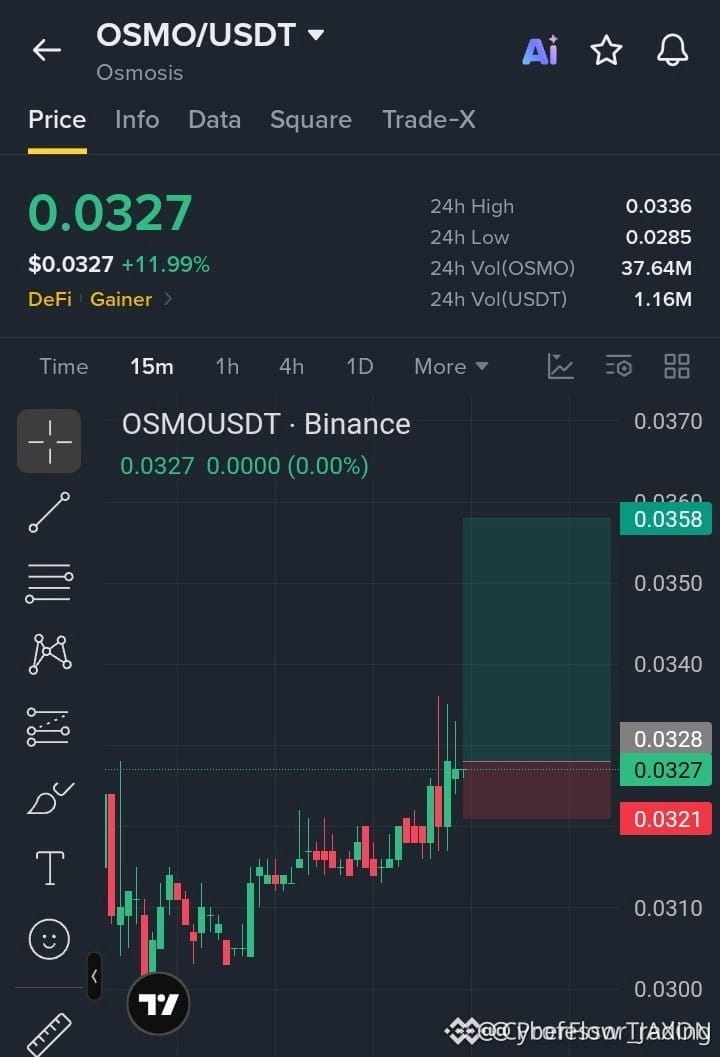
$OSMO FORMING A CLEAN HIGHER-LOW STRUCTURE AS BUYERS SWARM THE 15-MINUTE CHART! ⚡🚀
Entry: 0.0325–0.0328 ⚡
TP1: 0.0336 🚀
TP2: 0.0345 📈
TP3: 0.0358 🎯
Stop Loss: 0.0321 ⚠️
Momentum is shifting rapidly on the lower timeframes as aggressive buyers step in to defend support. ⚡
This persistent bid pressure is carving out a textbook series of higher lows, signaling that sellers are losing their grip on order flow. 📊
If volume continues to expand and we clear the local resistance barrier cleanly, expect a swift continuation toward our upper targets. 💡 Are you positioning early inside the entry zone or waiting for the breakout confirmation? 👇
⚠️ Not financial advice. Always manage your risk. 🛡️
🏷️ #OSMO #LongSetup #Momentum #Breakout #Crypto
🔥 💎
$OSMO FORMING A CLEAN HIGHER-LOW STRUCTURE AS BUYERS SWARM THE 15-MINUTE CHART! ⚡🚀
Entry: 0.0325–0.0328 ⚡
TP1: 0.0336 🚀
TP2: 0.0345 📈
TP3: 0.0358 🎯
Stop Loss: 0.0321 ⚠️
Momentum is shifting rapidly on the lower timeframes as aggressive buyers step in to defend support. ⚡
This persistent bid pressure is carving out a textbook series of higher lows, signaling that sellers are losing their grip on order flow. 📊
If volume continues to expand and we clear the local resistance barrier cleanly, expect a swift continuation toward our upper targets. 💡 Are you positioning early inside the entry zone or waiting for the breakout confirmation? 👇
⚠️ Not financial advice. Always manage your risk. 🛡️
🏷️ #OSMO #LongSetup #Momentum #Breakout #Crypto
🔥 💎
Entry: 0.0325–0.0328 ⚡
TP1: 0.0336 🚀
TP2: 0.0345 📈
TP3: 0.0358 🎯
Stop Loss: 0.0321 ⚠️
Momentum is shifting rapidly on the lower timeframes as aggressive buyers step in to defend support. ⚡
This persistent bid pressure is carving out a textbook series of higher lows, signaling that sellers are losing their grip on order flow. 📊
If volume continues to expand and we clear the local resistance barrier cleanly, expect a swift continuation toward our upper targets. 💡 Are you positioning early inside the entry zone or waiting for the breakout confirmation? 👇
⚠️ Not financial advice. Always manage your risk. 🛡️
🏷️ #OSMO #LongSetup #Momentum #Breakout #Crypto
🔥 💎
3

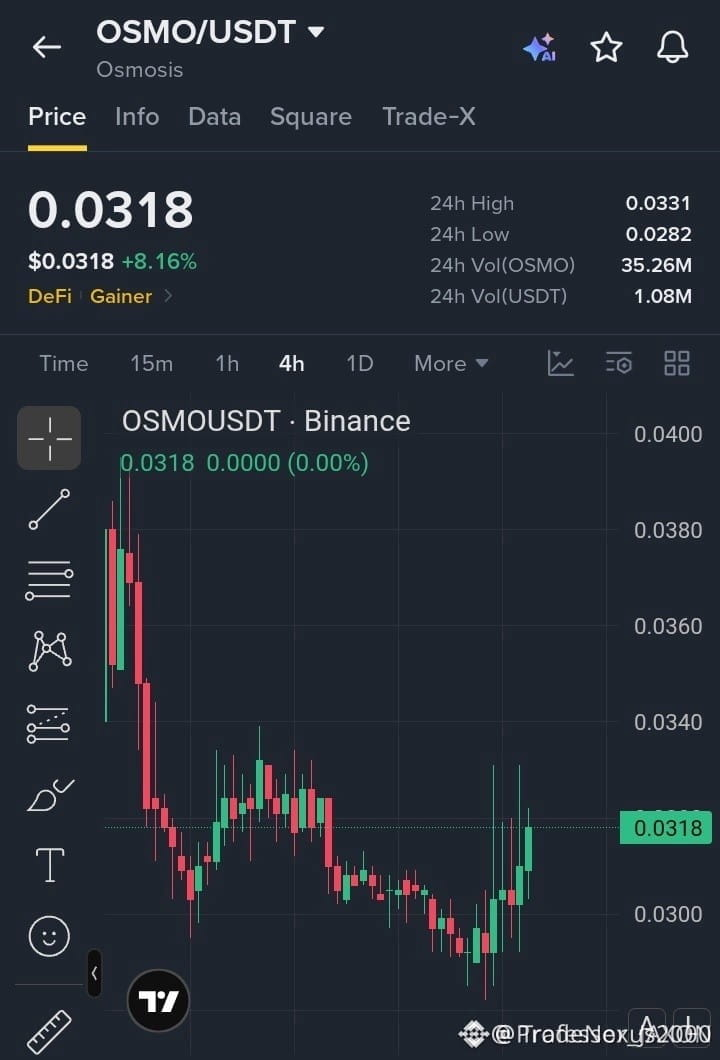
🦈 $OSMO SWEEPING LIQUIDITY AT SUPPORT BEFORE THE NEXT EXPANSIVE LEG UP 💥
Entry: 0.0312 - 0.0318 ⚡
Target: 0.0350 🚀
Stop Loss: 0.0295 ⚠️
Smart money has successfully defended the 0.0290 structural floor, absorbing excess supply and establishing a clean demand block. 🌊 Price action is now compressing tightly below local resistance as buyers reclaim short-term momentum. 📊
Holding above the 0.0310 threshold validates institutional accumulation and sets the stage for a measured expansion into higher liquidity pools. 💡 Are you positioned for this breakout continuation or waiting for a deeper retest? 👇
⚠️ Not financial advice. Always manage your risk. 🛡️
🏷️ #OSMO #SmartMoney #Breakout #Crypto
🦈 💎
🦈 $OSMO SWEEPING LIQUIDITY AT SUPPORT BEFORE THE NEXT EXPANSIVE LEG UP 💥
Entry: 0.0312 - 0.0318 ⚡
Target: 0.0350 🚀
Stop Loss: 0.0295 ⚠️
Smart money has successfully defended the 0.0290 structural floor, absorbing excess supply and establishing a clean demand block. 🌊 Price action is now compressing tightly below local resistance as buyers reclaim short-term momentum. 📊
Holding above the 0.0310 threshold validates institutional accumulation and sets the stage for a measured expansion into higher liquidity pools. 💡 Are you positioned for this breakout continuation or waiting for a deeper retest? 👇
⚠️ Not financial advice. Always manage your risk. 🛡️
🏷️ #OSMO #SmartMoney #Breakout #Crypto
🦈 💎
Entry: 0.0312 - 0.0318 ⚡
Target: 0.0350 🚀
Stop Loss: 0.0295 ⚠️
Smart money has successfully defended the 0.0290 structural floor, absorbing excess supply and establishing a clean demand block. 🌊 Price action is now compressing tightly below local resistance as buyers reclaim short-term momentum. 📊
Holding above the 0.0310 threshold validates institutional accumulation and sets the stage for a measured expansion into higher liquidity pools. 💡 Are you positioned for this breakout continuation or waiting for a deeper retest? 👇
⚠️ Not financial advice. Always manage your risk. 🛡️
🏷️ #OSMO #SmartMoney #Breakout #Crypto
🦈 💎
16

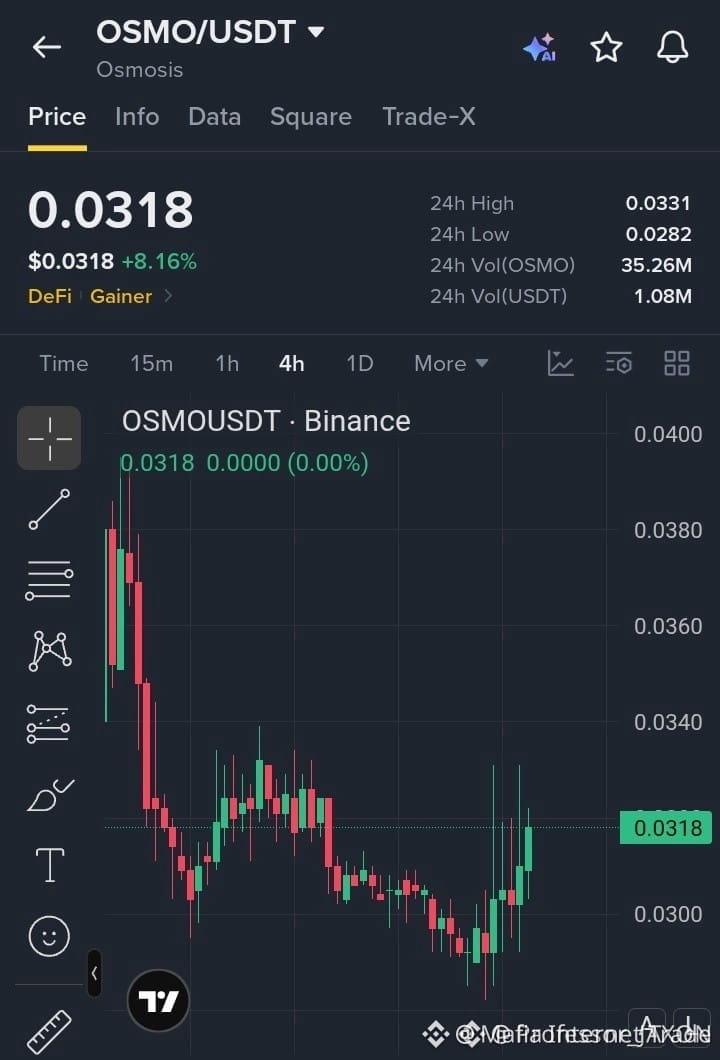
🚀 $OSMO RECLAIMS MOMENTUM AS BUYERS IGNITE A FRESH BREAKOUT SETUP! ⚡
Entry: 0.0312 – 0.0318 ⚡
Target: 0.0350 🚀
Stop Loss: 0.0295 ⚠️
Buyers are stepping in aggressively after defending the 0.0290 support zone, printing clean bullish candles that show a definitive shift in market control. 📊 Price is now grinding through the 0.0312 accumulation band with order book depth thinning out above resistance. ⚡
Holding firm above 0.0310 opens a pristine runway toward our higher targets as momentum accelerates. 🔍 Are you positioning ahead of the breakout or waiting for confirmation? 👇
⚠️ Not financial advice. Always manage your risk. 🛡️
🏷️ #OSMO #LongSetup #Crypto #Breakout #Altcoins
🔥 💎
🚀 $OSMO RECLAIMS MOMENTUM AS BUYERS IGNITE A FRESH BREAKOUT SETUP! ⚡
Entry: 0.0312 – 0.0318 ⚡
Target: 0.0350 🚀
Stop Loss: 0.0295 ⚠️
Buyers are stepping in aggressively after defending the 0.0290 support zone, printing clean bullish candles that show a definitive shift in market control. 📊 Price is now grinding through the 0.0312 accumulation band with order book depth thinning out above resistance. ⚡
Holding firm above 0.0310 opens a pristine runway toward our higher targets as momentum accelerates. 🔍 Are you positioning ahead of the breakout or waiting for confirmation? 👇
⚠️ Not financial advice. Always manage your risk. 🛡️
🏷️ #OSMO #LongSetup #Crypto #Breakout #Altcoins
🔥 💎
Entry: 0.0312 – 0.0318 ⚡
Target: 0.0350 🚀
Stop Loss: 0.0295 ⚠️
Buyers are stepping in aggressively after defending the 0.0290 support zone, printing clean bullish candles that show a definitive shift in market control. 📊 Price is now grinding through the 0.0312 accumulation band with order book depth thinning out above resistance. ⚡
Holding firm above 0.0310 opens a pristine runway toward our higher targets as momentum accelerates. 🔍 Are you positioning ahead of the breakout or waiting for confirmation? 👇
⚠️ Not financial advice. Always manage your risk. 🛡️
🏷️ #OSMO #LongSetup #Crypto #Breakout #Altcoins
🔥 💎
15
·
--
$OSMO +5.67% | $USUAL +5.14% | $SKY +4.11%
#OSMO nudged up to $0.0317, gaining +5.67% on $1.1 M of volume. The rise comes as the Cosmos‑based DEX continues to draw cross‑chain liquidity, though broader market sentiment remains mixed.
#USUAL climbed to $0.0111, up +5.14% with $2.2 M traded. Momentum appears solid, but the token’s niche use case could limit sustained upside.
#SKY rose to $0.0446, +4.11% on $4.4 M of volume. Higher trading flow suggests growing interest, yet the price action may still be vulnerable to short‑term swings.
👀 Watch how the differing volume scales could influence each token’s next move.
#Write2Earn #Binance
$OSMO +5.67% | $USUAL +5.14% | $SKY +4.11%
#OSMO nudged up to $0.0317, gaining +5.67% on $1.1 M of volume. The rise comes as the Cosmos‑based DEX continues to draw cross‑chain liquidity, though broader market sentiment remains mixed.
#USUAL climbed to $0.0111, up +5.14% with $2.2 M traded. Momentum appears solid, but the token’s niche use case could limit sustained upside.
#SKY rose to $0.0446, +4.11% on $4.4 M of volume. Higher trading flow suggests growing interest, yet the price action may still be vulnerable to short‑term swings.
👀 Watch how the differing volume scales could influence each token’s next move.
#Write2Earn #Binance
#OSMO nudged up to $0.0317, gaining +5.67% on $1.1 M of volume. The rise comes as the Cosmos‑based DEX continues to draw cross‑chain liquidity, though broader market sentiment remains mixed.
#USUAL climbed to $0.0111, up +5.14% with $2.2 M traded. Momentum appears solid, but the token’s niche use case could limit sustained upside.
#SKY rose to $0.0446, +4.11% on $4.4 M of volume. Higher trading flow suggests growing interest, yet the price action may still be vulnerable to short‑term swings.
👀 Watch how the differing volume scales could influence each token’s next move.
#Write2Earn #Binance
5

·
--
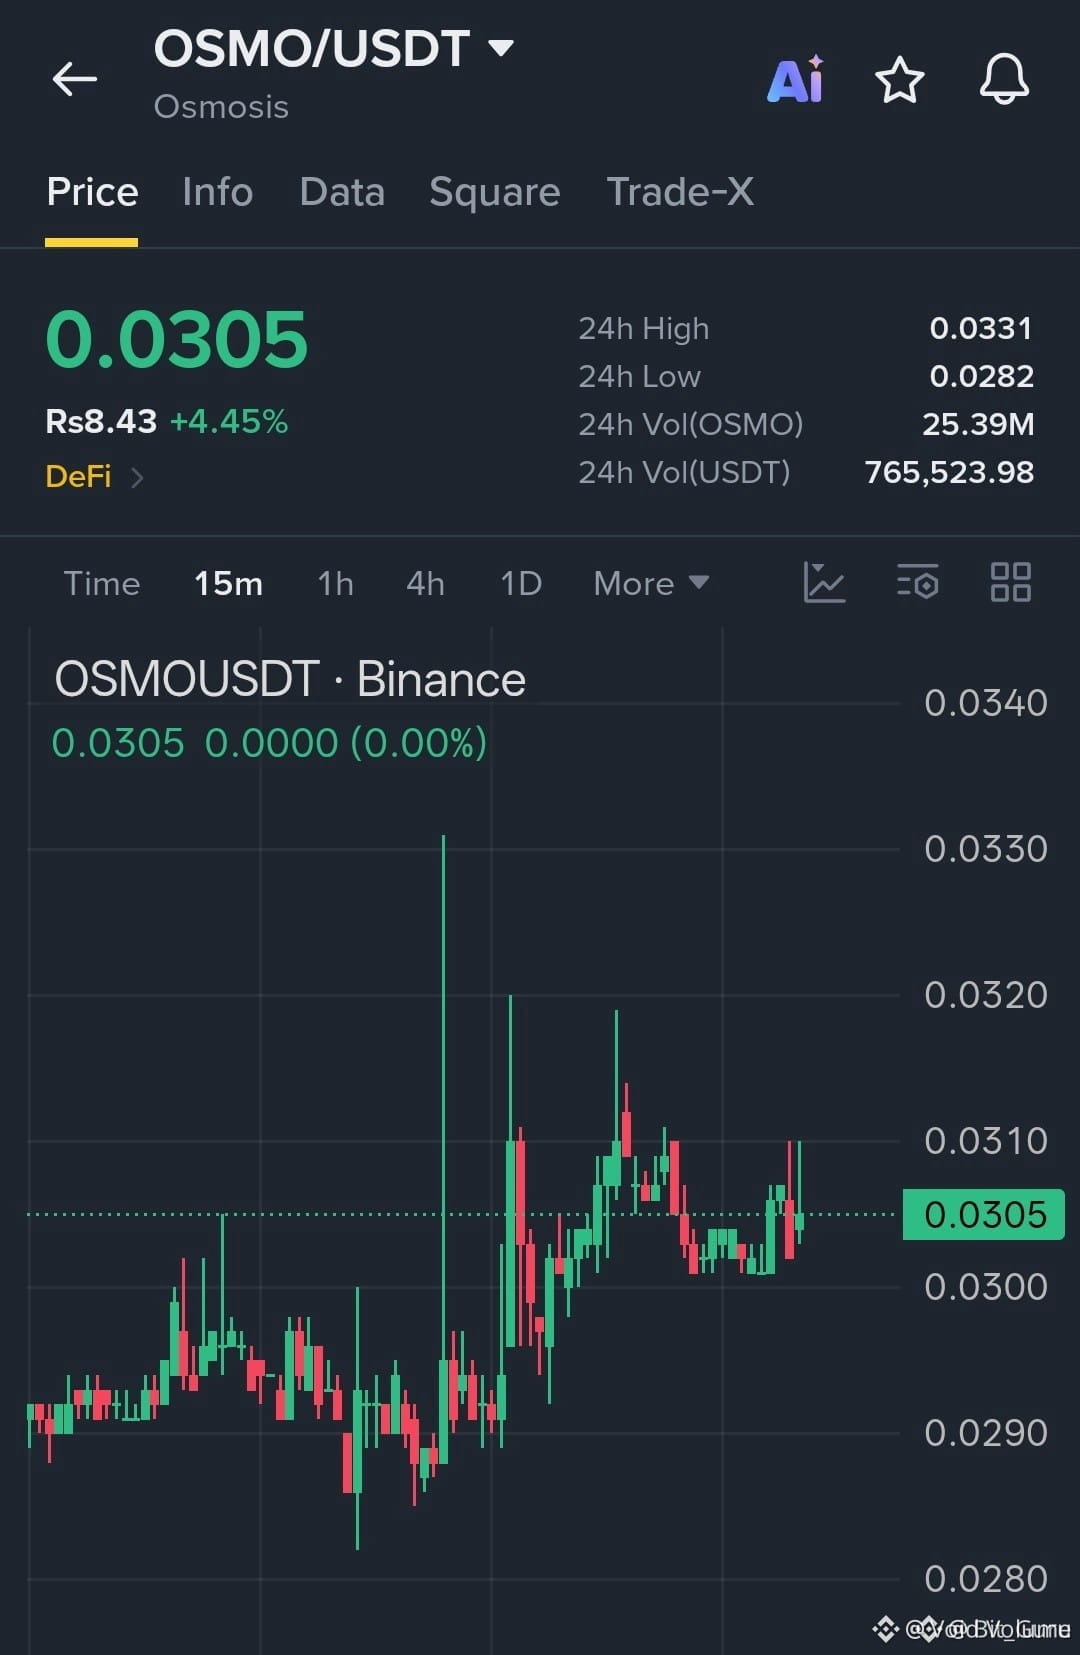
🦈 $OSMO SWEEPING INSTITUTIONAL LIQUIDITY BEFORE A SHARP EXPANSION TOWARD HIGHER RESISTANCE! ⚡
Entry: 0.0302–0.0305 ⚡
Target: 0.0322 🚀
Stop Loss: 0.0296 ⚠️
Smart money is currently absorbing resting liquidity inside this local demand zone, building clean structural alignment for an impulsive markup phase. 📊 Order flow indicates aggressive passive bids defending the range low while late sellers completely exhaust their momentum. 💡
As price reclaims the local fair value gap, expect a swift structural rotation through intermediate overhead resistance toward our primary liquidity objective. 🌊 Are you positioning alongside institutional accumulation here or waiting for structural confirmation? 👇
⚠️ Not financial advice. Always manage your risk. 🛡️
🏷️ #OSMO #SmartMoney #Crypto #PriceAction #MarketStructure
🔥 🦈
🦈 $OSMO SWEEPING INSTITUTIONAL LIQUIDITY BEFORE A SHARP EXPANSION TOWARD HIGHER RESISTANCE! ⚡
Entry: 0.0302–0.0305 ⚡
Target: 0.0322 🚀
Stop Loss: 0.0296 ⚠️
Smart money is currently absorbing resting liquidity inside this local demand zone, building clean structural alignment for an impulsive markup phase. 📊 Order flow indicates aggressive passive bids defending the range low while late sellers completely exhaust their momentum. 💡
As price reclaims the local fair value gap, expect a swift structural rotation through intermediate overhead resistance toward our primary liquidity objective. 🌊 Are you positioning alongside institutional accumulation here or waiting for structural confirmation? 👇
⚠️ Not financial advice. Always manage your risk. 🛡️
🏷️ #OSMO #SmartMoney #Crypto #PriceAction #MarketStructure
🔥 🦈
Entry: 0.0302–0.0305 ⚡
Target: 0.0322 🚀
Stop Loss: 0.0296 ⚠️
Smart money is currently absorbing resting liquidity inside this local demand zone, building clean structural alignment for an impulsive markup phase. 📊 Order flow indicates aggressive passive bids defending the range low while late sellers completely exhaust their momentum. 💡
As price reclaims the local fair value gap, expect a swift structural rotation through intermediate overhead resistance toward our primary liquidity objective. 🌊 Are you positioning alongside institutional accumulation here or waiting for structural confirmation? 👇
⚠️ Not financial advice. Always manage your risk. 🛡️
🏷️ #OSMO #SmartMoney #Crypto #PriceAction #MarketStructure
🔥 🦈
62

·
--
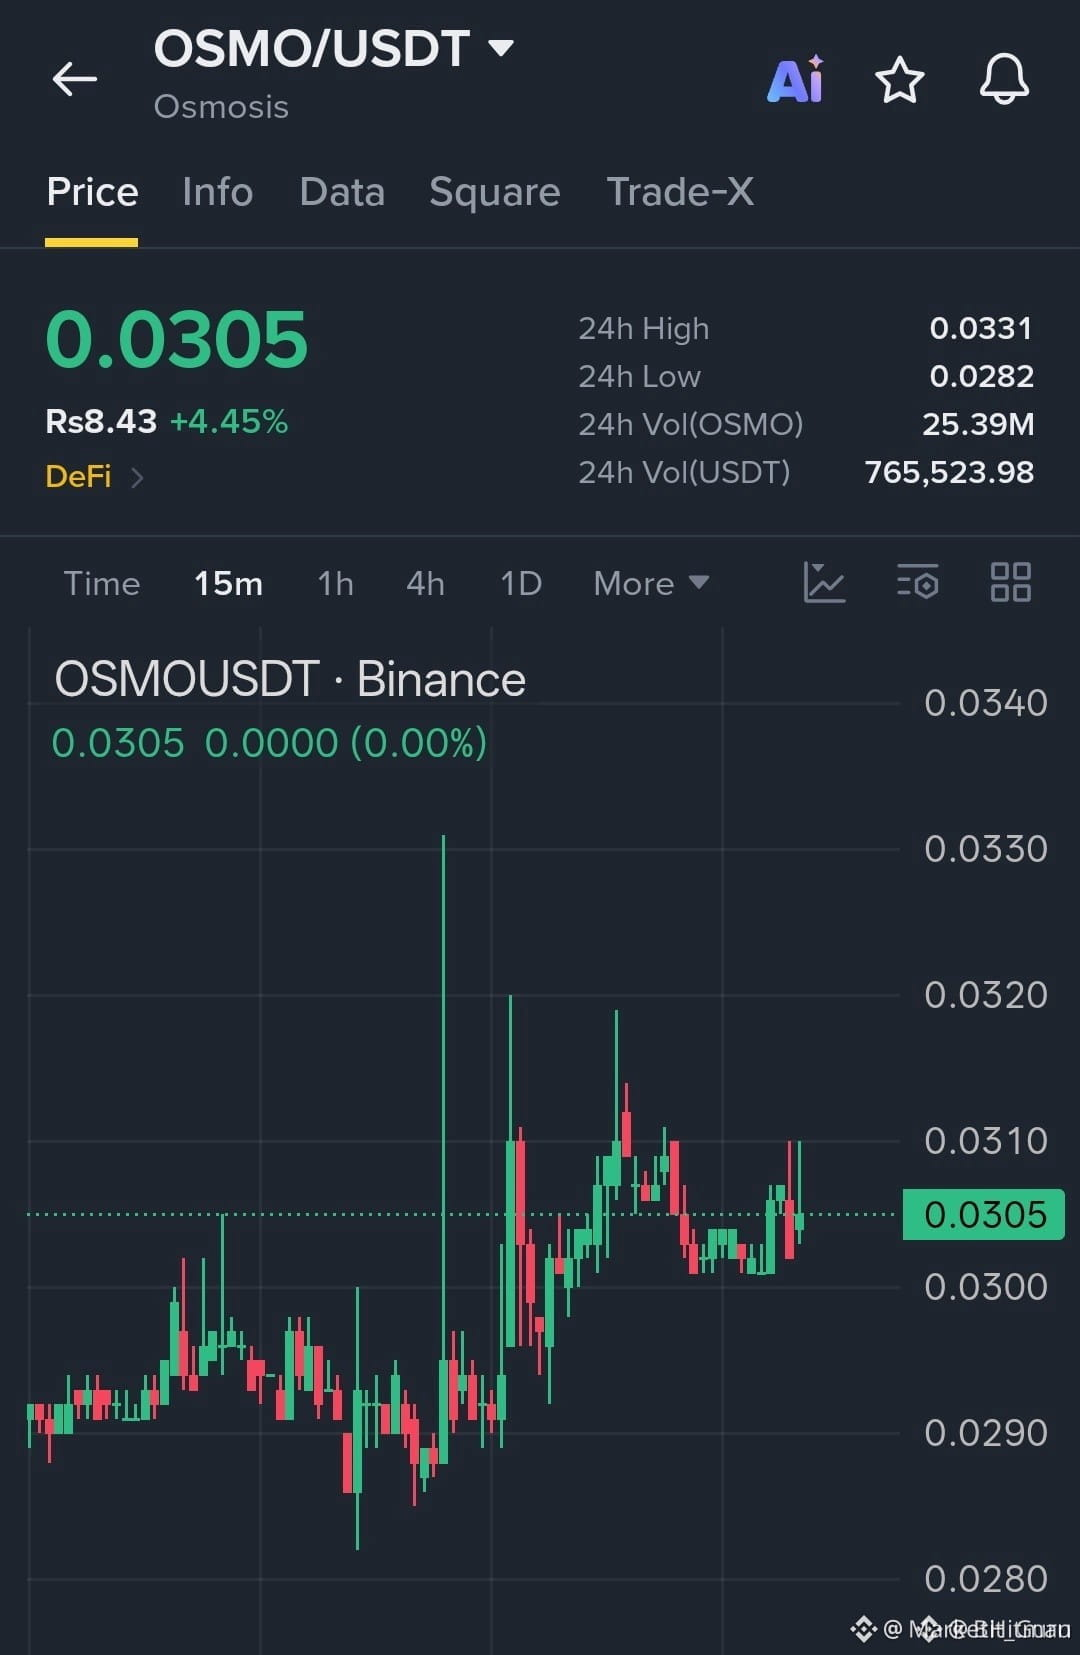
🦈 $OSMO BUYERS ARE STEPPING UP TO DEFEND THE RANGE WITH RAW MOMENTUM! ⚡
Entry: 0.0302–0.0305 ⚡
Target: 0.0322 🚀
Stop Loss: 0.0296 ⚠️
Order books are revealing aggressive accumulation as sellers exhaust their remaining inventory near local resistance. 📊 Smart money is stepping in with steady bids, locking down the floor and building a clean springboard for continuation. ⚡
Momentum oscillators are curling upward on expanding volume, signaling that aggressive expansion toward higher targets is unlocking. 🔍
💬 Are you riding this bullish wave early or waiting for confirmation? 👇
⚠️ Not financial advice. Always manage your risk. 🛡️
🏷️ #OSMO #LongSetup #Crypto #Breakout #Altcoins
🔥 💎
🦈 $OSMO BUYERS ARE STEPPING UP TO DEFEND THE RANGE WITH RAW MOMENTUM! ⚡
Entry: 0.0302–0.0305 ⚡
Target: 0.0322 🚀
Stop Loss: 0.0296 ⚠️
Order books are revealing aggressive accumulation as sellers exhaust their remaining inventory near local resistance. 📊 Smart money is stepping in with steady bids, locking down the floor and building a clean springboard for continuation. ⚡
Momentum oscillators are curling upward on expanding volume, signaling that aggressive expansion toward higher targets is unlocking. 🔍
💬 Are you riding this bullish wave early or waiting for confirmation? 👇
⚠️ Not financial advice. Always manage your risk. 🛡️
🏷️ #OSMO #LongSetup #Crypto #Breakout #Altcoins
🔥 💎
Entry: 0.0302–0.0305 ⚡
Target: 0.0322 🚀
Stop Loss: 0.0296 ⚠️
Order books are revealing aggressive accumulation as sellers exhaust their remaining inventory near local resistance. 📊 Smart money is stepping in with steady bids, locking down the floor and building a clean springboard for continuation. ⚡
Momentum oscillators are curling upward on expanding volume, signaling that aggressive expansion toward higher targets is unlocking. 🔍
💬 Are you riding this bullish wave early or waiting for confirmation? 👇
⚠️ Not financial advice. Always manage your risk. 🛡️
🏷️ #OSMO #LongSetup #Crypto #Breakout #Altcoins
🔥 💎
1

·
--
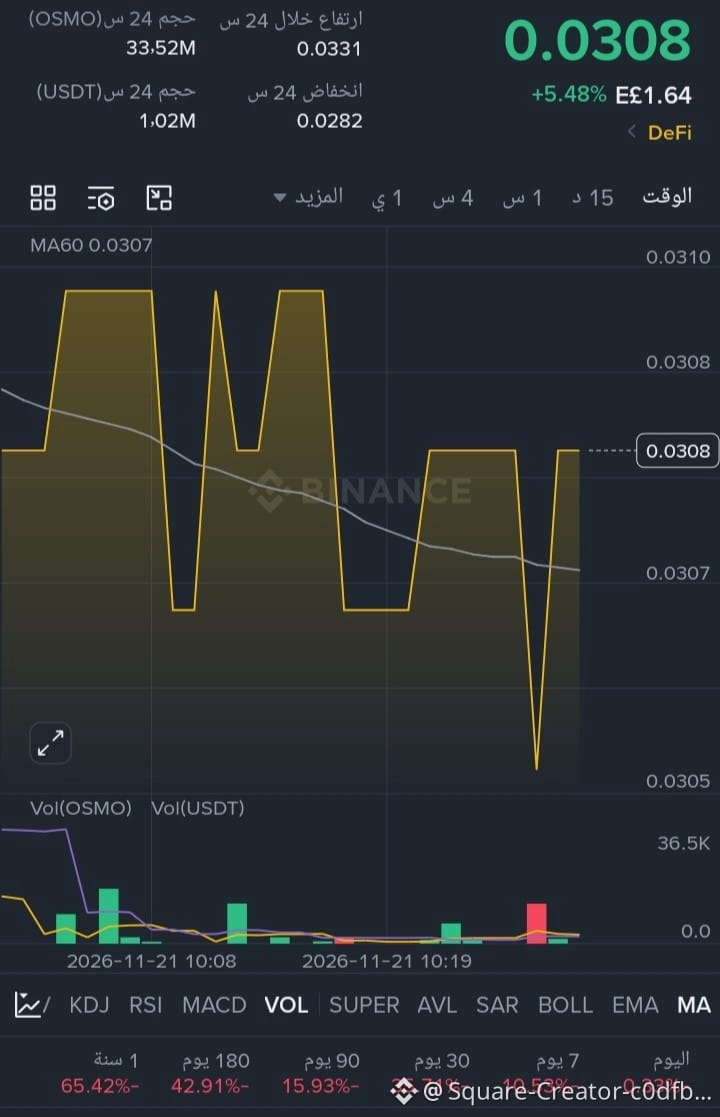
A volatile move and eye-catching quick rebound in OSMO after a daily gain of +5.48%, with the price settling at 0.0308 in a fluctuating zone that calls for careful analysis and a measured approach to seizing opportunities to avoid sharp swings!
Technical analysis and indicators
The price is trading above the MA60 average, shown at 0.0307, giving it a short-term advantage in staying on a positive path as long as it holds above this level.
The 24-hour trading range recorded a high of 0.0331 and a low of 0.0282, with trading volume reaching 33.52M OSMO and 1.02M USDT.
The chart shows repeated fluctuations between highs and lows, followed by a sharp drop toward 0.0305 and then a quick rebound that brings the price back toward 0.0308. Active volume bars below the chart reflect a short-term struggle between sellers and buyers.
Buying and selling zones and targets
Buying zones: It is preferable to wait for a measured corrective pullback toward 0.0307, or a confirmed rebound near the 0.0305 support, rather than entering randomly in the middle of the fluctuation.
Selling zones / stop-loss: Take partial profits or exit if 0.0307 is decisively broken, with a break below 0.0305 considered a clear sign of weakening short-term momentum.
Upside targets:
First target: 0.0310 (testing the nearby resistance shown on the chart).
Second target: 0.0318 if the 0.0310 level is decisively broken with supporting liquidity.
Third target: 0.0331 (retesting the 24-hour high).
#osmo #تداول_العملات_الرقمية #التحليل_الفني #بينانس #$OSMO
{spot}(OSMOUSDT)
A volatile move and eye-catching quick rebound in OSMO after a daily gain of +5.48%, with the price settling at 0.0308 in a fluctuating zone that calls for careful analysis and a measured approach to seizing opportunities to avoid sharp swings!
Technical analysis and indicators
The price is trading above the MA60 average, shown at 0.0307, giving it a short-term advantage in staying on a positive path as long as it holds above this level.
The 24-hour trading range recorded a high of 0.0331 and a low of 0.0282, with trading volume reaching 33.52M OSMO and 1.02M USDT.
The chart shows repeated fluctuations between highs and lows, followed by a sharp drop toward 0.0305 and then a quick rebound that brings the price back toward 0.0308. Active volume bars below the chart reflect a short-term struggle between sellers and buyers.
Buying and selling zones and targets
Buying zones: It is preferable to wait for a measured corrective pullback toward 0.0307, or a confirmed rebound near the 0.0305 support, rather than entering randomly in the middle of the fluctuation.
Selling zones / stop-loss: Take partial profits or exit if 0.0307 is decisively broken, with a break below 0.0305 considered a clear sign of weakening short-term momentum.
Upside targets:
First target: 0.0310 (testing the nearby resistance shown on the chart).
Second target: 0.0318 if the 0.0310 level is decisively broken with supporting liquidity.
Third target: 0.0331 (retesting the 24-hour high).
#osmo #تداول_العملات_الرقمية #التحليل_الفني #بينانس #$OSMO
Technical analysis and indicators
The price is trading above the MA60 average, shown at 0.0307, giving it a short-term advantage in staying on a positive path as long as it holds above this level.
The 24-hour trading range recorded a high of 0.0331 and a low of 0.0282, with trading volume reaching 33.52M OSMO and 1.02M USDT.
The chart shows repeated fluctuations between highs and lows, followed by a sharp drop toward 0.0305 and then a quick rebound that brings the price back toward 0.0308. Active volume bars below the chart reflect a short-term struggle between sellers and buyers.
Buying and selling zones and targets
Buying zones: It is preferable to wait for a measured corrective pullback toward 0.0307, or a confirmed rebound near the 0.0305 support, rather than entering randomly in the middle of the fluctuation.
Selling zones / stop-loss: Take partial profits or exit if 0.0307 is decisively broken, with a break below 0.0305 considered a clear sign of weakening short-term momentum.
Upside targets:
First target: 0.0310 (testing the nearby resistance shown on the chart).
Second target: 0.0318 if the 0.0310 level is decisively broken with supporting liquidity.
Third target: 0.0331 (retesting the 24-hour high).
#osmo #تداول_العملات_الرقمية #التحليل_الفني #بينانس #$OSMO
1
98

·
--
What is the movement in $OSMO telling us now?
Is trading volume supporting the price movement, or merely preceding it?
Reading: The trend in $OSMO matters as much as the actual activity supporting it.
Key evidence:
• Price movement over a full day was 11.19%.
• Trading value over a day was 1.15 million USDT, a measure of participation size, not direction.
• The price is now 0.0318 USDT.
• The spread between the best bid and best ask is 62.7 basis points (0.63%).
Confirmation condition: The price movement continues while trading volume and the spread remain close to their current readings. When does the reading weaken? If the price movement reverses while trading volume declines or the spread widens.
The current pace of movement alone does not determine the direction of $OSMO; what matters more is whether the indicators remain consistent in the next reading, along with the change in price over a day and trading volume over a day. The selected evidence is currently consistent, though the reading may change.
#OSMO #ترند_العملات #Liquidity
What is the movement in $OSMO telling us now?
Is trading volume supporting the price movement, or merely preceding it?
Reading: The trend in $OSMO matters as much as the actual activity supporting it.
Key evidence:
• Price movement over a full day was 11.19%.
• Trading value over a day was 1.15 million USDT, a measure of participation size, not direction.
• The price is now 0.0318 USDT.
• The spread between the best bid and best ask is 62.7 basis points (0.63%).
Confirmation condition: The price movement continues while trading volume and the spread remain close to their current readings. When does the reading weaken? If the price movement reverses while trading volume declines or the spread widens.
The current pace of movement alone does not determine the direction of $OSMO ; what matters more is whether the indicators remain consistent in the next reading, along with the change in price over a day and trading volume over a day. The selected evidence is currently consistent, though the reading may change.
#OSMO #ترند_العملات #Liquidity
Is trading volume supporting the price movement, or merely preceding it?
Reading: The trend in $OSMO matters as much as the actual activity supporting it.
Key evidence:
• Price movement over a full day was 11.19%.
• Trading value over a day was 1.15 million USDT, a measure of participation size, not direction.
• The price is now 0.0318 USDT.
• The spread between the best bid and best ask is 62.7 basis points (0.63%).
Confirmation condition: The price movement continues while trading volume and the spread remain close to their current readings. When does the reading weaken? If the price movement reverses while trading volume declines or the spread widens.
The current pace of movement alone does not determine the direction of $OSMO ; what matters more is whether the indicators remain consistent in the next reading, along with the change in price over a day and trading volume over a day. The selected evidence is currently consistent, though the reading may change.
#OSMO #ترند_العملات #Liquidity
7

·
--
OSMO spot market: the 5m candle closed at +5.07% at 2026-11-21 03:35 Beijing time. At 2026-11-21 03:35:06 Beijing time, the current price was 0.0311, 24h turnover was 516.2k, price was above the candlestick-estimated VWAP of 0.0299492, and RSI was 72.2. First, the hard data: the key question isn’t whether it moved, but whether the data can continue to support the move.
Can it hold a pullback to VWAP 0.0299492? Whether it can find support there will determine if this move is valid.
Note: 24h trading volume is below $5 million, and the order book is thin. Watch out for slippage.
#OSMO #Unusual Move Alert
OSMO spot market: the 5m candle closed at +5.07% at 2026-11-21 03:35 Beijing time. At 2026-11-21 03:35:06 Beijing time, the current price was 0.0311, 24h turnover was 516.2k, price was above the candlestick-estimated VWAP of 0.0299492, and RSI was 72.2. First, the hard data: the key question isn’t whether it moved, but whether the data can continue to support the move.
Can it hold a pullback to VWAP 0.0299492? Whether it can find support there will determine if this move is valid.
Note: 24h trading volume is below $5 million, and the order book is thin. Watch out for slippage.
#OSMO #Unusual Move Alert
Can it hold a pullback to VWAP 0.0299492? Whether it can find support there will determine if this move is valid.
Note: 24h trading volume is below $5 million, and the order book is thin. Watch out for slippage.
#OSMO #Unusual Move Alert
8

·
--
$OSMO: Bounces are happening. Why does each one end lower than the last?
...
Look at how far $OSMO managed to climb: first to around 0.067, then to 0.050, and most recently only to 0.041. Buyers have shown up at 0.030 again. The question is whether they can make it past the previous bounce’s peak this time.
A day above 0.042, followed by a pullback that holds at 0.036, would give it a chance to test 0.049–0.050. But if the week closes below 0.0295, the recovery scenario from the current support is off the table.
#OSMO #PEARL #BTC
$OSMO : Bounces are happening. Why does each one end lower than the last?
...
Look at how far $OSMO managed to climb: first to around 0.067, then to 0.050, and most recently only to 0.041. Buyers have shown up at 0.030 again. The question is whether they can make it past the previous bounce’s peak this time.
A day above 0.042, followed by a pullback that holds at 0.036, would give it a chance to test 0.049–0.050. But if the week closes below 0.0295, the recovery scenario from the current support is off the table.
#OSMO #PEARL #BTC
...
Look at how far $OSMO managed to climb: first to around 0.067, then to 0.050, and most recently only to 0.041. Buyers have shown up at 0.030 again. The question is whether they can make it past the previous bounce’s peak this time.
A day above 0.042, followed by a pullback that holds at 0.036, would give it a chance to test 0.049–0.050. But if the week closes below 0.0295, the recovery scenario from the current support is off the table.
#OSMO #PEARL #BTC
193

$OSMO 4h — SHORT Signal 🔴
12/14 indicator confluence.
RSI 41.0 weak — selling pressure dominates; MACD histogram negative, bearish (-6.15182e-05); price below 4h EMA26 (0.031830); 1h trend aligned downward; MTF: 7 of 8 TFs aligned downward; Bollinger position: middle band; holding at support 0.029500.
Chart pattern: Symmetrical Triangle [neutral].
Support 0.029500 | Resistance 0.031950
Entry: 0.030500
SL: 0.031621
TP1: 0.029379
TP2: 0.028257
TP3: 0.024893
Risk:Reward TP2 = 1:2.0
Leverage (isolated): safe 5x, maximum 10x.
$OSMO #OSMO #Crypto
Not financial advice. Always DYOR.
$OSMO 4h — SHORT Signal 🔴
12/14 indicator confluence.
RSI 41.0 weak — selling pressure dominates; MACD histogram negative, bearish (-6.15182e-05); price below 4h EMA26 (0.031830); 1h trend aligned downward; MTF: 7 of 8 TFs aligned downward; Bollinger position: middle band; holding at support 0.029500.
Chart pattern: Symmetrical Triangle [neutral].
Support 0.029500 | Resistance 0.031950
Entry: 0.030500
SL: 0.031621
TP1: 0.029379
TP2: 0.028257
TP3: 0.024893
Risk:Reward TP2 = 1:2.0
Leverage (isolated): safe 5x, maximum 10x.
$OSMO #OSMO #Crypto
Not financial advice. Always DYOR.
12/14 indicator confluence.
RSI 41.0 weak — selling pressure dominates; MACD histogram negative, bearish (-6.15182e-05); price below 4h EMA26 (0.031830); 1h trend aligned downward; MTF: 7 of 8 TFs aligned downward; Bollinger position: middle band; holding at support 0.029500.
Chart pattern: Symmetrical Triangle [neutral].
Support 0.029500 | Resistance 0.031950
Entry: 0.030500
SL: 0.031621
TP1: 0.029379
TP2: 0.028257
TP3: 0.024893
Risk:Reward TP2 = 1:2.0
Leverage (isolated): safe 5x, maximum 10x.
$OSMO #OSMO #Crypto
Not financial advice. Always DYOR.
7


·
--
Bearish
$OSMO Drops 2.8% on 6.6x Volume: Bears Have Control, But Chasing the Breakdown Could Be Costly
$OSMO is facing renewed selling pressure near 0.0317, with a reported 6.6x volume spike accompanying a sharp 2.8% decline in just 15 minutes. The short-term outlook remains bearish, but entering blindly after an aggressive selloff is not a strategy I would favor.
What the Market Is Signaling:
- The 1H and daily structures remain bearish, with price trading below both key EMAs. RSI at 42 also reflects weakening momentum.
- The unusual volume confirms increased market activity, but it does not automatically prove smart-money distribution. Panic selling, liquidation, and news-driven activity remain possible explanations.
- BTC's current sell-side pressure adds another layer of caution for buyers, although the weekly OSMO structure remains bullish.
Key Levels to Watch:
- Resistance zone: 0.0318–0.0331
- Breakdown level: 0.0312
- First downside target: 0.0307
- Second target: 0.0295
- Extended downside target: 0.0285
My Trading Strategy:
I would prefer a rebound toward 0.0318–0.0331 followed by clear bearish rejection before considering a short position. Another possibility is a confirmed breakdown below 0.0312 followed by a failed reclaim.
However, a quick liquidity sweep below 0.0312 followed by a strong recovery could trap late sellers. Patience is more valuable than chasing momentum.
Invalidation: A confirmed 1H candle close above 0.0334 would invalidate my current bearish setup.
The bottom line: Bears currently have the short-term advantage, but confirmation matters more than excitement. Protect capital and let price reveal its next move.
Not financial advice. Educational market analysis only.
#OSMO #CryptoTrading #TechnicalAnalysis #Altcoins #BinanceSquare $OSMO
{spot}(OSMOUSDT)
CHIL-WITH-CRYPTO
$OSMO Drops 2.8% on 6.6x Volume: Bears Have Control, But Chasing the Breakdown Could Be Costly
$OSMO is facing renewed selling pressure near 0.0317, with a reported 6.6x volume spike accompanying a sharp 2.8% decline in just 15 minutes. The short-term outlook remains bearish, but entering blindly after an aggressive selloff is not a strategy I would favor.
What the Market Is Signaling:
- The 1H and daily structures remain bearish, with price trading below both key EMAs. RSI at 42 also reflects weakening momentum.
- The unusual volume confirms increased market activity, but it does not automatically prove smart-money distribution. Panic selling, liquidation, and news-driven activity remain possible explanations.
- BTC's current sell-side pressure adds another layer of caution for buyers, although the weekly OSMO structure remains bullish.
Key Levels to Watch:
- Resistance zone: 0.0318–0.0331
- Breakdown level: 0.0312
- First downside target: 0.0307
- Second target: 0.0295
- Extended downside target: 0.0285
My Trading Strategy:
I would prefer a rebound toward 0.0318–0.0331 followed by clear bearish rejection before considering a short position. Another possibility is a confirmed breakdown below 0.0312 followed by a failed reclaim.
However, a quick liquidity sweep below 0.0312 followed by a strong recovery could trap late sellers. Patience is more valuable than chasing momentum.
Invalidation: A confirmed 1H candle close above 0.0334 would invalidate my current bearish setup.
The bottom line: Bears currently have the short-term advantage, but confirmation matters more than excitement. Protect capital and let price reveal its next move.
Not financial advice. Educational market analysis only.
#OSMO #CryptoTrading #TechnicalAnalysis #Altcoins #BinanceSquare $OSMO
CHIL-WITH-CRYPTO
$OSMO is facing renewed selling pressure near 0.0317, with a reported 6.6x volume spike accompanying a sharp 2.8% decline in just 15 minutes. The short-term outlook remains bearish, but entering blindly after an aggressive selloff is not a strategy I would favor.
What the Market Is Signaling:
- The 1H and daily structures remain bearish, with price trading below both key EMAs. RSI at 42 also reflects weakening momentum.
- The unusual volume confirms increased market activity, but it does not automatically prove smart-money distribution. Panic selling, liquidation, and news-driven activity remain possible explanations.
- BTC's current sell-side pressure adds another layer of caution for buyers, although the weekly OSMO structure remains bullish.
Key Levels to Watch:
- Resistance zone: 0.0318–0.0331
- Breakdown level: 0.0312
- First downside target: 0.0307
- Second target: 0.0295
- Extended downside target: 0.0285
My Trading Strategy:
I would prefer a rebound toward 0.0318–0.0331 followed by clear bearish rejection before considering a short position. Another possibility is a confirmed breakdown below 0.0312 followed by a failed reclaim.
However, a quick liquidity sweep below 0.0312 followed by a strong recovery could trap late sellers. Patience is more valuable than chasing momentum.
Invalidation: A confirmed 1H candle close above 0.0334 would invalidate my current bearish setup.
The bottom line: Bears currently have the short-term advantage, but confirmation matters more than excitement. Protect capital and let price reveal its next move.
Not financial advice. Educational market analysis only.
#OSMO #CryptoTrading #TechnicalAnalysis #Altcoins #BinanceSquare $OSMO
CHIL-WITH-CRYPTO
1
32
·
--
🦈 $OSMO SWEEPING LOCAL LIQUIDITY AS SMART MONEY TESTS THE $0.0334 RESISTANCE BLOCK! 💥
Entry: $0.0325–$0.0334 ⚡
Target: $0.0340, $0.0350, $0.0360 🚀
Stop Loss: $0.0315 🛑
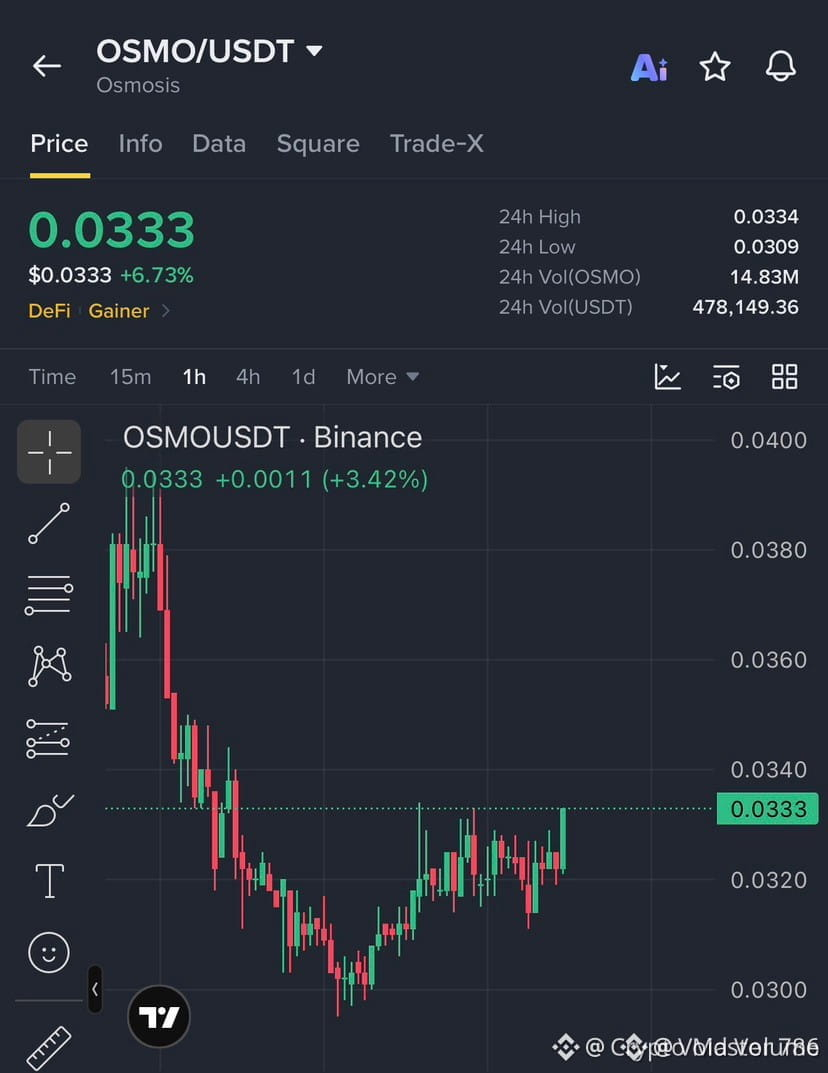
Institutional order flow is steadily absorbing overhead supply as $OSMO prints a robust 6.73% recovery rally toward key structural resistance. 📊 Buyers are aggressively defending local inefficiencies, demonstrating classic smart money accumulation patterns right ahead of the $0.0334 threshold. 💡
A decisive structural breakout with expanding volume clears the direct path toward higher macro liquidity pools, unlocking clean upside momentum. ⚡ Are you positioning for this expansion or waiting for a retest? 👇
⚠️ Not financial advice. Always manage your risk. 🛡️
🏷️ #OSMO #SmartMoney #Breakout #Crypto #OrderFlow
🦈 💎
🦈 $OSMO SWEEPING LOCAL LIQUIDITY AS SMART MONEY TESTS THE $0.0334 RESISTANCE BLOCK! 💥
Entry: $0.0325–$0.0334 ⚡
Target: $0.0340, $0.0350, $0.0360 🚀
Stop Loss: $0.0315 🛑
Institutional order flow is steadily absorbing overhead supply as $OSMO prints a robust 6.73% recovery rally toward key structural resistance. 📊 Buyers are aggressively defending local inefficiencies, demonstrating classic smart money accumulation patterns right ahead of the $0.0334 threshold. 💡
A decisive structural breakout with expanding volume clears the direct path toward higher macro liquidity pools, unlocking clean upside momentum. ⚡ Are you positioning for this expansion or waiting for a retest? 👇
⚠️ Not financial advice. Always manage your risk. 🛡️
🏷️ #OSMO #SmartMoney #Breakout #Crypto #OrderFlow
🦈 💎
Entry: $0.0325–$0.0334 ⚡
Target: $0.0340, $0.0350, $0.0360 🚀
Stop Loss: $0.0315 🛑
Institutional order flow is steadily absorbing overhead supply as $OSMO prints a robust 6.73% recovery rally toward key structural resistance. 📊 Buyers are aggressively defending local inefficiencies, demonstrating classic smart money accumulation patterns right ahead of the $0.0334 threshold. 💡
A decisive structural breakout with expanding volume clears the direct path toward higher macro liquidity pools, unlocking clean upside momentum. ⚡ Are you positioning for this expansion or waiting for a retest? 👇
⚠️ Not financial advice. Always manage your risk. 🛡️
🏷️ #OSMO #SmartMoney #Breakout #Crypto #OrderFlow
🦈 💎
16

$OSMO BUYERS ARE BATTERING THE 0.0334 RESISTANCE WITH SERIOUS MOMENTUM ⚡ 🚀
Entry: $0.0325–$0.0334 ⚡
Target: $0.0340 / $0.0350 / $0.0360 🚀
Stop Loss: $0.0315 ⚠️
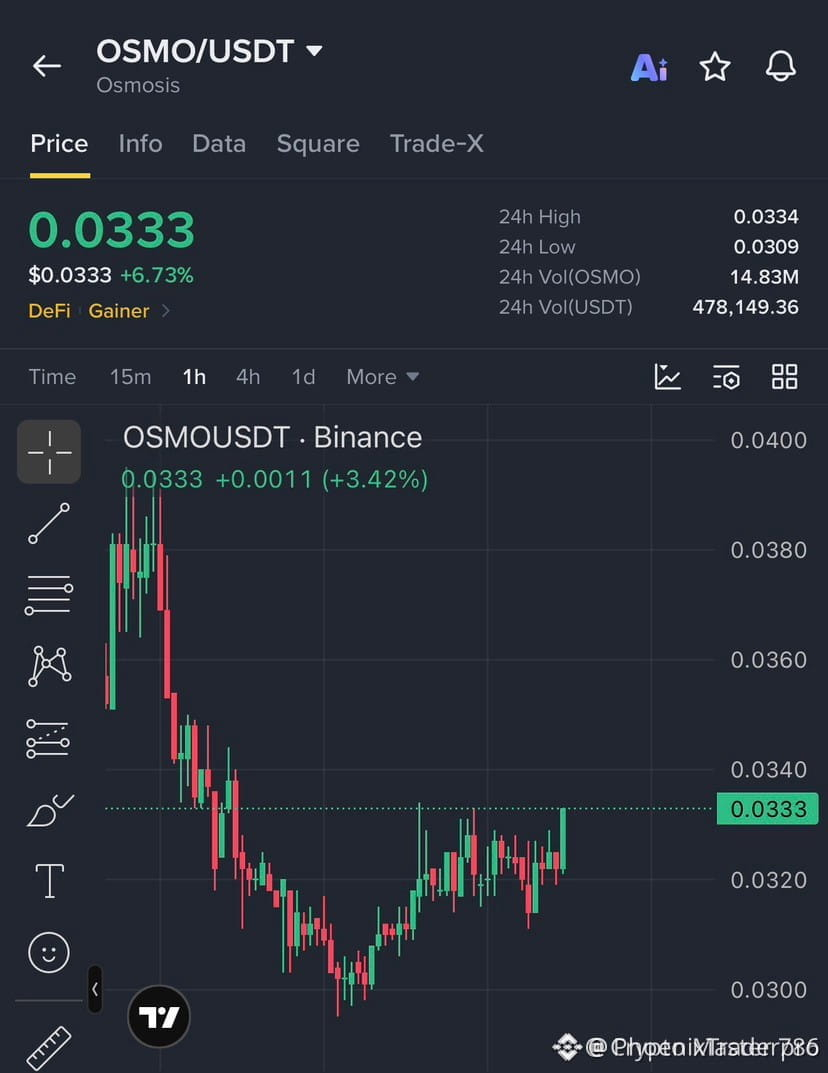
Bulls are quietly absorbing overhead supply as $OSMO prints a solid 6.73% recovery bounce. Price is pressing directly against the local ceiling, and order flow shows eager buyers stepping in ahead of the pivot. 📊
If this accumulation phase resolves upward, expect a fast sweep through the upper liquidity clusters. Volume profile confirms strong participation backing this push. ⚡
💬 Are you positioning for the initial breakout or waiting for a confirmed daily close above resistance? 👇
⚠️ Not financial advice. Always manage your risk. 🛡️
🏷️ #OSMO #Breakout #DeFi #Altcoins
🔥 💎
$OSMO BUYERS ARE BATTERING THE 0.0334 RESISTANCE WITH SERIOUS MOMENTUM ⚡ 🚀
Entry: $0.0325–$0.0334 ⚡
Target: $0.0340 / $0.0350 / $0.0360 🚀
Stop Loss: $0.0315 ⚠️
Bulls are quietly absorbing overhead supply as $OSMO prints a solid 6.73% recovery bounce. Price is pressing directly against the local ceiling, and order flow shows eager buyers stepping in ahead of the pivot. 📊
If this accumulation phase resolves upward, expect a fast sweep through the upper liquidity clusters. Volume profile confirms strong participation backing this push. ⚡
💬 Are you positioning for the initial breakout or waiting for a confirmed daily close above resistance? 👇
⚠️ Not financial advice. Always manage your risk. 🛡️
🏷️ #OSMO #Breakout #DeFi #Altcoins
🔥 💎
Entry: $0.0325–$0.0334 ⚡
Target: $0.0340 / $0.0350 / $0.0360 🚀
Stop Loss: $0.0315 ⚠️
Bulls are quietly absorbing overhead supply as $OSMO prints a solid 6.73% recovery bounce. Price is pressing directly against the local ceiling, and order flow shows eager buyers stepping in ahead of the pivot. 📊
If this accumulation phase resolves upward, expect a fast sweep through the upper liquidity clusters. Volume profile confirms strong participation backing this push. ⚡
💬 Are you positioning for the initial breakout or waiting for a confirmed daily close above resistance? 👇
⚠️ Not financial advice. Always manage your risk. 🛡️
🏷️ #OSMO #Breakout #DeFi #Altcoins
🔥 💎
16

·
--
Bullish
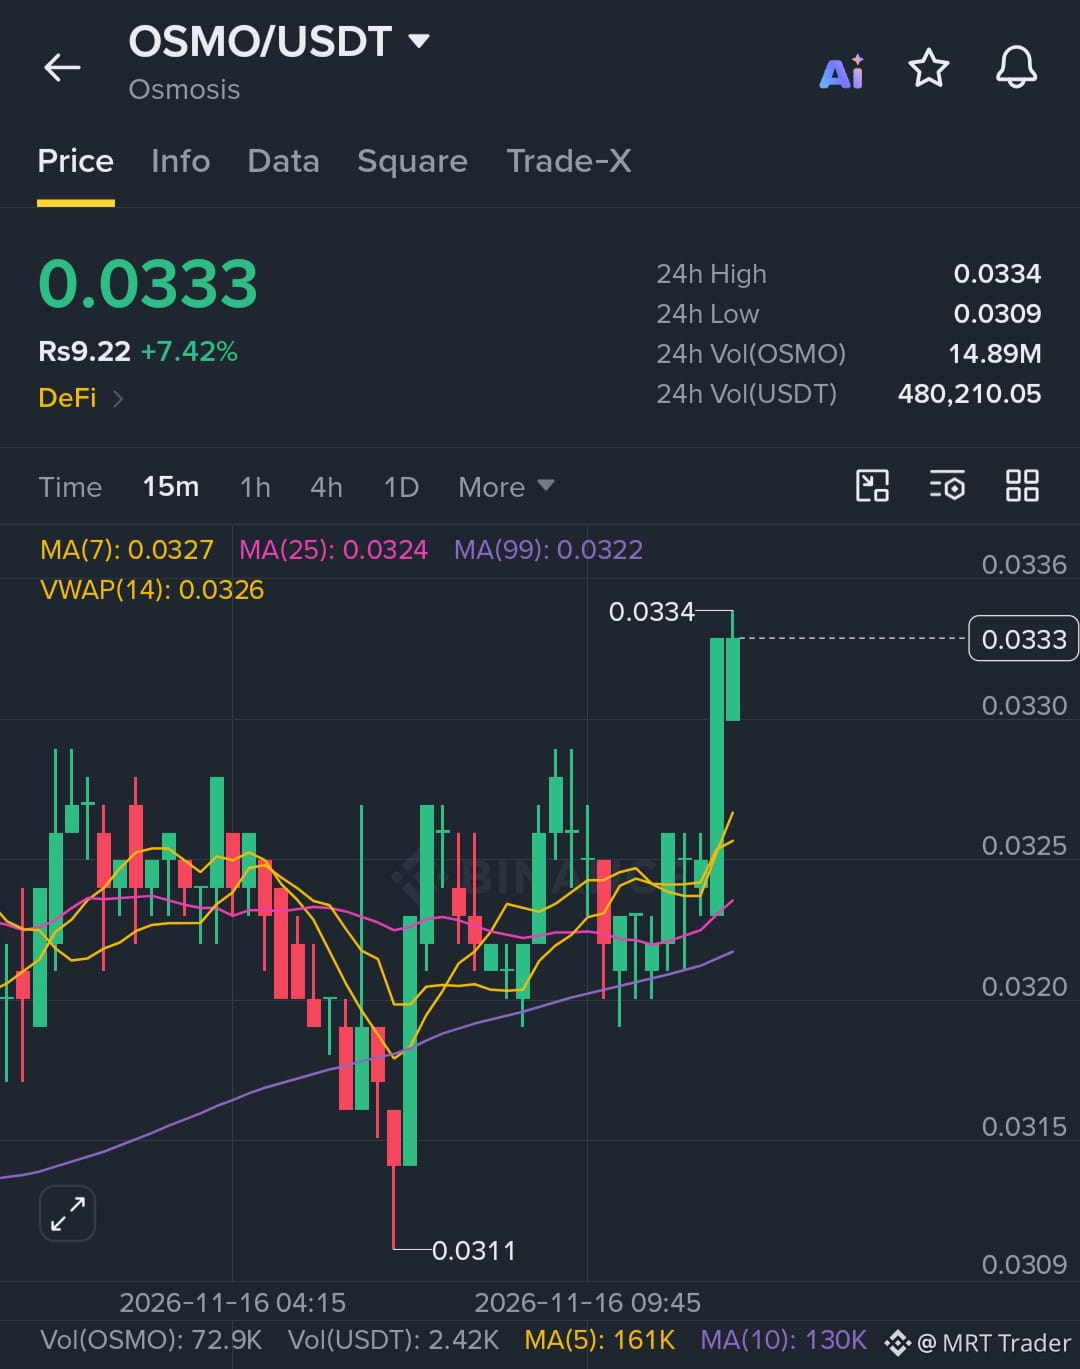
$OSMO is recovering steadily as buyers push toward resistance, and a clean breakout could open the door to higher targets.
Key Level:
🟢 Bullish above: 0.0336
Trade Setup (Long):
🟢 Entry Zone: 0.0323 – 0.0332
🎯 Targets: 0.0342 / 0.0352 / 0.0362
⛔ Stop Loss: 0.0313
Buyers are gaining control, so enter on pullbacks and manage risk appropriately.
Click here to buy now 👉 $OSMO
{spot}(OSMOUSDT)
#OSMO #bitcoin #USSpotXRPETFsSeeLargestWeeklyOutflowIn8Months
$OSMO is recovering steadily as buyers push toward resistance, and a clean breakout could open the door to higher targets.
Key Level:
🟢 Bullish above: 0.0336
Trade Setup (Long):
🟢 Entry Zone: 0.0323 – 0.0332
🎯 Targets: 0.0342 / 0.0352 / 0.0362
⛔ Stop Loss: 0.0313
Buyers are gaining control, so enter on pullbacks and manage risk appropriately.
Click here to buy now 👉 $OSMO
#OSMO #bitcoin #USSpotXRPETFsSeeLargestWeeklyOutflowIn8Months
Key Level:
🟢 Bullish above: 0.0336
Trade Setup (Long):
🟢 Entry Zone: 0.0323 – 0.0332
🎯 Targets: 0.0342 / 0.0352 / 0.0362
⛔ Stop Loss: 0.0313
Buyers are gaining control, so enter on pullbacks and manage risk appropriately.
Click here to buy now 👉 $OSMO
#OSMO #bitcoin #USSpotXRPETFsSeeLargestWeeklyOutflowIn8Months
32
·
--
Bullish
$OSMO – Bulls Preparing For Another Breakout Attempt?
Trade Setup: Long
Entry zone: 0.03230 – 0.03260 Tp1: 0.03270 Tp2: 0.03340 Tp3: 0.03360 SL: 0.03190
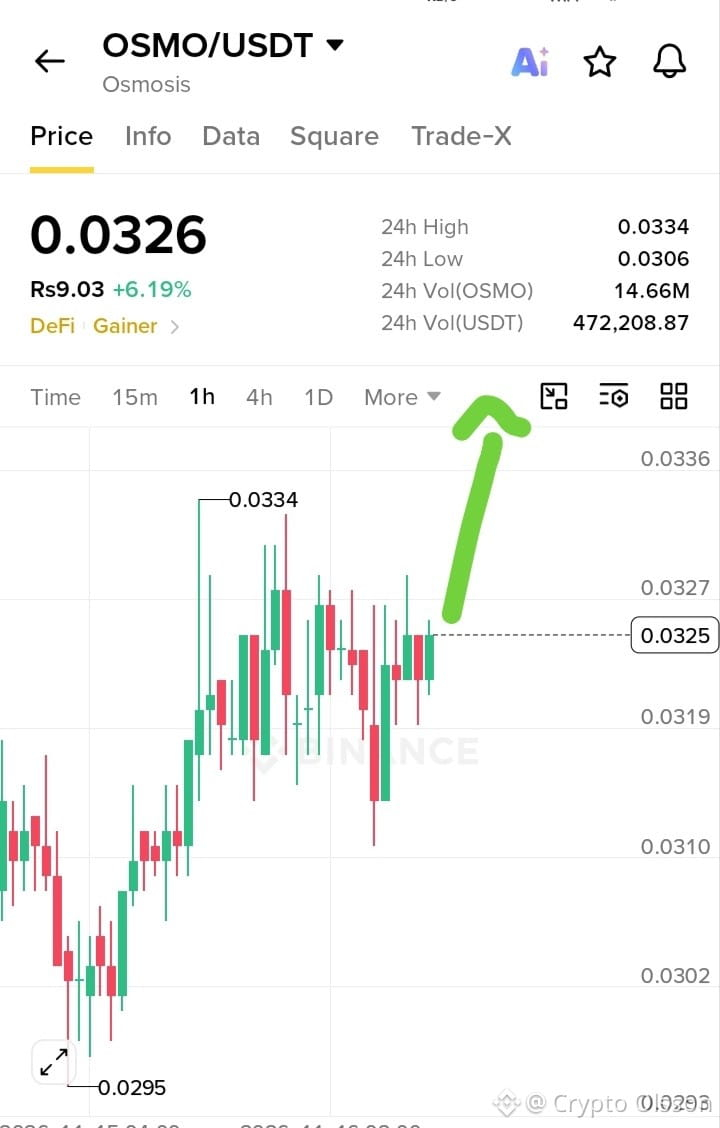
#OSMO is showing positive momentum with a 6.19% daily gain. Buyers are holding near the 0.03250 support area and attempting to challenge resistance at 0.03340. A confirmed breakout could extend the upside toward 0.03360, while losing 0.03190 may weaken the bullish setup. Avoid chasing sudden spikes.
Trade Here On $OSMO 👇.
{spot}(OSMOUSDT)
$OSMO – Bulls Preparing For Another Breakout Attempt?
Trade Setup: Long
Entry zone: 0.03230 – 0.03260 Tp1: 0.03270 Tp2: 0.03340 Tp3: 0.03360 SL: 0.03190
#OSMO is showing positive momentum with a 6.19% daily gain. Buyers are holding near the 0.03250 support area and attempting to challenge resistance at 0.03340. A confirmed breakout could extend the upside toward 0.03360, while losing 0.03190 may weaken the bullish setup. Avoid chasing sudden spikes.
Trade Here On $OSMO 👇.
Trade Setup: Long
Entry zone: 0.03230 – 0.03260 Tp1: 0.03270 Tp2: 0.03340 Tp3: 0.03360 SL: 0.03190
#OSMO is showing positive momentum with a 6.19% daily gain. Buyers are holding near the 0.03250 support area and attempting to challenge resistance at 0.03340. A confirmed breakout could extend the upside toward 0.03360, while losing 0.03190 may weaken the bullish setup. Avoid chasing sudden spikes.
Trade Here On $OSMO 👇.
1
43
Log in to explore more content
Join global crypto users on Binance Square
⚡️ Get latest and useful information about crypto.
💬 Trusted by the world’s largest crypto exchange.
👍 Discover real insights from verified creators.
Email / Phone number
Trending Topics
1
#BTCReboundsAbove$60KAmidWhaleDipBuying
2,679 views
38 Discussing
2
#NvidiaLoses$2.7TrillionInMonthAndAHalf
40,238 views
195 Discussing
3
#GlobalStocksFaceLongestLosingStreakSince2023
379,093 views
2,476 Discussing
4
#BlackRockIBITPostsRecord$541MSingleDayOutflow
54,129 views
136 Discussing
5
#AnthropicPlungesTowardIPOPriceonDay2
197,875 views
1,570 Discussing
6
#TwentyOneCapitalAdds172.25BTC
95,082 views
976 Discussing
7
#HKBillWouldExcludeTokenizedDepositsFromVirtualAssets
14,075 views
64 Discussing
8
#HKBillProposesHK$100KFineForUnauthorizedCryptoTitles
3,435 views
29 Discussing
9
#BitMineFaces$10.1BUnrealizedETHLoss
6,785 views
32 Discussing
10
#StrategyReports$35BNetReserves
3,626 views
20 Discussing