
#optionsradar
optionsradar
140 views
5 Discussing
Hot
Latest

Article
OPTIONS RADAR 07. BITCOIN OPTIONS: IS THE FEAR PREMIUM BEGINNING TO NORMALIZE?November 16, 2026 | Deribit Options Intelligence
Bitcoin options reveal something that spot prices alone cannot show: how much investors are willing to pay for protection against further downside.
The latest data points to elevated downside hedging demand, an inverted volatility term structure and an important distinction between declining fear and a confirmed market recovery.
THE VOLATILITY SNAPSHOT
BTC at-the-money implied volatility:
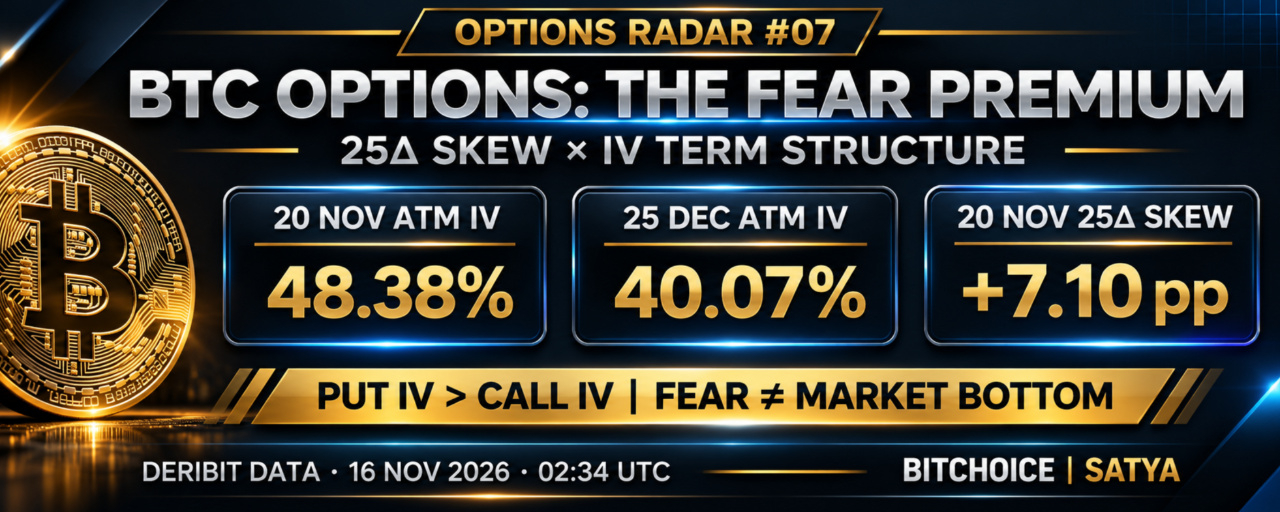
• November 20: 48.38%
• November 27: 43.21%
• December 25: 40.07%
The near-term November 20 expiration carries an 8.31 percentage-point annualized IV premium over December 25.
This indicates that greater volatility is being priced into the near-term options than into longer-dated contracts.
But volatility expectations are not price-direction forecasts.
SIGNAL 1: THE 25-DELTA SKEW
The 25-delta skew compares similarly delta-weighted out-of-the-money puts and calls.
Using Put IV minus Call IV:
• November 20: +7.10 percentage points
• November 27: +7.74 percentage points
• December 25: +5.83 percentage points
A positive reading means downside puts carry higher implied volatility than comparable upside calls.
This is consistent with a premium for downside protection.
The November 20 skew also declined from 17.79 points in the preceding 24-hour comparison window to 7.10 points in the selected snapshot.
That is meaningful normalization of relative option pricing.
However, normalization is not proof that Bitcoin has reached its bottom.
SIGNAL 2: THE INVERTED IV CURVE
Normally, volatility across maturities reflects differing expectations about uncertainty, events and risk premiums.
An elevated front end indicates particularly expensive annualized near-term volatility.
Possible explanations include:
• Immediate downside hedging demand
• Short-term event uncertainty
• Rapid changes in positioning
• Demand for protection after forced liquidations
The curve tells us where uncertainty is concentrated, not where Bitcoin must trade next.
SIGNAL 3: WHY OPEN INTEREST CAN MISLEAD
Put/Call Open Interest is often treated as a simple bullish or bearish indicator.
But options can be bought or sold, hedged, or combined into multi-leg positions.
A large call open interest does not necessarily represent aggressive bullish buying.
Likewise, elevated put demand may reflect portfolio insurance rather than outright bearish speculation.
The most useful interpretation combines skew, term structure, open interest and spot-market liquidity.
STRATEGY ANALYTICS: DIAGONAL CALL SPREADS
An inverted IV curve makes diagonal spreads worth studying.
A typical diagonal call spread combines:
• A purchased longer-dated call
• A written shorter-dated call at a different strike
It can create exposure to differences in time decay, volatility and market direction.
But lower upfront debit does not automatically mean lower overall risk.
The outcome depends on both option prices, spot movements, volatility changes, contract settlement and short-leg management.
Rolling the short leg may require additional capital.
Without a complete option chain and scenario-based P&L, no strategy can be judged attractive from IV differences alone.
WHAT TO WATCH NEXT
Whether 25Δ skew continues to normalizeWhether the near-term IV premium narrowsWhether spot-market depth improvesWhether derivatives leverage rebuilds too quicklyWhether BTC and ETH show consistent changes in risk pricing
MY ASSESSMENT
The options market is showing signs that extreme near-term protection demand may be easing.
But the critical distinction is between a normalization in option premiums and a sustainable return of underlying capital demand.
The first can happen without the second.
THE TAKEAWAY
A decline in the price of fear is an important market development.
It is not a reliable standalone signal to buy Bitcoin.
The stronger evidence of stabilization would come from reduced hedging pressure combined with recovering spot liquidity and healthier positioning.
Source: Pandabull / Deribit, November 16, 2026, 02:34 UTC. Historical options snapshot.
#OptionsRadar #BitcoinOptions #ImpliedVolatility #CryptoMarkets #RiskManagement $BTC
$ETH
{spot}(ETHUSDT)
OPTIONS RADAR 07. BITCOIN OPTIONS: IS THE FEAR PREMIUM BEGINNING TO NORMALIZE?
November 16, 2026 | Deribit Options Intelligence
Bitcoin options reveal something that spot prices alone cannot show: how much investors are willing to pay for protection against further downside.
The latest data points to elevated downside hedging demand, an inverted volatility term structure and an important distinction between declining fear and a confirmed market recovery.
THE VOLATILITY SNAPSHOT
BTC at-the-money implied volatility:
• November 20: 48.38%
• November 27: 43.21%
• December 25: 40.07%
The near-term November 20 expiration carries an 8.31 percentage-point annualized IV premium over December 25.
This indicates that greater volatility is being priced into the near-term options than into longer-dated contracts.
But volatility expectations are not price-direction forecasts.
SIGNAL 1: THE 25-DELTA SKEW
The 25-delta skew compares similarly delta-weighted out-of-the-money puts and calls.
Using Put IV minus Call IV:
• November 20: +7.10 percentage points
• November 27: +7.74 percentage points
• December 25: +5.83 percentage points
A positive reading means downside puts carry higher implied volatility than comparable upside calls.
This is consistent with a premium for downside protection.
The November 20 skew also declined from 17.79 points in the preceding 24-hour comparison window to 7.10 points in the selected snapshot.
That is meaningful normalization of relative option pricing.
However, normalization is not proof that Bitcoin has reached its bottom.
SIGNAL 2: THE INVERTED IV CURVE
Normally, volatility across maturities reflects differing expectations about uncertainty, events and risk premiums.
An elevated front end indicates particularly expensive annualized near-term volatility.
Possible explanations include:
• Immediate downside hedging demand
• Short-term event uncertainty
• Rapid changes in positioning
• Demand for protection after forced liquidations
The curve tells us where uncertainty is concentrated, not where Bitcoin must trade next.
SIGNAL 3: WHY OPEN INTEREST CAN MISLEAD
Put/Call Open Interest is often treated as a simple bullish or bearish indicator.
But options can be bought or sold, hedged, or combined into multi-leg positions.
A large call open interest does not necessarily represent aggressive bullish buying.
Likewise, elevated put demand may reflect portfolio insurance rather than outright bearish speculation.
The most useful interpretation combines skew, term structure, open interest and spot-market liquidity.
STRATEGY ANALYTICS: DIAGONAL CALL SPREADS
An inverted IV curve makes diagonal spreads worth studying.
A typical diagonal call spread combines:
• A purchased longer-dated call
• A written shorter-dated call at a different strike
It can create exposure to differences in time decay, volatility and market direction.
But lower upfront debit does not automatically mean lower overall risk.
The outcome depends on both option prices, spot movements, volatility changes, contract settlement and short-leg management.
Rolling the short leg may require additional capital.
Without a complete option chain and scenario-based P&L, no strategy can be judged attractive from IV differences alone.
WHAT TO WATCH NEXT
Whether 25Δ skew continues to normalizeWhether the near-term IV premium narrowsWhether spot-market depth improvesWhether derivatives leverage rebuilds too quicklyWhether BTC and ETH show consistent changes in risk pricing
MY ASSESSMENT
The options market is showing signs that extreme near-term protection demand may be easing.
But the critical distinction is between a normalization in option premiums and a sustainable return of underlying capital demand.
The first can happen without the second.
THE TAKEAWAY
A decline in the price of fear is an important market development.
It is not a reliable standalone signal to buy Bitcoin.
The stronger evidence of stabilization would come from reduced hedging pressure combined with recovering spot liquidity and healthier positioning.
Source: Pandabull / Deribit, November 16, 2026, 02:34 UTC. Historical options snapshot.
#OptionsRadar #BitcoinOptions #ImpliedVolatility #CryptoMarkets #RiskManagement $BTC
$ETH
Bitcoin options reveal something that spot prices alone cannot show: how much investors are willing to pay for protection against further downside.
The latest data points to elevated downside hedging demand, an inverted volatility term structure and an important distinction between declining fear and a confirmed market recovery.
THE VOLATILITY SNAPSHOT
BTC at-the-money implied volatility:
• November 20: 48.38%
• November 27: 43.21%
• December 25: 40.07%
The near-term November 20 expiration carries an 8.31 percentage-point annualized IV premium over December 25.
This indicates that greater volatility is being priced into the near-term options than into longer-dated contracts.
But volatility expectations are not price-direction forecasts.
SIGNAL 1: THE 25-DELTA SKEW
The 25-delta skew compares similarly delta-weighted out-of-the-money puts and calls.
Using Put IV minus Call IV:
• November 20: +7.10 percentage points
• November 27: +7.74 percentage points
• December 25: +5.83 percentage points
A positive reading means downside puts carry higher implied volatility than comparable upside calls.
This is consistent with a premium for downside protection.
The November 20 skew also declined from 17.79 points in the preceding 24-hour comparison window to 7.10 points in the selected snapshot.
That is meaningful normalization of relative option pricing.
However, normalization is not proof that Bitcoin has reached its bottom.
SIGNAL 2: THE INVERTED IV CURVE
Normally, volatility across maturities reflects differing expectations about uncertainty, events and risk premiums.
An elevated front end indicates particularly expensive annualized near-term volatility.
Possible explanations include:
• Immediate downside hedging demand
• Short-term event uncertainty
• Rapid changes in positioning
• Demand for protection after forced liquidations
The curve tells us where uncertainty is concentrated, not where Bitcoin must trade next.
SIGNAL 3: WHY OPEN INTEREST CAN MISLEAD
Put/Call Open Interest is often treated as a simple bullish or bearish indicator.
But options can be bought or sold, hedged, or combined into multi-leg positions.
A large call open interest does not necessarily represent aggressive bullish buying.
Likewise, elevated put demand may reflect portfolio insurance rather than outright bearish speculation.
The most useful interpretation combines skew, term structure, open interest and spot-market liquidity.
STRATEGY ANALYTICS: DIAGONAL CALL SPREADS
An inverted IV curve makes diagonal spreads worth studying.
A typical diagonal call spread combines:
• A purchased longer-dated call
• A written shorter-dated call at a different strike
It can create exposure to differences in time decay, volatility and market direction.
But lower upfront debit does not automatically mean lower overall risk.
The outcome depends on both option prices, spot movements, volatility changes, contract settlement and short-leg management.
Rolling the short leg may require additional capital.
Without a complete option chain and scenario-based P&L, no strategy can be judged attractive from IV differences alone.
WHAT TO WATCH NEXT
Whether 25Δ skew continues to normalizeWhether the near-term IV premium narrowsWhether spot-market depth improvesWhether derivatives leverage rebuilds too quicklyWhether BTC and ETH show consistent changes in risk pricing
MY ASSESSMENT
The options market is showing signs that extreme near-term protection demand may be easing.
But the critical distinction is between a normalization in option premiums and a sustainable return of underlying capital demand.
The first can happen without the second.
THE TAKEAWAY
A decline in the price of fear is an important market development.
It is not a reliable standalone signal to buy Bitcoin.
The stronger evidence of stabilization would come from reduced hedging pressure combined with recovering spot liquidity and healthier positioning.
Source: Pandabull / Deribit, November 16, 2026, 02:34 UTC. Historical options snapshot.
#OptionsRadar #BitcoinOptions #ImpliedVolatility #CryptoMarkets #RiskManagement $BTC
$ETH
123
🚨BTC vs ETH OPTIONS: WHICH MARKET IS PRICING MORE RISK?
November 12, 2026 | Options Radar #06
Bitcoin and Ethereum face the same uncertain macro environment, but their options markets are pricing volatility differently.
DERIBIT OPTIONS SNAPSHOT
November 12 | 03:00 UTC
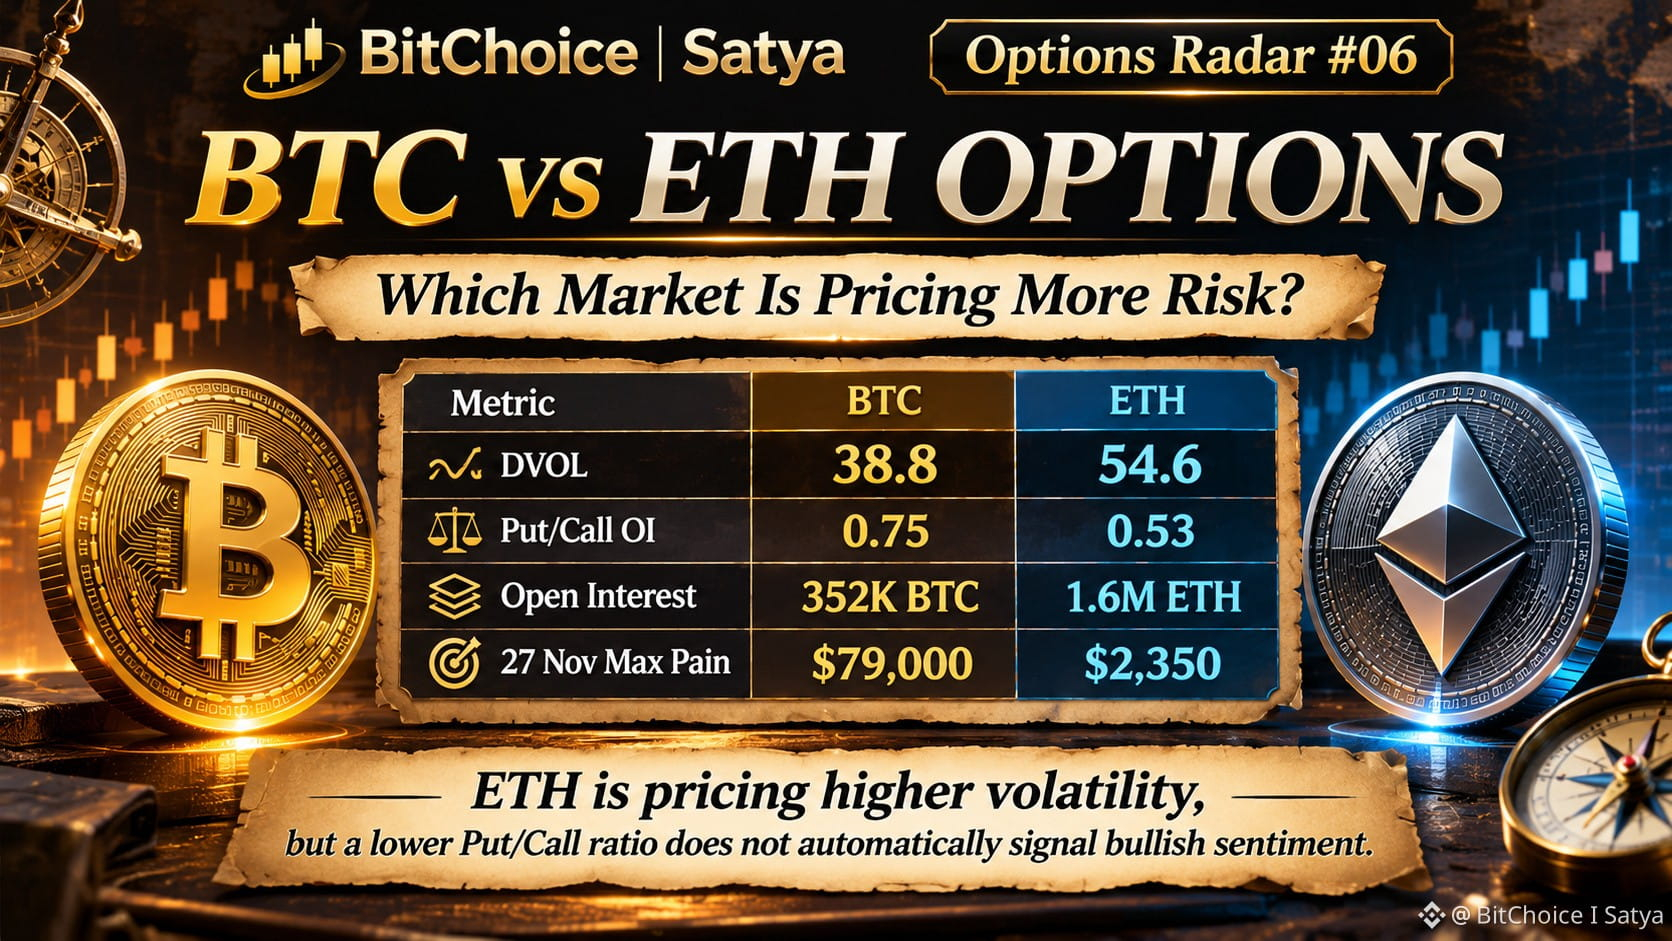
BITCOIN:
• DVOL: 38.8
• Put/Call Open Interest: 0.75
• Total Open Interest: approximately 352,000 BTC
• November 27 Max Pain: $79,000
ETHEREUM:
• DVOL: 54.6
• Put/Call Open Interest: 0.53
• Total Open Interest: approximately 1.6M ETH
• November 27 Max Pain: $2,350
THREE IMPORTANT SIGNALS:
ETH OPTIONS PRICE MORE VOLATILITY
Ethereum's DVOL exceeds Bitcoin's by 15.8 volatility points, implying approximately 41% higher relative volatility expectations.
But higher implied volatility does not predict market direction.
PUT/CALL RATIOS REQUIRE CONTEXT
Both assets have more call than put open interest.
However, this does not automatically indicate bullish positioning. Options may be sold, hedged or combined into complex strategies.
MAX PAIN IS NOT A PRICE TARGET
The November 27 estimated Max Pain levels are $79K for BTC and $2,350 for ETH.
These are theoretical settlement metrics, not guaranteed destinations.
WHY DOES THIS MATTER?
Options markets reveal where volatility is being priced and where exposure is concentrated.
But raw open-interest quantities cannot be directly compared across BTC and ETH without accounting for notional value.
BITCHOICE | SATYA PERSPECTIVE:
Ethereum carries a significantly higher implied volatility premium than Bitcoin.
The next step is determining whether this reflects persistent structural risk or temporary options demand.
Watch 25-delta skew, changes in implied volatility, open interest and spot liquidity ahead of November 27.
Volatility expectations and directional conviction are not the same thing.
$BTC
{spot}(BTCUSDT)
$ETH
{spot}(ETHUSDT)
#OptionsRadar #Bitcoin #Ethereum #CryptoOptions #Derivatives
🚨BTC vs ETH OPTIONS: WHICH MARKET IS PRICING MORE RISK?
November 12, 2026 | Options Radar #06
Bitcoin and Ethereum face the same uncertain macro environment, but their options markets are pricing volatility differently.
DERIBIT OPTIONS SNAPSHOT
November 12 | 03:00 UTC
BITCOIN:
• DVOL: 38.8
• Put/Call Open Interest: 0.75
• Total Open Interest: approximately 352,000 BTC
• November 27 Max Pain: $79,000
ETHEREUM:
• DVOL: 54.6
• Put/Call Open Interest: 0.53
• Total Open Interest: approximately 1.6M ETH
• November 27 Max Pain: $2,350
THREE IMPORTANT SIGNALS:
ETH OPTIONS PRICE MORE VOLATILITY
Ethereum's DVOL exceeds Bitcoin's by 15.8 volatility points, implying approximately 41% higher relative volatility expectations.
But higher implied volatility does not predict market direction.
PUT/CALL RATIOS REQUIRE CONTEXT
Both assets have more call than put open interest.
However, this does not automatically indicate bullish positioning. Options may be sold, hedged or combined into complex strategies.
MAX PAIN IS NOT A PRICE TARGET
The November 27 estimated Max Pain levels are $79K for BTC and $2,350 for ETH.
These are theoretical settlement metrics, not guaranteed destinations.
WHY DOES THIS MATTER?
Options markets reveal where volatility is being priced and where exposure is concentrated.
But raw open-interest quantities cannot be directly compared across BTC and ETH without accounting for notional value.
BITCHOICE | SATYA PERSPECTIVE:
Ethereum carries a significantly higher implied volatility premium than Bitcoin.
The next step is determining whether this reflects persistent structural risk or temporary options demand.
Watch 25-delta skew, changes in implied volatility, open interest and spot liquidity ahead of November 27.
Volatility expectations and directional conviction are not the same thing.
$BTC
$ETH
#OptionsRadar #Bitcoin #Ethereum #CryptoOptions #Derivatives
November 12, 2026 | Options Radar #06
Bitcoin and Ethereum face the same uncertain macro environment, but their options markets are pricing volatility differently.
DERIBIT OPTIONS SNAPSHOT
November 12 | 03:00 UTC
BITCOIN:
• DVOL: 38.8
• Put/Call Open Interest: 0.75
• Total Open Interest: approximately 352,000 BTC
• November 27 Max Pain: $79,000
ETHEREUM:
• DVOL: 54.6
• Put/Call Open Interest: 0.53
• Total Open Interest: approximately 1.6M ETH
• November 27 Max Pain: $2,350
THREE IMPORTANT SIGNALS:
ETH OPTIONS PRICE MORE VOLATILITY
Ethereum's DVOL exceeds Bitcoin's by 15.8 volatility points, implying approximately 41% higher relative volatility expectations.
But higher implied volatility does not predict market direction.
PUT/CALL RATIOS REQUIRE CONTEXT
Both assets have more call than put open interest.
However, this does not automatically indicate bullish positioning. Options may be sold, hedged or combined into complex strategies.
MAX PAIN IS NOT A PRICE TARGET
The November 27 estimated Max Pain levels are $79K for BTC and $2,350 for ETH.
These are theoretical settlement metrics, not guaranteed destinations.
WHY DOES THIS MATTER?
Options markets reveal where volatility is being priced and where exposure is concentrated.
But raw open-interest quantities cannot be directly compared across BTC and ETH without accounting for notional value.
BITCHOICE | SATYA PERSPECTIVE:
Ethereum carries a significantly higher implied volatility premium than Bitcoin.
The next step is determining whether this reflects persistent structural risk or temporary options demand.
Watch 25-delta skew, changes in implied volatility, open interest and spot liquidity ahead of November 27.
Volatility expectations and directional conviction are not the same thing.
$BTC
$ETH
#OptionsRadar #Bitcoin #Ethereum #CryptoOptions #Derivatives
1
113
🚨BITCOIN OPTIONS: $74K SPOT, $79K MAX PAIN — WHAT COMES NEXT?
Bitcoin options markets are revealing important positioning signals following the latest U.S. inflation data.
DERIBIT OPTIONS SNAPSHOT
November 11, 2026 | 02:00 UTC
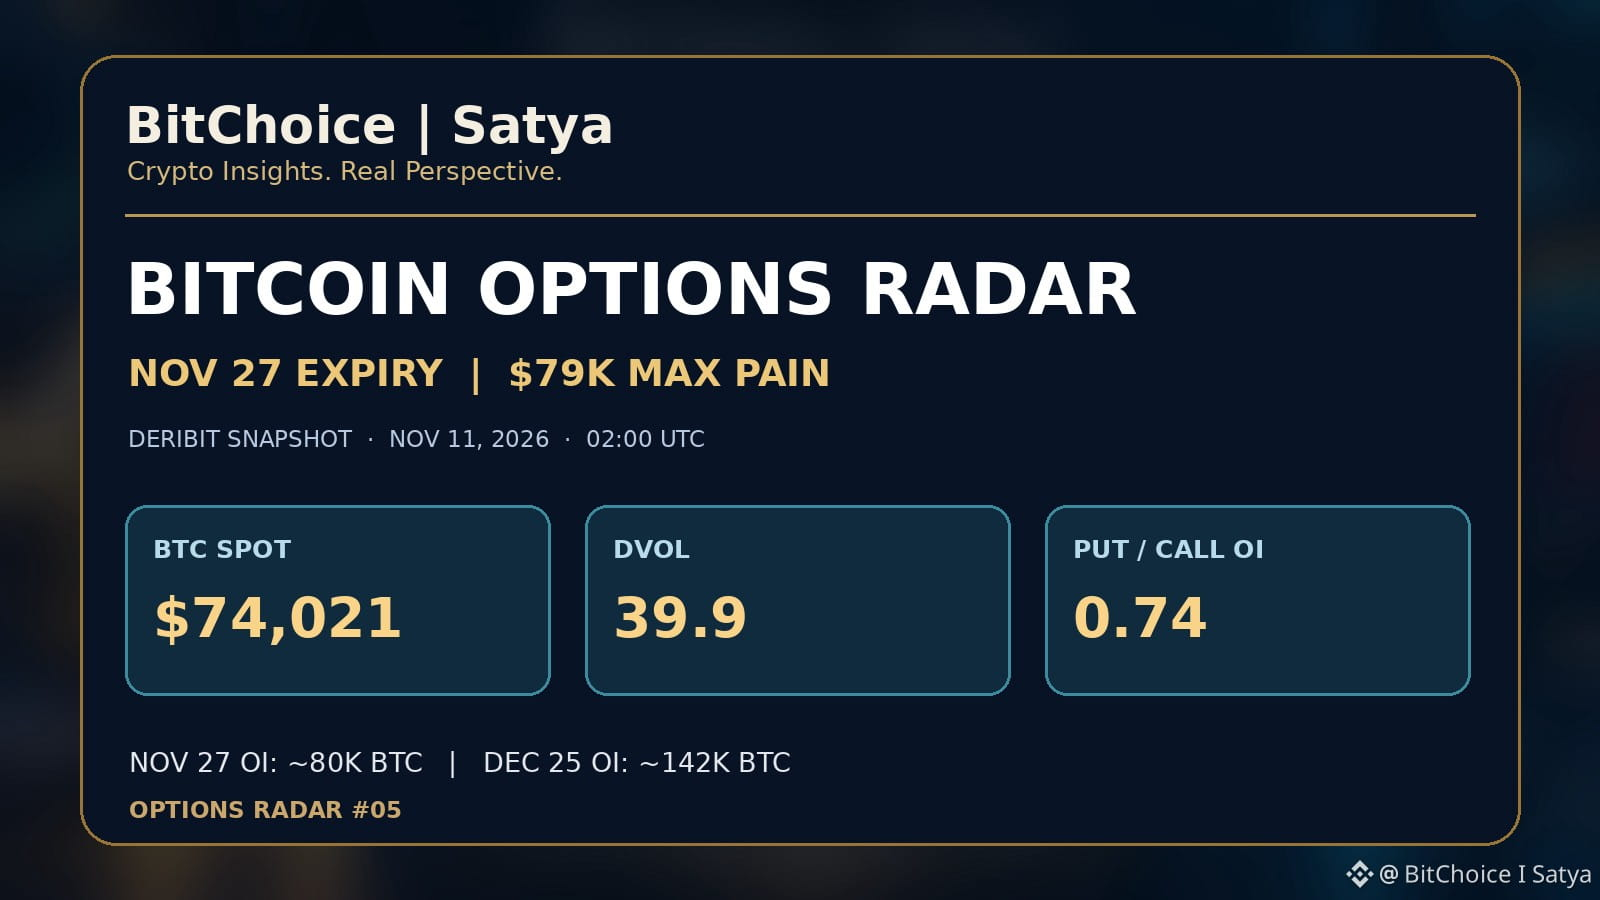
• BTC spot: approximately $74,021
• DVOL: 39.9
• Put/Call open interest ratio: 0.74
• November 27 expiry: approximately 80,000 BTC in open interest
• November 27 Max Pain: $79,000
• December 25 expiry: approximately 142,000 BTC in open interest
WHAT DO THESE NUMBERS TELL US?
VOLATILITY EXPECTATIONS
DVOL near 40 reflects the market-implied level of BTC volatility over approximately 30 days.
It does not predict whether Bitcoin will rise or fall.
PUT/CALL POSITIONING
A ratio of 0.74 indicates more call than put open interest.
However, this does not automatically mean bullish positioning. Options can be sold, hedged or combined into complex strategies.
NOVEMBER 27 EXPIRY
The estimated $79K Max Pain level is above the reported BTC spot price.
But Max Pain is a theoretical settlement metric, not a guaranteed price target.
YEAR-END EXPOSURE
The December 25 expiry carries substantial open interest, making year-end positioning another important factor.
BITCHOICE | SATYA PERSPECTIVE:
Options open interest reveals where market exposure is concentrated, not where Bitcoin must trade next.
Watch 25-delta skew, implied volatility, changes in open interest and spot liquidity to assess whether downside hedging is intensifying.
A sustainable BTC recovery requires genuine demand, not simply a favorable options expiry structure.
#OptionsRadar #Bitcoin #BTCOptions #Deribit $BTC
{spot}(BTCUSDT)
🚨BITCOIN OPTIONS: $74K SPOT, $79K MAX PAIN — WHAT COMES NEXT?
Bitcoin options markets are revealing important positioning signals following the latest U.S. inflation data.
DERIBIT OPTIONS SNAPSHOT
November 11, 2026 | 02:00 UTC
• BTC spot: approximately $74,021
• DVOL: 39.9
• Put/Call open interest ratio: 0.74
• November 27 expiry: approximately 80,000 BTC in open interest
• November 27 Max Pain: $79,000
• December 25 expiry: approximately 142,000 BTC in open interest
WHAT DO THESE NUMBERS TELL US?
VOLATILITY EXPECTATIONS
DVOL near 40 reflects the market-implied level of BTC volatility over approximately 30 days.
It does not predict whether Bitcoin will rise or fall.
PUT/CALL POSITIONING
A ratio of 0.74 indicates more call than put open interest.
However, this does not automatically mean bullish positioning. Options can be sold, hedged or combined into complex strategies.
NOVEMBER 27 EXPIRY
The estimated $79K Max Pain level is above the reported BTC spot price.
But Max Pain is a theoretical settlement metric, not a guaranteed price target.
YEAR-END EXPOSURE
The December 25 expiry carries substantial open interest, making year-end positioning another important factor.
BITCHOICE | SATYA PERSPECTIVE:
Options open interest reveals where market exposure is concentrated, not where Bitcoin must trade next.
Watch 25-delta skew, implied volatility, changes in open interest and spot liquidity to assess whether downside hedging is intensifying.
A sustainable BTC recovery requires genuine demand, not simply a favorable options expiry structure.
#OptionsRadar #Bitcoin #BTCOptions #Deribit $BTC
Bitcoin options markets are revealing important positioning signals following the latest U.S. inflation data.
DERIBIT OPTIONS SNAPSHOT
November 11, 2026 | 02:00 UTC
• BTC spot: approximately $74,021
• DVOL: 39.9
• Put/Call open interest ratio: 0.74
• November 27 expiry: approximately 80,000 BTC in open interest
• November 27 Max Pain: $79,000
• December 25 expiry: approximately 142,000 BTC in open interest
WHAT DO THESE NUMBERS TELL US?
VOLATILITY EXPECTATIONS
DVOL near 40 reflects the market-implied level of BTC volatility over approximately 30 days.
It does not predict whether Bitcoin will rise or fall.
PUT/CALL POSITIONING
A ratio of 0.74 indicates more call than put open interest.
However, this does not automatically mean bullish positioning. Options can be sold, hedged or combined into complex strategies.
NOVEMBER 27 EXPIRY
The estimated $79K Max Pain level is above the reported BTC spot price.
But Max Pain is a theoretical settlement metric, not a guaranteed price target.
YEAR-END EXPOSURE
The December 25 expiry carries substantial open interest, making year-end positioning another important factor.
BITCHOICE | SATYA PERSPECTIVE:
Options open interest reveals where market exposure is concentrated, not where Bitcoin must trade next.
Watch 25-delta skew, implied volatility, changes in open interest and spot liquidity to assess whether downside hedging is intensifying.
A sustainable BTC recovery requires genuine demand, not simply a favorable options expiry structure.
#OptionsRadar #Bitcoin #BTCOptions #Deribit $BTC
97
🚨SPX vs BTC: SAME SELLOFF, DIFFERENT FEAR
Two markets. Similar losses. Different options-market reactions.
S&P 500 — Rising Demand for Protection
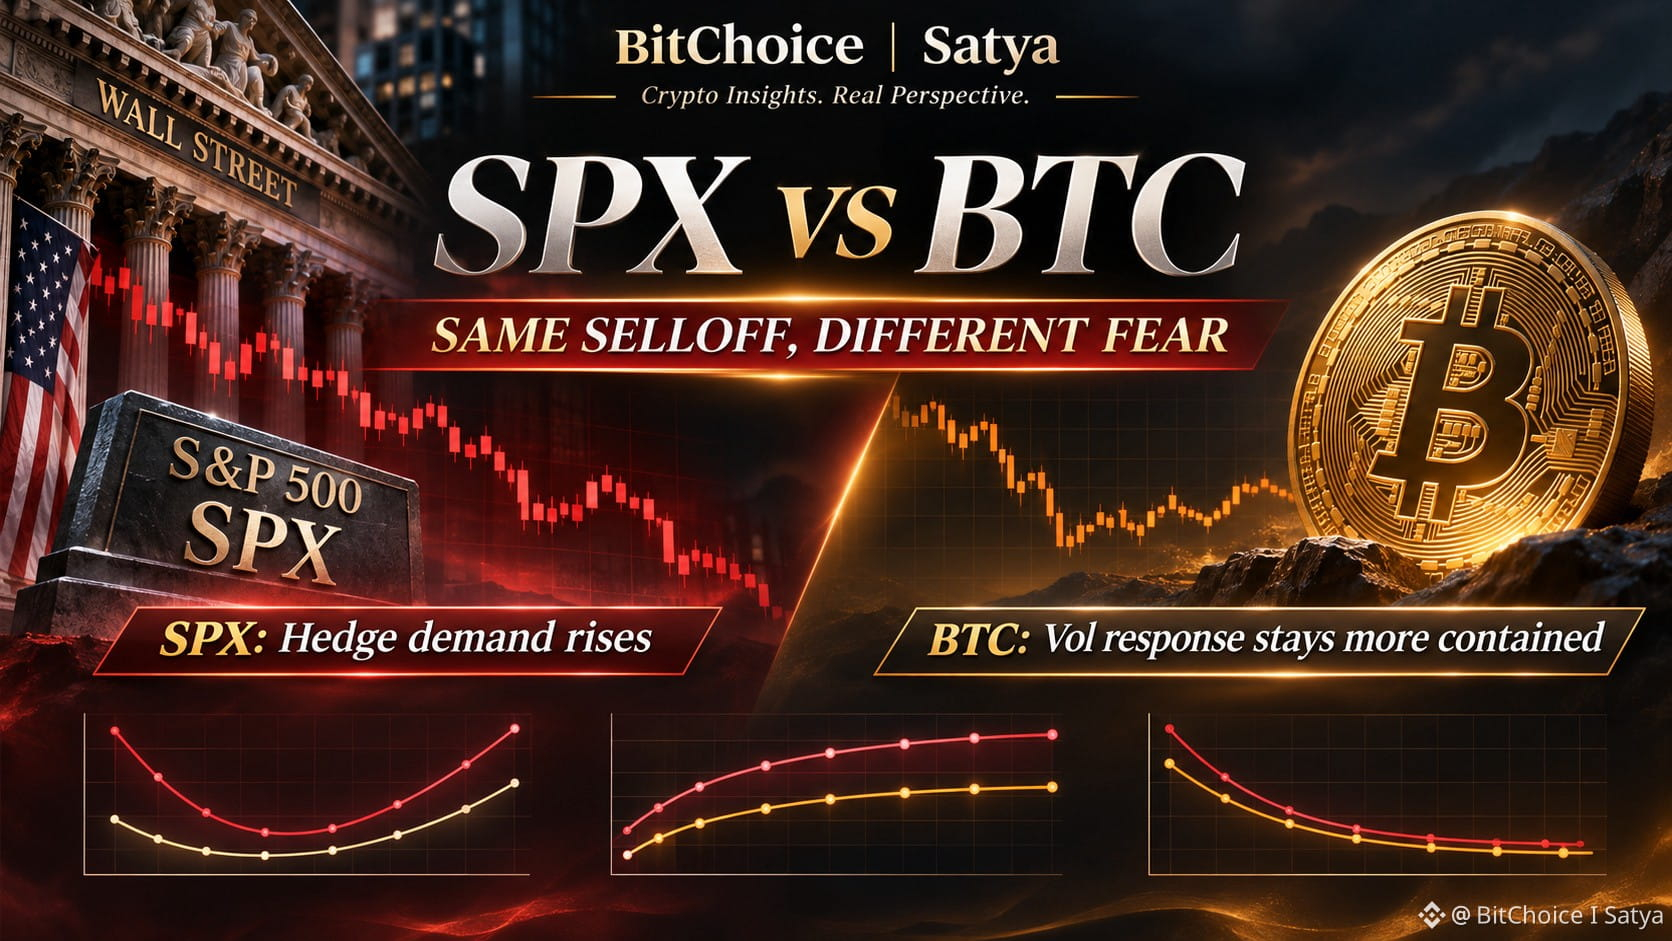
The S&P 500 fell 2.69% last week, while the VIX climbed 6.22%.
SPX 25Δ put skew increased from 3.7% to 5.0%, suggesting stronger demand for downside hedging.
Bitcoin — A More Contained Response
BTC declined 2.86% to $75,790, but its options market showed less aggressive volatility repricing.
• Weekly IV: −0.2 percentage points.
• 1M–6M IV: +0.7 to +1.0 percentage points.
• IV Rank: 12.8% → 14.5%.
• 25Δ skew: −3.49%, indicating a continued put premium without a sharp escalation in hedging demand.
BitChoice | Satya Perspective
Similar price declines do not imply identical risk expectations.
Equity options showed a clearer shift toward downside protection. Bitcoin options remained comparatively stable, despite modest increases in longer-term volatility.
This divergence suggests different hedging dynamics, not that BTC is immune to further selling.
What to watch: BTC skew, near-term IV, and whether broader risk aversion spreads into crypto derivatives.
$SPX $BTC #OptionsRadar #Bitcoin #SPX #CryptoOptions #MarketVolatility
{spot}(BTCUSDT)
{future}(SPXUSDT)
#OptionsRadar #Bitcoin #SPX #CryptoOptions #MarketVolatility
🚨SPX vs BTC: SAME SELLOFF, DIFFERENT FEAR
Two markets. Similar losses. Different options-market reactions.
S&P 500 — Rising Demand for Protection
The S&P 500 fell 2.69% last week, while the VIX climbed 6.22%.
SPX 25Δ put skew increased from 3.7% to 5.0%, suggesting stronger demand for downside hedging.
Bitcoin — A More Contained Response
BTC declined 2.86% to $75,790, but its options market showed less aggressive volatility repricing.
• Weekly IV: −0.2 percentage points.
• 1M–6M IV: +0.7 to +1.0 percentage points.
• IV Rank: 12.8% → 14.5%.
• 25Δ skew: −3.49%, indicating a continued put premium without a sharp escalation in hedging demand.
BitChoice | Satya Perspective
Similar price declines do not imply identical risk expectations.
Equity options showed a clearer shift toward downside protection. Bitcoin options remained comparatively stable, despite modest increases in longer-term volatility.
This divergence suggests different hedging dynamics, not that BTC is immune to further selling.
What to watch: BTC skew, near-term IV, and whether broader risk aversion spreads into crypto derivatives.
$SPX $BTC #OptionsRadar #Bitcoin #SPX #CryptoOptions #MarketVolatility
#OptionsRadar #Bitcoin #SPX #CryptoOptions #MarketVolatility
Two markets. Similar losses. Different options-market reactions.
S&P 500 — Rising Demand for Protection
The S&P 500 fell 2.69% last week, while the VIX climbed 6.22%.
SPX 25Δ put skew increased from 3.7% to 5.0%, suggesting stronger demand for downside hedging.
Bitcoin — A More Contained Response
BTC declined 2.86% to $75,790, but its options market showed less aggressive volatility repricing.
• Weekly IV: −0.2 percentage points.
• 1M–6M IV: +0.7 to +1.0 percentage points.
• IV Rank: 12.8% → 14.5%.
• 25Δ skew: −3.49%, indicating a continued put premium without a sharp escalation in hedging demand.
BitChoice | Satya Perspective
Similar price declines do not imply identical risk expectations.
Equity options showed a clearer shift toward downside protection. Bitcoin options remained comparatively stable, despite modest increases in longer-term volatility.
This divergence suggests different hedging dynamics, not that BTC is immune to further selling.
What to watch: BTC skew, near-term IV, and whether broader risk aversion spreads into crypto derivatives.
$SPX $BTC #OptionsRadar #Bitcoin #SPX #CryptoOptions #MarketVolatility
#OptionsRadar #Bitcoin #SPX #CryptoOptions #MarketVolatility
152
Log in to explore more content
Join global crypto users on Binance Square
⚡️ Get latest and useful information about crypto.
💬 Trusted by the world’s largest crypto exchange.
👍 Discover real insights from verified creators.
Email / Phone number
Trending Topics
1
#CanBTCReboundAfterFallingBelow60K?
439,213 views
1,867 Discussing
2
#GlobalStocksFaceLongestLosingStreakSince2023
148,467 views
1,309 Discussing
3
#BlackRockIBITPostsRecord$541MSingleDayOutflow
4,598 views
41 Discussing
4
#AnthropicPlungesTowardIPOPriceonDay2
71,485 views
731 Discussing
5
#TwentyOneCapitalAdds172.25BTC
22,355 views
267 Discussing
6
#HKBillWouldExcludeTokenizedDepositsFromVirtualAssets
2,539 views
26 Discussing
7
#BNBDropsBelow540USDTWith8.46%DailyDecline
41,732 views
362 Discussing
8
#HKBillProposesHK$100KFineForUnauthorizedCryptoTitles
1,455 views
19 Discussing
9
#BitMineFaces$10.1BUnrealizedETHLoss
2,623 views
25 Discussing
10
#StrategyReports$35BNetReserves
2,315 views
18 Discussing