
#technicaltrading
technicaltrading
280,998 views
2,035 Discussing
Hot
Latest

·
--
Bearish
A strong recovery in $ANTB would need more than one green candle. Look for improving trading volume, higher lows and a successful reclaim of nearby resistance. If price continues to form lower highs, the bearish structure may remain intact. Confirmation should come before aggressive entries.
#ANTB #PriceAction #ANTB #TechnicalTrading #CryptoSignals
A strong recovery in $ANTB would need more than one green candle. Look for improving trading volume, higher lows and a successful reclaim of nearby resistance. If price continues to form lower highs, the bearish structure may remain intact. Confirmation should come before aggressive entries.
#ANTB #PriceAction #ANTB #TechnicalTrading #CryptoSignals
#ANTB #PriceAction #ANTB #TechnicalTrading #CryptoSignals
3

SPACE maintained gradual bullish momentum, proving that steady growth often creates stronger trading setups than extreme short-term pumps. Experienced traders are monitoring breakout zones and overall market participation carefully before scaling positions. Smart risk management and controlled leverage remain essential tools for navigating volatile crypto environments successfully. #CryptoUpdates #TechnicalTrading #DigitalFinance #Web3
SPACE maintained gradual bullish momentum, proving that steady growth often creates stronger trading setups than extreme short-term pumps. Experienced traders are monitoring breakout zones and overall market participation carefully before scaling positions. Smart risk management and controlled leverage remain essential tools for navigating volatile crypto environments successfully. #CryptoUpdates #TechnicalTrading #DigitalFinance #Web3
223

·
--
Bullish
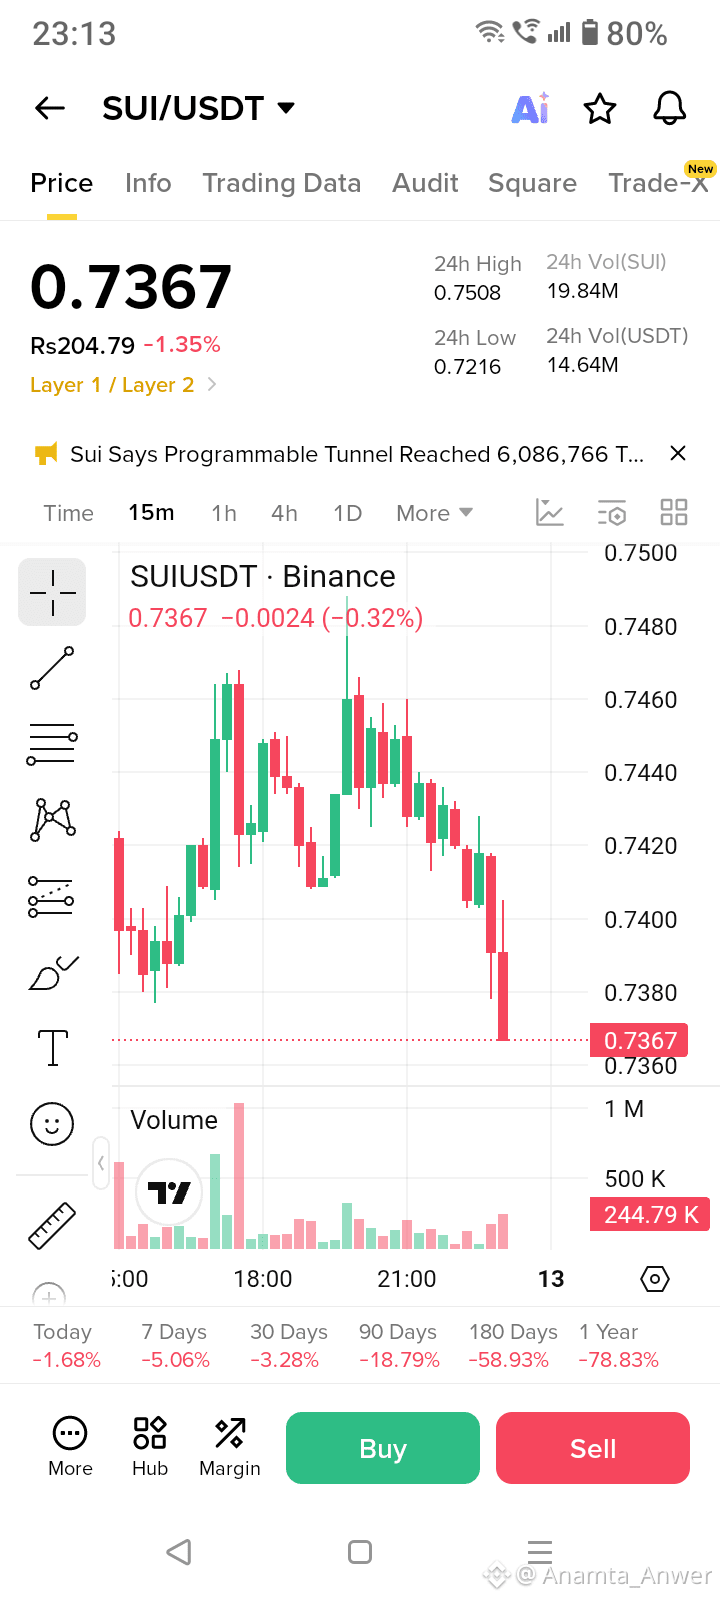
"Monitoring $SUI closely as it tests its current support levels. While the bounce looks promising, we need a decisive move above [Insert Price Level, e.g., $0.95] to confirm a trend reversal. Without a breakout, expect the current consolidation to persist. Keeping a close eye on volume for the next move! 📈
{future}(SUIUSDT)
#SUI #CryptoAnalysis #TechnicalTrading
"Monitoring $SUI closely as it tests its current support levels. While the bounce looks promising, we need a decisive move above [Insert Price Level, e.g., $0.95] to confirm a trend reversal. Without a breakout, expect the current consolidation to persist. Keeping a close eye on volume for the next move! 📈
#SUI #CryptoAnalysis #TechnicalTrading
#SUI #CryptoAnalysis #TechnicalTrading
91

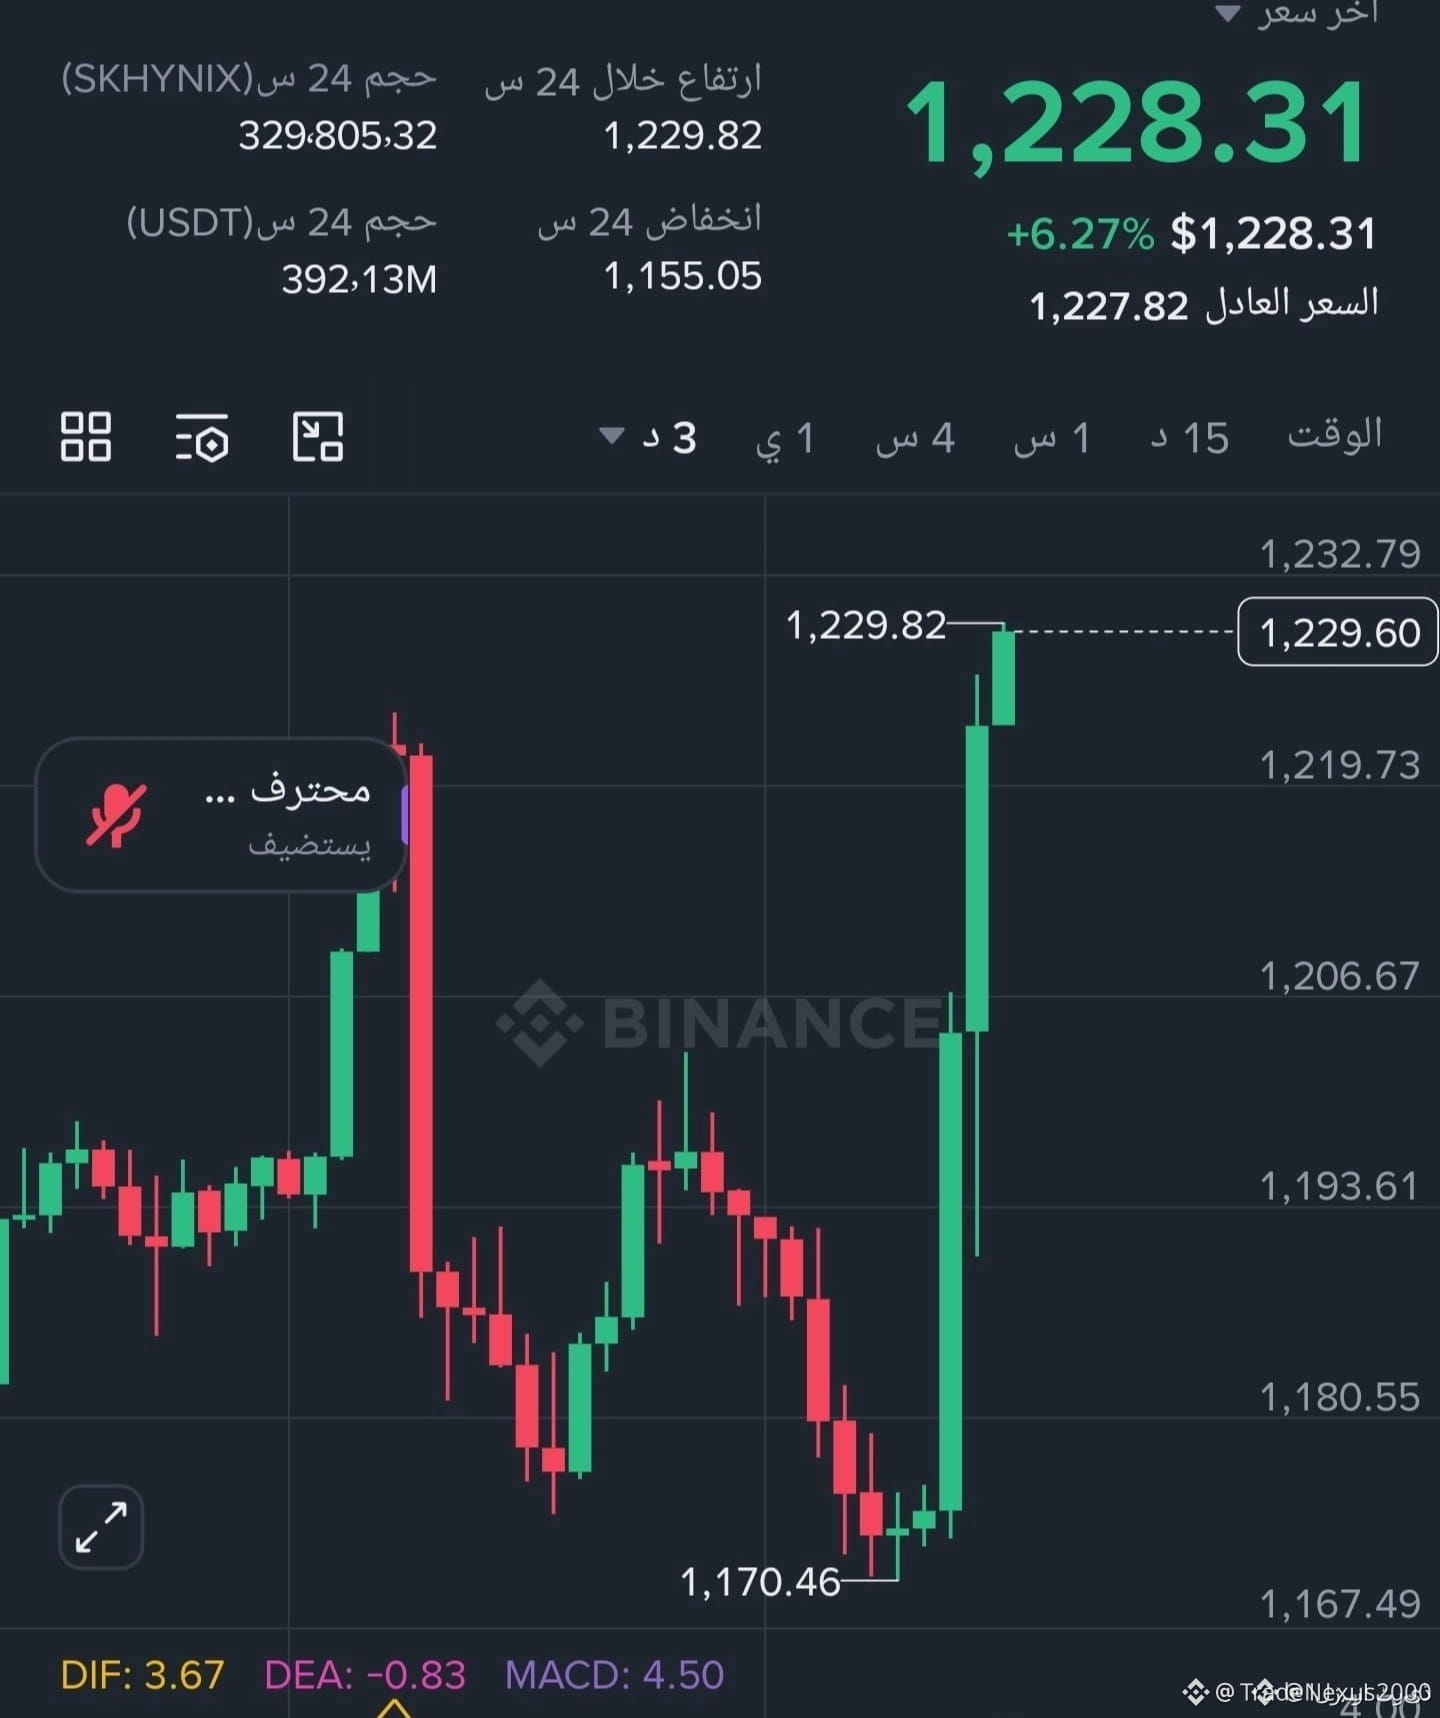
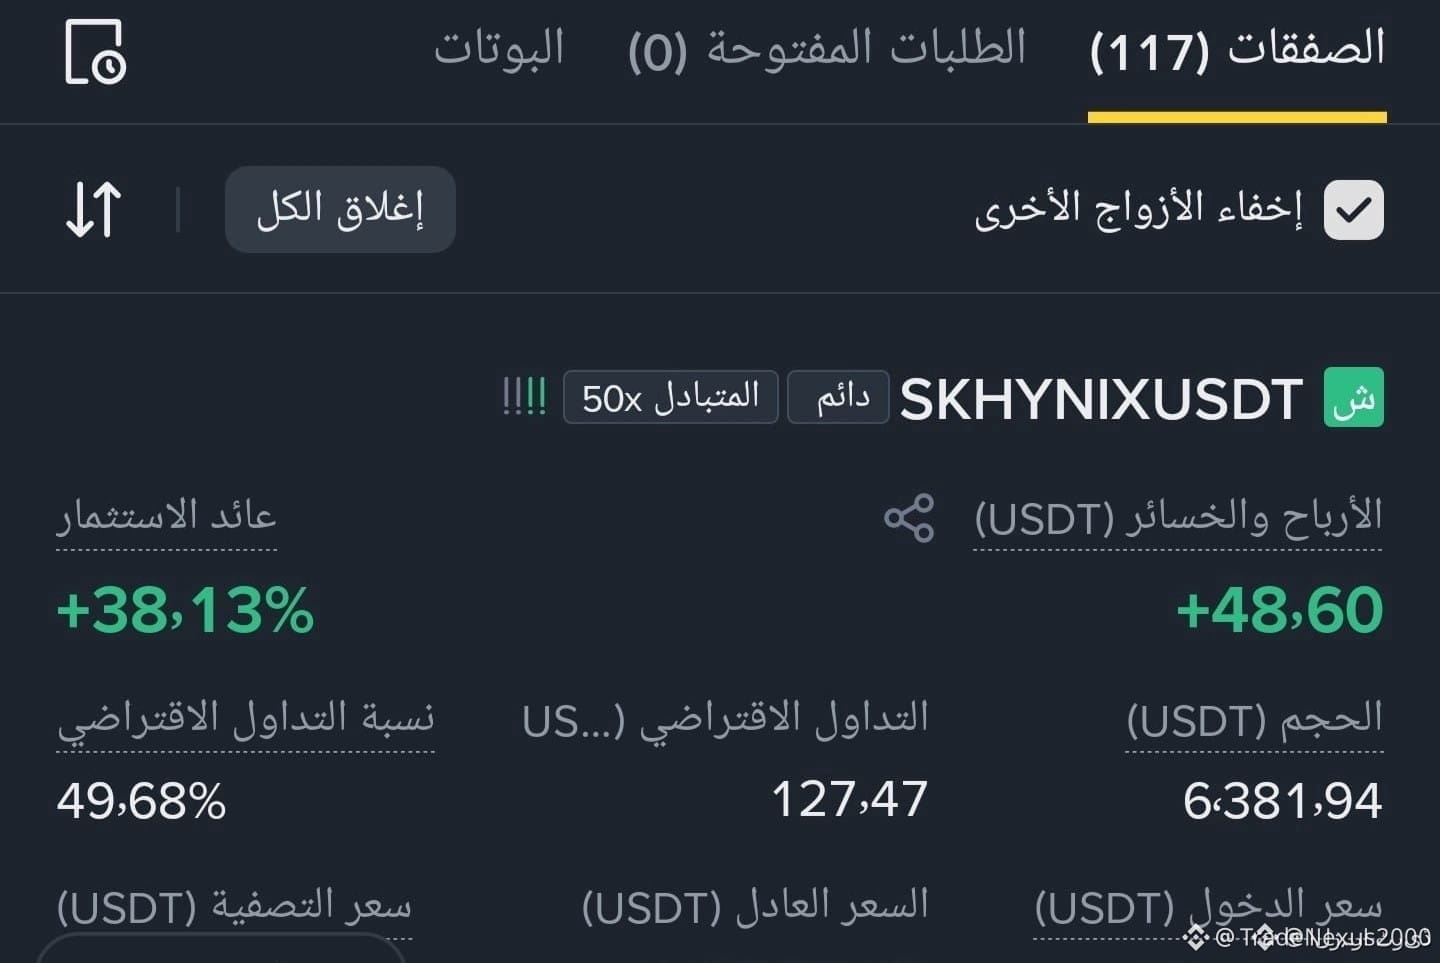
$SKHYNIX IS BUILDING LIQUIDITY ABOVE A KEY ORDER BLOCK 🔥
Body:
This token is tightening into a range that has historically preceded directional moves. Volume declining on pullbacks suggests sellers are losing conviction while higher timeframe structure remains intact. The 4H chart shows clear liquidity clusters above current price that often get swept before continuation.
If you're watching this setup, what's your line in the sand for invalidating the bullish thesis?
Not financial advice. Always manage your risk.
#SKHYNIX #CryptoSetup #VolumeAnalysis #TechnicalTrading
🔥
$SKHYNIX IS BUILDING LIQUIDITY ABOVE A KEY ORDER BLOCK 🔥
Body:
This token is tightening into a range that has historically preceded directional moves. Volume declining on pullbacks suggests sellers are losing conviction while higher timeframe structure remains intact. The 4H chart shows clear liquidity clusters above current price that often get swept before continuation.
If you're watching this setup, what's your line in the sand for invalidating the bullish thesis?
Not financial advice. Always manage your risk.
#SKHYNIX #CryptoSetup #VolumeAnalysis #TechnicalTrading
🔥
Body:
This token is tightening into a range that has historically preceded directional moves. Volume declining on pullbacks suggests sellers are losing conviction while higher timeframe structure remains intact. The 4H chart shows clear liquidity clusters above current price that often get swept before continuation.
If you're watching this setup, what's your line in the sand for invalidating the bullish thesis?
Not financial advice. Always manage your risk.
#SKHYNIX #CryptoSetup #VolumeAnalysis #TechnicalTrading
🔥
133
·
--
Article
TRX AT PERFECT BALANCE: VWAP & PRICE ALIGNED – BREAKOUT LOADING?Price is perfectly glued to VWAP at $0.3290 – the calm before the storm is here.
📊 CURRENT PRICE & IMMEDIATE TREND
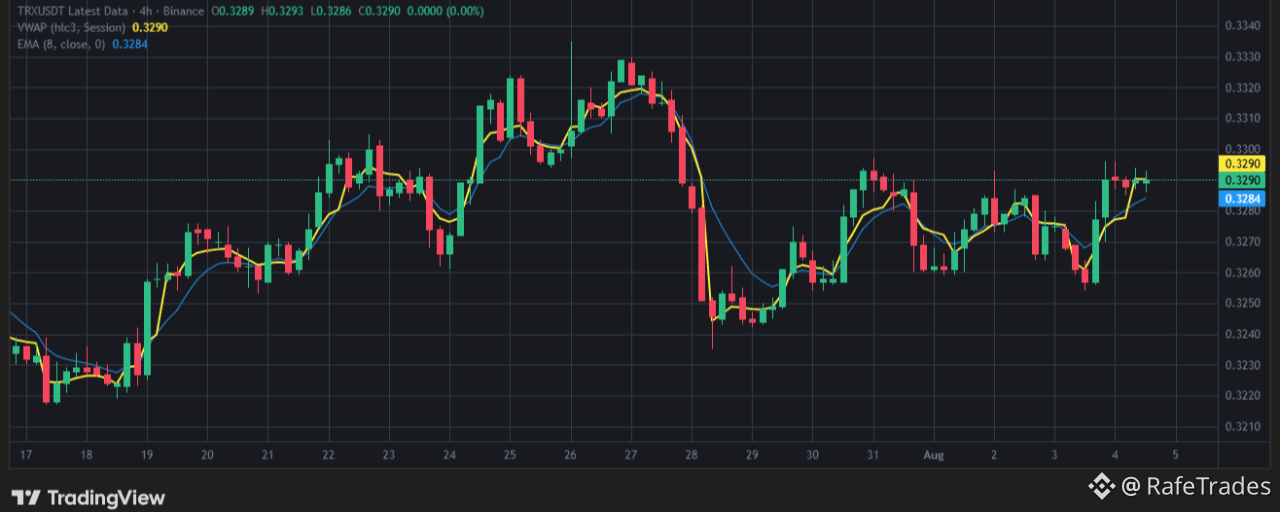
$TRX is trading at $0.3290, flat at 0.00% on the 4H Binance chart.Price is exactly at VWAP and above EMA (8) – a rare equilibrium state.The doji-like candle indicates extreme indecision – a volatile move is brewing.
📈 INDICATOR BREAKDOWN
VWAP (hTc3, Session): $0.3290 – Price is trading precisely at this level, signaling a perfect balance between buyers and sellers.EMA (8, close, 0): $0.3284 – This is the dynamic support. Price is holding comfortably above it, favoring the bulls in the intermediate term.The tight spread of just 0.0006 between VWAP and EMA suggests a compression zone that will soon explode.
🚧 SUPPORT & RESISTANCE LEVELS (THE COIL)
Upside Targets (Bullish):
First hurdle: $0.3293 (today's high) – breaking this triggers a chase to $0.3300.Next resistance: $0.3310 – a clean break targets $0.3320.The ultimate bull magnet is $0.3340 – a major supply zone from recent peaks.
Downside Risk (Bearish):
Immediate support: $0.3286 (today's low) – losing this opens the door to $0.3284 (EMA 8).Critical support: $0.3284 – a breakdown below would trigger a cascade to $0.3280.If $0.3280 fails, the next floors are $0.3270, $0.3260, and $0.3250.
⚔️ THE GAME PLAN FOR TRADERS
For the Bulls: Enter on a 4H close above $0.3293 (today's high). Stop at $0.3284. Targets: $0.3300 → $0.3310 → $0.3340.For the Bears: Short on a 4H close below $0.3284 (EMA 8). Stop at $0.3295. Targets: $0.3280 → $0.3270 → $0.3260.Wait for the breakout – this is a classic coil setup. Do not trade in the middle.
❓ THE ENGAGEMENT HOOK
$TRX is coiling at VWAP – are you buying the breakout above 0.3293 or shorting the breakdown? Drop your bias below! 👇
#TRX #Write2Earn #TechnicalTrading
⚠️ Disclaimer: This article is for informational purposes only and is not financial advice. Always do your own research (DYOR).
TRX AT PERFECT BALANCE: VWAP & PRICE ALIGNED – BREAKOUT LOADING?
Price is perfectly glued to VWAP at $0.3290 – the calm before the storm is here.
📊 CURRENT PRICE & IMMEDIATE TREND
$TRX is trading at $0.3290, flat at 0.00% on the 4H Binance chart.Price is exactly at VWAP and above EMA (8) – a rare equilibrium state.The doji-like candle indicates extreme indecision – a volatile move is brewing.
📈 INDICATOR BREAKDOWN
VWAP (hTc3, Session): $0.3290 – Price is trading precisely at this level, signaling a perfect balance between buyers and sellers.EMA (8, close, 0): $0.3284 – This is the dynamic support. Price is holding comfortably above it, favoring the bulls in the intermediate term.The tight spread of just 0.0006 between VWAP and EMA suggests a compression zone that will soon explode.
🚧 SUPPORT & RESISTANCE LEVELS (THE COIL)
Upside Targets (Bullish):
First hurdle: $0.3293 (today's high) – breaking this triggers a chase to $0.3300.Next resistance: $0.3310 – a clean break targets $0.3320.The ultimate bull magnet is $0.3340 – a major supply zone from recent peaks.
Downside Risk (Bearish):
Immediate support: $0.3286 (today's low) – losing this opens the door to $0.3284 (EMA 8).Critical support: $0.3284 – a breakdown below would trigger a cascade to $0.3280.If $0.3280 fails, the next floors are $0.3270, $0.3260, and $0.3250.
⚔️ THE GAME PLAN FOR TRADERS
For the Bulls: Enter on a 4H close above $0.3293 (today's high). Stop at $0.3284. Targets: $0.3300 → $0.3310 → $0.3340.For the Bears: Short on a 4H close below $0.3284 (EMA 8). Stop at $0.3295. Targets: $0.3280 → $0.3270 → $0.3260.Wait for the breakout – this is a classic coil setup. Do not trade in the middle.
❓ THE ENGAGEMENT HOOK
$TRX is coiling at VWAP – are you buying the breakout above 0.3293 or shorting the breakdown? Drop your bias below! 👇
#TRX #Write2Earn #TechnicalTrading
⚠️ Disclaimer: This article is for informational purposes only and is not financial advice. Always do your own research (DYOR).
📊 CURRENT PRICE & IMMEDIATE TREND
$TRX is trading at $0.3290, flat at 0.00% on the 4H Binance chart.Price is exactly at VWAP and above EMA (8) – a rare equilibrium state.The doji-like candle indicates extreme indecision – a volatile move is brewing.
📈 INDICATOR BREAKDOWN
VWAP (hTc3, Session): $0.3290 – Price is trading precisely at this level, signaling a perfect balance between buyers and sellers.EMA (8, close, 0): $0.3284 – This is the dynamic support. Price is holding comfortably above it, favoring the bulls in the intermediate term.The tight spread of just 0.0006 between VWAP and EMA suggests a compression zone that will soon explode.
🚧 SUPPORT & RESISTANCE LEVELS (THE COIL)
Upside Targets (Bullish):
First hurdle: $0.3293 (today's high) – breaking this triggers a chase to $0.3300.Next resistance: $0.3310 – a clean break targets $0.3320.The ultimate bull magnet is $0.3340 – a major supply zone from recent peaks.
Downside Risk (Bearish):
Immediate support: $0.3286 (today's low) – losing this opens the door to $0.3284 (EMA 8).Critical support: $0.3284 – a breakdown below would trigger a cascade to $0.3280.If $0.3280 fails, the next floors are $0.3270, $0.3260, and $0.3250.
⚔️ THE GAME PLAN FOR TRADERS
For the Bulls: Enter on a 4H close above $0.3293 (today's high). Stop at $0.3284. Targets: $0.3300 → $0.3310 → $0.3340.For the Bears: Short on a 4H close below $0.3284 (EMA 8). Stop at $0.3295. Targets: $0.3280 → $0.3270 → $0.3260.Wait for the breakout – this is a classic coil setup. Do not trade in the middle.
❓ THE ENGAGEMENT HOOK
$TRX is coiling at VWAP – are you buying the breakout above 0.3293 or shorting the breakdown? Drop your bias below! 👇
#TRX #Write2Earn #TechnicalTrading
⚠️ Disclaimer: This article is for informational purposes only and is not financial advice. Always do your own research (DYOR).
11
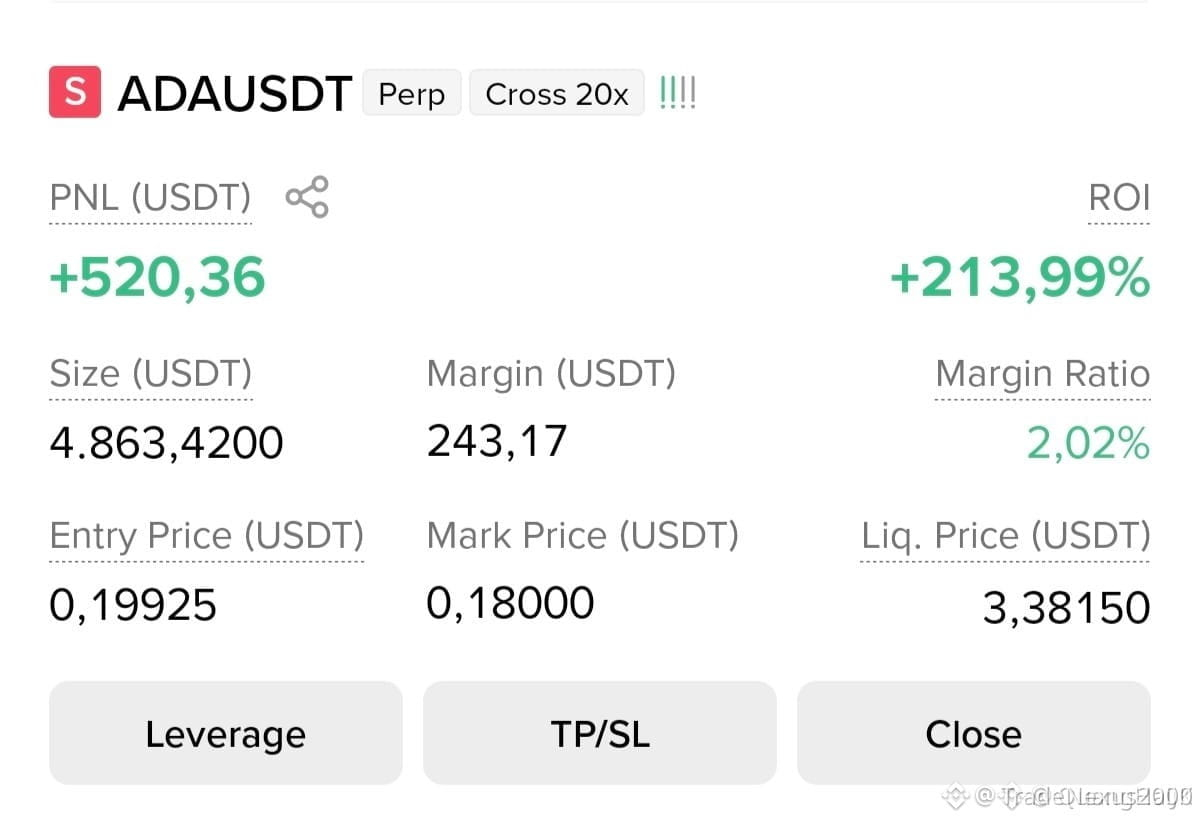
$ADA SHORT SETUP FROM A HIGH-PROBABILITY LIQUIDITY ZONE ⚡
Entry: 0.1878 - 0.2177 🔥
Targets: 0.1789 / 0.1566 / 0.1245 🚀
Stop Loss: 0.2376 ⚠️
This sell zone sits directly above a key order block that has rejected price twice in the past week. The 4H structure shows a clear break of market structure to the downside, and the first target aligns with the previous swing low. Volume is declining on the recent push up, suggesting weak buying pressure at these levels.
The multiple target structure gives you room to scale out while maintaining a favorable risk-to-reward. Are you shorting from this zone or waiting for a retest of the entry range?
Not financial advice. Always manage your risk.
#ADA #ShortSetup #CryptoAnalysis #TechnicalTrading
⚡
$ADA SHORT SETUP FROM A HIGH-PROBABILITY LIQUIDITY ZONE ⚡
Entry: 0.1878 - 0.2177 🔥
Targets: 0.1789 / 0.1566 / 0.1245 🚀
Stop Loss: 0.2376 ⚠️
This sell zone sits directly above a key order block that has rejected price twice in the past week. The 4H structure shows a clear break of market structure to the downside, and the first target aligns with the previous swing low. Volume is declining on the recent push up, suggesting weak buying pressure at these levels.
The multiple target structure gives you room to scale out while maintaining a favorable risk-to-reward. Are you shorting from this zone or waiting for a retest of the entry range?
Not financial advice. Always manage your risk.
#ADA #ShortSetup #CryptoAnalysis #TechnicalTrading
⚡
Entry: 0.1878 - 0.2177 🔥
Targets: 0.1789 / 0.1566 / 0.1245 🚀
Stop Loss: 0.2376 ⚠️
This sell zone sits directly above a key order block that has rejected price twice in the past week. The 4H structure shows a clear break of market structure to the downside, and the first target aligns with the previous swing low. Volume is declining on the recent push up, suggesting weak buying pressure at these levels.
The multiple target structure gives you room to scale out while maintaining a favorable risk-to-reward. Are you shorting from this zone or waiting for a retest of the entry range?
Not financial advice. Always manage your risk.
#ADA #ShortSetup #CryptoAnalysis #TechnicalTrading
⚡
93

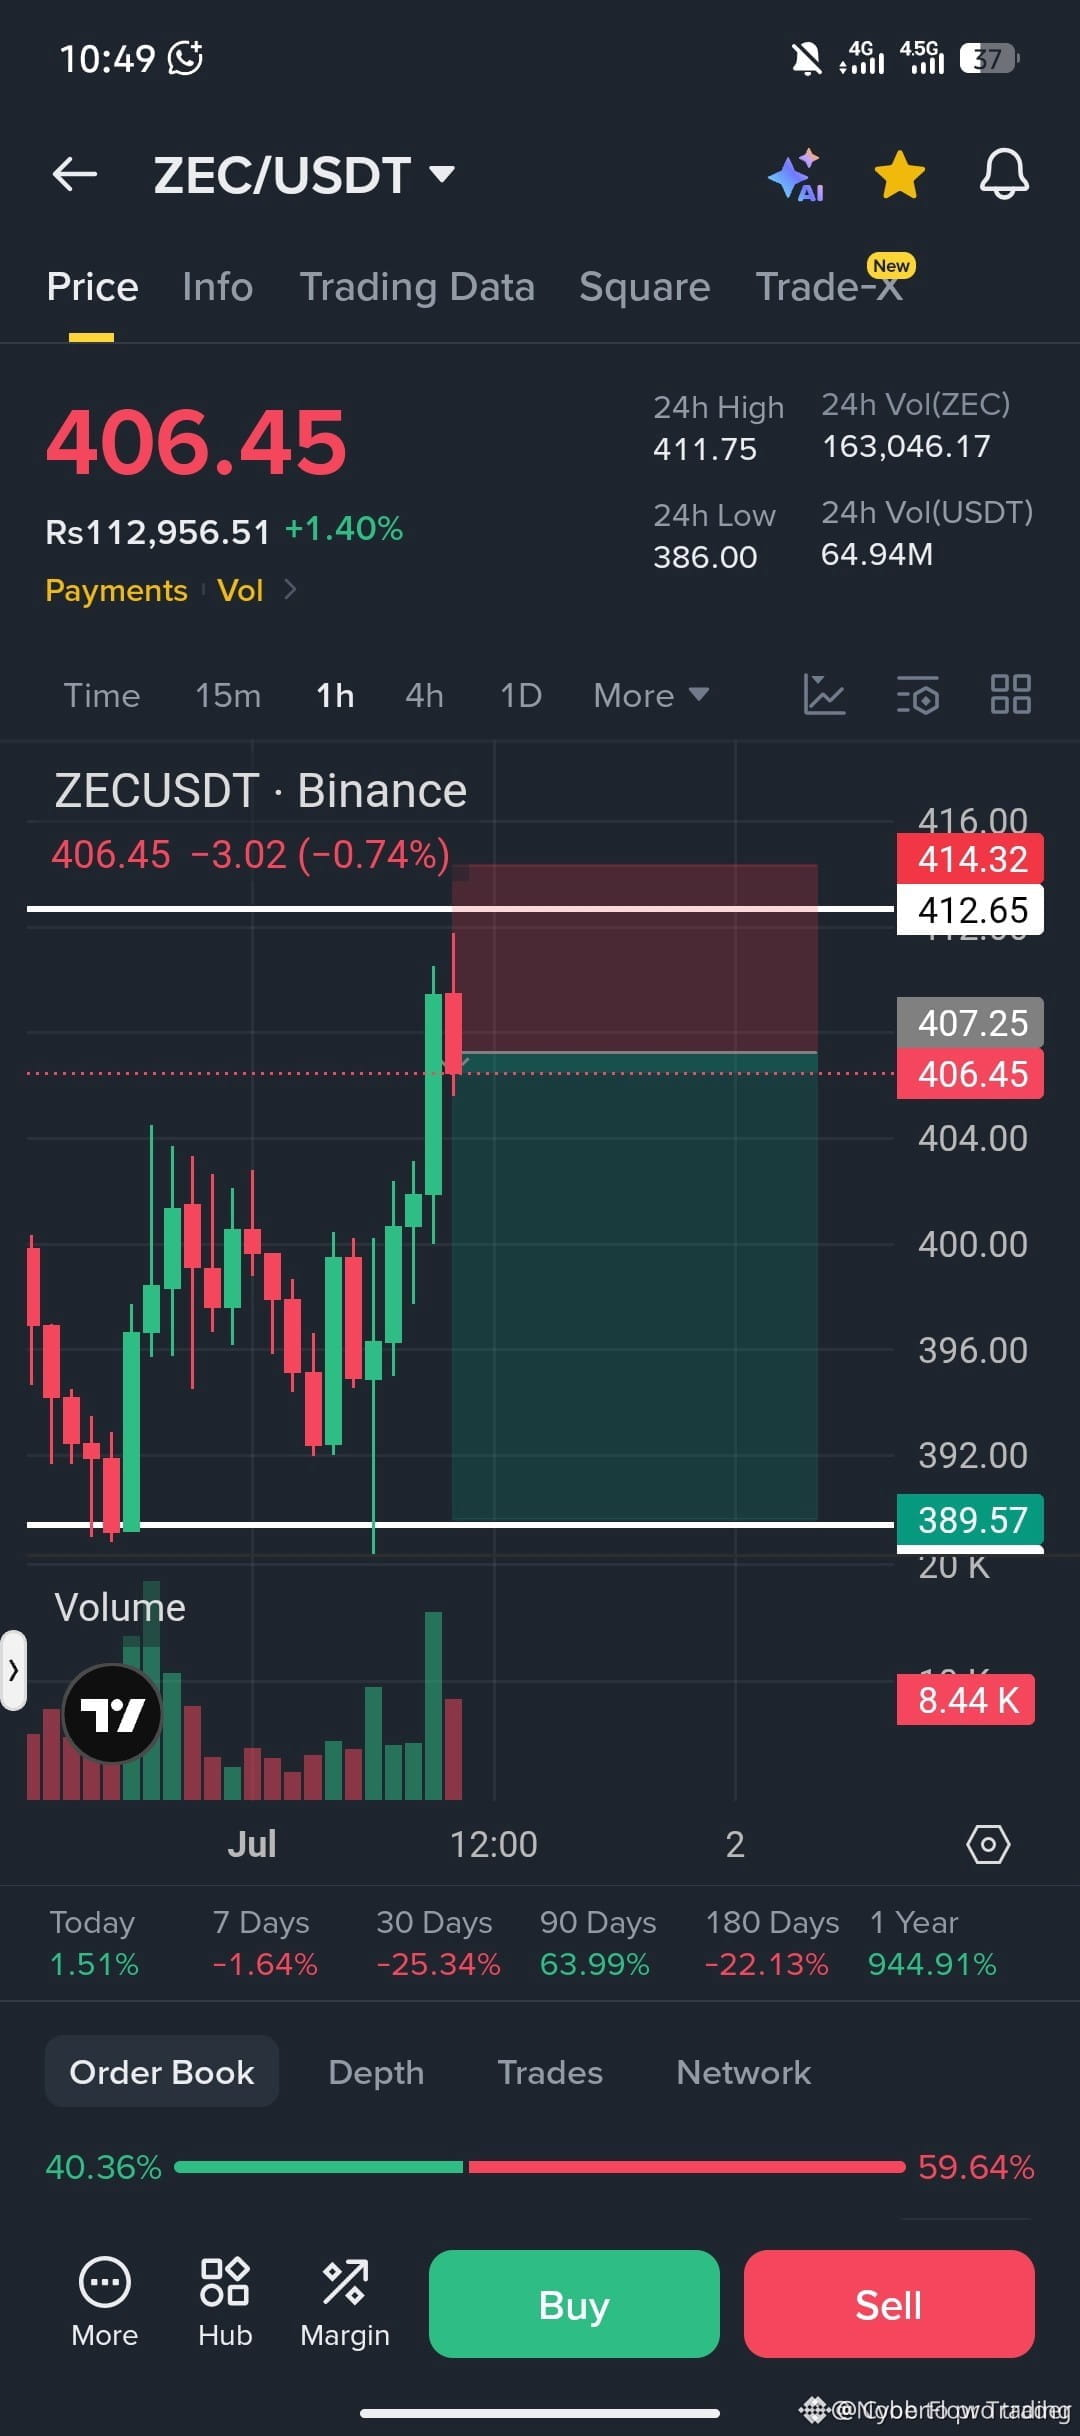
$ZEC REJECTED AT 411 – SHORTING THE BOUNCE FAILURE ⚡
Entry: 406.00 🔥
Target: 398.00 🚀
Stop Loss: 412.00 ⚠️
That 411.75 rejection was sharp – the bounce tried to hold but is already fading. When a key level gets tested and sellers step back in with volume, the retrace usually comes fast. I'm entering at 406 with my stop just above the high, and my first target is 398 – with a shot at 390 if the dump accelerates.
Volume is confirming the rejection, and the structure looks like a textbook failed bounce. Ever shorted a rejection like this before?
Not financial advice. Always manage your risk.
#ZEC #ShortSetup #Rejection #TechnicalTrading
⚡
$ZEC REJECTED AT 411 – SHORTING THE BOUNCE FAILURE ⚡
Entry: 406.00 🔥
Target: 398.00 🚀
Stop Loss: 412.00 ⚠️
That 411.75 rejection was sharp – the bounce tried to hold but is already fading. When a key level gets tested and sellers step back in with volume, the retrace usually comes fast. I'm entering at 406 with my stop just above the high, and my first target is 398 – with a shot at 390 if the dump accelerates.
Volume is confirming the rejection, and the structure looks like a textbook failed bounce. Ever shorted a rejection like this before?
Not financial advice. Always manage your risk.
#ZEC #ShortSetup #Rejection #TechnicalTrading
⚡
Entry: 406.00 🔥
Target: 398.00 🚀
Stop Loss: 412.00 ⚠️
That 411.75 rejection was sharp – the bounce tried to hold but is already fading. When a key level gets tested and sellers step back in with volume, the retrace usually comes fast. I'm entering at 406 with my stop just above the high, and my first target is 398 – with a shot at 390 if the dump accelerates.
Volume is confirming the rejection, and the structure looks like a textbook failed bounce. Ever shorted a rejection like this before?
Not financial advice. Always manage your risk.
#ZEC #ShortSetup #Rejection #TechnicalTrading
⚡
68

·
--
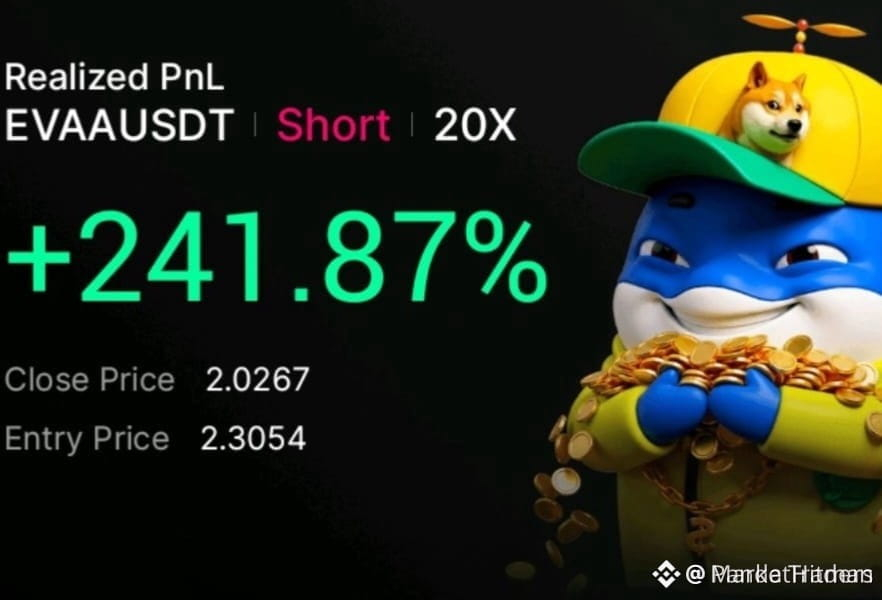
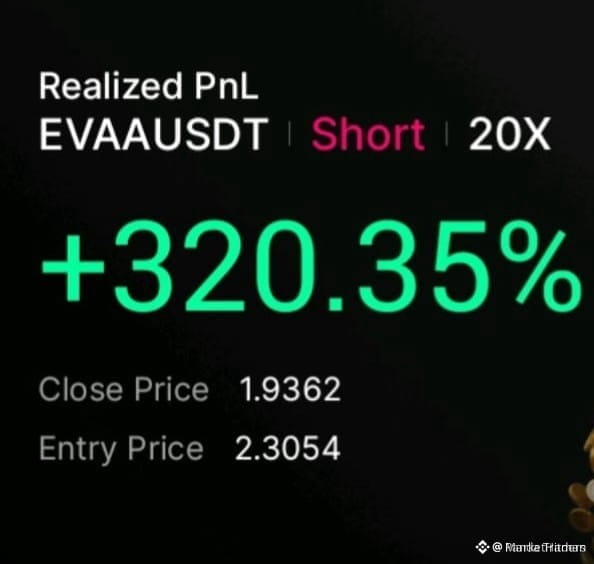
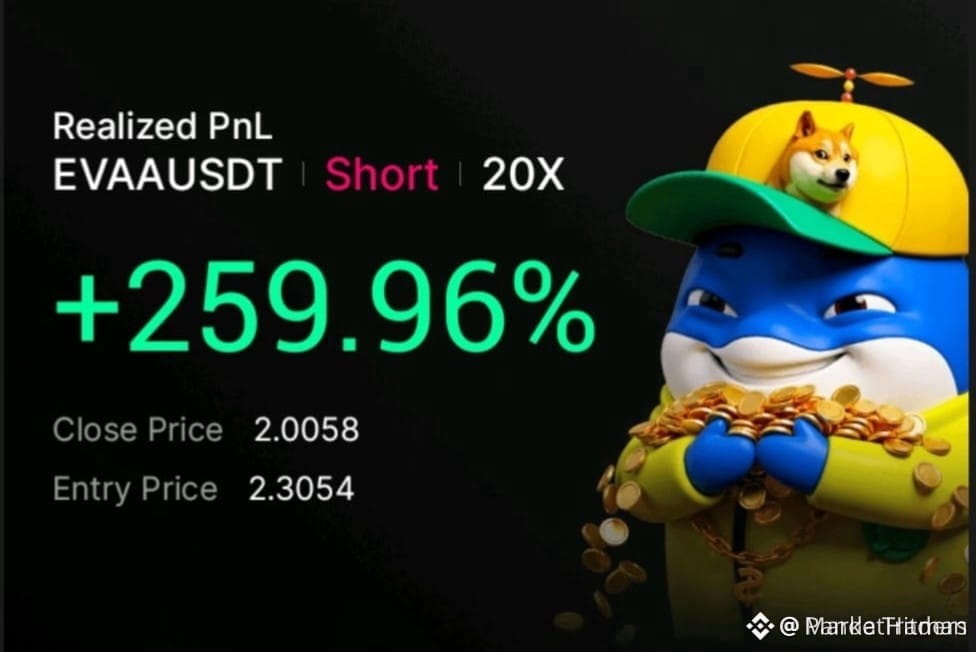
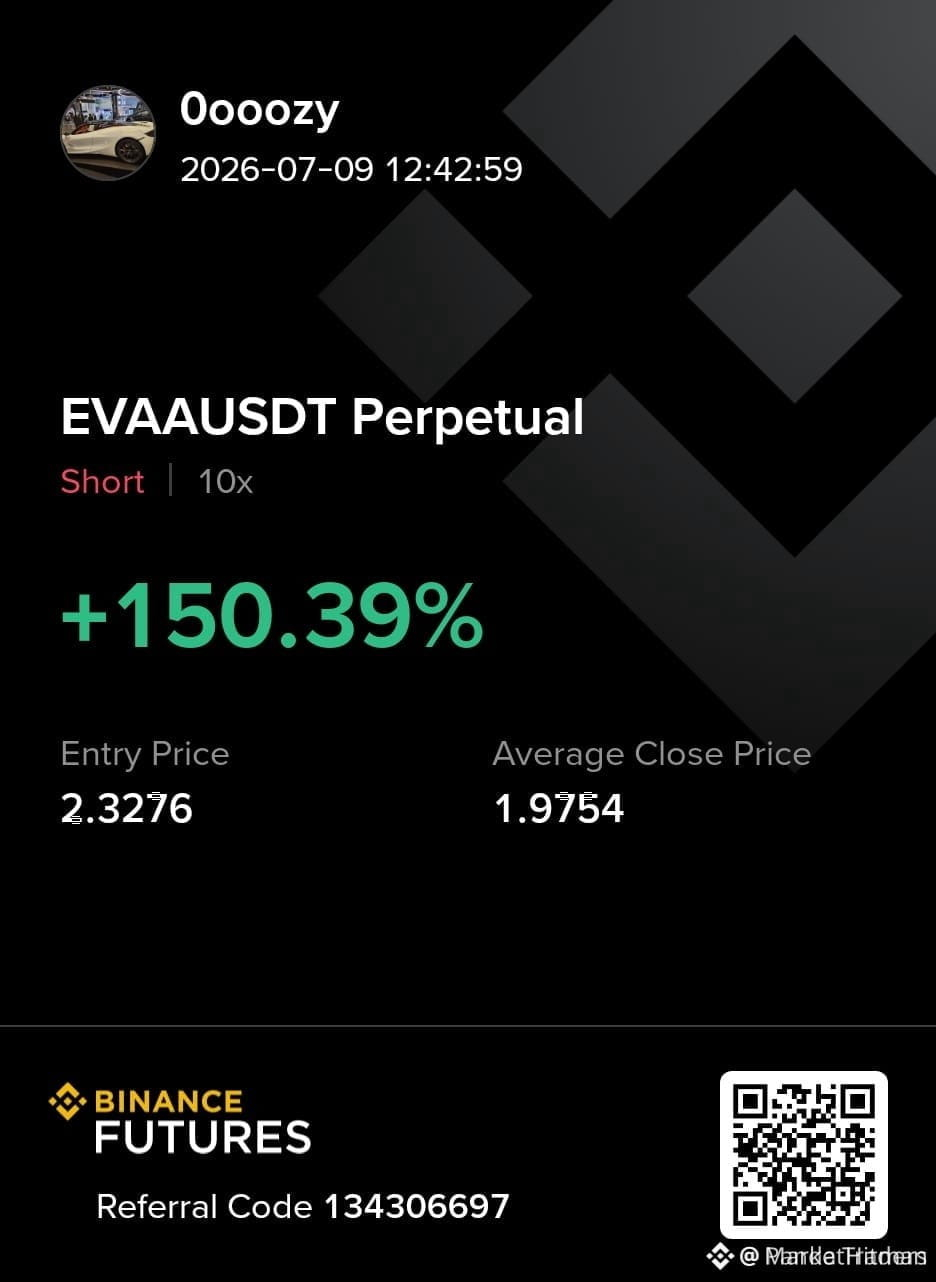
$EVAA SHORT SETUP DELIVERED A CLEAN STRUCTURAL BREAKDOWN 📉
Body:
The short on $EVAA played out exactly as the order flow suggested. Price swept the swing high liquidity, then broke below the key 4H support with a closing candle that printed 40% higher volume than the 20-period average. That volume divergence confirms the bearish conviction.
The lower timeframe is now consolidating inside a fair value gap — a potential retest zone for those who missed the initial move. Are you waiting for a retest or already positioned?
Not financial advice. Always manage your risk.
#EVAA #ShortSetup #CryptoAnalysis #TechnicalTrading
📉
$EVAA SHORT SETUP DELIVERED A CLEAN STRUCTURAL BREAKDOWN 📉
Body:
The short on $EVAA played out exactly as the order flow suggested. Price swept the swing high liquidity, then broke below the key 4H support with a closing candle that printed 40% higher volume than the 20-period average. That volume divergence confirms the bearish conviction.
The lower timeframe is now consolidating inside a fair value gap — a potential retest zone for those who missed the initial move. Are you waiting for a retest or already positioned?
Not financial advice. Always manage your risk.
#EVAA #ShortSetup #CryptoAnalysis #TechnicalTrading
📉
Body:
The short on $EVAA played out exactly as the order flow suggested. Price swept the swing high liquidity, then broke below the key 4H support with a closing candle that printed 40% higher volume than the 20-period average. That volume divergence confirms the bearish conviction.
The lower timeframe is now consolidating inside a fair value gap — a potential retest zone for those who missed the initial move. Are you waiting for a retest or already positioned?
Not financial advice. Always manage your risk.
#EVAA #ShortSetup #CryptoAnalysis #TechnicalTrading
📉
166

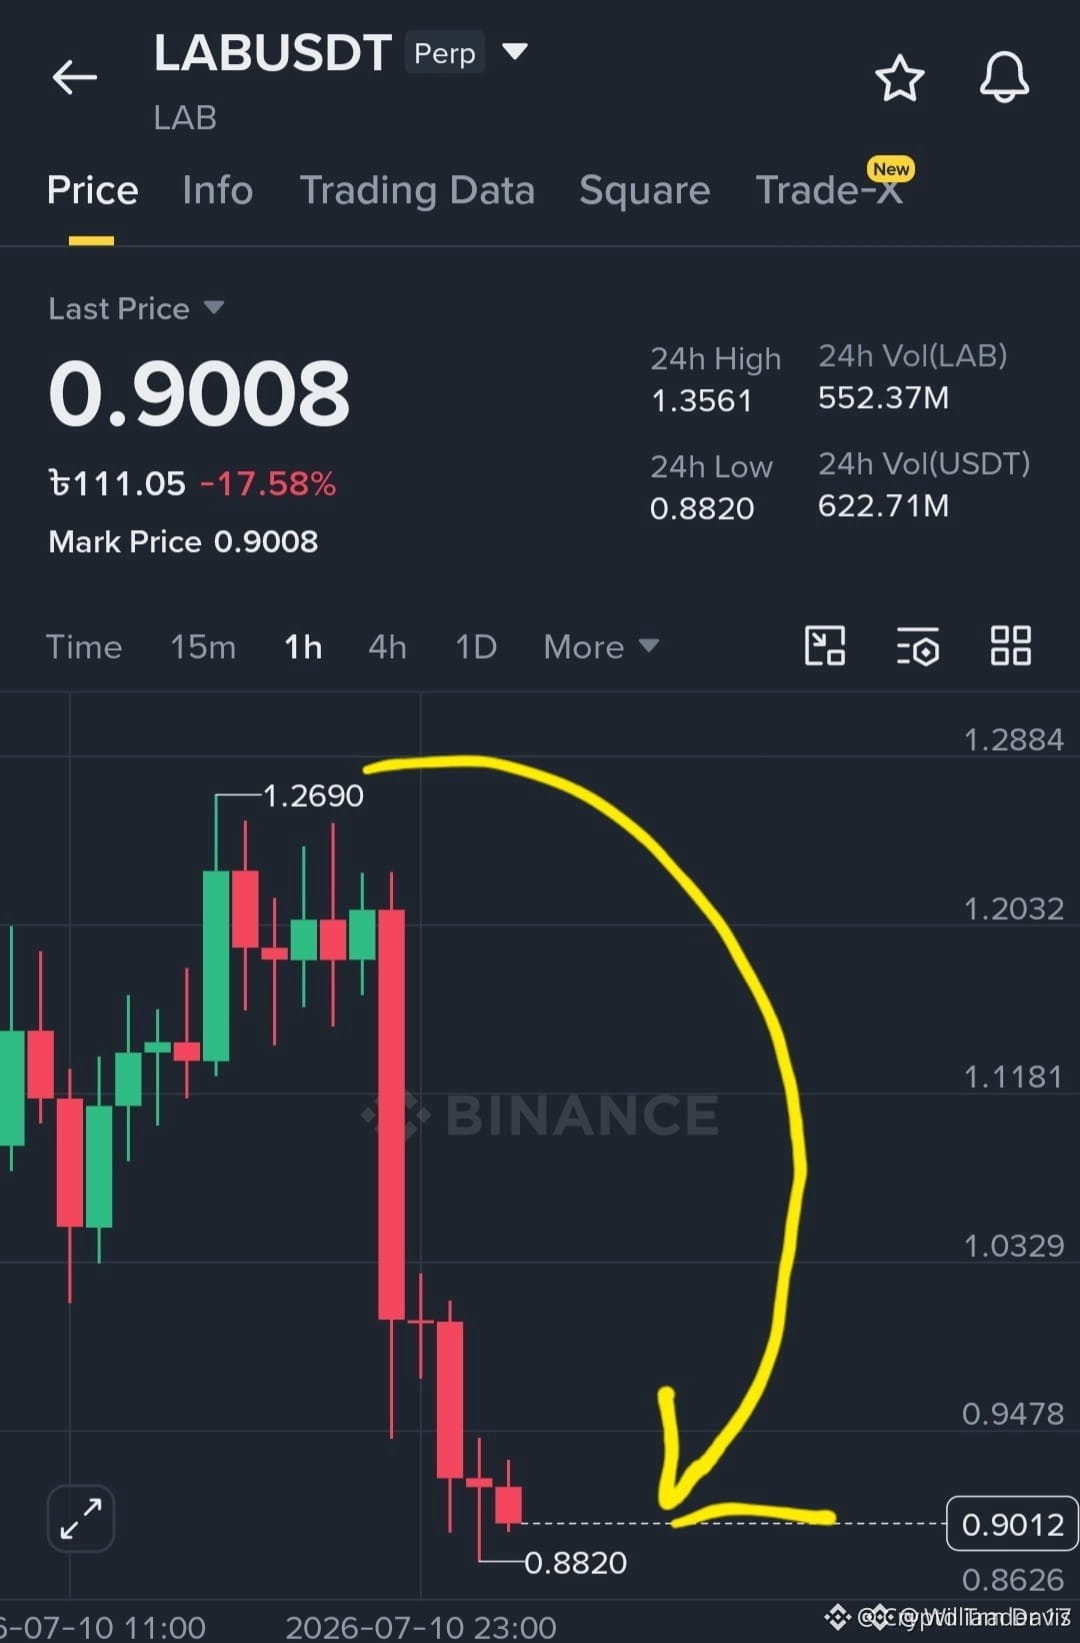
$LAB SHOWING STRUCTURAL WEAKNESS AFTER RECENT RALLY — LIQUIDITY SWEEP CONFIRMED 🔥
The move up into overhead resistance printed a clear liquidity grab on the 1H chart, and the subsequent rejection is textbook distribution. Volume on the breakout candle was below average — a common hallmark of a weak push.
If this level holds as resistance, we could see a retracement toward the nearest internal liquidity pool below. The divergence between price and volume is hard to ignore. Are you waiting for a lower high or already positioned short?
Not financial advice. Always manage your risk.
#LAB #BearishSetup #CryptoAnalysis #TechnicalTrading
⚡
$LAB SHOWING STRUCTURAL WEAKNESS AFTER RECENT RALLY — LIQUIDITY SWEEP CONFIRMED 🔥
The move up into overhead resistance printed a clear liquidity grab on the 1H chart, and the subsequent rejection is textbook distribution. Volume on the breakout candle was below average — a common hallmark of a weak push.
If this level holds as resistance, we could see a retracement toward the nearest internal liquidity pool below. The divergence between price and volume is hard to ignore. Are you waiting for a lower high or already positioned short?
Not financial advice. Always manage your risk.
#LAB #BearishSetup #CryptoAnalysis #TechnicalTrading
⚡
The move up into overhead resistance printed a clear liquidity grab on the 1H chart, and the subsequent rejection is textbook distribution. Volume on the breakout candle was below average — a common hallmark of a weak push.
If this level holds as resistance, we could see a retracement toward the nearest internal liquidity pool below. The divergence between price and volume is hard to ignore. Are you waiting for a lower high or already positioned short?
Not financial advice. Always manage your risk.
#LAB #BearishSetup #CryptoAnalysis #TechnicalTrading
⚡
212

$SHELL Holds Above the $0.02236 Spot Session Low
Data snapshot: October 17, 2026, 14:20 ICT (UTC+7).
The latest Binance Spot snapshot placed $SHELL at 0.02244, with a reported 24-hour low of 0.02236. The difference between the latest price and that low was relatively narrow.
This makes the 0.02236 area a level to monitor, not a confirmed support zone. A level becomes more meaningful when price reactions, traded volume and subsequent candles provide additional evidence.
If the low breaks, market participants may reassess the short-term range. If price rebounds, follow-through will matter more than a single bounce.
#SupportResistance #TechnicalTrading #AltcoinWatch
$SHELL Holds Above the $0.02236 Spot Session Low
Data snapshot: October 17, 2026, 14:20 ICT (UTC+7).
The latest Binance Spot snapshot placed $SHELL at 0.02244, with a reported 24-hour low of 0.02236. The difference between the latest price and that low was relatively narrow.
This makes the 0.02236 area a level to monitor, not a confirmed support zone. A level becomes more meaningful when price reactions, traded volume and subsequent candles provide additional evidence.
If the low breaks, market participants may reassess the short-term range. If price rebounds, follow-through will matter more than a single bounce.
#SupportResistance #TechnicalTrading #AltcoinWatch
Data snapshot: October 17, 2026, 14:20 ICT (UTC+7).
The latest Binance Spot snapshot placed $SHELL at 0.02244, with a reported 24-hour low of 0.02236. The difference between the latest price and that low was relatively narrow.
This makes the 0.02236 area a level to monitor, not a confirmed support zone. A level becomes more meaningful when price reactions, traded volume and subsequent candles provide additional evidence.
If the low breaks, market participants may reassess the short-term range. If price rebounds, follow-through will matter more than a single bounce.
#SupportResistance #TechnicalTrading #AltcoinWatch

1
1
78
·
--
Article
DEXE AT MAKE-OR-BREAK: EMA DEATH CROSS LOOMING?Price is bleeding below EMA (8) – the $2.240 VWAP is the last line of defense for bulls.
📊 CURRENT PRICE & IMMEDIATE TREND
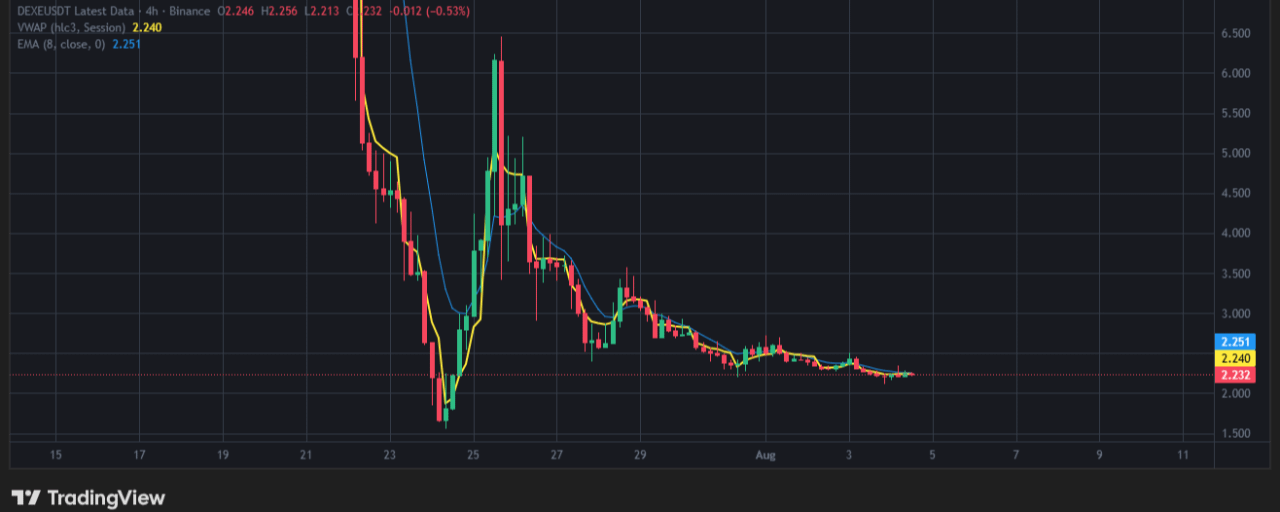
$DEXE is trading at $2.232, down -0.53% on the 4H Binance chart.Price is trading below both the EMA (8) and VWAP, signaling a clear bearish short-term bias.The candle is showing lower highs and lower lows – momentum is firmly with the sellers.
📈 INDICATOR BREAKDOWN
VWAP (hc3, Session): $2.240 – This is the immediate resistance. Price is below it, confirming intraday bearish pressure.EMA (8, close, 0): $2.251 – This is the dynamic ceiling now. A bearish cross below this level has already occurred.The gap between price ($2.232) and EMA ($2.251) is widening – a sign of increasing bearish momentum.
🚧 SUPPORT & RESISTANCE LEVELS (THE CLIFF)
Upside Targets (Bullish):
First hurdle: $2.240 (VWAP) – reclaiming this is the bare minimum for a reversal.Next resistance: $2.251 (EMA 8) – breaking above this shifts the short-term trend back to neutral.The ultimate bull target is $2.256 (today's high) – a clean break would target $2.300+.
Downside Risk (Bearish):
Immediate support: $2.213 (today's low) – losing this opens the floodgates.Major support zone: $2.000 – a psychological round number and the next logical target.In a freefall scenario, the $1.500 region is the ultimate demand zone.
⚔️ THE GAME PLAN FOR TRADERS
For the Bulls: Do not catch a falling knife. Wait for a 4H close above $2.240 (VWAP) before considering longs. Stop at $2.200. Targets: $2.251 → $2.256 → $2.300.For the Bears: Enter on a break below $2.213 (today's low) with conviction. Stop at $2.260. Targets: $2.100 → $2.000.Aggressive shorts can be taken on a retest of $2.240/$2.251 if price rejects those levels.
❓ THE ENGAGEMENT HOOK
$DEXE is bleeding – are you shorting the breakdown to $2.00 or waiting for a VWAP reclaim? Drop your strategy below! 👇
#dexe #Write2Earn #TechnicalTrading
⚠️ Disclaimer: This article is for informational purposes only and is not financial advice. Always do your own research (DYOR).
DEXE AT MAKE-OR-BREAK: EMA DEATH CROSS LOOMING?
Price is bleeding below EMA (8) – the $2.240 VWAP is the last line of defense for bulls.
📊 CURRENT PRICE & IMMEDIATE TREND
$DEXE is trading at $2.232, down -0.53% on the 4H Binance chart.Price is trading below both the EMA (8) and VWAP, signaling a clear bearish short-term bias.The candle is showing lower highs and lower lows – momentum is firmly with the sellers.
📈 INDICATOR BREAKDOWN
VWAP (hc3, Session): $2.240 – This is the immediate resistance. Price is below it, confirming intraday bearish pressure.EMA (8, close, 0): $2.251 – This is the dynamic ceiling now. A bearish cross below this level has already occurred.The gap between price ($2.232) and EMA ($2.251) is widening – a sign of increasing bearish momentum.
🚧 SUPPORT & RESISTANCE LEVELS (THE CLIFF)
Upside Targets (Bullish):
First hurdle: $2.240 (VWAP) – reclaiming this is the bare minimum for a reversal.Next resistance: $2.251 (EMA 8) – breaking above this shifts the short-term trend back to neutral.The ultimate bull target is $2.256 (today's high) – a clean break would target $2.300+.
Downside Risk (Bearish):
Immediate support: $2.213 (today's low) – losing this opens the floodgates.Major support zone: $2.000 – a psychological round number and the next logical target.In a freefall scenario, the $1.500 region is the ultimate demand zone.
⚔️ THE GAME PLAN FOR TRADERS
For the Bulls: Do not catch a falling knife. Wait for a 4H close above $2.240 (VWAP) before considering longs. Stop at $2.200. Targets: $2.251 → $2.256 → $2.300.For the Bears: Enter on a break below $2.213 (today's low) with conviction. Stop at $2.260. Targets: $2.100 → $2.000.Aggressive shorts can be taken on a retest of $2.240/$2.251 if price rejects those levels.
❓ THE ENGAGEMENT HOOK
$DEXE is bleeding – are you shorting the breakdown to $2.00 or waiting for a VWAP reclaim? Drop your strategy below! 👇
#dexe #Write2Earn #TechnicalTrading
⚠️ Disclaimer: This article is for informational purposes only and is not financial advice. Always do your own research (DYOR).
📊 CURRENT PRICE & IMMEDIATE TREND
$DEXE is trading at $2.232, down -0.53% on the 4H Binance chart.Price is trading below both the EMA (8) and VWAP, signaling a clear bearish short-term bias.The candle is showing lower highs and lower lows – momentum is firmly with the sellers.
📈 INDICATOR BREAKDOWN
VWAP (hc3, Session): $2.240 – This is the immediate resistance. Price is below it, confirming intraday bearish pressure.EMA (8, close, 0): $2.251 – This is the dynamic ceiling now. A bearish cross below this level has already occurred.The gap between price ($2.232) and EMA ($2.251) is widening – a sign of increasing bearish momentum.
🚧 SUPPORT & RESISTANCE LEVELS (THE CLIFF)
Upside Targets (Bullish):
First hurdle: $2.240 (VWAP) – reclaiming this is the bare minimum for a reversal.Next resistance: $2.251 (EMA 8) – breaking above this shifts the short-term trend back to neutral.The ultimate bull target is $2.256 (today's high) – a clean break would target $2.300+.
Downside Risk (Bearish):
Immediate support: $2.213 (today's low) – losing this opens the floodgates.Major support zone: $2.000 – a psychological round number and the next logical target.In a freefall scenario, the $1.500 region is the ultimate demand zone.
⚔️ THE GAME PLAN FOR TRADERS
For the Bulls: Do not catch a falling knife. Wait for a 4H close above $2.240 (VWAP) before considering longs. Stop at $2.200. Targets: $2.251 → $2.256 → $2.300.For the Bears: Enter on a break below $2.213 (today's low) with conviction. Stop at $2.260. Targets: $2.100 → $2.000.Aggressive shorts can be taken on a retest of $2.240/$2.251 if price rejects those levels.
❓ THE ENGAGEMENT HOOK
$DEXE is bleeding – are you shorting the breakdown to $2.00 or waiting for a VWAP reclaim? Drop your strategy below! 👇
#dexe #Write2Earn #TechnicalTrading
⚠️ Disclaimer: This article is for informational purposes only and is not financial advice. Always do your own research (DYOR).
70
SKYAI remains near key support while CHECK trades with limited volatility. Quiet price action often precedes larger moves. Traders monitoring accumulation zones, volume expansion, and liquidity shifts may gain an edge before momentum fully develops.
#TechnicalTrading #cryptosignals #MarketTrends #tradingeducation
SKYAI remains near key support while CHECK trades with limited volatility. Quiet price action often precedes larger moves. Traders monitoring accumulation zones, volume expansion, and liquidity shifts may gain an edge before momentum fully develops.
#TechnicalTrading #cryptosignals #MarketTrends #tradingeducation
#TechnicalTrading #cryptosignals #MarketTrends #tradingeducation
1
184
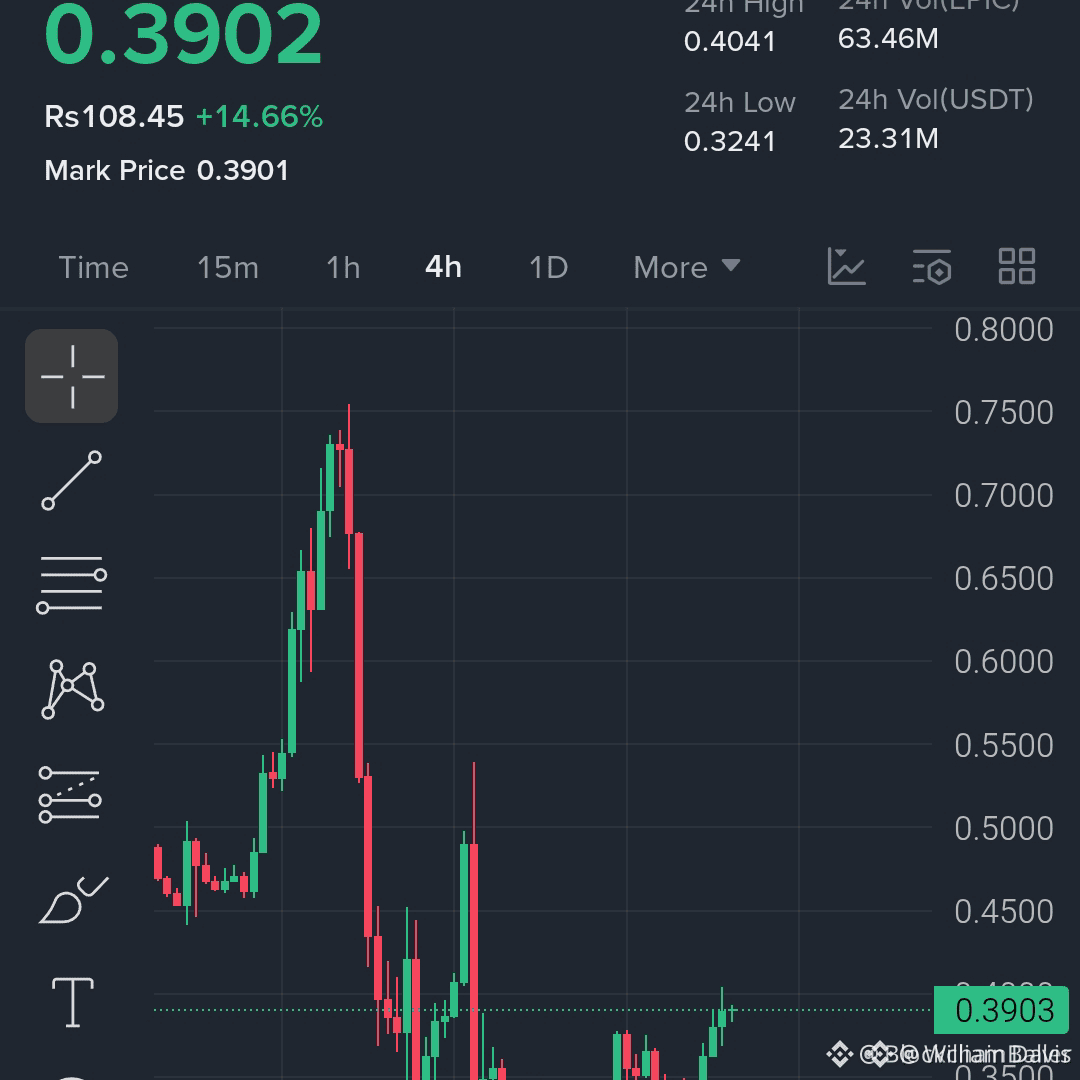
$EPIC SHOWING TEXTBOOK BULLISH STRUCTURE AT KEY SUPPORT 🔥
Entry: $0.3860–$0.3920 🔥
Target: $0.4100 🚀
Stop Loss: $0.3720 ⚠️
This entry zone sits directly on a prior order block that has attracted aggressive bids in the past. With a stop loss resting just below recent liquidity, the structure is clean. Extending targets to $0.4350 and $0.4600 gives a potential R:R of over 1:5 if momentum sustains past the first take-profit.
Volume has been declining into this support, suggesting sellers are exhausted. A break above $0.4100 could trigger a fast move higher. Are you taking the full run or scaling out at TP1?
Not financial advice. Always manage your risk.
#EPIC #LongSetup #Breakout #TechnicalTrading
🎯
$EPIC SHOWING TEXTBOOK BULLISH STRUCTURE AT KEY SUPPORT 🔥
Entry: $0.3860–$0.3920 🔥
Target: $0.4100 🚀
Stop Loss: $0.3720 ⚠️
This entry zone sits directly on a prior order block that has attracted aggressive bids in the past. With a stop loss resting just below recent liquidity, the structure is clean. Extending targets to $0.4350 and $0.4600 gives a potential R:R of over 1:5 if momentum sustains past the first take-profit.
Volume has been declining into this support, suggesting sellers are exhausted. A break above $0.4100 could trigger a fast move higher. Are you taking the full run or scaling out at TP1?
Not financial advice. Always manage your risk.
#EPIC #LongSetup #Breakout #TechnicalTrading
🎯
Entry: $0.3860–$0.3920 🔥
Target: $0.4100 🚀
Stop Loss: $0.3720 ⚠️
This entry zone sits directly on a prior order block that has attracted aggressive bids in the past. With a stop loss resting just below recent liquidity, the structure is clean. Extending targets to $0.4350 and $0.4600 gives a potential R:R of over 1:5 if momentum sustains past the first take-profit.
Volume has been declining into this support, suggesting sellers are exhausted. A break above $0.4100 could trigger a fast move higher. Are you taking the full run or scaling out at TP1?
Not financial advice. Always manage your risk.
#EPIC #LongSetup #Breakout #TechnicalTrading
🎯
22
UB emerged as a strong momentum leader today with impressive gains supported by active market participation. However, rapid rallies can trigger short-term profit-taking pressure. Experienced traders are waiting for healthy pullbacks and support retests before considering additional entries in high-volatility conditions. #bullish_pepe #CryptoTrading #AltcoinNews #TechnicalTrading
UB emerged as a strong momentum leader today with impressive gains supported by active market participation. However, rapid rallies can trigger short-term profit-taking pressure. Experienced traders are waiting for healthy pullbacks and support retests before considering additional entries in high-volatility conditions. #bullish_pepe #CryptoTrading #AltcoinNews #TechnicalTrading
174
DN emerged as one of the strongest momentum performers with exceptional volatility and aggressive buying activity. While rapid gains attract speculative interest, traders should stay alert for sudden market exhaustion signals. Successful trading depends on patience, disciplined execution, and controlled leverage management. #daytrading #CryptoUpdates #TechnicalTrading #Finance
DN emerged as one of the strongest momentum performers with exceptional volatility and aggressive buying activity. While rapid gains attract speculative interest, traders should stay alert for sudden market exhaustion signals. Successful trading depends on patience, disciplined execution, and controlled leverage management. #daytrading #CryptoUpdates #TechnicalTrading #Finance
161
B experienced heavy downside pressure with a sharp 14% decline, reminding traders how quickly sentiment can shift in volatile markets. Protecting capital through disciplined strategy and emotional control remains more important than chasing risky recovery trades during uncertain conditions. #TechnicalTrading #CryptoTrading #MarketAnalysis #Investing
B experienced heavy downside pressure with a sharp 14% decline, reminding traders how quickly sentiment can shift in volatile markets. Protecting capital through disciplined strategy and emotional control remains more important than chasing risky recovery trades during uncertain conditions. #TechnicalTrading #CryptoTrading #MarketAnalysis #Investing
384
Mixed market signals: VVV gains 6%, AERO advances, while BILL and BSB struggle. This is a trader’s market — selective, fast, and unforgiving. Focus on confirmation, not prediction. Data beats emotion every time.
#CryptoTrading #priceaction #TechnicalTrading #DigitalAssets
Mixed market signals: VVV gains 6%, AERO advances, while BILL and BSB struggle. This is a trader’s market — selective, fast, and unforgiving. Focus on confirmation, not prediction. Data beats emotion every time.
#CryptoTrading #priceaction #TechnicalTrading #DigitalAssets
#CryptoTrading #priceaction #TechnicalTrading #DigitalAssets
1
500
·
--
Bearish
BNB HOLDERS SHOULD WATCH MARKET STRUCTURE
$BNB is currently around 512.67, down 10.23%. Traders should evaluate whether the market is forming a stable base or continuing its downward movement. I would avoid assuming that a support level will hold without evidence. Confirmation, patience and controlled exposure are important in this environment.
NFA. Always DYOR.
#BNB #BNBAnalysis #CryptoInvestors #TechnicalTrading #MarketDirection
BNB HOLDERS SHOULD WATCH MARKET STRUCTURE
$BNB is currently around 512.67, down 10.23%. Traders should evaluate whether the market is forming a stable base or continuing its downward movement. I would avoid assuming that a support level will hold without evidence. Confirmation, patience and controlled exposure are important in this environment.
NFA. Always DYOR.
#BNB #BNBAnalysis #CryptoInvestors #TechnicalTrading #MarketDirection
$BNB is currently around 512.67, down 10.23%. Traders should evaluate whether the market is forming a stable base or continuing its downward movement. I would avoid assuming that a support level will hold without evidence. Confirmation, patience and controlled exposure are important in this environment.
NFA. Always DYOR.
#BNB #BNBAnalysis #CryptoInvestors #TechnicalTrading #MarketDirection
·
--
Bearish
SUI PRICE MOVEMENT CALLS FOR A CAREFUL APPROACH
$SUI is trading around 0.5992, down 14.12%. Traders should distinguish between a temporary bounce and a meaningful recovery. I would look for stronger demand, improved market structure and confirmation across multiple timeframes. A patient approach can help avoid entering during continued selling pressure.
NFA. Always DYOR.
#SUI #CryptoCharts #SuiNetwork #TechnicalTrading #MarketRecovery
SUI PRICE MOVEMENT CALLS FOR A CAREFUL APPROACH
$SUI is trading around 0.5992, down 14.12%. Traders should distinguish between a temporary bounce and a meaningful recovery. I would look for stronger demand, improved market structure and confirmation across multiple timeframes. A patient approach can help avoid entering during continued selling pressure.
NFA. Always DYOR.
#SUI #CryptoCharts #SuiNetwork #TechnicalTrading #MarketRecovery
$SUI is trading around 0.5992, down 14.12%. Traders should distinguish between a temporary bounce and a meaningful recovery. I would look for stronger demand, improved market structure and confirmation across multiple timeframes. A patient approach can help avoid entering during continued selling pressure.
NFA. Always DYOR.
#SUI #CryptoCharts #SuiNetwork #TechnicalTrading #MarketRecovery
3
·
--
Bullish
The 0.9644 area is a reference for monitoring $XRP , not a guaranteed turning point. Observe how buyers and sellers respond around recent lows, and use candle closes to confirm any change in direction. A level becomes meaningful through market reaction, not simply because it looks attractive.
{spot}(XRPUSDT)
#XRP #TechnicalTrading #XRPAnalysis #MarketStructure #PriceAction
The 0.9644 area is a reference for monitoring $XRP , not a guaranteed turning point. Observe how buyers and sellers respond around recent lows, and use candle closes to confirm any change in direction. A level becomes meaningful through market reaction, not simply because it looks attractive.
#XRP #TechnicalTrading #XRPAnalysis #MarketStructure #PriceAction
#XRP #TechnicalTrading #XRPAnalysis #MarketStructure #PriceAction
2
Log in to explore more content
Join global crypto users on Binance Square
⚡️ Get latest and useful information about crypto.
💬 Trusted by the world’s largest crypto exchange.
👍 Discover real insights from verified creators.
Email / Phone number
Trending Topics
1
#CanBTCReboundAfterFallingBelow60K?
418,790 views
1,804 Discussing
2
#GlobalStocksFaceLongestLosingStreakSince2023
140,649 views
1,267 Discussing
3
#BlackRockIBITPostsRecord$541MSingleDayOutflow
2,976 views
37 Discussing
4
#AnthropicPlungesTowardIPOPriceonDay2
67,063 views
713 Discussing
5
#TwentyOneCapitalAdds172.25BTC
18,667 views
252 Discussing
6
#HKBillWouldExcludeTokenizedDepositsFromVirtualAssets
2,139 views
26 Discussing
7
#BNBDropsBelow540USDTWith8.46%DailyDecline
39,003 views
352 Discussing
8
#HKBillProposesHK$100KFineForUnauthorizedCryptoTitles
1,328 views
19 Discussing
9
#BitMineFaces$10.1BUnrealizedETHLoss
2,356 views
24 Discussing
10
#StrategyReports$35BNetReserves
2,248 views
18 Discussing