
#cryptoanalysis
cryptoanalysis
29.1M views
131,304 Discussing
Hot
Latest

·
--
Bearish
📊 BTC& ETH— Market Analysis | 20.11.2026
🔶 BITCOIN ($BTC )
The market is under selling pressure.
🟢 Support: $58,000–58,700
🔴 Resistance: $60,000–62,000
🐻 Below $58,000 — target: $56,000.
🐂 Above $60,000 — potential rebound.
🔷 ETHEREUM ($ETH )
Buyers are not in control yet.
🟢 Support: $1,620–1,650
🔴 Resistance: $1,720–1,820
🐻 A break below support — target: $1,550.
🐂 A confirmed move above $1,720 — signal for recovery.
🎯 Conclusion: Bears have the advantage. Wait for confirmation before entering positions.
⚠️ Not financial advice.
{future}(BTCUSDT)
{future}(ETHUSDT)
#BTC #ETH #Bitcoin #Ethereum #CryptoAnalysis
📊 BTC& ETH— Market Analysis | 20.11.2026
🔶 BITCOIN ($BTC )
The market is under selling pressure.
🟢 Support: $58,000–58,700
🔴 Resistance: $60,000–62,000
🐻 Below $58,000 — target: $56,000.
🐂 Above $60,000 — potential rebound.
🔷 ETHEREUM ($ETH )
Buyers are not in control yet.
🟢 Support: $1,620–1,650
🔴 Resistance: $1,720–1,820
🐻 A break below support — target: $1,550.
🐂 A confirmed move above $1,720 — signal for recovery.
🎯 Conclusion: Bears have the advantage. Wait for confirmation before entering positions.
⚠️ Not financial advice.
#BTC #ETH #Bitcoin #Ethereum #CryptoAnalysis
🔶 BITCOIN ($BTC )
The market is under selling pressure.
🟢 Support: $58,000–58,700
🔴 Resistance: $60,000–62,000
🐻 Below $58,000 — target: $56,000.
🐂 Above $60,000 — potential rebound.
🔷 ETHEREUM ($ETH )
Buyers are not in control yet.
🟢 Support: $1,620–1,650
🔴 Resistance: $1,720–1,820
🐻 A break below support — target: $1,550.
🐂 A confirmed move above $1,720 — signal for recovery.
🎯 Conclusion: Bears have the advantage. Wait for confirmation before entering positions.
⚠️ Not financial advice.
#BTC #ETH #Bitcoin #Ethereum #CryptoAnalysis

185

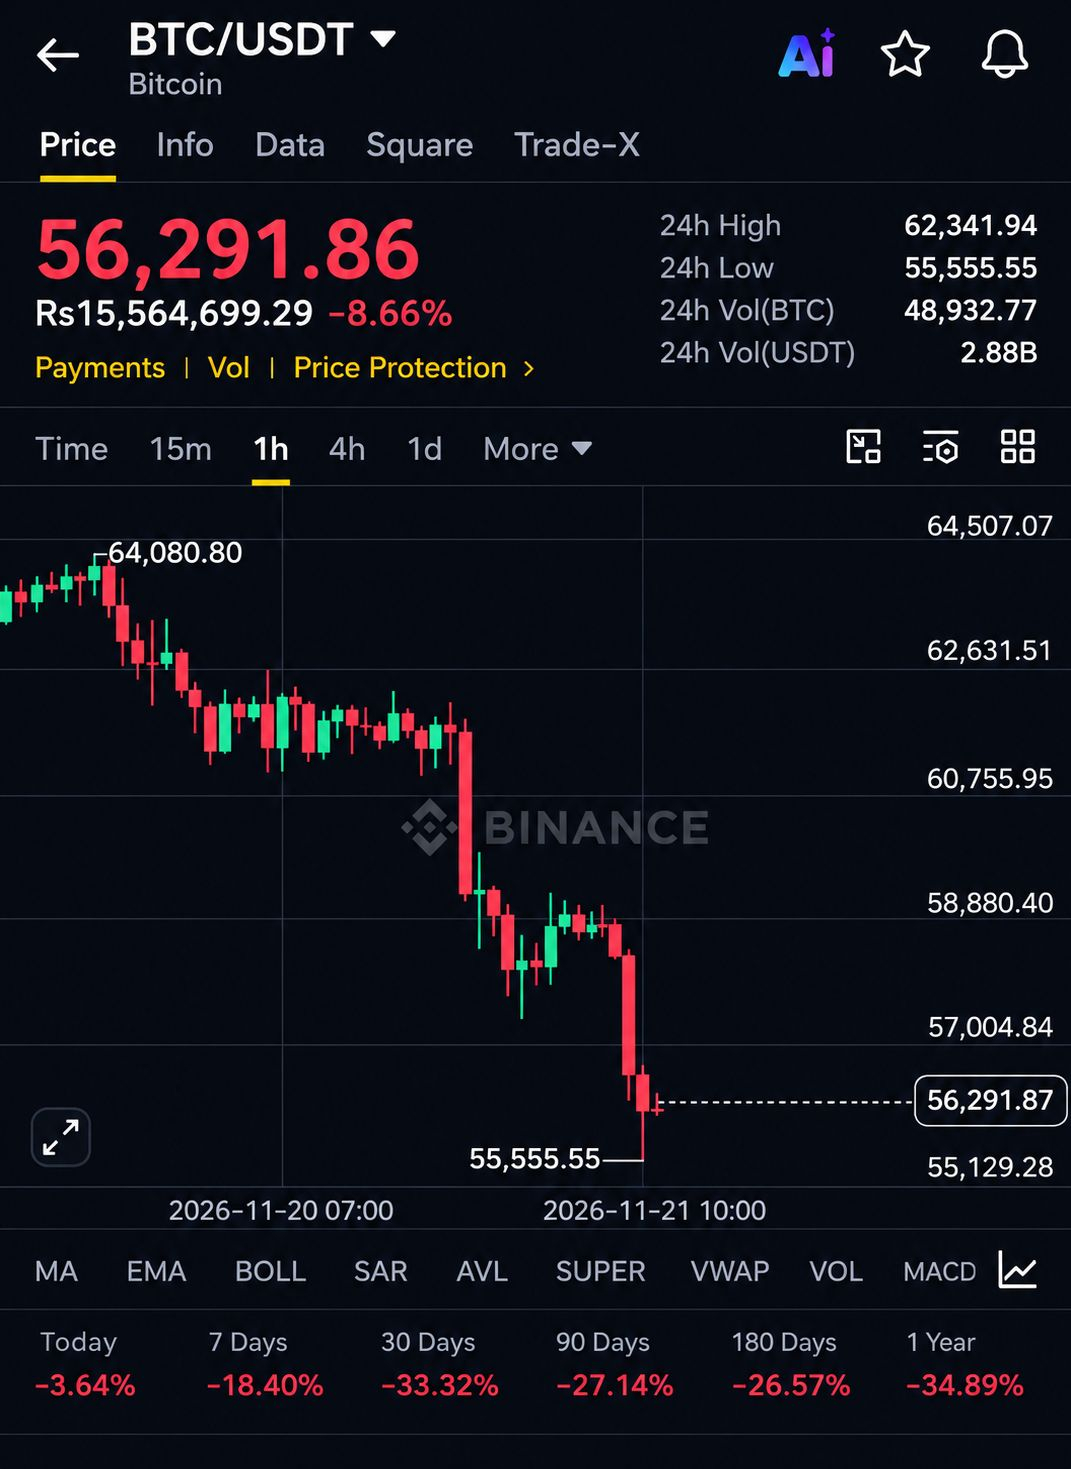
🚨 BITCOIN AT $55,000! IS THIS THE BIGGEST BUYING OPPORTUNITY OR A DEEPER MARKET CRASH?
Bitcoin is facing serious pressure, and even some of the world's biggest institutional holders are sitting on billions of dollars in unrealized losses. But is this the end of Bitcoin's bull cycle? Let's look at the bigger picture. 👇
📉 BIG INSTITUTIONS ARE UNDER PRESSURE
According to the figures shared:
- Strategy: Holds 850,849 BTC at an average purchase price of $75,452.
- Metaplanet: Holds 44,000 BTC at an average price of $102,115.
- MARA: Holds 34,012 BTC at an average price of approximately $79,490.
These numbers highlight how deeply even major Bitcoin investors can be affected during a market downturn.
🌍 WHY IS THE MARKET UNDER PRESSURE?
Several factors are creating uncertainty across global financial markets:
- Billions in cryptocurrency liquidations.
- Institutional Bitcoin ETF outflows.
- Pressure on technology and AI stocks.
- A stronger US dollar.
- Growing cybersecurity threats and global economic uncertainty.
📊 BITCOIN HAS SURVIVED MASSIVE CRASHES BEFORE
Bitcoin has experienced several major corrections throughout its history:
- 2011: Approximately 93% decline.
- 2014: Approximately 85% decline.
- 2018: Approximately 84% decline.
- 2022: Approximately 77% decline.
- March 2020: Nearly 40% decline in a single day.
History reminds us that $BTC Bitcoin has survived some extremely difficult market conditions.
Despite the current uncertainty, Bitcoin still has strong long-term potential. Institutional adoption, major corporate holdings, and growing global interest could support its recovery.
Personally, I don't consider the $30K–$40K range an inevitable destination. However, no price level is guaranteed, and investors should always manage their risks carefully.
Bitcoin has faced fear before. The real question is: WILL IT RISE AGAIN? 🚀
#BTC #CryptoMarket #BitcoinCrash #CryptoNews #InstitutionalInvestors #Strategy #Metaplanet #MARA #CryptoAnalysis
🚨 BITCOIN AT $55,000! IS THIS THE BIGGEST BUYING OPPORTUNITY OR A DEEPER MARKET CRASH?
Bitcoin is facing serious pressure, and even some of the world's biggest institutional holders are sitting on billions of dollars in unrealized losses. But is this the end of Bitcoin's bull cycle? Let's look at the bigger picture. 👇
📉 BIG INSTITUTIONS ARE UNDER PRESSURE
According to the figures shared:
- Strategy: Holds 850,849 BTC at an average purchase price of $75,452.
- Metaplanet: Holds 44,000 BTC at an average price of $102,115.
- MARA: Holds 34,012 BTC at an average price of approximately $79,490.
These numbers highlight how deeply even major Bitcoin investors can be affected during a market downturn.
🌍 WHY IS THE MARKET UNDER PRESSURE?
Several factors are creating uncertainty across global financial markets:
- Billions in cryptocurrency liquidations.
- Institutional Bitcoin ETF outflows.
- Pressure on technology and AI stocks.
- A stronger US dollar.
- Growing cybersecurity threats and global economic uncertainty.
📊 BITCOIN HAS SURVIVED MASSIVE CRASHES BEFORE
Bitcoin has experienced several major corrections throughout its history:
- 2011: Approximately 93% decline.
- 2014: Approximately 85% decline.
- 2018: Approximately 84% decline.
- 2022: Approximately 77% decline.
- March 2020: Nearly 40% decline in a single day.
History reminds us that $BTC Bitcoin has survived some extremely difficult market conditions.
Despite the current uncertainty, Bitcoin still has strong long-term potential. Institutional adoption, major corporate holdings, and growing global interest could support its recovery.
Personally, I don't consider the $30K–$40K range an inevitable destination. However, no price level is guaranteed, and investors should always manage their risks carefully.
Bitcoin has faced fear before. The real question is: WILL IT RISE AGAIN? 🚀
#BTC #CryptoMarket #BitcoinCrash #CryptoNews #InstitutionalInvestors #Strategy #Metaplanet #MARA #CryptoAnalysis
Bitcoin is facing serious pressure, and even some of the world's biggest institutional holders are sitting on billions of dollars in unrealized losses. But is this the end of Bitcoin's bull cycle? Let's look at the bigger picture. 👇
📉 BIG INSTITUTIONS ARE UNDER PRESSURE
According to the figures shared:
- Strategy: Holds 850,849 BTC at an average purchase price of $75,452.
- Metaplanet: Holds 44,000 BTC at an average price of $102,115.
- MARA: Holds 34,012 BTC at an average price of approximately $79,490.
These numbers highlight how deeply even major Bitcoin investors can be affected during a market downturn.
🌍 WHY IS THE MARKET UNDER PRESSURE?
Several factors are creating uncertainty across global financial markets:
- Billions in cryptocurrency liquidations.
- Institutional Bitcoin ETF outflows.
- Pressure on technology and AI stocks.
- A stronger US dollar.
- Growing cybersecurity threats and global economic uncertainty.
📊 BITCOIN HAS SURVIVED MASSIVE CRASHES BEFORE
Bitcoin has experienced several major corrections throughout its history:
- 2011: Approximately 93% decline.
- 2014: Approximately 85% decline.
- 2018: Approximately 84% decline.
- 2022: Approximately 77% decline.
- March 2020: Nearly 40% decline in a single day.
History reminds us that $BTC Bitcoin has survived some extremely difficult market conditions.
Despite the current uncertainty, Bitcoin still has strong long-term potential. Institutional adoption, major corporate holdings, and growing global interest could support its recovery.
Personally, I don't consider the $30K–$40K range an inevitable destination. However, no price level is guaranteed, and investors should always manage their risks carefully.
Bitcoin has faced fear before. The real question is: WILL IT RISE AGAIN? 🚀
#BTC #CryptoMarket #BitcoinCrash #CryptoNews #InstitutionalInvestors #Strategy #Metaplanet #MARA #CryptoAnalysis
163

·
--
Bearish
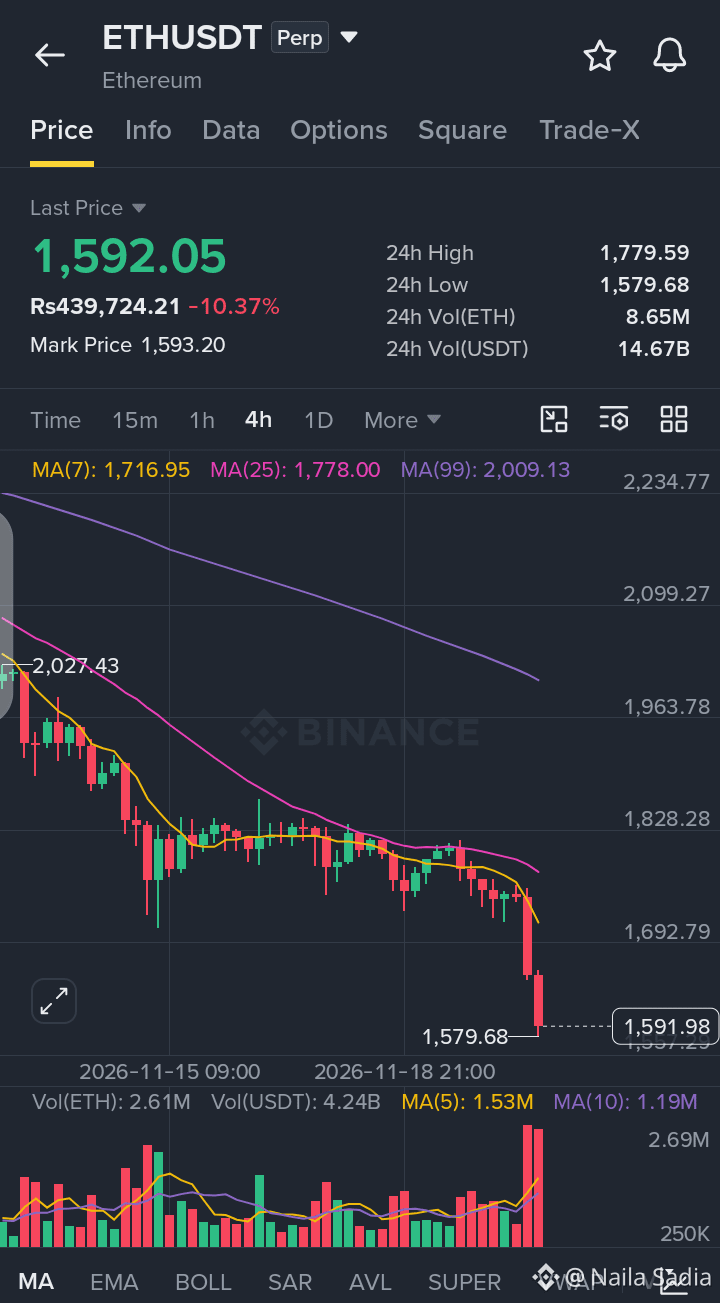
🚨 ETH PLUNGING OVER 10%! WILL $1,580 SUPPORT HOLD OR BREAK?
$ETH is trading near $1,592.05, down 10.37%. The 4H chart shows heavy bearish momentum as price trades well below all major moving averages (MA 7 at $1,716.95, MA 25 at $1,778.00, and MA 99 at $2,009.13).
📉 Market Outlook: Strong selling pressure is active after breaking down from recent levels. A break below the $1,579.68 low could open further downside toward lower support zones, while reclaiming $1,716.95–$1,778.00 resistance may invite a relief bounce.
🎯 TRADE PLAN – SHORT
Entry: $1,620.00–$1,665.00
TP1: $1,550.00
TP2: $1,480.00
SL: $1,720.00
💬 Will $ETH hold above $1,579.68 or extend its drop lower?
👇 CLICK HERE FOR TRADE
$ETH
{future}(ETHUSDT)
#ETH #Ethereum #CryptoAnalysis #BinanceSquare
🚨 ETH PLUNGING OVER 10%! WILL $1,580 SUPPORT HOLD OR BREAK?
$ETH is trading near $1,592.05, down 10.37%. The 4H chart shows heavy bearish momentum as price trades well below all major moving averages (MA 7 at $1,716.95, MA 25 at $1,778.00, and MA 99 at $2,009.13).
📉 Market Outlook: Strong selling pressure is active after breaking down from recent levels. A break below the $1,579.68 low could open further downside toward lower support zones, while reclaiming $1,716.95–$1,778.00 resistance may invite a relief bounce.
🎯 TRADE PLAN – SHORT
Entry: $1,620.00–$1,665.00
TP1: $1,550.00
TP2: $1,480.00
SL: $1,720.00
💬 Will $ETH hold above $1,579.68 or extend its drop lower?
👇 CLICK HERE FOR TRADE
$ETH
#ETH #Ethereum #CryptoAnalysis #BinanceSquare
$ETH is trading near $1,592.05, down 10.37%. The 4H chart shows heavy bearish momentum as price trades well below all major moving averages (MA 7 at $1,716.95, MA 25 at $1,778.00, and MA 99 at $2,009.13).
📉 Market Outlook: Strong selling pressure is active after breaking down from recent levels. A break below the $1,579.68 low could open further downside toward lower support zones, while reclaiming $1,716.95–$1,778.00 resistance may invite a relief bounce.
🎯 TRADE PLAN – SHORT
Entry: $1,620.00–$1,665.00
TP1: $1,550.00
TP2: $1,480.00
SL: $1,720.00
💬 Will $ETH hold above $1,579.68 or extend its drop lower?
👇 CLICK HERE FOR TRADE
$ETH
#ETH #Ethereum #CryptoAnalysis #BinanceSquare
155

·
--
Bearish
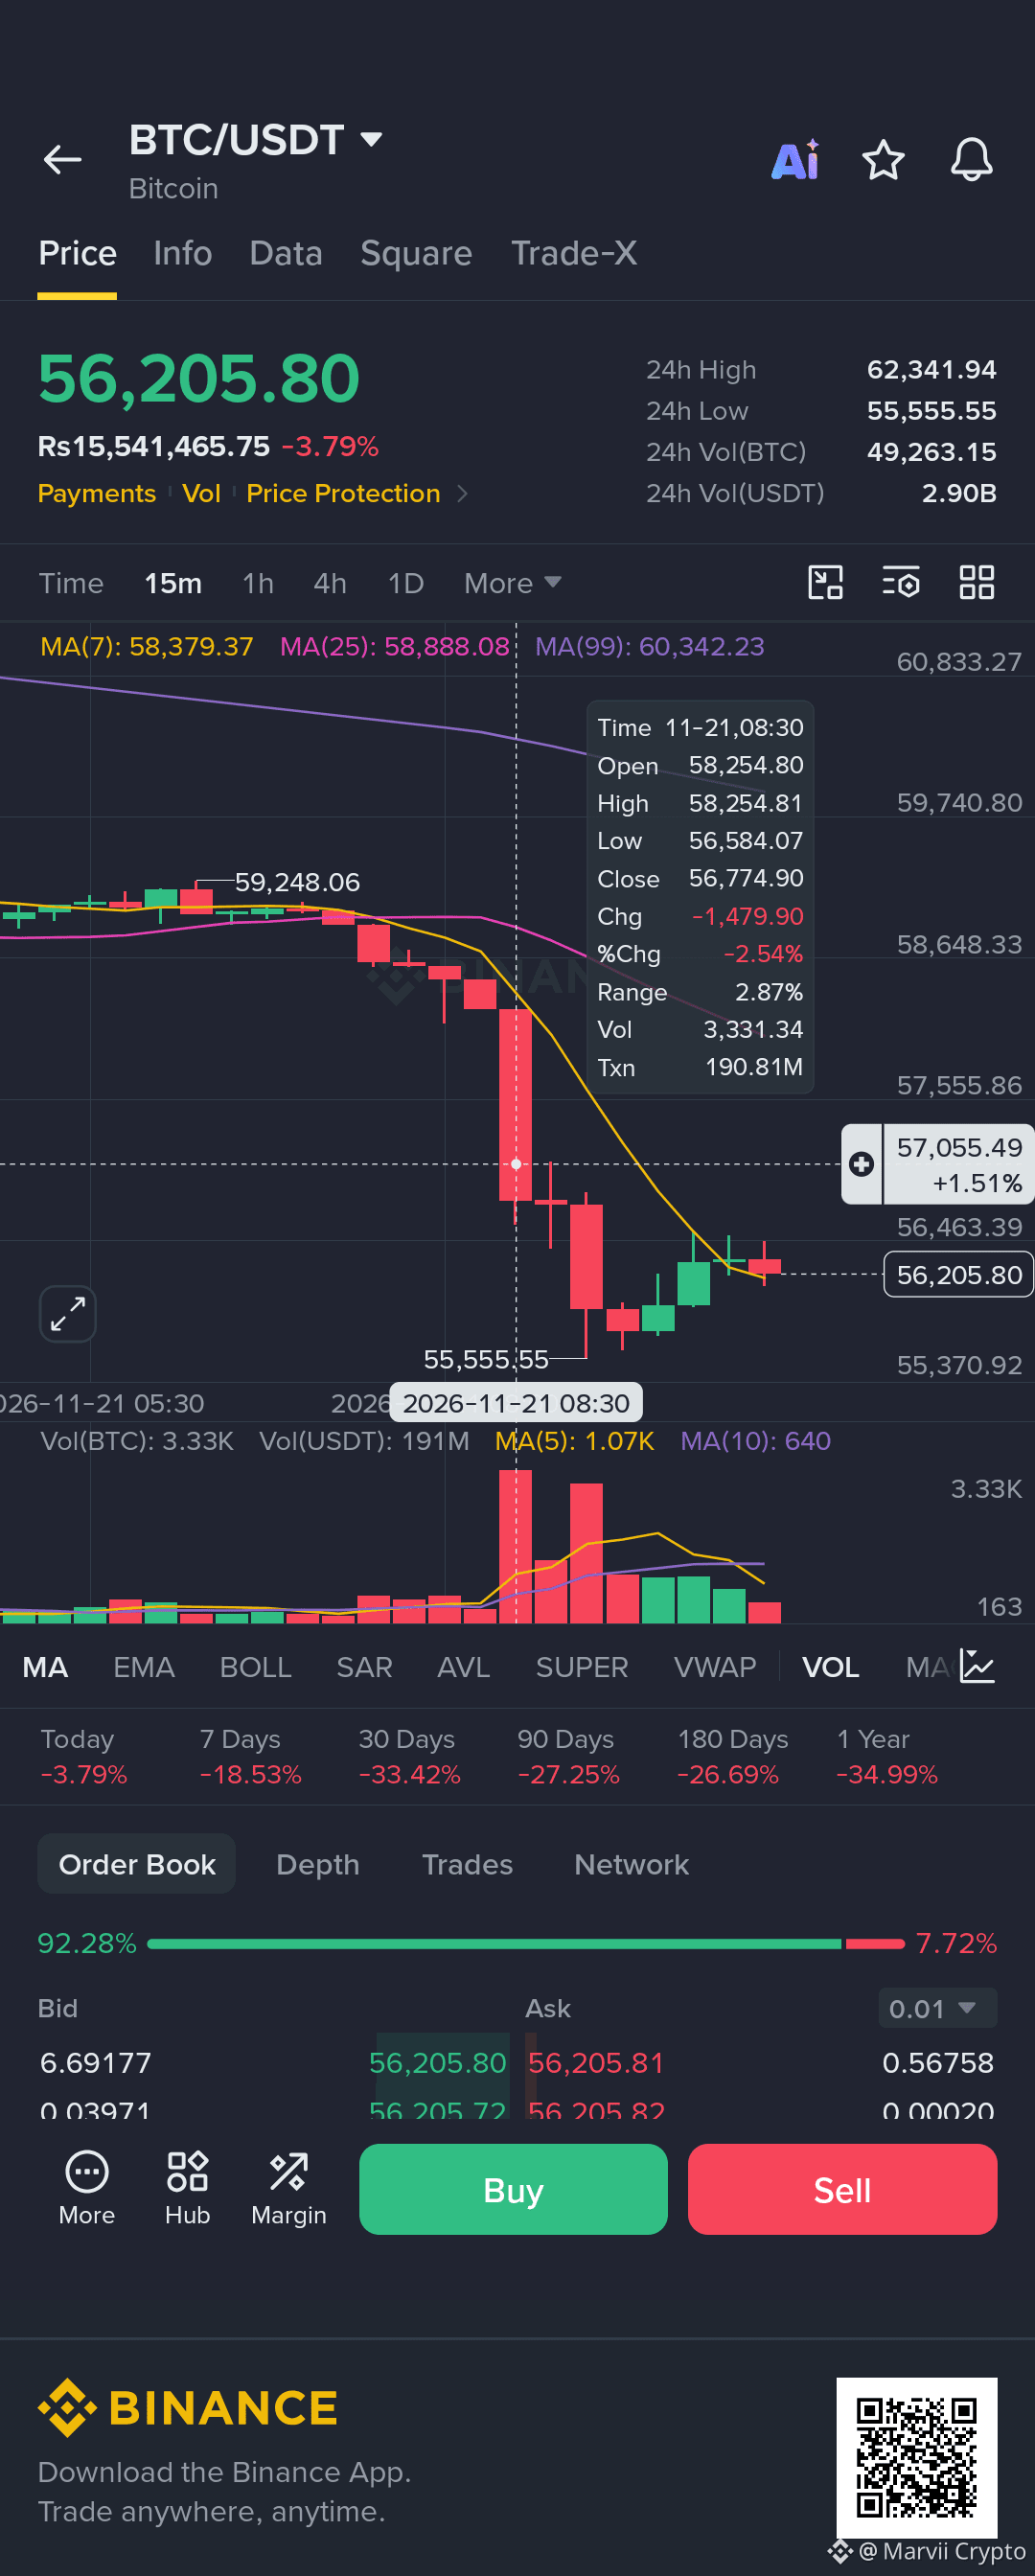
🚨 BITCOIN UNDER HEAVY PRESSURE – IS $55K NEXT?
Bitcoin's sell-off is getting deeper, and buyers are struggling to regain control.
As of November 21, $BTC is trading around $56,217 ($BTC USDT Perpetual reference), following a sharp market-wide decline. Selling pressure remains strong, and volatility is extremely high.
📊 BTC Market Analysis – AJ
🔴 Market Trend: Bearish
🟢 Support Levels:
- $55,800 – Immediate support
- $54,900 – Next downside target
🔴 Resistance Levels:
- $56,850 – First recovery level
- $57,800 – Key resistance
- $58,400 – Stronger bullish confirmation
🎯 Trading Setup:
- Short Entry: $56,850–$57,800 after bearish rejection
- TP1: $55,800
- TP2: $54,900
- SL: Above $58,400
📈 Bullish Scenario: If BTC reclaims $57,800–$58,400 with strong volume, a relief bounce could develop.
⚠️ My View: The market is still bearish. I wouldn't rush into long positions or chase falling candles. Patience and confirmation matter more than FOMO.
🔥 **What's your opinion? Is Bitcoin heading towards $50K, or are we getting closer to a major recovery?
#CryptoAnalysis #BinanceSquare #TradingSignals #Write2Earn #DYOR
{spot}(BTCUSDT)
🚨 BITCOIN UNDER HEAVY PRESSURE – IS $55K NEXT?
Bitcoin's sell-off is getting deeper, and buyers are struggling to regain control.
As of November 21, $BTC is trading around $56,217 ($BTC USDT Perpetual reference), following a sharp market-wide decline. Selling pressure remains strong, and volatility is extremely high.
📊 BTC Market Analysis – AJ
🔴 Market Trend: Bearish
🟢 Support Levels:
- $55,800 – Immediate support
- $54,900 – Next downside target
🔴 Resistance Levels:
- $56,850 – First recovery level
- $57,800 – Key resistance
- $58,400 – Stronger bullish confirmation
🎯 Trading Setup:
- Short Entry: $56,850–$57,800 after bearish rejection
- TP1: $55,800
- TP2: $54,900
- SL: Above $58,400
📈 Bullish Scenario: If BTC reclaims $57,800–$58,400 with strong volume, a relief bounce could develop.
⚠️ My View: The market is still bearish. I wouldn't rush into long positions or chase falling candles. Patience and confirmation matter more than FOMO.
🔥 **What's your opinion? Is Bitcoin heading towards $50K, or are we getting closer to a major recovery?
#CryptoAnalysis #BinanceSquare #TradingSignals #Write2Earn #DYOR
Bitcoin's sell-off is getting deeper, and buyers are struggling to regain control.
As of November 21, $BTC is trading around $56,217 ($BTC USDT Perpetual reference), following a sharp market-wide decline. Selling pressure remains strong, and volatility is extremely high.
📊 BTC Market Analysis – AJ
🔴 Market Trend: Bearish
🟢 Support Levels:
- $55,800 – Immediate support
- $54,900 – Next downside target
🔴 Resistance Levels:
- $56,850 – First recovery level
- $57,800 – Key resistance
- $58,400 – Stronger bullish confirmation
🎯 Trading Setup:
- Short Entry: $56,850–$57,800 after bearish rejection
- TP1: $55,800
- TP2: $54,900
- SL: Above $58,400
📈 Bullish Scenario: If BTC reclaims $57,800–$58,400 with strong volume, a relief bounce could develop.
⚠️ My View: The market is still bearish. I wouldn't rush into long positions or chase falling candles. Patience and confirmation matter more than FOMO.
🔥 **What's your opinion? Is Bitcoin heading towards $50K, or are we getting closer to a major recovery?
#CryptoAnalysis #BinanceSquare #TradingSignals #Write2Earn #DYOR
1
83

·
--
Bearish
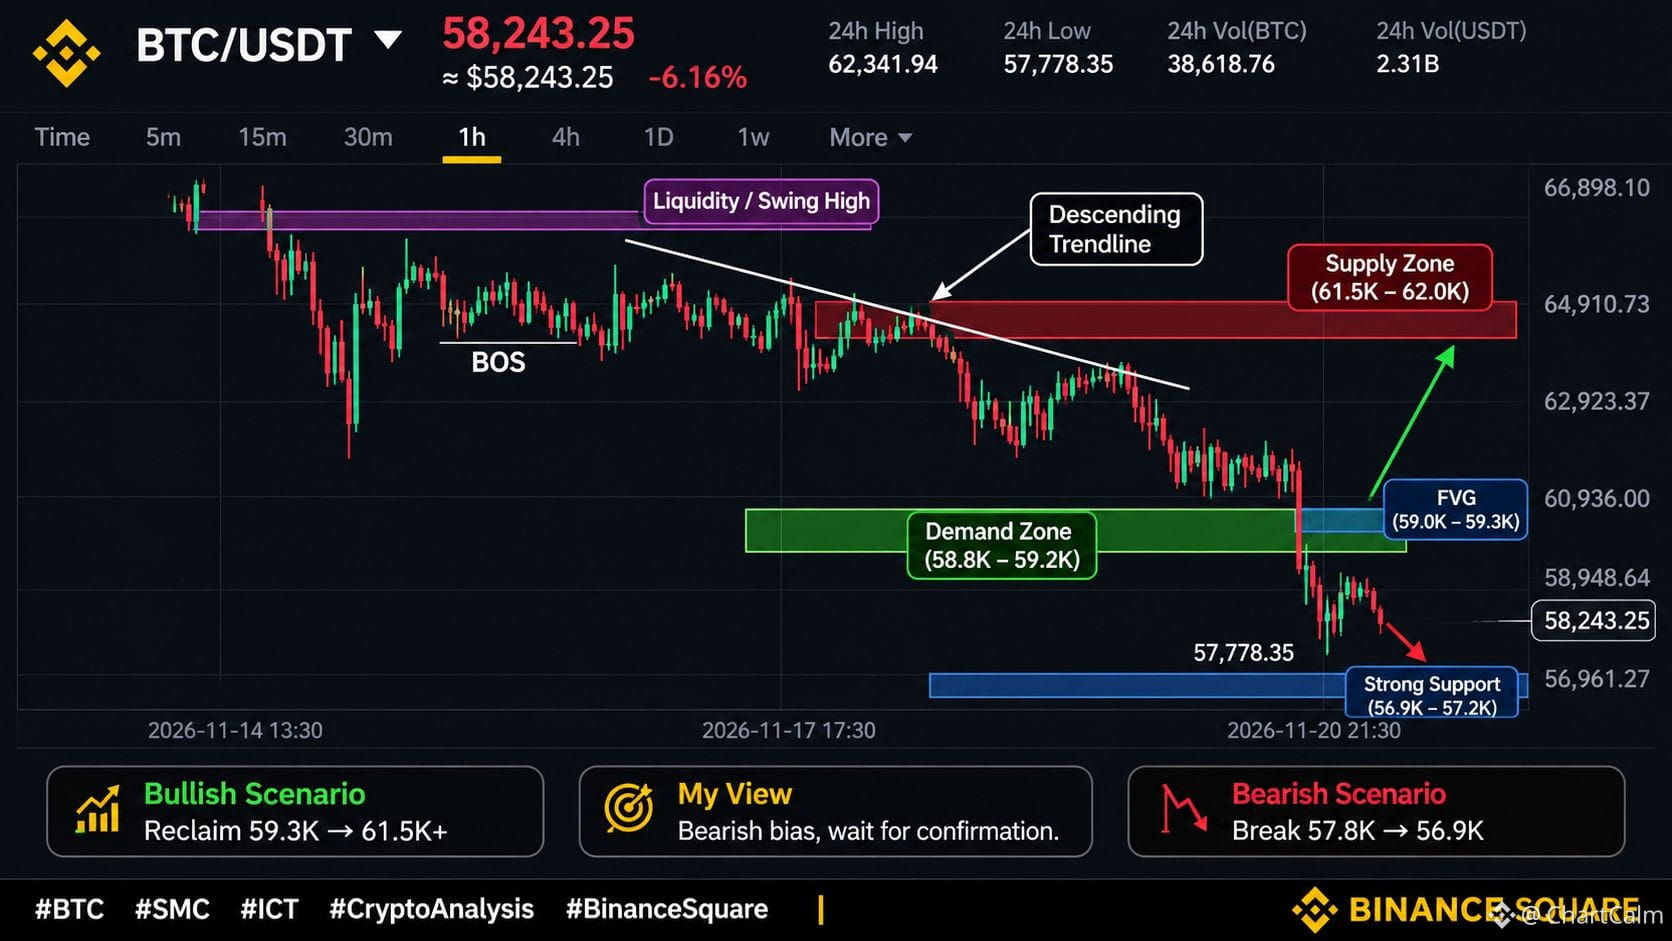
📉 BTCUSDT | 1H SMC + ICT ANALYSIS
Bitcoin is showing strong bearish momentum.
🔴 Market Structure
- Bearish BOS confirmed.
- Lower Highs (LH).
- Descending trendline.
- Strong bearish displacement.
📍 Key Levels
- Resistance: $58,950
- Bearish OB: $60,950–$61,300
- FVG: $59,600–$60,500
- Sell-side liquidity: $57,778
📉 Bearish: Breakdown below $57,778 could bring further downside.
📈 Bullish: Reclaiming $58,950 could signal a short-term recovery.
🎯 My View: Bearish until bullish structure is confirmed.$BTC
{spot}(BTCUSDT)
What is your view? 🐻 or 🐂?
#BTC #Bitcoin #SMC #CryptoAnalysis
📉 BTCUSDT | 1H SMC + ICT ANALYSIS
Bitcoin is showing strong bearish momentum.
🔴 Market Structure
- Bearish BOS confirmed.
- Lower Highs (LH).
- Descending trendline.
- Strong bearish displacement.
📍 Key Levels
- Resistance: $58,950
- Bearish OB: $60,950–$61,300
- FVG: $59,600–$60,500
- Sell-side liquidity: $57,778
📉 Bearish: Breakdown below $57,778 could bring further downside.
📈 Bullish: Reclaiming $58,950 could signal a short-term recovery.
🎯 My View: Bearish until bullish structure is confirmed.$BTC
What is your view? 🐻 or 🐂?
#BTC #Bitcoin #SMC #CryptoAnalysis
Bitcoin is showing strong bearish momentum.
🔴 Market Structure
- Bearish BOS confirmed.
- Lower Highs (LH).
- Descending trendline.
- Strong bearish displacement.
📍 Key Levels
- Resistance: $58,950
- Bearish OB: $60,950–$61,300
- FVG: $59,600–$60,500
- Sell-side liquidity: $57,778
📉 Bearish: Breakdown below $57,778 could bring further downside.
📈 Bullish: Reclaiming $58,950 could signal a short-term recovery.
🎯 My View: Bearish until bullish structure is confirmed.$BTC
What is your view? 🐻 or 🐂?
#BTC #Bitcoin #SMC #CryptoAnalysis
119

·
--
Bearish
🚨 Bitcoin Below $60K: Is More Pain Coming?
$BTC has dropped below the critical $60,000 level for the first time since July, now trading around $59,500.
📉 Down approximately 8.5% this week, with a potential seventh consecutive weekly loss.
What’s driving the sell-off?
* $541M in record IBIT outflows.
* Rising expectations of Fed rate hikes.
* An ongoing sell-off in AI stocks.
* $553M liquidated in just one hour.
* Fear & Greed Index at 11 — Extreme Fear.
📊 Key Levels to Watch:
* 2026 low: $58,566.
* Current price: Around $59,500.
* Critical recovery level: $62,000.
* BTC remains approximately 53% below its all-time high.
👨🏻💻 My Take:
A short-term relief rally is possible. Extreme fear and oversold conditions can create opportunities for a bounce.
However, I don’t see a confirmed bottom yet.
I would want to see a strong daily close above $62K before considering a recovery more seriously. If BTC loses the $58.5K support, further downside could follow.
⚠️ Don’t rush into buying the dip. Protect your capital, manage risk, and avoid oversized positions.
Do you think Bitcoin can reclaim $60K, or are we heading toward another leg down?
#Bitcoin #BTC #CryptoMarket #BinanceSquare #CryptoAnalysis
{future}(BTCUSDT)
🚨 Bitcoin Below $60K: Is More Pain Coming?
$BTC has dropped below the critical $60,000 level for the first time since July, now trading around $59,500.
📉 Down approximately 8.5% this week, with a potential seventh consecutive weekly loss.
What’s driving the sell-off?
* $541M in record IBIT outflows.
* Rising expectations of Fed rate hikes.
* An ongoing sell-off in AI stocks.
* $553M liquidated in just one hour.
* Fear & Greed Index at 11 — Extreme Fear.
📊 Key Levels to Watch:
* 2026 low: $58,566.
* Current price: Around $59,500.
* Critical recovery level: $62,000.
* BTC remains approximately 53% below its all-time high.
👨🏻💻 My Take:
A short-term relief rally is possible. Extreme fear and oversold conditions can create opportunities for a bounce.
However, I don’t see a confirmed bottom yet.
I would want to see a strong daily close above $62K before considering a recovery more seriously. If BTC loses the $58.5K support, further downside could follow.
⚠️ Don’t rush into buying the dip. Protect your capital, manage risk, and avoid oversized positions.
Do you think Bitcoin can reclaim $60K, or are we heading toward another leg down?
#Bitcoin #BTC #CryptoMarket #BinanceSquare #CryptoAnalysis
$BTC has dropped below the critical $60,000 level for the first time since July, now trading around $59,500.
📉 Down approximately 8.5% this week, with a potential seventh consecutive weekly loss.
What’s driving the sell-off?
* $541M in record IBIT outflows.
* Rising expectations of Fed rate hikes.
* An ongoing sell-off in AI stocks.
* $553M liquidated in just one hour.
* Fear & Greed Index at 11 — Extreme Fear.
📊 Key Levels to Watch:
* 2026 low: $58,566.
* Current price: Around $59,500.
* Critical recovery level: $62,000.
* BTC remains approximately 53% below its all-time high.
👨🏻💻 My Take:
A short-term relief rally is possible. Extreme fear and oversold conditions can create opportunities for a bounce.
However, I don’t see a confirmed bottom yet.
I would want to see a strong daily close above $62K before considering a recovery more seriously. If BTC loses the $58.5K support, further downside could follow.
⚠️ Don’t rush into buying the dip. Protect your capital, manage risk, and avoid oversized positions.
Do you think Bitcoin can reclaim $60K, or are we heading toward another leg down?
#Bitcoin #BTC #CryptoMarket #BinanceSquare #CryptoAnalysis
116

🚨 WHY IS THE CRYPTO MARKET CRASHING TODAY?
The crypto market is facing heavy selling pressure on November 20, 2026.
📉 Market Snapshot:
- $BTC: $58,879 (-6.71%)
- $ETH: $1,630 (-8.47%)
- $SOL: $68.09 (-7.61%)
- $BNB: $543.50 (-7.40%)
- $XRP: $0.9067 (-6.76%)
🔍 5 Major Reasons Behind This Market Dip
1️⃣ Global Stock Market Sell-Off
Weakness in technology and AI stocks is putting pressure on risk assets, including crypto.
2️⃣ Bitcoin ETF Outflows
Heavy withdrawals from Bitcoin ETFs are adding to selling pressure.
3️⃣ Massive Long Liquidations
Leveraged traders are getting liquidated, creating additional market selling.
4️⃣ US Interest Rate Concerns
Inflation worries and expectations of tighter monetary policy are reducing investor appetite for risky assets.
5️⃣ Panic Selling
As important support levels break, fear spreads and more traders exit their positions.
📊 What Should Traders Watch Next?
- BTC needs to stabilize before expecting a stronger altcoin recovery.
- Watch whether buyers defend the current support areas.
- A breakdown below support could create further downside.
- Wait for confirmation instead of rushing into dip buying.
⚠️ My View: This is a high-volatility market. A recovery is possible, but the downtrend is not confirmed over yet.
Do you think this is a temporary correction or the start of a deeper bear-market move?
$BTC $ETH $SOL
#Bitcoin #CryptoMarketMoves #marketcrash #CryptoAnalysis #BinanceSquare
🚨 WHY IS THE CRYPTO MARKET CRASHING TODAY?
The crypto market is facing heavy selling pressure on November 20, 2026.
📉 Market Snapshot:
- $BTC : $58,879 (-6.71%)
- $ETH : $1,630 (-8.47%)
- $SOL : $68.09 (-7.61%)
- $BNB: $543.50 (-7.40%)
- $XRP: $0.9067 (-6.76%)
🔍 5 Major Reasons Behind This Market Dip
1️⃣ Global Stock Market Sell-Off
Weakness in technology and AI stocks is putting pressure on risk assets, including crypto.
2️⃣ Bitcoin ETF Outflows
Heavy withdrawals from Bitcoin ETFs are adding to selling pressure.
3️⃣ Massive Long Liquidations
Leveraged traders are getting liquidated, creating additional market selling.
4️⃣ US Interest Rate Concerns
Inflation worries and expectations of tighter monetary policy are reducing investor appetite for risky assets.
5️⃣ Panic Selling
As important support levels break, fear spreads and more traders exit their positions.
📊 What Should Traders Watch Next?
- BTC needs to stabilize before expecting a stronger altcoin recovery.
- Watch whether buyers defend the current support areas.
- A breakdown below support could create further downside.
- Wait for confirmation instead of rushing into dip buying.
⚠️ My View: This is a high-volatility market. A recovery is possible, but the downtrend is not confirmed over yet.
Do you think this is a temporary correction or the start of a deeper bear-market move?
$BTC $ETH $SOL
#Bitcoin #CryptoMarketMoves #marketcrash #CryptoAnalysis #BinanceSquare
The crypto market is facing heavy selling pressure on November 20, 2026.
📉 Market Snapshot:
- $BTC : $58,879 (-6.71%)
- $ETH : $1,630 (-8.47%)
- $SOL : $68.09 (-7.61%)
- $BNB: $543.50 (-7.40%)
- $XRP: $0.9067 (-6.76%)
🔍 5 Major Reasons Behind This Market Dip
1️⃣ Global Stock Market Sell-Off
Weakness in technology and AI stocks is putting pressure on risk assets, including crypto.
2️⃣ Bitcoin ETF Outflows
Heavy withdrawals from Bitcoin ETFs are adding to selling pressure.
3️⃣ Massive Long Liquidations
Leveraged traders are getting liquidated, creating additional market selling.
4️⃣ US Interest Rate Concerns
Inflation worries and expectations of tighter monetary policy are reducing investor appetite for risky assets.
5️⃣ Panic Selling
As important support levels break, fear spreads and more traders exit their positions.
📊 What Should Traders Watch Next?
- BTC needs to stabilize before expecting a stronger altcoin recovery.
- Watch whether buyers defend the current support areas.
- A breakdown below support could create further downside.
- Wait for confirmation instead of rushing into dip buying.
⚠️ My View: This is a high-volatility market. A recovery is possible, but the downtrend is not confirmed over yet.
Do you think this is a temporary correction or the start of a deeper bear-market move?
$BTC $ETH $SOL
#Bitcoin #CryptoMarketMoves #marketcrash #CryptoAnalysis #BinanceSquare
1
229

·
--

Article
🚨 BITCOIN UNDER HEAVY PRESSURE: BTC FALLS TOWARD $61,000 AS MARKET FEAR GROWS
Bitcoin (BTC) is facBitcoin (BTC) is facing significant selling pressure as the broader financial markets continue to weaken.
On November 20, 2026, BTC briefly dropped toward $61,200 before recovering slightly and trading around the $61,700–$62,000 region.
🔴 What's Behind the Decline?
Three major factors are putting pressure on Bitcoin:
1. Massive Bitcoin ETF Outflows
BlackRock's iShares Bitcoin Trust (IBIT) recorded approximately $541.1 million in single-day net outflows, its largest since launch.
2. Heavy Market Liquidations
Around $718.6 million in crypto positions were liquidated across the market in 24 hours, with long positions accounting for most of the liquidations.
3. Global Market Uncertainty
Weakness in technology stocks, a stronger US dollar, and concerns about higher interest rates are reducing investors' appetite for risky assets.
📊 Important BTC Price Levels
$60,000: Major psychological level to watch.
$60,500–$60,900: Potential liquidity area below current price.
$62,000: Important short-term price area.
$63,800–$64,600: Potential recovery zone if buying pressure returns.
🔍 Market Outlook
Bitcoin's short-term market structure remains under pressure. A sustained recovery above resistance could improve market sentiment, while further weakness below the $60,000 region could increase selling pressure.
However, one important thing to remember: a market rebound does not automatically confirm a trend reversal.
💡 Final Thoughts
The current Bitcoin market is showing how quickly institutional flows, macroeconomic conditions, and leveraged market activity can influence cryptocurrency prices.
For now, the key things to monitor are ETF flows, global market sentiment, and Bitcoin's ability to stabilize around important price levels.
Stay informed. Stay patient. Let the market confirm its direction.
$BTC BTC #CryptoMarket #BitcoinNews #BinanceSquare #CryptoAnalysis #btcupdates2024 e #cryptocurrency #MarketUpdate
🚨 BITCOIN UNDER HEAVY PRESSURE: BTC FALLS TOWARD $61,000 AS MARKET FEAR GROWS Bitcoin (BTC) is fac
Bitcoin (BTC) is facing significant selling pressure as the broader financial markets continue to weaken.
On November 20, 2026, BTC briefly dropped toward $61,200 before recovering slightly and trading around the $61,700–$62,000 region.
🔴 What's Behind the Decline?
Three major factors are putting pressure on Bitcoin:
1. Massive Bitcoin ETF Outflows
BlackRock's iShares Bitcoin Trust (IBIT) recorded approximately $541.1 million in single-day net outflows, its largest since launch.
2. Heavy Market Liquidations
Around $718.6 million in crypto positions were liquidated across the market in 24 hours, with long positions accounting for most of the liquidations.
3. Global Market Uncertainty
Weakness in technology stocks, a stronger US dollar, and concerns about higher interest rates are reducing investors' appetite for risky assets.
📊 Important BTC Price Levels
$60,000: Major psychological level to watch.
$60,500–$60,900: Potential liquidity area below current price.
$62,000: Important short-term price area.
$63,800–$64,600: Potential recovery zone if buying pressure returns.
🔍 Market Outlook
Bitcoin's short-term market structure remains under pressure. A sustained recovery above resistance could improve market sentiment, while further weakness below the $60,000 region could increase selling pressure.
However, one important thing to remember: a market rebound does not automatically confirm a trend reversal.
💡 Final Thoughts
The current Bitcoin market is showing how quickly institutional flows, macroeconomic conditions, and leveraged market activity can influence cryptocurrency prices.
For now, the key things to monitor are ETF flows, global market sentiment, and Bitcoin's ability to stabilize around important price levels.
Stay informed. Stay patient. Let the market confirm its direction.
$BTC BTC #CryptoMarket #BitcoinNews #BinanceSquare #CryptoAnalysis #btcupdates2024 e #cryptocurrency #MarketUpdate
On November 20, 2026, BTC briefly dropped toward $61,200 before recovering slightly and trading around the $61,700–$62,000 region.
🔴 What's Behind the Decline?
Three major factors are putting pressure on Bitcoin:
1. Massive Bitcoin ETF Outflows
BlackRock's iShares Bitcoin Trust (IBIT) recorded approximately $541.1 million in single-day net outflows, its largest since launch.
2. Heavy Market Liquidations
Around $718.6 million in crypto positions were liquidated across the market in 24 hours, with long positions accounting for most of the liquidations.
3. Global Market Uncertainty
Weakness in technology stocks, a stronger US dollar, and concerns about higher interest rates are reducing investors' appetite for risky assets.
📊 Important BTC Price Levels
$60,000: Major psychological level to watch.
$60,500–$60,900: Potential liquidity area below current price.
$62,000: Important short-term price area.
$63,800–$64,600: Potential recovery zone if buying pressure returns.
🔍 Market Outlook
Bitcoin's short-term market structure remains under pressure. A sustained recovery above resistance could improve market sentiment, while further weakness below the $60,000 region could increase selling pressure.
However, one important thing to remember: a market rebound does not automatically confirm a trend reversal.
💡 Final Thoughts
The current Bitcoin market is showing how quickly institutional flows, macroeconomic conditions, and leveraged market activity can influence cryptocurrency prices.
For now, the key things to monitor are ETF flows, global market sentiment, and Bitcoin's ability to stabilize around important price levels.
Stay informed. Stay patient. Let the market confirm its direction.
$BTC BTC #CryptoMarket #BitcoinNews #BinanceSquare #CryptoAnalysis #btcupdates2024 e #cryptocurrency #MarketUpdate
35

·
--
Bearish
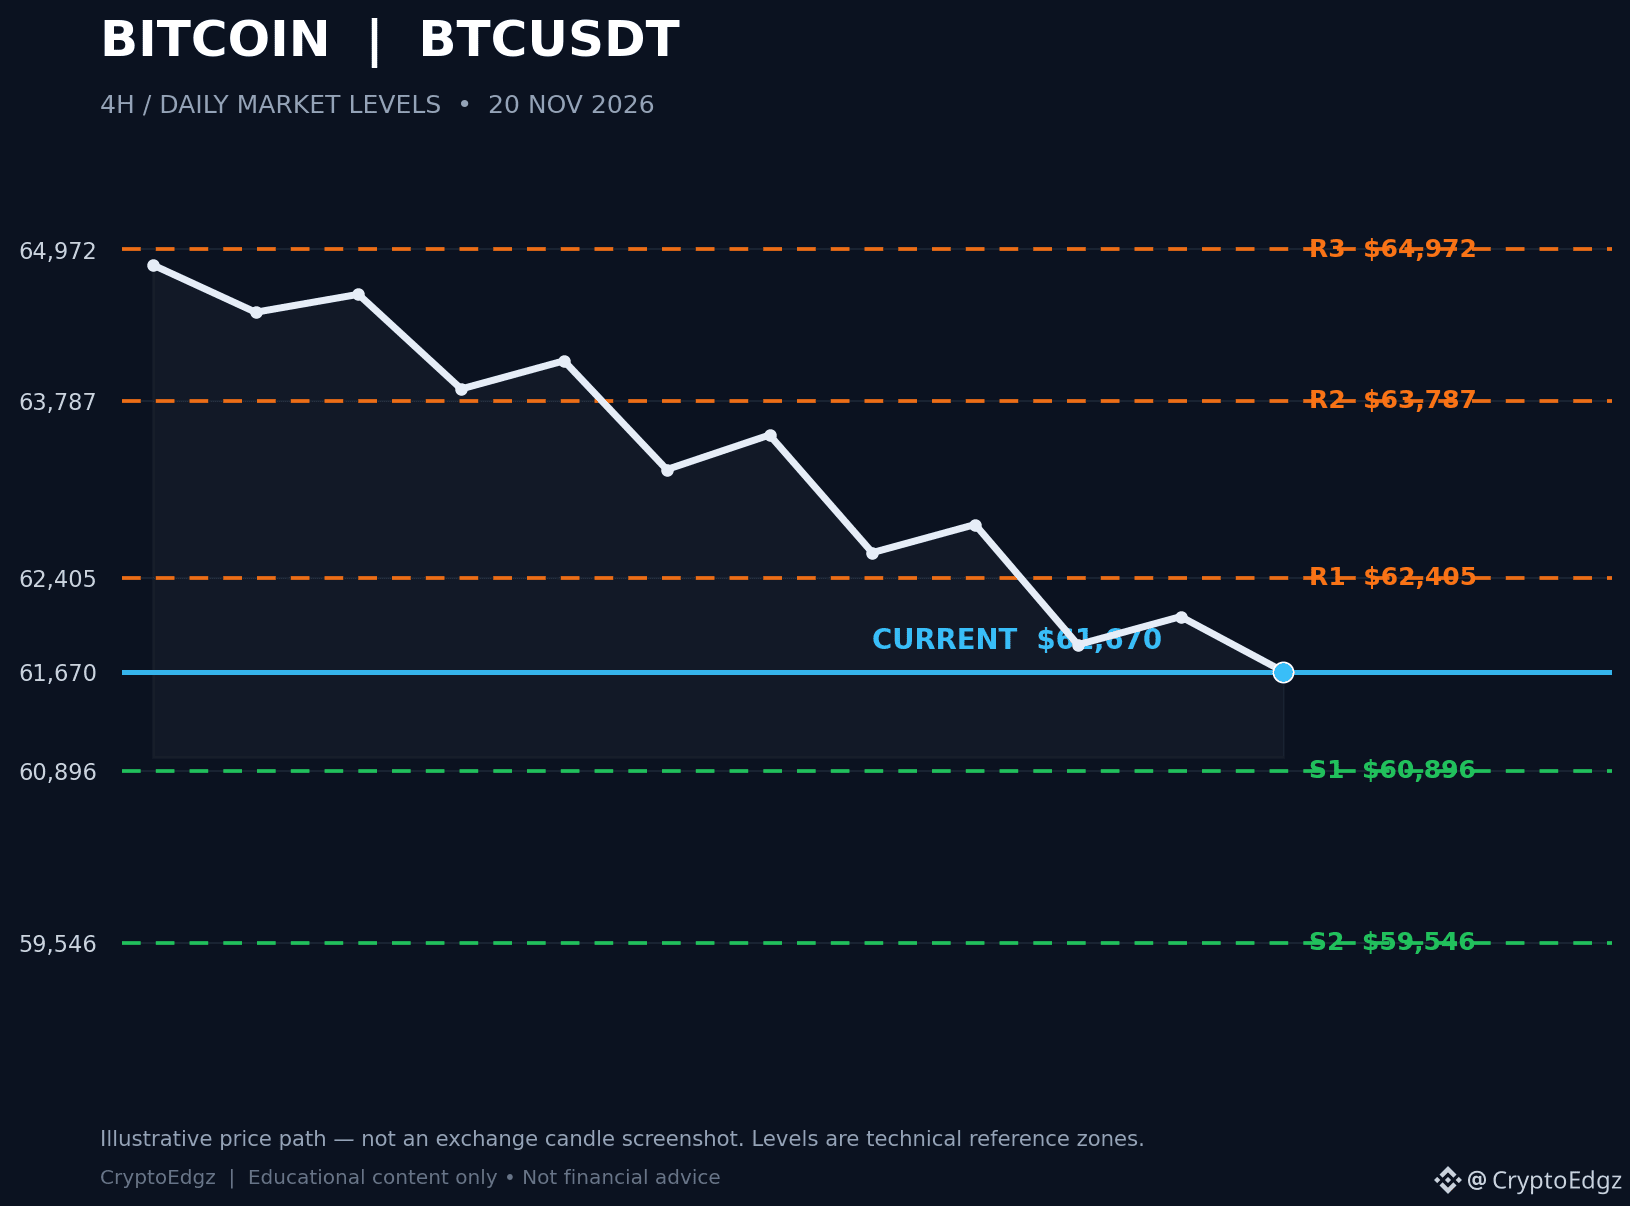
(BTC) UPDATE | Nov 20
BTC is trading around $61,825, down 3.08% in the last 24H.
📉 Key Support:
$61,200
$60,850
$60,000
📈 Key Resistance:
$63,000
$64,000
$64,850
My Market View:
BTC remains bearish on the 4H and Daily charts. A break below $60,850 could trigger further downside. However, reclaiming $63,000 may open the door for a short-term recovery.
⚠️ No confirmation, no entry. Risk management comes first!
💬 Your Opinion: Will BTC break below $60K or recover toward $64K?
#BTC #CryptoAnalysis
(BTC) UPDATE | Nov 20
BTC is trading around $61,825, down 3.08% in the last 24H.
📉 Key Support:
$61,200
$60,850
$60,000
📈 Key Resistance:
$63,000
$64,000
$64,850
My Market View:
BTC remains bearish on the 4H and Daily charts. A break below $60,850 could trigger further downside. However, reclaiming $63,000 may open the door for a short-term recovery.
⚠️ No confirmation, no entry. Risk management comes first!
💬 Your Opinion: Will BTC break below $60K or recover toward $64K?
#BTC #CryptoAnalysis
BTC is trading around $61,825, down 3.08% in the last 24H.
📉 Key Support:
$61,200
$60,850
$60,000
📈 Key Resistance:
$63,000
$64,000
$64,850
My Market View:
BTC remains bearish on the 4H and Daily charts. A break below $60,850 could trigger further downside. However, reclaiming $63,000 may open the door for a short-term recovery.
⚠️ No confirmation, no entry. Risk management comes first!
💬 Your Opinion: Will BTC break below $60K or recover toward $64K?
#BTC #CryptoAnalysis
75

·
--
🚨 XRP shows resilience amid broader market volatility, with price action suggesting potential accumulation despite recent dips. The altcoin's performance often leads market sentiment shifts.
Market implication: Watch for breakout confirmation on increased volume to validate the emerging trend.
#Crypto
$XRP #TradingSignal #CryptoAnalysis
🚨 XRP shows resilience amid broader market volatility, with price action suggesting potential accumulation despite recent dips. The altcoin's performance often leads market sentiment shifts.
Market implication: Watch for breakout confirmation on increased volume to validate the emerging trend.
#Crypto
$XRP #TradingSignal #CryptoAnalysis
Market implication: Watch for breakout confirmation on increased volume to validate the emerging trend.
#Crypto
$XRP #TradingSignal #CryptoAnalysis

1
·
--
Bearish
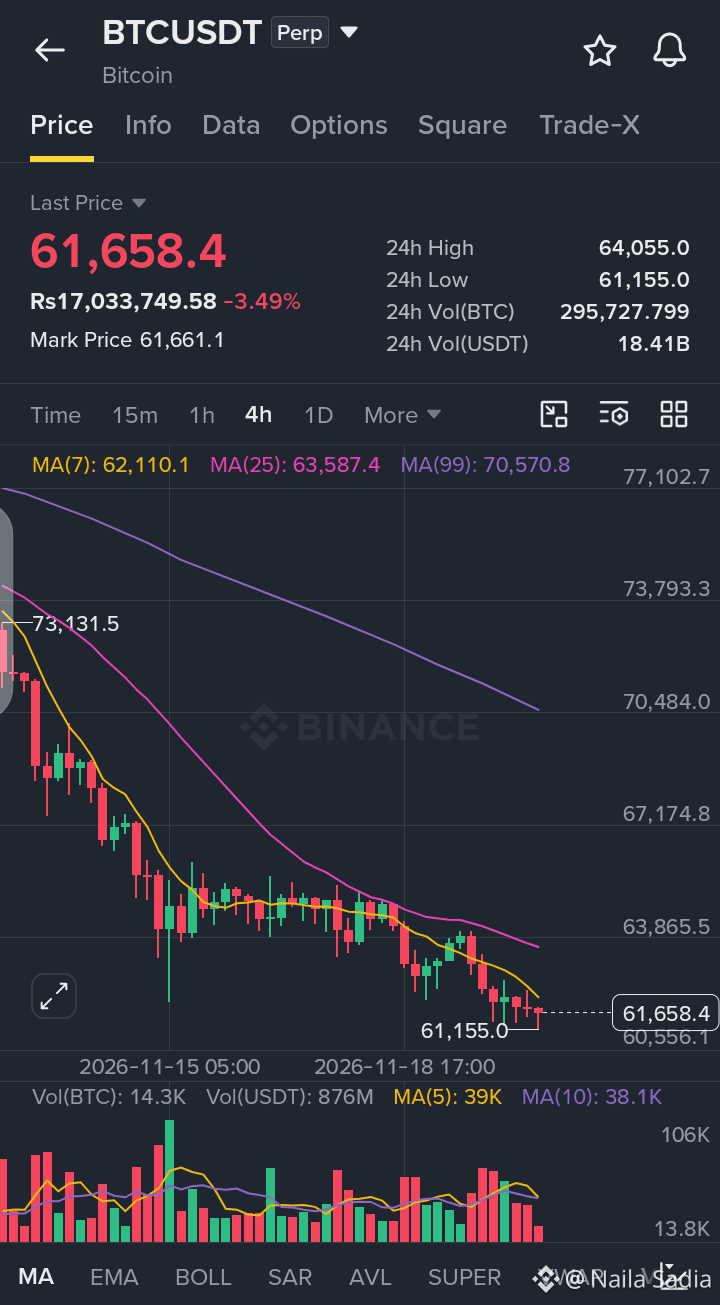
🚨 BTC SLIDING BELOW $62K! WILL $61.1K SUPPORT HOLD OR BREAK?
$BTC is trading near $61,658.4, down 3.49%. The 4H chart shows continued selling pressure as price remains below all major moving averages (MA 7 at $62,110.1, MA 25 at $63,587.4, and MA 99 at $70,570.8).
📉 Market Outlook: Bearish momentum remains active after testing lower support zones. A break below the $61,155.0 low could trigger further downside toward lower support levels, while reclaiming $62,110.1–$63,587.4 resistance may spark a relief bounce.
🎯 TRADE PLAN – SHORT
Entry: $62,000.00–$62,800.00
TP1: $60,600.00
TP2: $59,500.00
SL: $63,600.00
💬 Will $BTC hold above $61.1K or extend its drop lower?
👇 CLICK HERE FOR TRADE
$BTC
{future}(BTCUSDT)
#BTC #bitcoin #CryptoAnalysis #BinanceSquare
🚨 BTC SLIDING BELOW $62K! WILL $61.1K SUPPORT HOLD OR BREAK?
$BTC is trading near $61,658.4, down 3.49%. The 4H chart shows continued selling pressure as price remains below all major moving averages (MA 7 at $62,110.1, MA 25 at $63,587.4, and MA 99 at $70,570.8).
📉 Market Outlook: Bearish momentum remains active after testing lower support zones. A break below the $61,155.0 low could trigger further downside toward lower support levels, while reclaiming $62,110.1–$63,587.4 resistance may spark a relief bounce.
🎯 TRADE PLAN – SHORT
Entry: $62,000.00–$62,800.00
TP1: $60,600.00
TP2: $59,500.00
SL: $63,600.00
💬 Will $BTC hold above $61.1K or extend its drop lower?
👇 CLICK HERE FOR TRADE
$BTC
#BTC #bitcoin #CryptoAnalysis #BinanceSquare
$BTC is trading near $61,658.4, down 3.49%. The 4H chart shows continued selling pressure as price remains below all major moving averages (MA 7 at $62,110.1, MA 25 at $63,587.4, and MA 99 at $70,570.8).
📉 Market Outlook: Bearish momentum remains active after testing lower support zones. A break below the $61,155.0 low could trigger further downside toward lower support levels, while reclaiming $62,110.1–$63,587.4 resistance may spark a relief bounce.
🎯 TRADE PLAN – SHORT
Entry: $62,000.00–$62,800.00
TP1: $60,600.00
TP2: $59,500.00
SL: $63,600.00
💬 Will $BTC hold above $61.1K or extend its drop lower?
👇 CLICK HERE FOR TRADE
$BTC
#BTC #bitcoin #CryptoAnalysis #BinanceSquare
53
Article
BITCOIN UNDER PRESSURE: IS $60K THE NEXT TARGET?Bitcoin is struggling as hawkish Federal Reserve signals increase uncertainty across the crypto market.
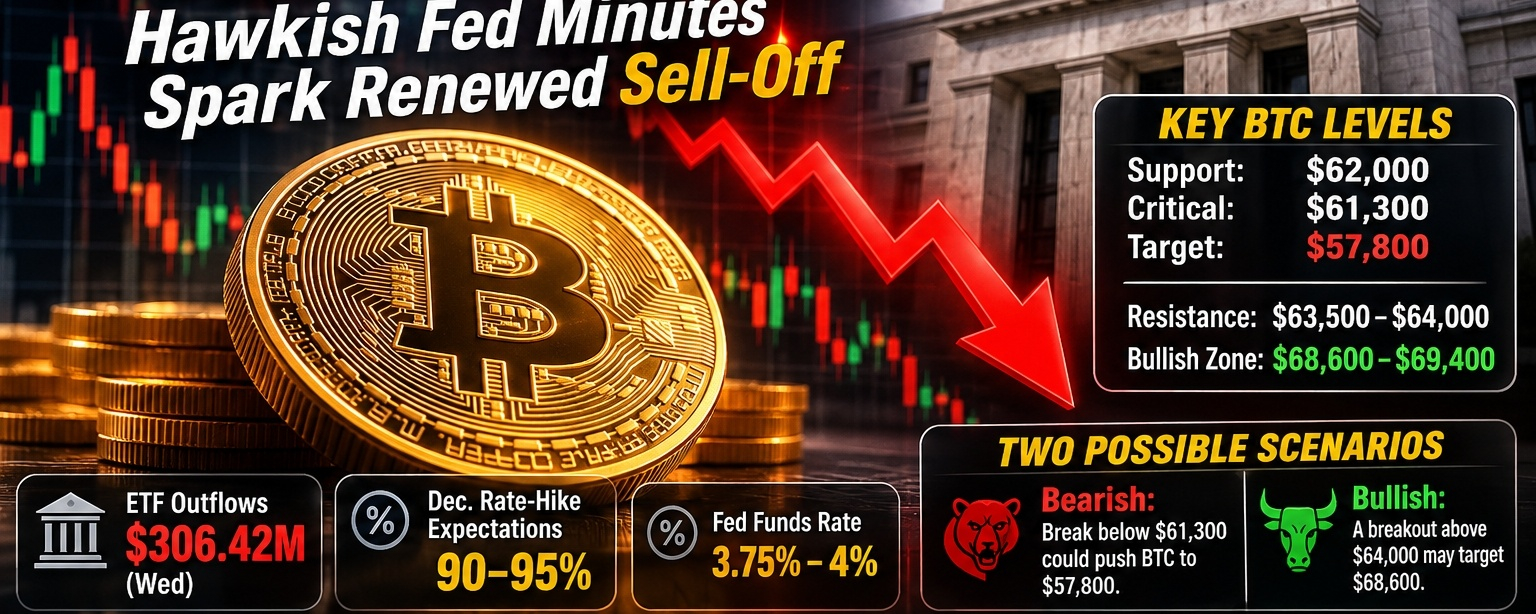
📊 Key Market Numbers:
- BTC recently traded around $62,000–$63,500.
- US Spot Bitcoin ETFs recorded $306.42M in outflows on Wednesday.
- December rate-hike expectations have climbed to around 90–95%.
- The Fed's current interest-rate target is 3.75%–4%.
📉 Important BTC Levels:
- Immediate support: $62,000
- Critical support: $61,300
- Major downside target: $57,800
- Recovery resistance: $63,500–$64,000
- Bullish recovery zone: $68,600–$69,400
🔍 Two Possible Scenarios:
🐻 Bearish: A confirmed breakdown below $61,300, combined with continued ETF outflows, could expose BTC to $57,800.
🐂 Bullish: A strong recovery above $64,000, followed by sustained buying pressure, could improve the outlook toward $68,600.
💡 My Market View: The combination of institutional outflows and tighter monetary-policy expectations makes this a critical period for Bitcoin. Watch ETF flows, Fed comments, and daily candle closes before making trading decisions.
What do you think? Will Bitcoin defend $61K or fall toward $58K?
#bitcoin $BTC #CryptoAnalysis #FederalReserve #BinanceSquare #CryptoTrading
BITCOIN UNDER PRESSURE: IS $60K THE NEXT TARGET?
Bitcoin is struggling as hawkish Federal Reserve signals increase uncertainty across the crypto market.
📊 Key Market Numbers:
- BTC recently traded around $62,000–$63,500.
- US Spot Bitcoin ETFs recorded $306.42M in outflows on Wednesday.
- December rate-hike expectations have climbed to around 90–95%.
- The Fed's current interest-rate target is 3.75%–4%.
📉 Important BTC Levels:
- Immediate support: $62,000
- Critical support: $61,300
- Major downside target: $57,800
- Recovery resistance: $63,500–$64,000
- Bullish recovery zone: $68,600–$69,400
🔍 Two Possible Scenarios:
🐻 Bearish: A confirmed breakdown below $61,300, combined with continued ETF outflows, could expose BTC to $57,800.
🐂 Bullish: A strong recovery above $64,000, followed by sustained buying pressure, could improve the outlook toward $68,600.
💡 My Market View: The combination of institutional outflows and tighter monetary-policy expectations makes this a critical period for Bitcoin. Watch ETF flows, Fed comments, and daily candle closes before making trading decisions.
What do you think? Will Bitcoin defend $61K or fall toward $58K?
#bitcoin $BTC #CryptoAnalysis #FederalReserve #BinanceSquare #CryptoTrading
📊 Key Market Numbers:
- BTC recently traded around $62,000–$63,500.
- US Spot Bitcoin ETFs recorded $306.42M in outflows on Wednesday.
- December rate-hike expectations have climbed to around 90–95%.
- The Fed's current interest-rate target is 3.75%–4%.
📉 Important BTC Levels:
- Immediate support: $62,000
- Critical support: $61,300
- Major downside target: $57,800
- Recovery resistance: $63,500–$64,000
- Bullish recovery zone: $68,600–$69,400
🔍 Two Possible Scenarios:
🐻 Bearish: A confirmed breakdown below $61,300, combined with continued ETF outflows, could expose BTC to $57,800.
🐂 Bullish: A strong recovery above $64,000, followed by sustained buying pressure, could improve the outlook toward $68,600.
💡 My Market View: The combination of institutional outflows and tighter monetary-policy expectations makes this a critical period for Bitcoin. Watch ETF flows, Fed comments, and daily candle closes before making trading decisions.
What do you think? Will Bitcoin defend $61K or fall toward $58K?
#bitcoin $BTC #CryptoAnalysis #FederalReserve #BinanceSquare #CryptoTrading
1
78

Article
Bitcoin (BTC): Consolidation at the Summit – A Pause Before the Next Leg?Date: November 20, 2026
Ticker: BTC
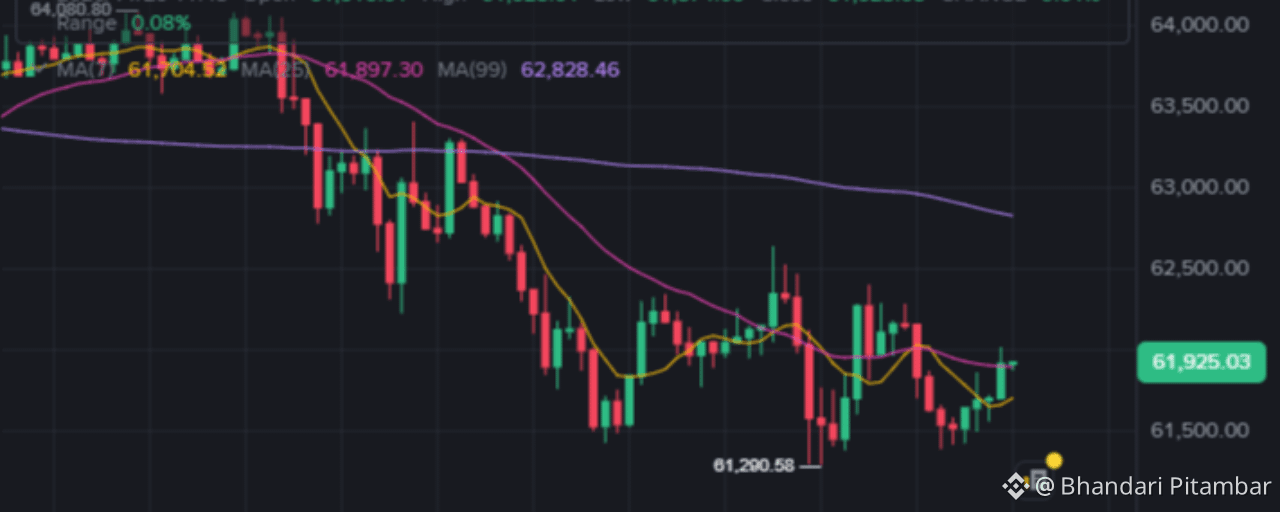
Current Price: ~$61,925
The Bitcoin market is currently exhibiting a classic "breather" pattern after a sustained period of accumulation and gradual appreciation. As we sit at approximately $61,925, the asset is hovering just above the critical psychological barrier of $61,800. The immediate trend is neutral-to-bullish, characterized by low volatility and shrinking volume—a common precursor to significant directional moves.
Below is a comprehensive analysis of the current state of Bitcoin, blending technical precision with fundamental context.
1. Coin Market Overview
Current Price: $61,925.0324h Change: +0.01% (Neutral)24h High: $61,928.0124h Low: $61,874.00Trading Range: Extremely tight ($0.08% range), indicating indecision.Market Sentiment: Neutral/Cautiously Optimistic. The lack of downward pressure despite minor resistance suggests strong holding behavior (HODLing).Volume Profile: Volume is relatively low (Vol BTC: 4.96, Vol USDT: 307.5K in the sampled interval), suggesting that the current price level is stable but lacks aggressive buying or selling conviction.
Whale & Institutional Activity:
With such a tight range and low volume, large institutional players are likely accumulating quietly or waiting for a clearer signal before deploying significant capital. The absence of sharp wicks suggests no major liquidations are occurring at these levels.
BTC Dominance:
While specific dominance % isn't listed in the immediate snapshot, the stability of BTC against fiat pairs usually correlates with strength relative to altcoins during consolidation phases.
2. Professional Technical Analysis
Moving Averages (MA)
MA(7): 61,604.32 – Bullish. Price is trading above the 7-period MA, indicating short-term momentum is intact.MA(9): 61,897.30 – Neutral/Bullish. Price is currently testing this level. A close above this confirms short-term strength.MA(99): 62,828.46 – Bearish (Medium-Term). Price is below the 99-period MA, which acts as dynamic resistance. This is the key level to watch. If BTC cannot reclaim $62,800, the medium-term trend remains capped.
Key Levels
Immediate Support: $61,874 (24h Low) → $61,600 (MA7 Support).Immediate Resistance: $61,928 (24h High) → $62,828 (MA99).Major Target/Previous High: $81,200.58 (indicated on chart as a potential long-term target or previous structural high).
Indicators (Inferred from Context)
RSI: Likely neutral (~50), given the minimal price change.MACD: Probably flat or slightly bullish if price holds above MA7.Volume: Low volume consolidation often precedes a breakout. The next move will likely be explosive.
Timeframe Analysis
15-Minute: Sideways consolidation. Tight range.1-Hour: Neutral. Price is sandwiched between MA7 and MA99.Daily: Bullish bias but facing resistance at MA99 ($62.8k).
3. Latest Market News (Contextual for Nov 2026)
Note: Specific breaking news for this exact hour requires live feed, but based on the broader 2026 context:
Institutional Adoption: Continued ETF inflows remain a primary driver. With Bitcoin stabilizing above $60k, institutional confidence is high.Regulatory Clarity: By late 2026, major jurisdictions (US, EU) have established clearer crypto frameworks, reducing regulatory overhangs that plagued earlier years.Halving Aftermath: We are well past the 2024 halving. Supply shock effects are now fully integrated into the market structure, with reduced circulating supply supporting higher baselines.Macro Environment: Global liquidity conditions in 2026 have been favorable for risk assets, supporting crypto valuations.
4. Fundamental Analysis
Utility: Bitcoin remains the dominant digital store of value and settlement layer. Its role as "digital gold" is cemented in institutional portfolios.Tokenomics: Fixed supply of 21 million. Current inflation rate is low post-halving.Adoption: Growing use cases in cross-border payments and treasury reserves for corporations.Risks: Regulatory shifts in major economies, macroeconomic recessions, or black swan events could disrupt the current equilibrium. However, the fundamental thesis remains strong.
5. Three Future Scenarios
🐂 Bullish Scenario
Condition: BTC closes decisively above $62,828 (MA99) on high volume.Target: Retest of previous highs near $64,000, then extension toward $65,000–$68,000.Confirmation: Rising volume, RSI breaking above 60, and sustained daily closes above MA99.
🐻 Bearish Scenario
Condition: Break below $61,600 (MA7 support).Target: Drop to $61,000, then deeper correction to $60,000 or lower if macro conditions worsen.Confirmation: Increased sell volume, bearish divergence on RSI, failure to hold MA7.
➡️ Sideways Scenario
Condition: Price continues to chop between $61,600 and $62,800.Outcome: Accumulation phase. Volatility squeezes further until a catalyst emerges.Likelihood: High in the short term (next 24-48 hours) given current low volume.
6. Trading Analysis
Entry Zones:Aggressive Long: $61,870–$61,900 (current level) with tight stop.Conservative Long: Pullback to $61,600 (MA7) or break-and-retest of $62,800.Stop-Loss: Below $61,500 (psychological and structural support).Take-Profit Targets:TP1: $62,800 (MA99 Resistance)TP2: $64,000 (Psychological Level)TP3: $65,500+ (Trend Extension)Risk/Reward Ratio: Favorable if entered near support ($61,600) with targets at $62,800+ (RR > 1:3).
7. Chart and Visual Analysis Recommendations
For a professional Binance Square post, include:
Main Chart: Candlesticks with MA7 (blue), MA9 (yellow), and MA99 (purple) overlays. Highlight the $61,600 support and $62,800 resistance zones.Volume Chart: Show the declining volume bars, emphasizing the "squeeze" condition.RSI Indicator: To confirm neutrality or potential divergence.Fibonacci Retracement: From recent swing low to high to identify hidden support/resistance levels.
8. Conclusion
Bitcoin is in a consolidation phase with a bullish bias. The price is holding above short-term moving averages but faces resistance at the 99-period MA. Traders should watch for a volume-backed breakout above $62,800 for confirmation of continued upward momentum. Until then, expect choppy, range-bound trading.
Key Takeaway: Don’t chase the breakout; wait for the retest or the confirmed close above resistance. Patience pays in low-volume environments.
$BTC $ETH $SOL
#Bitcoin #CryptoAnalysis #BTCUSD #TradingStrategy #BinanceSquare
{spot}(UVXYBUSDT)
{spot}(SKDDBUSDT)
{spot}(BTCUSDT)
Bitcoin (BTC): Consolidation at the Summit – A Pause Before the Next Leg?
Date: November 20, 2026
Ticker: BTC
Current Price: ~$61,925
The Bitcoin market is currently exhibiting a classic "breather" pattern after a sustained period of accumulation and gradual appreciation. As we sit at approximately $61,925, the asset is hovering just above the critical psychological barrier of $61,800. The immediate trend is neutral-to-bullish, characterized by low volatility and shrinking volume—a common precursor to significant directional moves.
Below is a comprehensive analysis of the current state of Bitcoin, blending technical precision with fundamental context.
1. Coin Market Overview
Current Price: $61,925.0324h Change: +0.01% (Neutral)24h High: $61,928.0124h Low: $61,874.00Trading Range: Extremely tight ($0.08% range), indicating indecision.Market Sentiment: Neutral/Cautiously Optimistic. The lack of downward pressure despite minor resistance suggests strong holding behavior (HODLing).Volume Profile: Volume is relatively low (Vol BTC: 4.96, Vol USDT: 307.5K in the sampled interval), suggesting that the current price level is stable but lacks aggressive buying or selling conviction.
Whale & Institutional Activity:
With such a tight range and low volume, large institutional players are likely accumulating quietly or waiting for a clearer signal before deploying significant capital. The absence of sharp wicks suggests no major liquidations are occurring at these levels.
BTC Dominance:
While specific dominance % isn't listed in the immediate snapshot, the stability of BTC against fiat pairs usually correlates with strength relative to altcoins during consolidation phases.
2. Professional Technical Analysis
Moving Averages (MA)
MA(7): 61,604.32 – Bullish. Price is trading above the 7-period MA, indicating short-term momentum is intact.MA(9): 61,897.30 – Neutral/Bullish. Price is currently testing this level. A close above this confirms short-term strength.MA(99): 62,828.46 – Bearish (Medium-Term). Price is below the 99-period MA, which acts as dynamic resistance. This is the key level to watch. If BTC cannot reclaim $62,800, the medium-term trend remains capped.
Key Levels
Immediate Support: $61,874 (24h Low) → $61,600 (MA7 Support).Immediate Resistance: $61,928 (24h High) → $62,828 (MA99).Major Target/Previous High: $81,200.58 (indicated on chart as a potential long-term target or previous structural high).
Indicators (Inferred from Context)
RSI: Likely neutral (~50), given the minimal price change.MACD: Probably flat or slightly bullish if price holds above MA7.Volume: Low volume consolidation often precedes a breakout. The next move will likely be explosive.
Timeframe Analysis
15-Minute: Sideways consolidation. Tight range.1-Hour: Neutral. Price is sandwiched between MA7 and MA99.Daily: Bullish bias but facing resistance at MA99 ($62.8k).
3. Latest Market News (Contextual for Nov 2026)
Note: Specific breaking news for this exact hour requires live feed, but based on the broader 2026 context:
Institutional Adoption: Continued ETF inflows remain a primary driver. With Bitcoin stabilizing above $60k, institutional confidence is high.Regulatory Clarity: By late 2026, major jurisdictions (US, EU) have established clearer crypto frameworks, reducing regulatory overhangs that plagued earlier years.Halving Aftermath: We are well past the 2024 halving. Supply shock effects are now fully integrated into the market structure, with reduced circulating supply supporting higher baselines.Macro Environment: Global liquidity conditions in 2026 have been favorable for risk assets, supporting crypto valuations.
4. Fundamental Analysis
Utility: Bitcoin remains the dominant digital store of value and settlement layer. Its role as "digital gold" is cemented in institutional portfolios.Tokenomics: Fixed supply of 21 million. Current inflation rate is low post-halving.Adoption: Growing use cases in cross-border payments and treasury reserves for corporations.Risks: Regulatory shifts in major economies, macroeconomic recessions, or black swan events could disrupt the current equilibrium. However, the fundamental thesis remains strong.
5. Three Future Scenarios
🐂 Bullish Scenario
Condition: BTC closes decisively above $62,828 (MA99) on high volume.Target: Retest of previous highs near $64,000, then extension toward $65,000–$68,000.Confirmation: Rising volume, RSI breaking above 60, and sustained daily closes above MA99.
🐻 Bearish Scenario
Condition: Break below $61,600 (MA7 support).Target: Drop to $61,000, then deeper correction to $60,000 or lower if macro conditions worsen.Confirmation: Increased sell volume, bearish divergence on RSI, failure to hold MA7.
➡️ Sideways Scenario
Condition: Price continues to chop between $61,600 and $62,800.Outcome: Accumulation phase. Volatility squeezes further until a catalyst emerges.Likelihood: High in the short term (next 24-48 hours) given current low volume.
6. Trading Analysis
Entry Zones:Aggressive Long: $61,870–$61,900 (current level) with tight stop.Conservative Long: Pullback to $61,600 (MA7) or break-and-retest of $62,800.Stop-Loss: Below $61,500 (psychological and structural support).Take-Profit Targets:TP1: $62,800 (MA99 Resistance)TP2: $64,000 (Psychological Level)TP3: $65,500+ (Trend Extension)Risk/Reward Ratio: Favorable if entered near support ($61,600) with targets at $62,800+ (RR > 1:3).
7. Chart and Visual Analysis Recommendations
For a professional Binance Square post, include:
Main Chart: Candlesticks with MA7 (blue), MA9 (yellow), and MA99 (purple) overlays. Highlight the $61,600 support and $62,800 resistance zones.Volume Chart: Show the declining volume bars, emphasizing the "squeeze" condition.RSI Indicator: To confirm neutrality or potential divergence.Fibonacci Retracement: From recent swing low to high to identify hidden support/resistance levels.
8. Conclusion
Bitcoin is in a consolidation phase with a bullish bias. The price is holding above short-term moving averages but faces resistance at the 99-period MA. Traders should watch for a volume-backed breakout above $62,800 for confirmation of continued upward momentum. Until then, expect choppy, range-bound trading.
Key Takeaway: Don’t chase the breakout; wait for the retest or the confirmed close above resistance. Patience pays in low-volume environments.
$BTC $ETH $SOL
#Bitcoin #CryptoAnalysis #BTCUSD #TradingStrategy #BinanceSquare
Ticker: BTC
Current Price: ~$61,925
The Bitcoin market is currently exhibiting a classic "breather" pattern after a sustained period of accumulation and gradual appreciation. As we sit at approximately $61,925, the asset is hovering just above the critical psychological barrier of $61,800. The immediate trend is neutral-to-bullish, characterized by low volatility and shrinking volume—a common precursor to significant directional moves.
Below is a comprehensive analysis of the current state of Bitcoin, blending technical precision with fundamental context.
1. Coin Market Overview
Current Price: $61,925.0324h Change: +0.01% (Neutral)24h High: $61,928.0124h Low: $61,874.00Trading Range: Extremely tight ($0.08% range), indicating indecision.Market Sentiment: Neutral/Cautiously Optimistic. The lack of downward pressure despite minor resistance suggests strong holding behavior (HODLing).Volume Profile: Volume is relatively low (Vol BTC: 4.96, Vol USDT: 307.5K in the sampled interval), suggesting that the current price level is stable but lacks aggressive buying or selling conviction.
Whale & Institutional Activity:
With such a tight range and low volume, large institutional players are likely accumulating quietly or waiting for a clearer signal before deploying significant capital. The absence of sharp wicks suggests no major liquidations are occurring at these levels.
BTC Dominance:
While specific dominance % isn't listed in the immediate snapshot, the stability of BTC against fiat pairs usually correlates with strength relative to altcoins during consolidation phases.
2. Professional Technical Analysis
Moving Averages (MA)
MA(7): 61,604.32 – Bullish. Price is trading above the 7-period MA, indicating short-term momentum is intact.MA(9): 61,897.30 – Neutral/Bullish. Price is currently testing this level. A close above this confirms short-term strength.MA(99): 62,828.46 – Bearish (Medium-Term). Price is below the 99-period MA, which acts as dynamic resistance. This is the key level to watch. If BTC cannot reclaim $62,800, the medium-term trend remains capped.
Key Levels
Immediate Support: $61,874 (24h Low) → $61,600 (MA7 Support).Immediate Resistance: $61,928 (24h High) → $62,828 (MA99).Major Target/Previous High: $81,200.58 (indicated on chart as a potential long-term target or previous structural high).
Indicators (Inferred from Context)
RSI: Likely neutral (~50), given the minimal price change.MACD: Probably flat or slightly bullish if price holds above MA7.Volume: Low volume consolidation often precedes a breakout. The next move will likely be explosive.
Timeframe Analysis
15-Minute: Sideways consolidation. Tight range.1-Hour: Neutral. Price is sandwiched between MA7 and MA99.Daily: Bullish bias but facing resistance at MA99 ($62.8k).
3. Latest Market News (Contextual for Nov 2026)
Note: Specific breaking news for this exact hour requires live feed, but based on the broader 2026 context:
Institutional Adoption: Continued ETF inflows remain a primary driver. With Bitcoin stabilizing above $60k, institutional confidence is high.Regulatory Clarity: By late 2026, major jurisdictions (US, EU) have established clearer crypto frameworks, reducing regulatory overhangs that plagued earlier years.Halving Aftermath: We are well past the 2024 halving. Supply shock effects are now fully integrated into the market structure, with reduced circulating supply supporting higher baselines.Macro Environment: Global liquidity conditions in 2026 have been favorable for risk assets, supporting crypto valuations.
4. Fundamental Analysis
Utility: Bitcoin remains the dominant digital store of value and settlement layer. Its role as "digital gold" is cemented in institutional portfolios.Tokenomics: Fixed supply of 21 million. Current inflation rate is low post-halving.Adoption: Growing use cases in cross-border payments and treasury reserves for corporations.Risks: Regulatory shifts in major economies, macroeconomic recessions, or black swan events could disrupt the current equilibrium. However, the fundamental thesis remains strong.
5. Three Future Scenarios
🐂 Bullish Scenario
Condition: BTC closes decisively above $62,828 (MA99) on high volume.Target: Retest of previous highs near $64,000, then extension toward $65,000–$68,000.Confirmation: Rising volume, RSI breaking above 60, and sustained daily closes above MA99.
🐻 Bearish Scenario
Condition: Break below $61,600 (MA7 support).Target: Drop to $61,000, then deeper correction to $60,000 or lower if macro conditions worsen.Confirmation: Increased sell volume, bearish divergence on RSI, failure to hold MA7.
➡️ Sideways Scenario
Condition: Price continues to chop between $61,600 and $62,800.Outcome: Accumulation phase. Volatility squeezes further until a catalyst emerges.Likelihood: High in the short term (next 24-48 hours) given current low volume.
6. Trading Analysis
Entry Zones:Aggressive Long: $61,870–$61,900 (current level) with tight stop.Conservative Long: Pullback to $61,600 (MA7) or break-and-retest of $62,800.Stop-Loss: Below $61,500 (psychological and structural support).Take-Profit Targets:TP1: $62,800 (MA99 Resistance)TP2: $64,000 (Psychological Level)TP3: $65,500+ (Trend Extension)Risk/Reward Ratio: Favorable if entered near support ($61,600) with targets at $62,800+ (RR > 1:3).
7. Chart and Visual Analysis Recommendations
For a professional Binance Square post, include:
Main Chart: Candlesticks with MA7 (blue), MA9 (yellow), and MA99 (purple) overlays. Highlight the $61,600 support and $62,800 resistance zones.Volume Chart: Show the declining volume bars, emphasizing the "squeeze" condition.RSI Indicator: To confirm neutrality or potential divergence.Fibonacci Retracement: From recent swing low to high to identify hidden support/resistance levels.
8. Conclusion
Bitcoin is in a consolidation phase with a bullish bias. The price is holding above short-term moving averages but faces resistance at the 99-period MA. Traders should watch for a volume-backed breakout above $62,800 for confirmation of continued upward momentum. Until then, expect choppy, range-bound trading.
Key Takeaway: Don’t chase the breakout; wait for the retest or the confirmed close above resistance. Patience pays in low-volume environments.
$BTC $ETH $SOL
#Bitcoin #CryptoAnalysis #BTCUSD #TradingStrategy #BinanceSquare
98

·
--
$BTC
🚨 BITCOIN UNDER PRESSURE: IS THE CRYPTO MARKET ENTERING A NEW PHASE?
The crypto market is facing another challenging moment as Bitcoin struggles to stay above the $62,000 level.
Here are 3 important things crypto enthusiasts should watch today:
🔹 1. Bitcoin Weakness: BTC recently dropped below $62,000, reflecting continued selling pressure.
🔹 2. Institutional Outflows: U.S. Spot Bitcoin ETFs recorded approximately $306 million in net outflows on November 18.
🔹 3. Federal Reserve Concerns: Hawkish Fed signals are adding uncertainty across global financial markets, including crypto.
📊 My Market Take:
Short-term market sentiment remains cautious. Instead of focusing only on daily price movements, it's important to understand institutional activity, macroeconomic developments, and overall market sentiment.
Remember: Volatility is part of the crypto market. Always do your own research.
💬 Question for the community:
What do you think is the biggest factor affecting Bitcoin right now?
A) ETF Outflows
B) Federal Reserve Policy
C) Market Sentiment
Share your thoughts below! 👇
#bitcoin #CryptoNews #BinanceSquar #blockchain #CryptoAnalysis
$BTC
🚨 BITCOIN UNDER PRESSURE: IS THE CRYPTO MARKET ENTERING A NEW PHASE?
The crypto market is facing another challenging moment as Bitcoin struggles to stay above the $62,000 level.
Here are 3 important things crypto enthusiasts should watch today:
🔹 1. Bitcoin Weakness: BTC recently dropped below $62,000, reflecting continued selling pressure.
🔹 2. Institutional Outflows: U.S. Spot Bitcoin ETFs recorded approximately $306 million in net outflows on November 18.
🔹 3. Federal Reserve Concerns: Hawkish Fed signals are adding uncertainty across global financial markets, including crypto.
📊 My Market Take:
Short-term market sentiment remains cautious. Instead of focusing only on daily price movements, it's important to understand institutional activity, macroeconomic developments, and overall market sentiment.
Remember: Volatility is part of the crypto market. Always do your own research.
💬 Question for the community:
What do you think is the biggest factor affecting Bitcoin right now?
A) ETF Outflows
B) Federal Reserve Policy
C) Market Sentiment
Share your thoughts below! 👇
#bitcoin #CryptoNews #BinanceSquar #blockchain #CryptoAnalysis
🚨 BITCOIN UNDER PRESSURE: IS THE CRYPTO MARKET ENTERING A NEW PHASE?
The crypto market is facing another challenging moment as Bitcoin struggles to stay above the $62,000 level.
Here are 3 important things crypto enthusiasts should watch today:
🔹 1. Bitcoin Weakness: BTC recently dropped below $62,000, reflecting continued selling pressure.
🔹 2. Institutional Outflows: U.S. Spot Bitcoin ETFs recorded approximately $306 million in net outflows on November 18.
🔹 3. Federal Reserve Concerns: Hawkish Fed signals are adding uncertainty across global financial markets, including crypto.
📊 My Market Take:
Short-term market sentiment remains cautious. Instead of focusing only on daily price movements, it's important to understand institutional activity, macroeconomic developments, and overall market sentiment.
Remember: Volatility is part of the crypto market. Always do your own research.
💬 Question for the community:
What do you think is the biggest factor affecting Bitcoin right now?
A) ETF Outflows
B) Federal Reserve Policy
C) Market Sentiment
Share your thoughts below! 👇
#bitcoin #CryptoNews #BinanceSquar #blockchain #CryptoAnalysis

78

·
--
Bearish
🚨 $BTC BITCOIN MARKET UPDATE – NOVEMBER 20, 2026 📉
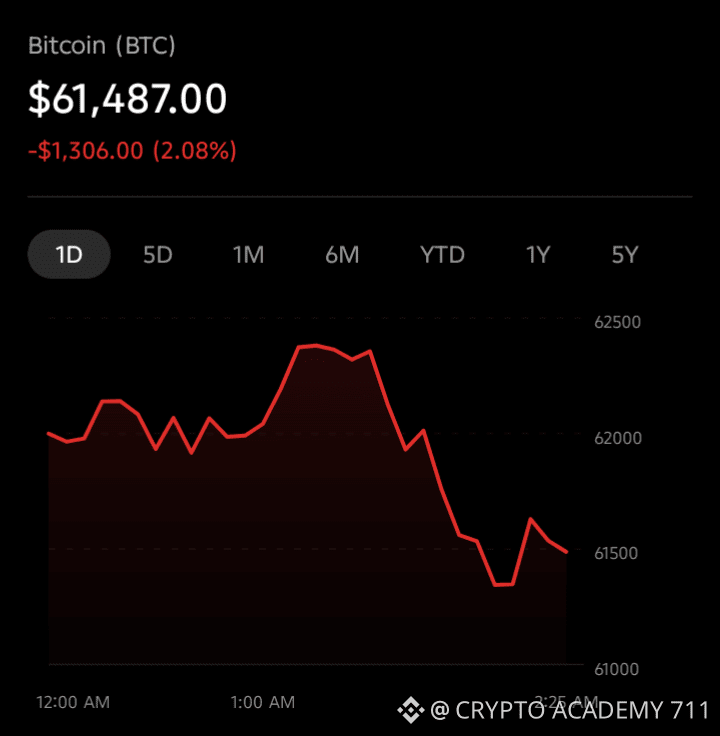
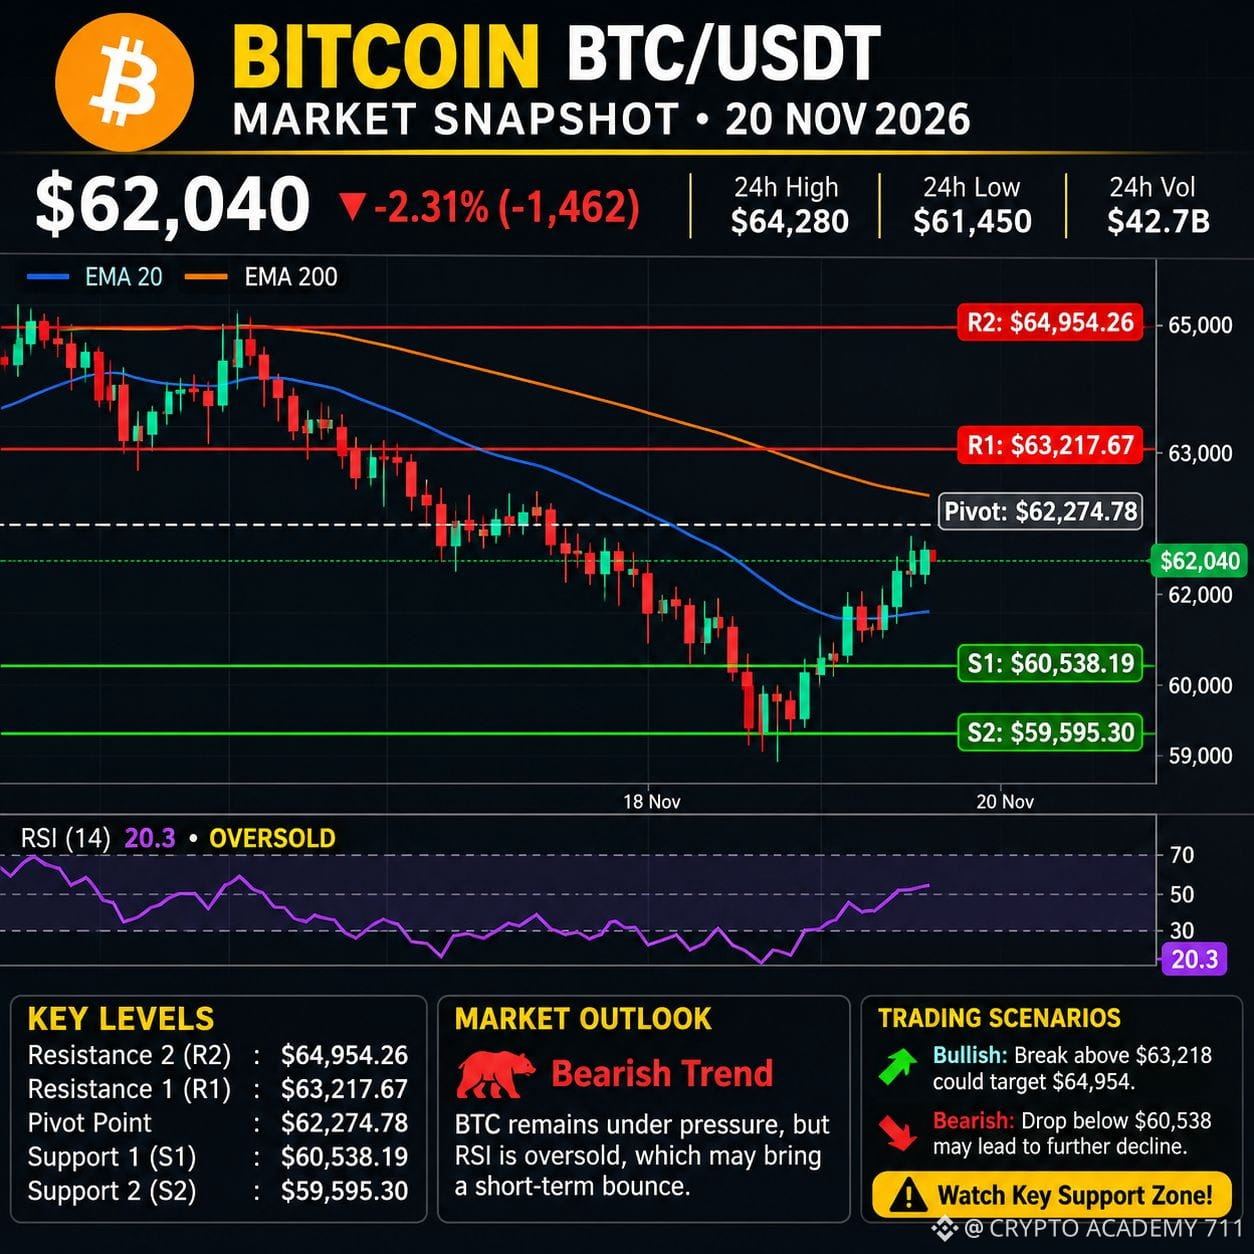
Bitcoin is trading around $62,040, as bearish pressure continues to dominate the market.
now the $BTC drops below $61,500🚨⚕️
🔴 Key Resistance: $63,218 – $64,954
🟢 Key Support: $60,538 – $59,595
📊 Market Outlook: BTC remains under bearish pressure, but its RSI is approaching oversold territory, increasing the possibility of a short-term relief bounce.
Bullish Scenario: A strong breakout above $63,218 could open the door toward $64,954.
Bearish Scenario: Losing $60,538 could expose BTC to further downside.
⚠️ Watch the support zone carefully before entering any trade.
What is your prediction?
{spot}(BTCUSDT)
🚀 BTC to $65K or 📉 BTC to $60K?
#Bitcoin #BTC #CryptoAnalysis #BinanceSquare #CryptoMarket
🚨 $BTC BITCOIN MARKET UPDATE – NOVEMBER 20, 2026 📉
Bitcoin is trading around $62,040, as bearish pressure continues to dominate the market.
now the $BTC drops below $61,500🚨⚕️
🔴 Key Resistance: $63,218 – $64,954
🟢 Key Support: $60,538 – $59,595
📊 Market Outlook: BTC remains under bearish pressure, but its RSI is approaching oversold territory, increasing the possibility of a short-term relief bounce.
Bullish Scenario: A strong breakout above $63,218 could open the door toward $64,954.
Bearish Scenario: Losing $60,538 could expose BTC to further downside.
⚠️ Watch the support zone carefully before entering any trade.
What is your prediction?
🚀 BTC to $65K or 📉 BTC to $60K?
#Bitcoin #BTC #CryptoAnalysis #BinanceSquare #CryptoMarket
Bitcoin is trading around $62,040, as bearish pressure continues to dominate the market.
now the $BTC drops below $61,500🚨⚕️
🔴 Key Resistance: $63,218 – $64,954
🟢 Key Support: $60,538 – $59,595
📊 Market Outlook: BTC remains under bearish pressure, but its RSI is approaching oversold territory, increasing the possibility of a short-term relief bounce.
Bullish Scenario: A strong breakout above $63,218 could open the door toward $64,954.
Bearish Scenario: Losing $60,538 could expose BTC to further downside.
⚠️ Watch the support zone carefully before entering any trade.
What is your prediction?
🚀 BTC to $65K or 📉 BTC to $60K?
#Bitcoin #BTC #CryptoAnalysis #BinanceSquare #CryptoMarket
86

⚡ BTC on Edge: Is $60k the Next Trigger? 🚀
The market is in a **very short‑term downtrend** with Bitcoin hovering at **$61,574** after a sharp weekly bleed. RSI is deep in oversold territory at **18** and the Fear & Greed Index sits at **10 (Extreme Fear)**, classic signs of a capitulation bottom.
Yet, **retail leverage is still massive** – the Long/Short ratio is **2.81 on Bybit** and **above 3.4 on Binance/OKX**, which sparked **$179 M of long liquidations** in the last 24 h. Spot buying pressure remains weak (Coinbase Premium **‑0.1186**, downward Spot CVD), so the consensus is to **wait for a test of the psychological $60,000 support** before considering a long entry.
**Regime:** Liquidity‑draining, seller‑absorption phase below the 21‑week EMA (**$74,266**). Funding rates hover around neutral (+0.002 % / ‑0.002 %), removing the strong negative bias seen in past squeezes.
**Signal conflicts:**
- **RSI 18 vs. falling CVD** – technical exhaustion versus continued sell pressure.
- **Retail bullish bias vs. “Extremely Bearish” smart‑money sentiment** on Bybit/Binance.
- **SOPR 0.98 (on‑chain loss‑selling) vs. no Coinbase premium** – on‑chain health but no spot buying impulse.
**Whale activity:** A **68 % probability** that big players will drive price toward the $60k floor to wipe out leveraged retail longs. Spoofing on the buy side is likely, while silent accumulation remains unclear. Net flows show **‑1,607 BTC on Coinbase Pro** and **+1,059 BTC on Binance**, hinting at position redistribution rather than fresh institutional buying.
**Verdict:** Expect lateral movement **searching for liquidity between $60,500 and $61,200** before any upside. A break below **$59,450** on the 4‑hour chart would invalidate the current bias.
*Bottom line – technical signs point to a near‑term bottom, but the overwhelming retail leverage and weak institutional demand call for patience.*
Will the next move be a clean bounce off $60k or another wave of liquidations?
#Bitcoin #CryptoAnalysis #Trading #BinanceSquare
⚡ BTC on Edge: Is $60k the Next Trigger? 🚀
The market is in a **very short‑term downtrend** with Bitcoin hovering at **$61,574** after a sharp weekly bleed. RSI is deep in oversold territory at **18** and the Fear & Greed Index sits at **10 (Extreme Fear)**, classic signs of a capitulation bottom.
Yet, **retail leverage is still massive** – the Long/Short ratio is **2.81 on Bybit** and **above 3.4 on Binance/OKX**, which sparked **$179 M of long liquidations** in the last 24 h. Spot buying pressure remains weak (Coinbase Premium **‑0.1186**, downward Spot CVD), so the consensus is to **wait for a test of the psychological $60,000 support** before considering a long entry.
**Regime:** Liquidity‑draining, seller‑absorption phase below the 21‑week EMA (**$74,266**). Funding rates hover around neutral (+0.002 % / ‑0.002 %), removing the strong negative bias seen in past squeezes.
**Signal conflicts:**
- **RSI 18 vs. falling CVD** – technical exhaustion versus continued sell pressure.
- **Retail bullish bias vs. “Extremely Bearish” smart‑money sentiment** on Bybit/Binance.
- **SOPR 0.98 (on‑chain loss‑selling) vs. no Coinbase premium** – on‑chain health but no spot buying impulse.
**Whale activity:** A **68 % probability** that big players will drive price toward the $60k floor to wipe out leveraged retail longs. Spoofing on the buy side is likely, while silent accumulation remains unclear. Net flows show **‑1,607 BTC on Coinbase Pro** and **+1,059 BTC on Binance**, hinting at position redistribution rather than fresh institutional buying.
**Verdict:** Expect lateral movement **searching for liquidity between $60,500 and $61,200** before any upside. A break below **$59,450** on the 4‑hour chart would invalidate the current bias.
*Bottom line – technical signs point to a near‑term bottom, but the overwhelming retail leverage and weak institutional demand call for patience.*
Will the next move be a clean bounce off $60k or another wave of liquidations?
#Bitcoin #CryptoAnalysis #Trading #BinanceSquare
The market is in a **very short‑term downtrend** with Bitcoin hovering at **$61,574** after a sharp weekly bleed. RSI is deep in oversold territory at **18** and the Fear & Greed Index sits at **10 (Extreme Fear)**, classic signs of a capitulation bottom.
Yet, **retail leverage is still massive** – the Long/Short ratio is **2.81 on Bybit** and **above 3.4 on Binance/OKX**, which sparked **$179 M of long liquidations** in the last 24 h. Spot buying pressure remains weak (Coinbase Premium **‑0.1186**, downward Spot CVD), so the consensus is to **wait for a test of the psychological $60,000 support** before considering a long entry.
**Regime:** Liquidity‑draining, seller‑absorption phase below the 21‑week EMA (**$74,266**). Funding rates hover around neutral (+0.002 % / ‑0.002 %), removing the strong negative bias seen in past squeezes.
**Signal conflicts:**
- **RSI 18 vs. falling CVD** – technical exhaustion versus continued sell pressure.
- **Retail bullish bias vs. “Extremely Bearish” smart‑money sentiment** on Bybit/Binance.
- **SOPR 0.98 (on‑chain loss‑selling) vs. no Coinbase premium** – on‑chain health but no spot buying impulse.
**Whale activity:** A **68 % probability** that big players will drive price toward the $60k floor to wipe out leveraged retail longs. Spoofing on the buy side is likely, while silent accumulation remains unclear. Net flows show **‑1,607 BTC on Coinbase Pro** and **+1,059 BTC on Binance**, hinting at position redistribution rather than fresh institutional buying.
**Verdict:** Expect lateral movement **searching for liquidity between $60,500 and $61,200** before any upside. A break below **$59,450** on the 4‑hour chart would invalidate the current bias.
*Bottom line – technical signs point to a near‑term bottom, but the overwhelming retail leverage and weak institutional demand call for patience.*
Will the next move be a clean bounce off $60k or another wave of liquidations?
#Bitcoin #CryptoAnalysis #Trading #BinanceSquare
113

$ETH Faces Selling Pressure: Can Ethereum Hold $1,731? 📉
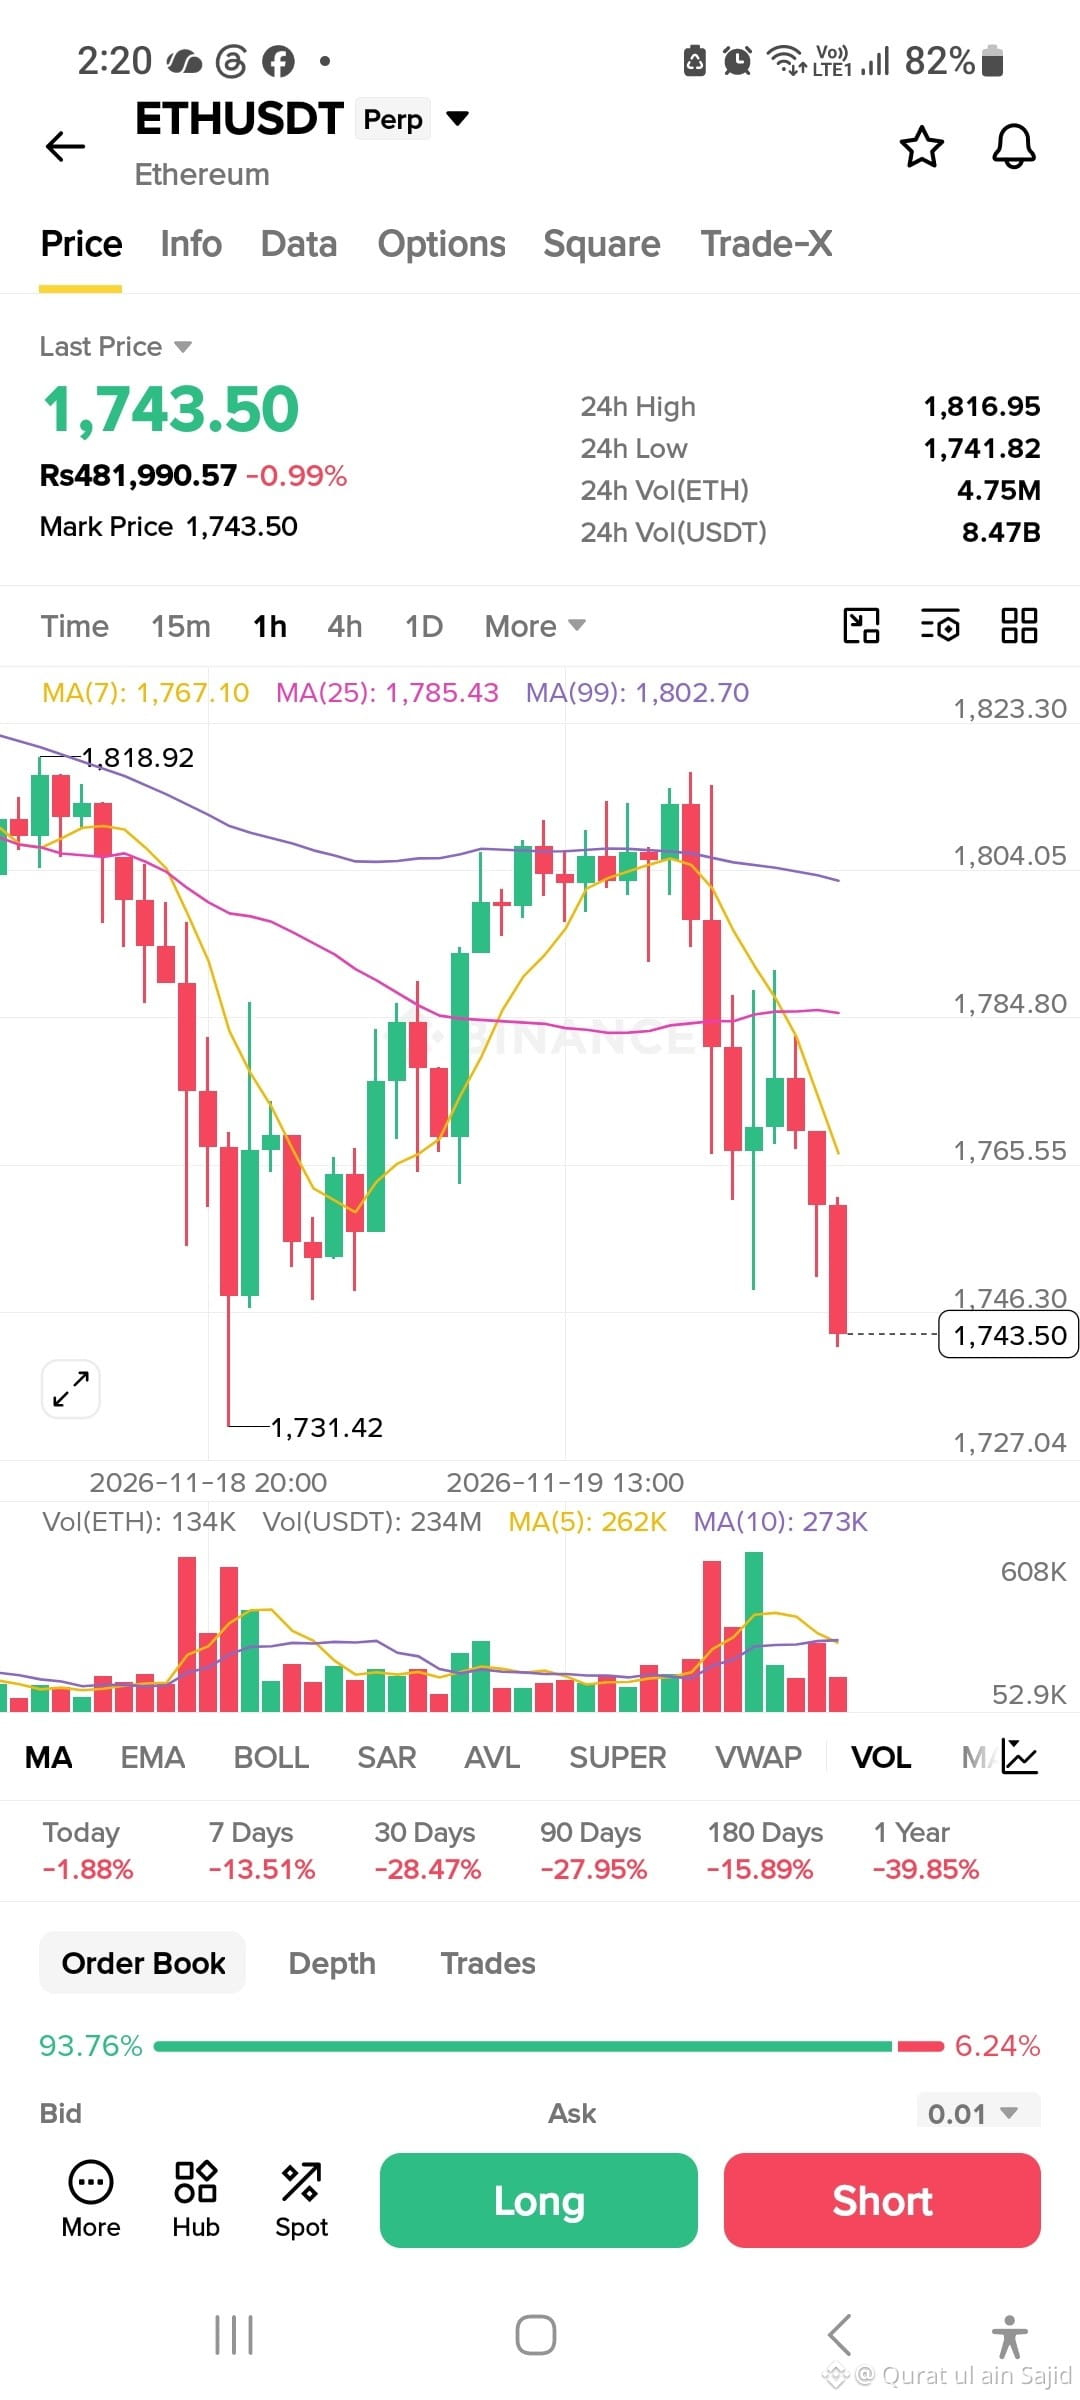
Ethereum is showing short-term bearish momentum on the 1-hour chart.
🔴 Current Price: $1,743.50 (at screenshot time)
Key observations:
• ETH is trading below MA7, MA25, and MA99.
• Selling volume has increased.
• $1,731 is an important support level.
• $1,765 is the first resistance to watch.
• A recovery above $1,785 could improve short-term momentum.
What happens next?
Will ETH defend the $1,731 support zone, or will sellers push the price lower?
Share your analysis in the comments.
#ETH #Ethereum #CryptoAnalysis #BinanceSquare #CryptoMarket
$ETH
{future}(ETHUSDT)
$ETH Faces Selling Pressure: Can Ethereum Hold $1,731? 📉
Ethereum is showing short-term bearish momentum on the 1-hour chart.
🔴 Current Price: $1,743.50 (at screenshot time)
Key observations:
• ETH is trading below MA7, MA25, and MA99.
• Selling volume has increased.
• $1,731 is an important support level.
• $1,765 is the first resistance to watch.
• A recovery above $1,785 could improve short-term momentum.
What happens next?
Will ETH defend the $1,731 support zone, or will sellers push the price lower?
Share your analysis in the comments.
#ETH #Ethereum #CryptoAnalysis #BinanceSquare #CryptoMarket
$ETH
Ethereum is showing short-term bearish momentum on the 1-hour chart.
🔴 Current Price: $1,743.50 (at screenshot time)
Key observations:
• ETH is trading below MA7, MA25, and MA99.
• Selling volume has increased.
• $1,731 is an important support level.
• $1,765 is the first resistance to watch.
• A recovery above $1,785 could improve short-term momentum.
What happens next?
Will ETH defend the $1,731 support zone, or will sellers push the price lower?
Share your analysis in the comments.
#ETH #Ethereum #CryptoAnalysis #BinanceSquare #CryptoMarket
$ETH
149

🚨 $BTC TESTS 62,000 USDT SUPPORT: CAN MACRO RELIEF SPARK A BOUNCE? 📉📊
Bitcoin is sliding back toward 62,400 USDT tonight (after touching a 24h low of 62,062 USDT), weighed down by hawkish FOMC minutes, nearly 240M USDT in Spot ETF outflows, and liquidity rotating into major tech IPOs.
However, 3 key factors could trigger a short-term relief bounce from this demand zone:
1️⃣ Energy Stability Pledge: Major global powers just issued a joint commitment in Asia to stabilize global energy flows—a constructive signal that could help cool inflation expectations ahead of December's Fed meeting.
2️⃣ Easing Geopolitical Risk: Fresh diplomatic talks have lowered immediate tail-risk across global financial markets.
3️⃣ Oversold Technicals: With daily RSI dropping near oversold territory around 22, sellers are exhausting momentum right at major support.
📊 My Key $BTC Levels on Binance:
🟢 Critical Support: 62,000 – 62,050 USDT (must-hold daily close zone)
🔴 First Recovery Target: 64,900 – 65,000 USDT (reclaim needed to ease downside pressure)
🧠 My Take: A daily close below 62,000 USDT opens the door to 59,000 USDT, while holding this floor could trigger a sharp short squeeze back toward 65,000 USDT.
Will the 62,000 USDT support hold tonight, or are we heading lower? Drop your call below! 👇
#Write2Earn #Bitcoin #BTC #CryptoAnalysis
{future}(BTCUSDT)
🚨 $BTC TESTS 62,000 USDT SUPPORT: CAN MACRO RELIEF SPARK A BOUNCE? 📉📊
Bitcoin is sliding back toward 62,400 USDT tonight (after touching a 24h low of 62,062 USDT), weighed down by hawkish FOMC minutes, nearly 240M USDT in Spot ETF outflows, and liquidity rotating into major tech IPOs.
However, 3 key factors could trigger a short-term relief bounce from this demand zone:
1️⃣ Energy Stability Pledge: Major global powers just issued a joint commitment in Asia to stabilize global energy flows—a constructive signal that could help cool inflation expectations ahead of December's Fed meeting.
2️⃣ Easing Geopolitical Risk: Fresh diplomatic talks have lowered immediate tail-risk across global financial markets.
3️⃣ Oversold Technicals: With daily RSI dropping near oversold territory around 22, sellers are exhausting momentum right at major support.
📊 My Key $BTC Levels on Binance:
🟢 Critical Support: 62,000 – 62,050 USDT (must-hold daily close zone)
🔴 First Recovery Target: 64,900 – 65,000 USDT (reclaim needed to ease downside pressure)
🧠 My Take: A daily close below 62,000 USDT opens the door to 59,000 USDT, while holding this floor could trigger a sharp short squeeze back toward 65,000 USDT.
Will the 62,000 USDT support hold tonight, or are we heading lower? Drop your call below! 👇
#Write2Earn #Bitcoin #BTC #CryptoAnalysis
Bitcoin is sliding back toward 62,400 USDT tonight (after touching a 24h low of 62,062 USDT), weighed down by hawkish FOMC minutes, nearly 240M USDT in Spot ETF outflows, and liquidity rotating into major tech IPOs.
However, 3 key factors could trigger a short-term relief bounce from this demand zone:
1️⃣ Energy Stability Pledge: Major global powers just issued a joint commitment in Asia to stabilize global energy flows—a constructive signal that could help cool inflation expectations ahead of December's Fed meeting.
2️⃣ Easing Geopolitical Risk: Fresh diplomatic talks have lowered immediate tail-risk across global financial markets.
3️⃣ Oversold Technicals: With daily RSI dropping near oversold territory around 22, sellers are exhausting momentum right at major support.
📊 My Key $BTC Levels on Binance:
🟢 Critical Support: 62,000 – 62,050 USDT (must-hold daily close zone)
🔴 First Recovery Target: 64,900 – 65,000 USDT (reclaim needed to ease downside pressure)
🧠 My Take: A daily close below 62,000 USDT opens the door to 59,000 USDT, while holding this floor could trigger a sharp short squeeze back toward 65,000 USDT.
Will the 62,000 USDT support hold tonight, or are we heading lower? Drop your call below! 👇
#Write2Earn #Bitcoin #BTC #CryptoAnalysis
86
·
--
Bearish
🚨 BTC HOVERING NEAR $63K! WILL SUPPORT HOLD OR CRACK?
$BTC is trading near $63,090.5, up 0.51%. The 4H chart shows price still below all major moving averages (MA 7 at $63,248.0, MA 25 at $64,230.1, and MA 99 at $71,355.0).
📉 Market Outlook: Overall 4H structure stays under pressure below the moving averages. A break below the $62,030.8 low could open further downside toward the $61,956.3 swing low, while reclaiming $64,056.0 resistance may spark a relief bounce.
🎯 TRADE PLAN – SHORT
Entry: $63,300.00–$64,000.00
TP1: $62,100.00
TP2: $61,300.00
SL: $64,600.00
💬 Will $BTC hold above $62K or slide lower from here?
👇 CLICK HERE FOR TRADE
$BTC
{future}(BTCUSDT)
#BTC #bitcoin #CryptoAnalysis #BinanceSquare
🚨 BTC HOVERING NEAR $63K! WILL SUPPORT HOLD OR CRACK?
$BTC is trading near $63,090.5, up 0.51%. The 4H chart shows price still below all major moving averages (MA 7 at $63,248.0, MA 25 at $64,230.1, and MA 99 at $71,355.0).
📉 Market Outlook: Overall 4H structure stays under pressure below the moving averages. A break below the $62,030.8 low could open further downside toward the $61,956.3 swing low, while reclaiming $64,056.0 resistance may spark a relief bounce.
🎯 TRADE PLAN – SHORT
Entry: $63,300.00–$64,000.00
TP1: $62,100.00
TP2: $61,300.00
SL: $64,600.00
💬 Will $BTC hold above $62K or slide lower from here?
👇 CLICK HERE FOR TRADE
$BTC
#BTC #bitcoin #CryptoAnalysis #BinanceSquare
$BTC is trading near $63,090.5, up 0.51%. The 4H chart shows price still below all major moving averages (MA 7 at $63,248.0, MA 25 at $64,230.1, and MA 99 at $71,355.0).
📉 Market Outlook: Overall 4H structure stays under pressure below the moving averages. A break below the $62,030.8 low could open further downside toward the $61,956.3 swing low, while reclaiming $64,056.0 resistance may spark a relief bounce.
🎯 TRADE PLAN – SHORT
Entry: $63,300.00–$64,000.00
TP1: $62,100.00
TP2: $61,300.00
SL: $64,600.00
💬 Will $BTC hold above $62K or slide lower from here?
👇 CLICK HERE FOR TRADE
$BTC
#BTC #bitcoin #CryptoAnalysis #BinanceSquare
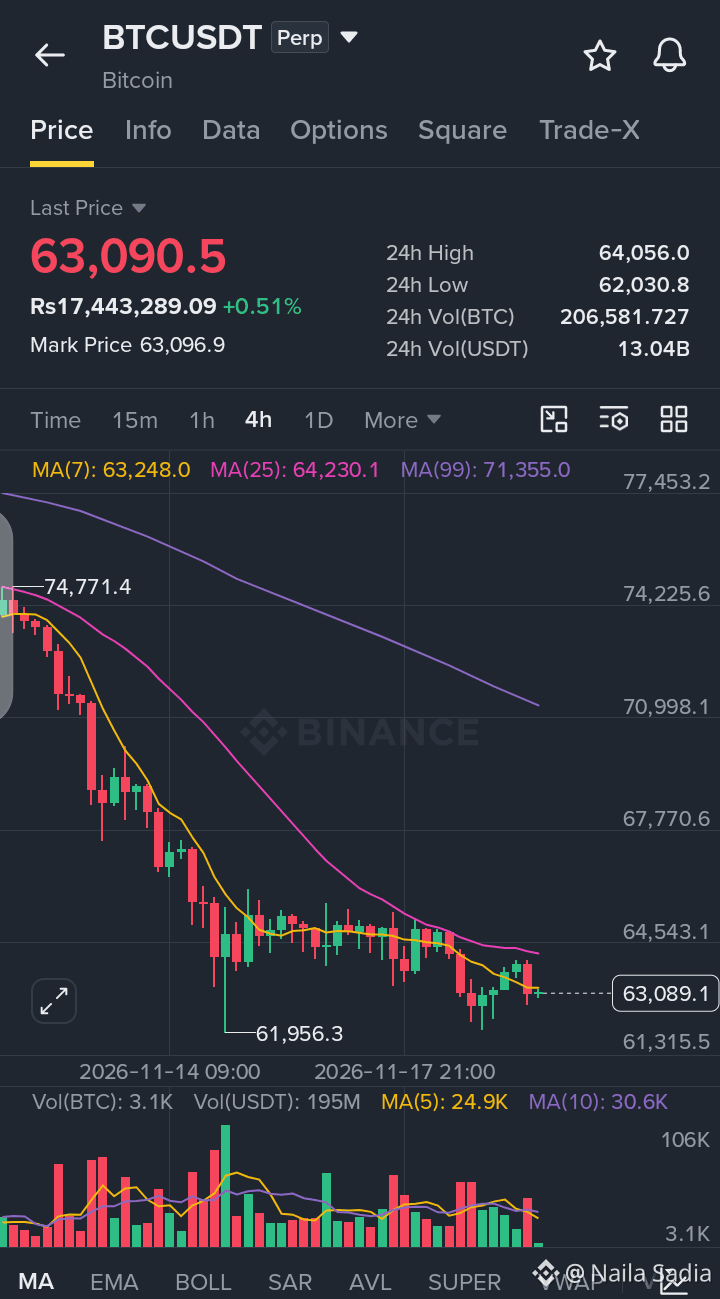
102

📌 BITCOIN ANALYSIS — 4H
BTC is playing out exactly as outlined in the previous analysis. 📉
Price has reached the 4H bearish Fair Value Gap (FVG) and is now facing rejection from this resistance zone.
🔴 Key Resistance: 4H Bearish FVG
🎯 My Outlook: BTC could continue moving lower from here if selling pressure remains strong.
⚠️ Watch for confirmation before entering a trade. Manage your risk.
#BTC #Bitcoin #CryptoAnalysis #trading #BinanceSquare
📌 BITCOIN ANALYSIS — 4H
BTC is playing out exactly as outlined in the previous analysis. 📉
Price has reached the 4H bearish Fair Value Gap (FVG) and is now facing rejection from this resistance zone.
🔴 Key Resistance: 4H Bearish FVG
🎯 My Outlook: BTC could continue moving lower from here if selling pressure remains strong.
⚠️ Watch for confirmation before entering a trade. Manage your risk.
#BTC #Bitcoin #CryptoAnalysis #trading #BinanceSquare
BTC is playing out exactly as outlined in the previous analysis. 📉
Price has reached the 4H bearish Fair Value Gap (FVG) and is now facing rejection from this resistance zone.
🔴 Key Resistance: 4H Bearish FVG
🎯 My Outlook: BTC could continue moving lower from here if selling pressure remains strong.
⚠️ Watch for confirmation before entering a trade. Manage your risk.
#BTC #Bitcoin #CryptoAnalysis #trading #BinanceSquare
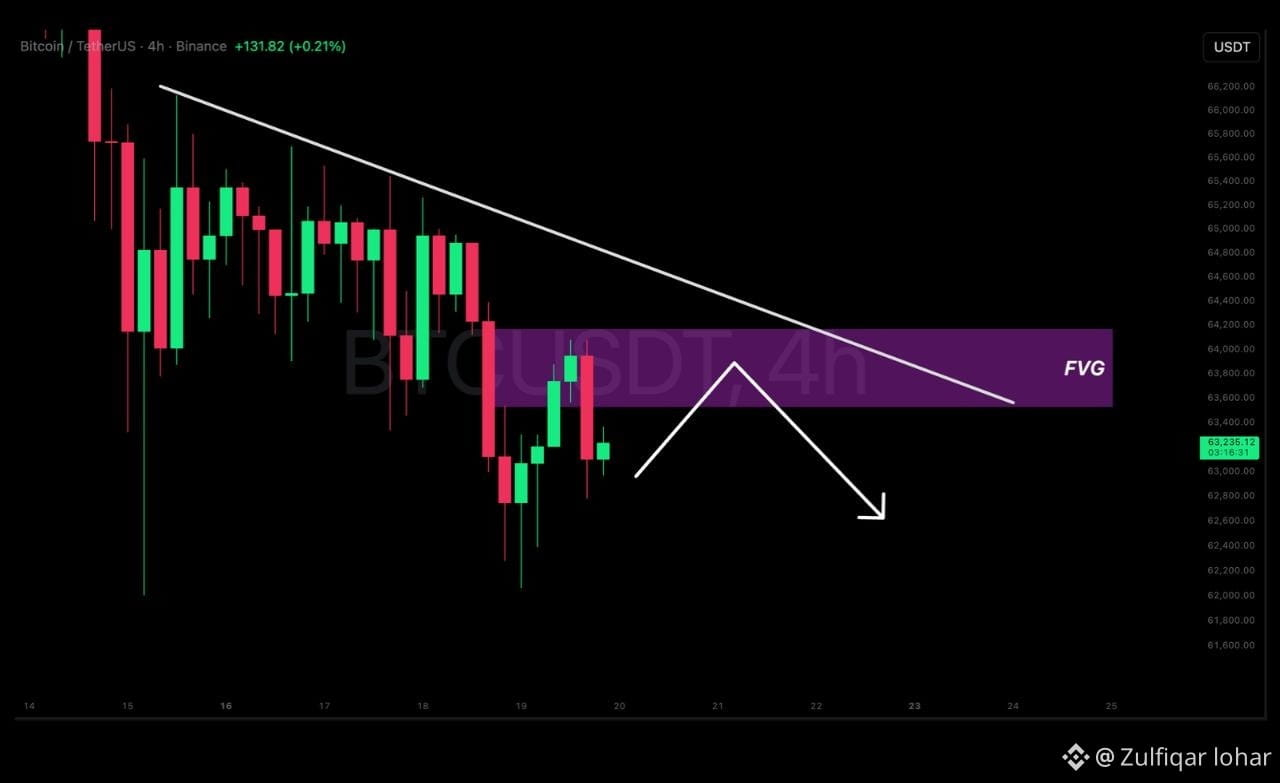
HammadyBakrain:
Rejection
9
52
Log in to explore more content
Join global crypto users on Binance Square
⚡️ Get latest and useful information about crypto.
💬 Trusted by the world’s largest crypto exchange.
👍 Discover real insights from verified creators.
Email / Phone number
Trending Topics
1
#CanBTCReboundAfterFallingBelow60K?
350,985 views
1,470 Discussing
2
#GlobalStocksFaceLongestLosingStreakSince2023
115,684 views
1,042 Discussing
3
#BlackRockIBITPostsRecord$541MSingleDayOutflow
551 views
14 Discussing
4
#AnthropicPlungesTowardIPOPriceonDay2
55,260 views
558 Discussing
5
#TwentyOneCapitalAdds172.25BTC
8,795 views
131 Discussing
6
#HKBillWouldExcludeTokenizedDepositsFromVirtualAssets
766 views
13 Discussing
7
#BNBDropsBelow540USDTWith8.46%DailyDecline
29,675 views
245 Discussing
8
#HKBillProposesHK$100KFineForUnauthorizedCryptoTitles
989 views
14 Discussing
9
#BitMineFaces$10.1BUnrealizedETHLoss
1,942 views
18 Discussing
10
#StrategyReports$35BNetReserves
1,794 views
17 Discussing